A 3D tailored monolithic glass chip for stimulating and recording zebrafish neuronal activity with a commercial light sheet microscope
 Dominika Schrödter1*
  Mohadeseh Mozafari1
  Janine Fichtner2
  Jakob William von Trotha2
  Reinhard Wolfgang Köster2
  Andreas Dietzel1*
- 1Faculty of Mechanical Engineering, Institute of Microtechnology (IMT), Technische Universität Braunschweig, Braunschweig, Germany
- 2Faculty of Life Sciences, Zoological Institute, Technische Universität Braunschweig, Braunschweig, Germany
Microfluidic technology is unrivaled in its ability to apply soluble chemical stimuli with high spatiotemporal precision. Analogous, light–sheet microscopy is unmatched in its ability of low phototoxic but fast volumetric in vivo imaging with single cell resolution. Due to their optical translucency during the larval stages, zebrafish (Danio rerio) are an ideal model to combine both techniques; yet, thus far this required light–sheet microscopes, which were in most cases custom–built and adapted to the available softlithographic chip technology. Our aim was to use a commercial light–sheet microscope to illuminate a microfluidic chip from two opposite lateral directions and to record images with the detection objective placed orthogonally above the chip. Deep tissue penetration can be achieved by superimposing beams from opposite directions to form a single light sheet. But a microfluidic chip that allows a) targeted stimulus application in a closed microenvironment, b) interference–free incoupling of excitation light from two directions and c) outcoupling of fluorescence in the perpendicular direction through an optically perfect cover glass was not known until now. Here, we present a monolithic glass chip with the required plane-parallel sidewalls and cover slide closure at the top, constructed by advanced femtosecond laser ablation, thermal bonding and surface smoothing processes. In addition, the 3D shape of a fish fixator unit was tailored to match the body shape of a zebrafish larva to ensure stable positioning during whole–brain recording. With hydrodynamic focusing a targeted partial exposure of the larva’s head to chemical stimuli and fast position switching (in less than 10 s) was possible. With the capabilities of this unique monolithic glass chip and its up–scalable wafer–level fabrication process, the new NeuroExaminer is prone to become an excellent addition to neurobiology laboratories already equipped with high–quality commercial light sheet microscopes.
1 Introduction
The zebrafish (Danio rerio) is an attractive vertebrate model for neuroscience research. With its unique attributes, including small size, rapid embryonic development and optical transparency during larval stages, the zebrafish is widely used for in vivo studies of neurological disorders. Its small size and translucency of the entire body enable non–invasive observation of neural circuit interactions throughout the entire brain (Stewart et al., 2014; Orger and de Polavieja, 2017; Loring et al., 2020). These properties make zebrafish a common animal model for various studies in developmental biology, (Ali et al., 2011; Wielhouwer et al., 2011; Liu et al., 2022), high throughput drug screening (Pardo-Martin et al., 2010; Lin et al., 2015; Rosa et al., 2022) and behavioral neuroscience (Symvoulidis et al., 2017; Han et al., 2021). The zebrafish is a vertebrate in which it is possible to image neuronal activity in vivo with cellular resolution at a temporal resolution of one entire brain per second (Ahrens et al., 2013; Bruzzone et al., 2021). The recent combination of genetically encoded calcium indicators (GECIs) in the small and translucent brains of zebrafish larvae with suitable imaging techniques offer the possibility to investigate cumulative neuronal activity of an entire vertebrate brain within seconds and to provide novel insights into its functions (Keller et al., 2008; Xi et al., 2011; Portugues et al., 2013; Ahrens and Engert, 2015).
However, for obtaining consistent and accurate results, immobilization of zebrafish in a desired position and orientation during high resolution imaging is crucial to avoid motion artefacts. Currently the mounting and positioning of zebrafish larva using agarose followed by immersion into a petri dish filled with liquid is a common procedure for light sheet microscopy. Such an approach, however, leads to a hardly predictable orientation of the larva with respect to all six degrees of freedom. It also requires time consuming and tedious manual adjustment with steel tweezers or plastic pipetting tips in agarose that can impose a stress and a risk factor to damage the fragile bodies of zebrafish larvae. In addition, the petri dish holds a large uncapped volume of liquid (∼5 mL) so that changes in chemical stimuli cannot be performed with steep spatiotemporal gradients and expensive chemicals have to be consumed in large amounts.
Microfluidic devices for embryonic and larval zebrafish studies have emerged as a powerful technology to overcome some of these drawbacks (Khalili and Rezai, 2019). Through non–invasive fluidic immobilization, zebrafish can be arrested in a desired orientation and water soluble chemical stimuli can be applied with high spatiotemporal precision in small amounts. Microfluidic devices are thus ideally suited for recording activity of the brain, while it is stimulated by various factors (Ahrens et al., 2013). With suitable design and fabrication, microfluidics could provide not only immobilization of larvae, (Lin et al., 2015), but also allow the real time study of brain activity stimulated by electrophysiological interactions as for instance through microelectrodes, (Hong et al., 2016; Steenbergen, 2018; Khalili et al., 2021), by controlled chemical exposure (Candelier et al., 2015; Nady et al., 2017) or by optical stimulation (Mani et al., 2018; Baillie et al., 2021). When combined with appropriate imaging techniques, microfluidics promises to be a powerful technology for non–invasive recording of brain activity under the influence of controllable physical and/or chemical stimuli.
There is a wide range of specialized fluorescence microscopes available (Fischer et al., 2011) and some were used with microdevices for imaging of zebrafish, such as two–photon microscopy (2PM), (Ahrens et al., 2012), confocal laser–scanning microscopy (CLSM) (Lin et al., 2015) and light–sheet fluorescence microscopy (LSFM). (Kaufmann et al., 2012; Albert-Smet et al., 2019; Mattern et al., 2020; Sy et al., 2023). In the context of whole brain imaging, two approaches have been discussed–CLSM and LSFM. Although CLSM is easier to combine with microfluidics, because only one objective lens is needed, LSFM offers decisive advantages in terms of speed and reduced phototoxicity as only a single plane of tissue is illuminated at a time. Therefore, combining light sheet microscopy with microfluidics, which is complicated by the fact that the optical axes of excitation and observation do not coincide, remains a very rewarding field of research. This approach, however requires advanced 3D microfabrication techniques. Most research groups have been working on microfluidic devices made from Polydimethylsiloxane (PDMS), in which zebrafish larvae can be trapped in and released from a microchannel with a defined orientation (Yang et al., 2016; Khalili et al., 2022; Loganathan et al., 2023). PDMS systems easy to fabricate by softlithography are widely used, but typical 2.5–D PDMS devices do not allow the chip to perfectly fit the 3D shape of zebrafish larvae and PDMS molding of real 3D structures would require more advanced master fabrication, which has to our knowledge not been shown in this context. Furthermore, they are not compatible with high end commercial light sheet fluorescence microscopes. Moreover, these devices have limitations such as relatively high auto–fluorescence. In addition, PDMS tends to absorb hydrophobic small molecules, that can significantly change or affect a chemical’s concentration and prevents the reuse of microfluidic chips for different compound stimulations (Toepke and Beebe, 2006; Wang et al., 2012). In comparison to PDMS, glass substrates offer a higher transparency and are devoid of auto–fluorescence. Moreover, chemical stability, reusability and biocompatibility of glass are superior relative to PDMS. But microfabrication of precise 3D structures on glass requires the development of sophisticated microstructuring methods.
We have recently reported a microfluidic device for whole–brain in vivo imaging (NeuroExaminer 1.0), that proved the principle of light sheet imaging within an all–glass microfluidic chip (Mattern et al., 2020). Although a basic functionality has been demonstrated, the imaging quality in the fully closed version remained in need of improvement. For example, the loading and immobilization of zebrafish was only reliably possible with manual pipetting and careful adjustments, a partial exposure of the larva’s head and rapid changes in the targeted delivery of chemical stimuli in a closed microenvironment while supplying larvae with a continuous stream of oxygen–enriched media had yet to be demonstrated. Only with such special capabilities can a microfluidic device (NeuroExaminer 2.0) become a practical tool for research into the analysis of brain connectivity and function, and treatment of neurological diseases.
2 Materials and methods
2.1 Microfabrication
For microstructuring, femtosecond laser ablation of Borofloat® 33 borosilicate 1.1 mm thick glass bottom glass wafers of 4inch size (Schott, Mainz, Germany) was performed using a laser microstructuring system (microSTRUCT c, 3D Micromac AG, Chemnitz, Germany) equipped with a YB:KGW laser source. It was operated at the fundamental wavelength of 1,030 nm, emitting pulses of 224 fs at a frequency of 100 kHz or 600 kHz. Using a f–theta lens with a focal length of 100 mm, the beam was scanned over the substrate surface by a galvanometer scanner (Scanlab RTC5, Puchheim, Germany). The NeuroExaminer 2.0 design (by AutoCAD2015 resulting in dxf–file) was firstly imported into laser software (MicroMMI from 3D–Micromac) and sliced into multiple layers of 50 μm height for laser processing. Depending on the specific structure components, tailored laser ablation parameters were implemented to result in best surface quality and channel profiles (Table 1).
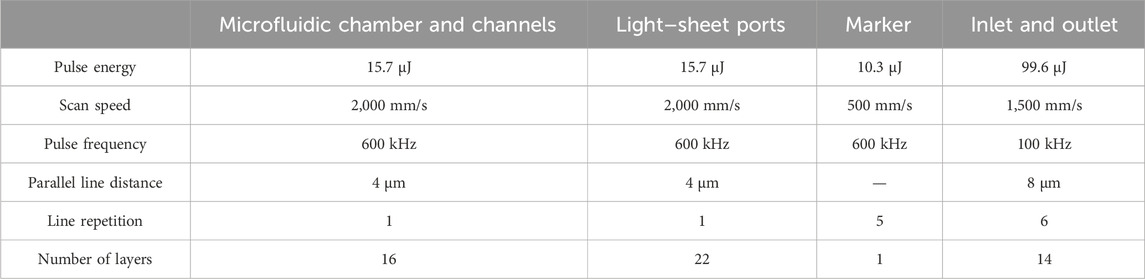
TABLE 1. Parameters used for the femtosecond laser ablation of four different structure components within the base glass substrate.
Ablation was performed according to superimposed sets of parallel scan lines, which filled areas to be removed. Distance between parallel lines was set according to appropriate process (Table 1), starting at 4 µm from the design contour edge. For a complete layer, this procedure was repeated six times with the line direction rotated by 30° from the previous one. Layer by layer, the focus of the laser beam was moved 50 µm further into the glass substrate and layers were added until the desired ablation depth was reached. Microfluidic chambers and channels together with alignment marks were created (Figure 1A I). In contrast to the earlier work, in which two glass substrates were laser patterned, (Mattern et al., 2020), the orientation of the chips to the wafer surface was rotated by 90°, so that only one of two substrates had to be patterned, allowing much better conditions in terms of optical coupling in and out of light. Light–sheet ports were introduced after the glass substrate was turned upside down (Figure 1A II). Through–holes were made in the cover substrate (Borofloat® 33 borosilicate glass plates from Schott, Mainz, Germany, with a thickness of 0.7 mm) for inlets and outlets. The bottom and 0.7 mm thick lid wafers of same material were cleaned using ethanol, solution of H2O, H3PO4, hydrofluoric acid and mixture of distilled water, H2SO4 and H2O2 and then thermally bonded at 630°C (Figure 1A III) to form a 3D closed and fully transparent NeuroExaminer 2.0 chip (Figure 1A IV).
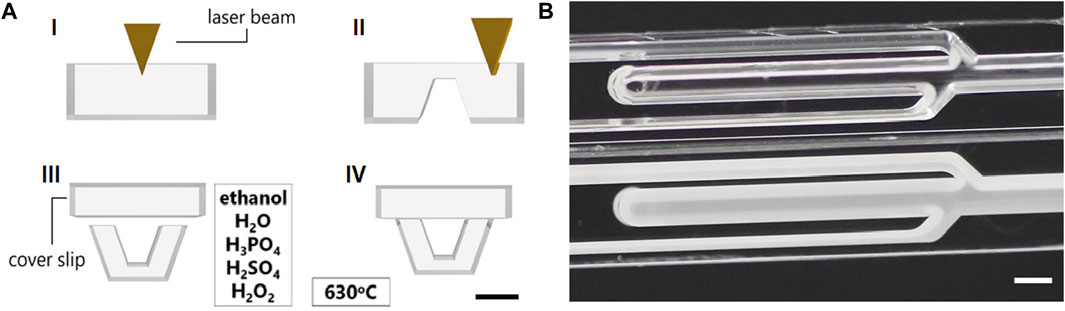
FIGURE 1. NeuroExaminer 2.0 microfabrication (A) Schematic illustration of microfabrication steps for the NeuroExaminer 2.0 device. (I) Laser ablation of fluidic chamber and channels on bottom glass substrate. (II) Structuring of light–sheet ports. (III) Cleaning and alignment of bottom and lid wafer. (IV) Thermal bonding of bottom and lid wafer. The scale bar in all images indicates 1 mm. (B) Microchannel structures of the NeuroExaminer 2.0 before (lower part of the image) and after combined chemical and thermal treatment (upper part of the image). The scale bar is 1 mm.
Cleaning and thermal bonding procedures have been described in detail in previous work (Mattern et al., 2020). Deviating from previous work, after separation into individual chips, some of them received an additional heat treatment at 760°C for 1 h in the muffle furnace in order to establish smoother and fully transparent glass surfaces (Figure 1B) in the microchannels. The etching process already improved the surface quality, but only with the tempering fully transparent microstructures are obtained. These surface treatment steps have earlier been used and resulting surface roughness was characterized (Erfle et al., 2019).
2.2 Optical simulation
Ray trajectories were simulated using COMSOL Multiphysics® software to investigate the quality of the light–sheet coupled into the fish fixator of the NeuroExaminer. The simulations were carried out for different design variants of fish fixator (3D CAD file by SolidWorks imported as SLDPRT) to evaluate different designs and microstructuring methods for the fixator chamber and the light–sheet ports. Mesh element size was predefined as extremely fine 0.188 mm and 0.00188 mm as maximum and minimum element sizes. Refractive index values of 1.5 were selected for glass and 1.33 for the fluid within the NeuroExaminer and between the mirrors. Monochromatic rays of light were released and propagated from hexapolar grids, consisted of 61 grid points, reaching two mirrors placed on the both sides of microfluidic channel. Resulting ray trajectories within the microchannel enabled to analyze and progressively improve geometries.
2.3 Microflow control setup
The flow control was established with four NEMESYS low–pressure module syringe pumps (CETONI GmbH, Korbussen, Germany), equipped with 10 mL glass syringes (SETonic GmbH, Ilmenau, Germany). The NeuroExaminer 2.0 was placed in a fluid bowl (Supplementary Drawings S1, S2) with a chip adapter (Supplementary Drawings S3, S4) insert that was fabricated by 3D printing (using AGILISTA–3200W/3110W, KEYENCE Deutschland GmbH, Neu-Isenburg, Germany). The chip adapter was equipped with fluidic inlets to connect with tubing connectors (The Lee Company, Westbrook, CT, United States) and PTFE tubes with inner diameter of 1 mm (TECHLAB, Braunschweig, Germany) (Figure 2A). The fluid bowl was built from stainless steel with a glass bottom to be compatible with the digital light sheet (DLS) microscope (Leica TCS SP8, Leica microsystems, Wetzlar, Germany). This allowed to place the water–immersion detection and illumination objectives and the two mirrors, that guide the light–sheet to the ports of in the NeuroExaminer 2.0. Microflows in the chip using coloured solutions and loading/unloading of zebrafish larvae was studied under a digital optical microscope (KEYENCE DEUTSCHLAND GmbH, Neu–Isenburg, Germany).
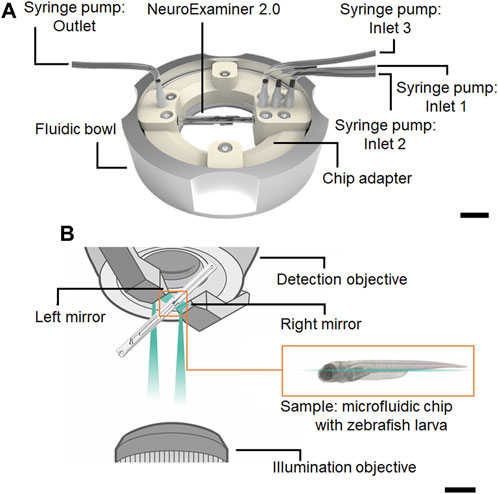
FIGURE 2. Fluidic and optical set up for light-sheet imaging. (A) NeuroExaminer 2.0 chip placed in the adapter together with the fluid bowl and the inlets 1, 2, 3, and outlet that were connected with PTFE tubes to syringe pumps. The scale bar is 1 cm. (B) Sketch illustrating the n vivo whole–brain imaging with the combination of NeuroExaminer 2.0 and Leica DLS 210 microscope. The scale bar is 1 cm.
2.4 Light-sheet microscopy
Imaging was performed on a commercial DLS microscope (Leica TCS SP8, Leica microsystems, Wetzlar, Germany) using a ×2.5 illumination (NA 0.07) and a ×10 water–immersion detection objective (NA 0.3) as described previously (Mattern et al., 2020). Unique to the Leica TCS SP8, the laser beam emanates from the illumination objective, with the digital light sheet formed between two mirrors attached to the detection objective (Figure 2B). This configuration places both objectives on the same axis, differing from traditional light sheet setups where the detection objective is perpendicular to the illumination objective.
For whole-brain in vivo imaging of zebrafish larvae, 21 optical planes, spaced 10 μm apart, were captured from both mirrors with an exposure time of 19.85 ms, a light sheet thickness of 10 μm (“extended”) and 2 × 2 binning, resulting in images with a voxel size of 0.719 µm in both x and y direction. The resulting 735 × 735 × 200 µm3 volume was recorded every 3.48 s (0.29 Hz), and the signals from both mirrors were merged post-acquisition to enhance image quality using the LAS X software’s “Fusion-Wavelet” function.
2.5 Computer tomography
For inspection of microfabricated glass chips, precise 3D measurements were performed on GE’s phoenix nanotom® s (GE Measurement & Control, Wunstorf, Germany), resulting in high–resolution computer tomography scans (CT scans). Region of interest (fish fixator) was narrowed down using copper markers. The scanning process took less than 60 min, starting with recording X–ray images (2D radiographs), rotation of the speciment by 360o, storage of a stack of images and 3D reconstruction of the volume from the image stack. When operating the X–ray tube with 180 μA at 60 kV, 1,440 positions were captured with the ×20 magnification.
2.6 Evaluation of imaging quality
Image sharpness was assessed by computing the variance of the horizontal gradient (x–direction) of the images, which was achieved using a Sobel filter (Pech–Pacheco et al., 2000; Mateos-Pérez et al., 2012). Perceived sharpness in digital images corresponds to the steepness of transitions in intensity. Intensity gradients therefore provide a quantifiable measure for assessing the level of detail. In a sharp image, abrupt changes in intensity (high gradients) occur at the edges of features, leading to a wide range of variance in the rate of change (Pech–Pacheco et al., 2000; Pertuz et al., 2013). Conversely, a lower variance suggests a relatively uniform rate of change, indicative of a blurrier image. In our specific context, we focused exclusively on the variance of the horizontal gradient. This approach was chosen to minimize the impact of stripe artefacts, which were likely caused by light–sheet scattering. Therefore, this method enabled us to effectively quantify and compare the sharpness of images derived from larvae embedded in agarose versus those obtained using different designs of the NeuroExaminer.
The point spread function (PSF) was determined using 200 nm fluorescent microspheres (Dragon Green (FSDG002); 480 nm (excitation maxima), 520 nm (emission maxima), Bangs Laboratories, Fishers, IN, United States) and following a methodology described in the literature (Cole et al., 2011). Light–sheet imaging conditions were kept identical to whole–brain in vivo imaging of zebrafish larvae to ensure comparability. Only the exposure time was increased to 100 ms to visualize the beads and the z–stack interval was set to 0.5 µm between planes to ensure that the shape of the PSF can be determined accurately along the axial direction (Cole et al., 2011). The PSF of individual microspheres was determined using the MetroloJ plug–in in Fiji1.
2.7 Zebrafish maintenance
Zebrafish (Danio rerio) were maintained at 28.5°C on a 14–h light/10 h dark cycle and mated following standard procedures (Aleström et al., 2020). Transgenic zebrafish larvae Tg(elavl3:H2B–GCaMP6s) (Vladimirov et al., 2014) in the crystal (albb4/b4; nacrew2/w2; roya9/a9) (Antinucci and Hindges, 2016) background were raised in Danieau solution (17.4 mM NaCl, 0.21 mM KCl, 0.18 mM Ca(NO3)2, 0.12 mM MgSO4, 1.5 mM HEPES, pH 7.0).
3 Results and discussion
3.1 Coupling the light sheet into a glass chip
The formation of undisturbed light sheets within the glass chip is a necessary condition for proper and good image quality recordings and was therefore investigated in simulations of four different concepts for the area of interest–a part of a fish fixator in which the head of the larva should be positioned–before realizing the NeuroExaminer 2.0 chip. Micro channels with straight and orthogonal edge facets (
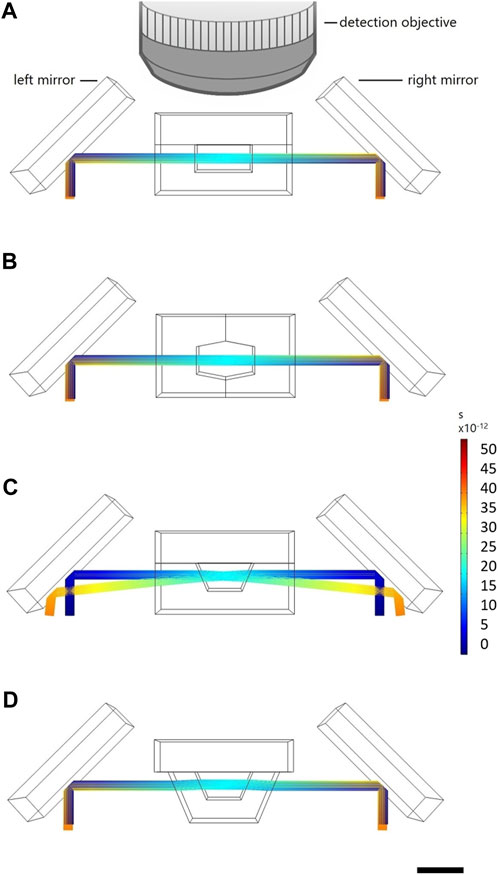
FIGURE 3. Light–sheet ray trajectories coming from two opposing mirrors and passing through the fish fixator unit. Scale corresponds to time and shows ray propagation in the time domain. (A) Illumination conditions assuming an obvious but not feasible fish fixator shape (B) The illumination conditions in the NeuroExaminer 1.0. (C) In NeuroExaminer 2.0. Before (D) and after light sheet ports were introduced. The scale bar is 1 mm throughout.
The major difference of NeuroExaminer 2.0 to NeuroExaminer 1.0 is that the latter was originally designed to optimize the illumination rather than the detection path. For example, in NeuroExaminer 1.0 the fluorescence was recorded with the detection lens in the perpendicular direction through two rather non–ideal glass surfaces. An outer, relatively rough surface was created during chip singularization by wafer dicing. An inner surface was formed from two sloped surfaces, each created as side edges during laser ablation. These not only showed a certain roughness, but instead of the desired planarity they were tilted and had the shape of a pointed roof. Moreover, the bond interface was placed in the beam path of the detection axis. Although the formation of the light–sheet was acceptable, the imaging through a glass roof was limiting the image quality. Hence, single–cell resolution could be obtained only within about half of the depth of the brain (Mattern et al., 2020).
The new NeuroExaminer 2.0 in contrast was designed to decisively improve the emission axis of fluorescence generated in the sample by rotating the fabrication orientation by
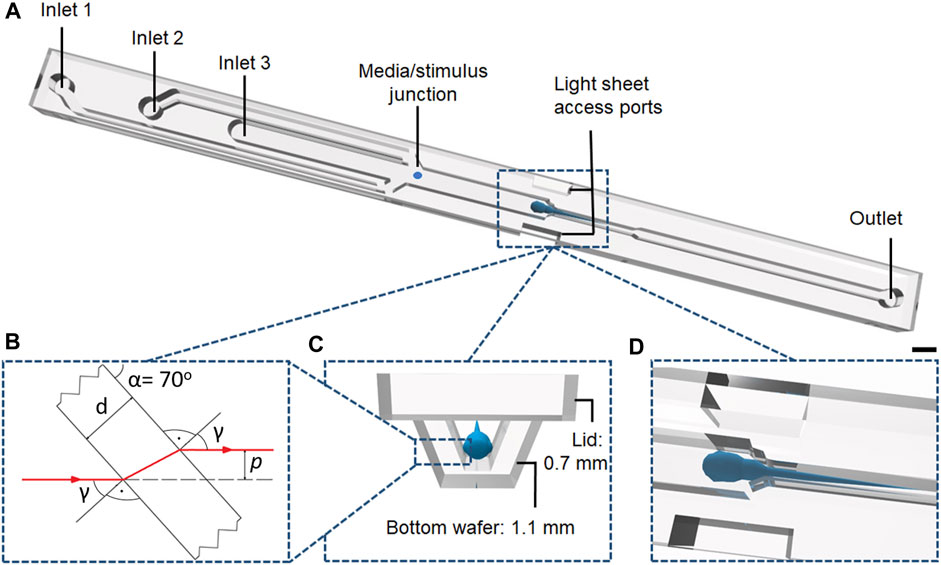
FIGURE 4. (A) Schematic illustration of the NeuroExaminer 2.0 device made of glass for whole–brain in vivo imaging with 45 mm length, a width of 3 mm and the main channel depth of 0.75 mm. The scale bar is 1 mm. (B) The refraction of light at the parallel-plate side wall of the light sheet port. (C) Cross section of a fluidic channel at the position of the fish fixator. (D) Perspective view into the fish fixator with zebrafish larva between light sheet ports.
With calibration before each image recording session, a displacement of
3.2 Design of the NeuroExaminer 2.0 chip
As illustrated in Figure 4A, the NeuroExaminer 2.0 chip consists of two channels for continuous supply of oxygenated medium (Inlet 1 and Inlet 2) and an additional central channel for controlled supply of chemical stimuli and injection of larvae (Inlet 3). On the basis of measured zebrafish dimensions at 5 dpf, a chamber (fish fixator) was designed as central part of the chip with both microfluidic channel structures for capturing and orienting awake zebrafish larvae as well as tailored optical geometries for light–sheet access. The fish fixator (Figures 4C, D) was designed to allow a gentle threading of the fish and to avoid damages to the fragile larval bodies while loading them into the system. Furthermore, two light sheet access ports, where the illumination light only needs to pass through thin plane–parallel glass walls, were symmetrically placed on either side of the fish fixator to allow undisturbed coupling of the light sheet from both sides into the zebrafish brain (Figure 4B). Bottom glass wafers included microfluidic channels, chambers and light sheet access ports. The thin glass lid (coverslip) closing the channels and chambers had openings only at inlets and outlets.
For the most gentle but stable immobilisation of zebrafish larvae the laser ablation process was adjusted to obtain a tailored profile for the fish fixator unit. Derived from the anatomy of zebrafish larvae, the design of this unit was divided into three main sections corresponding to different body parts: tail, yolk and head (Figure 5A). In each of these sections widths and depths were adjusted to improve larva stabilization. The tail part received the narrowest and shallowest profile to restrict trunk movements and thereby reducing larval movements by lack of forward thrust (Figure 5A I). The yolk part, as it was assigned with the main task to limit the movements of the larvae, became wider and deeper to accommodate the zebrafish yolk sac and at the same time to arrest pectoral fins (Figure 5A II). The head part containing the brain, as the region of interest, was closely matched to the head dimensions (Figure 5A III) to facilitate capture and tight positioning of the larval head. The cross sections of the fixator unit were also designed to ensure continuous flow of oxygenated media to keep zebrafish alive and to allow pharmacological substances to reach the zebrafish head. As with the light sheet port, the ablation edges of the fixation unit were inclined at an angle
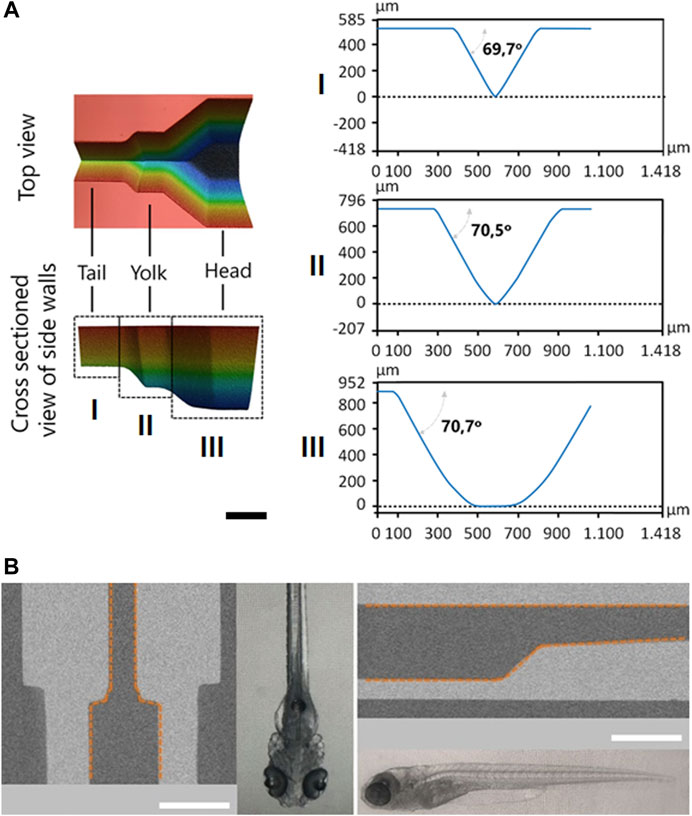
FIGURE 5. Design of the fish fixator. (A) Shape as obtained by 3D Microscopy. For the three sections: tail (I), yolk (II) and head (III) also corresponding cross sectional line profiles are given, that confirm the side wall angle of 70o. The scale bar is 500 µm. (B) CT cross sections of the fish fixator together with micrographs (same scale) of zebrafish larvae (5 dpf) in dorsal (left) and lateral (right) orientation the respective orientation. Fluidic chamber is highlighted with orange dashed line. The scale bar is 1 mm throughout.
Figure 5B shows CT scans of the fish fixator after all fabrication steps of the NeuroExaminer 2.0 had been finished to obtain a closed chip system. For comparison micrographs of zebrafish in dorsal/lateral orientation are also shown. These scans prove that the system is well adapted to a 5 days old zebrafish larva’s anatomy.
3.3 Loading/unloading and fixation procedure
The loading of zebrafish larvae into the microchip consisted of steps illustrated in Figure 6. A single larva was pipetted from a glass dish (right) to a separate dish (left) (Figure 6A) to briefly anaesthetize it in a droplet of Tricaine-conditioned medium (Figure 6B). Afterwards, a Polytetrafluoroethylene (PTFE) tube was disconnected from the syringe pump tubing connector and with negative flow rate activated in Inlet 3 (see Figure 2A). Using the suction mode, the sedated larva could be loaded into the tube (Figure 6C) with its tail pointing towards the outlet. Once the tube was connected to the tubing connector again, a positive flow rate in Inlet 3 and a negative flow rate in the Outlet were activated to transport the now awake larva (due to the dilution of Tricaine) into the microchip (Figure 6D). Using appropriate flow rates (Table 2), the larva was moved into the system through the main channel (Figure 6E) and placed inside the fish fixator (Figure 6F). Due to the straight and narrow design of the main channel, larvae could not change their orientation and their tails were always pointing towards the outlet which resulted in correct trapping. Entering of a larva into the system and placing it inside the fish fixator is presented in Supplementary Video S1. After immobilization, all syringe pumps were activated with adjusted flow rates varying from 5 μL/min to 50 μL/min in each channel to provide the larva with oxygenated media. To release the larva after the tests, the following procedure was applied: Activation of the negative flow rate in Inlet 3 and the positive flow rate in the Outlet, allowed for gentle unloading of the larva out of the micro device and for transferring the larva through the PTFE tube back into the larva dish. It is noteworthy that all procedures are non–invasive and do not risk the survival of the larva therefore allowing for repeated imaging of specimens if needed/wished for. With the carefully chosen geometries of the fixation unit and appropriate settings of the syringe pumps the trapping of zebrafish for long–term experiments of 1.5 h was possible (Figure 6G; Supplementary Video S2).
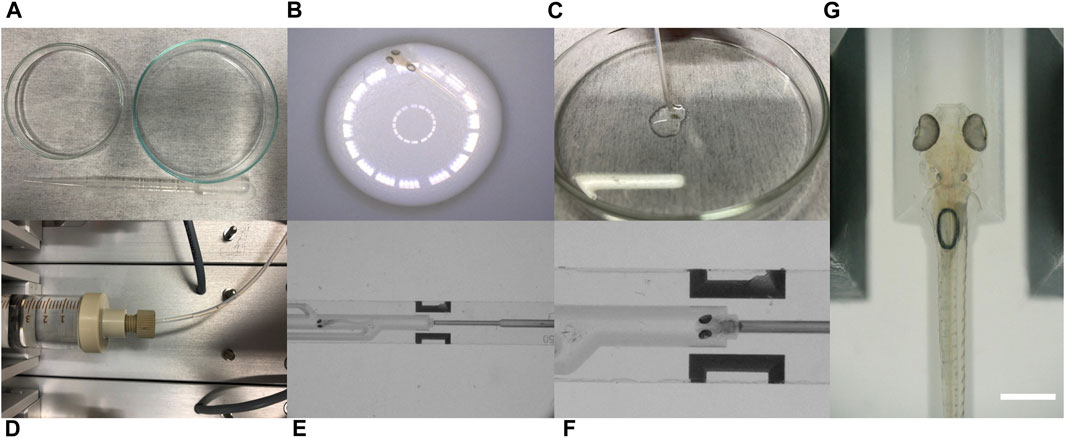
FIGURE 6. Photos illustrating the steps of loading zebrafish larvae into NeuroExaminer 2.0. (A) Transporting a single larva from larva tank (right) to separate glass ware (left) with a pipette. (B) Anaesthetized zebrafish larva in droplet (visible circles are created by reflections of the light source). (C) Sucking zebrafish larva in a PTFE tube. (D) Delivering larva through the tube into the fluidic channel using appropriate flow rates. (E) Entry of zebrafish larva in the main channel of the system. (F) Zebrafish successfully placed in fish fixator. (G) Positioning of zebrafish larva (5 dpf) in the fish fixator. The zebrafish brain is exposed between the two light sheet ports of the NeuroExaminer 2.0 chip. The scale bar is 500 µm.

TABLE 2. Flow rates in the inlets and the outlet during loading, unloading and immobilization.
Table 2 summarizes the flow rates (Q1, … , Q4) that were found to be suitable for the loading and unloading procedures and the immobilization of the larva right after trapping it inside the fish fixator. To load a zebrafish larva into the device, Inlet 3 was given a positive flow rate, while the Outlet was set for suction mode (negative flow rate). While loading, Inlet 1 and Inlet 2 were connected to syringe pumps, which were not activated. Zebrafish unloading was performed by negative flow rate in Inlet 3 and positive flow rate in the Outlet. For immobilization after the loading procedure, all channels were activated with flow rates that add up to zero. With such gentle fluidic manipulation and agarose–free immobilization, zebrafish could be placed between two light sheet ports to expose the brain and allow imaging. For loading and immobilization no laborious and time–consuming manual manipulation and orientation of fish larva was needed.
3.4 Imaging quality
The sharpness of images obtained through light–sheet microscopy is critical for the subsequent analysis of individual neuronal activity. To assess and compare the sharpness of light–sheet images of zebrafish larvae (Figure 7A), either embedded in agarose or imaged using different NeuroExaminer designs, we computed the variance of the image gradient in the x–direction (see Materials and methods section).
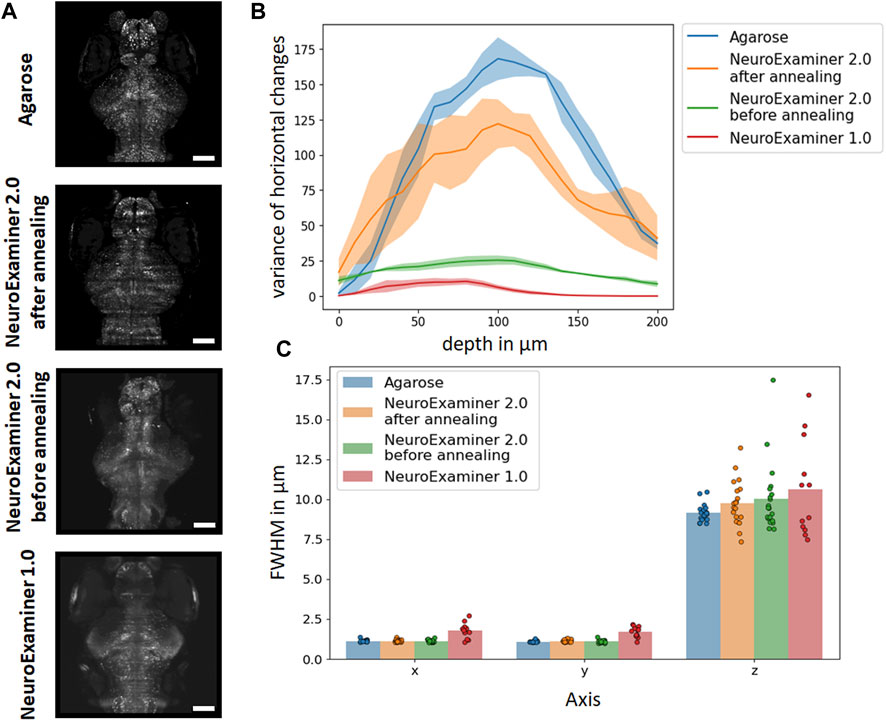
FIGURE 7. Evaluation of imaging quality. (A) Maximum intensity projection of light sheet images of 21 optical sections of zebrafish larvae (5 dpf) expressing nuclear–localized GCaMP6s in the nervous system that where either obtained after embedding in agarose or using one of the three different NeuroExaminer designs (as indicated). The scale bar in all images represents 100 µm. (B) Comparison of image sharpness (measured as the variance of brightness changes) at different depths throughout the brains of larval zebrafish embedded in agarose (blue), obtained within NeuroExaminer 1.0 (red), NeuroExaminer 2.0 before (green) and after (orange) additional annealing. Lines and shaded areas represent mean and standard deviation, respectively, of three different fish imaged over a hundred frames for each condition. (C) FWHM values of PSF for x, y, and z obtained in agarose (blue; n = 20 beads), within the NeuroExaminer 2.0 after (orange; n = 20 beads) or before (green; n = 20 beads) annealing and the NeuroExaminer 1.0 (red; n = 12 beads). Bars depict the mean, points the values from individual microspheres.
This measure is expected to be higher when more sharp edges are present in an image, indicating an overall sharper image. It is not an absolute benchmark for image sharpness, since it depends on the number of features that have been mapped in an image, but this approach can be used for comparisons. The gradient analysis for images recorded at different depths throughout the brains of larval zebrafish that were either embedded in agarose or obtained with NeuroExaminer 1.0, NeuroExaminer 2.0 or NeuroExaminer 2.0 after additional annealing at the end of the microfabrication (see Materials and methods section) is shown in Figure 7B. For the comparison, we used average values across each plane based on data from three fish over 100 frames for each design. It shows that the design of the NeuroExaminer 2.0, especially after annealing, significantly improves image quality compared to the NeuroExaminer 1.0. This is particularly noticeable in deeper regions of the brain, which were challenging and often appeared blurred in the images obtained with NeuroExaminer 1.0. The image quality that can be achieved using the NeuroExaminer 2.0 after additional annealing is now comparable to agarose, which we use as a benchmark for image sharpness that allows for the analysis of individual neuronal activity throughout the entire brain of larval zebrafish.
Full width at half maximum (FWHM) values derived from the point spread function (PSF) analysis of beads either just in agarose or in agarose within one of the different designs of the NeuroExaminer are shown in Figure 7C. In agarose (n = 20 beads) mean and standard deviation of the FWHM values were 1.11 ± 0.07 µm in x, 1.07 ± 0.06 µm in y, and 9.15 ± 0.53 µm in z. Within the NeuroExaminer 2.0 after annealing (n = 20 beads) FWHM values of 1.12 ± 0.09 µm, 1.11 ± 0.08 µm, and 9.73 ± 1.42 µm for x, y, and z, respectively, were obtained. Measurements in the NeuroExaminer 2.0 before annealing (n = 20 beads) yielded values of 1.11 ± 0.08 µm in x, 1.08 ± 0.09 µm in y, and 10.02 ± 2.18 µm in z. For the NeuroExaminer 1.0 (n = 12 beads) the FWHM values were notably higher with 1.76 ± 0.48, 1.69 ± 0.34, and 10.63 ± 3.02 for x, y, and z, respectively (Mattern et al., 2020).
While the FWHM values for x and y are almost identical between agarose and both versions of the NeuroExaminer 2.0, they are slightly higher in the NeuroExaminer 1.0 In the z dimension, there is some increase in both the mean and standard deviation from agarose to NeuroExaminer 2.0 after and before annealing to the NeuroExaminer 1.0 design. This trend is consistent with our analysis of calcium imaging quality (Figure 7B).
3.5 Spatiotemporal control of stimulus application
Figure 8A shows the NeuroExaminer 2.0 in which a stimulus stream with a variable flow rate was injected at Inlet 3, while Inlets 1 and 2 were fed with the same constant volume flow rate. Both the stimulus stream (represented by green ink (Pelikan 4001, Hannover, Germany) colour–coded Danieau solution) and oxygenated media (Danieau solution) could reach the larva head in a targeted manner and with an intensity adjustable by the syringe pump for the stimulus supply (Supplementary Video S3). In all studied cases laminar deterministic flow was obtained (Reynolds numbers stayed below
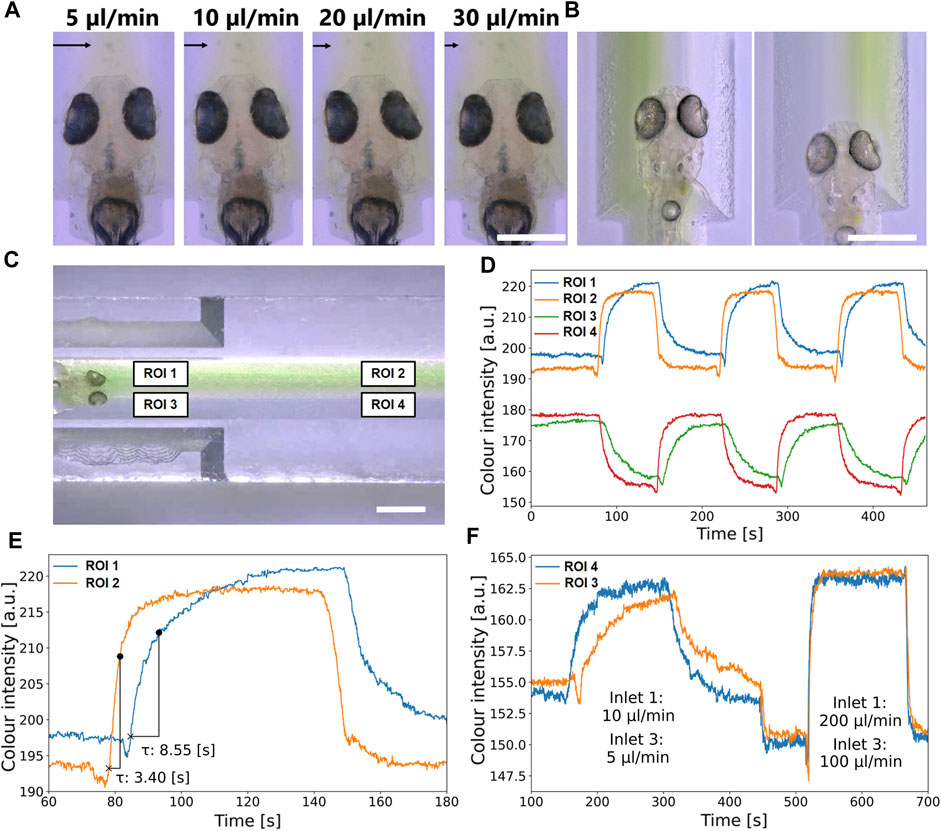
FIGURE 8. Evaluation of the spatial and temporal precision of stimulus application. (A) The targeted application of a stimulus (represented by green coloured Danieau solution) to expose larva’s head at different flow rates through Inlet 3 and with stable Danieau solution flow rates of 10 μL/min in Inlet 1 and 2. The flow rates in Inlet 3 were varied from 5 μL/min to 30 μL/min. Black arrows indicate increasing stimulus exposure to the larva’s head. The scale bar is 100 µm. (B) Stimulus (coloured Danieau solution) exposure of left and right part of larva head by switching Inlet 1 and Inlet 2: Inlet 1 on, Inlet 2 off (right exposure) and Inlet 1 on, Inlet 2 off (left exposure). The scale bar is 500 µm throughout. (C) Regions of interest used for the analysis of colour intensities to evaluate temporal precision in the NeuroExaminer 2.0. ROI 1 and ROI 3 represented area ahead larva head, while ROI 2 and ROI 4 included area near Inlet 1 and 2. The scale bar is 1 mm. (D) Intensity changes over time ROI1 (blue), ROI 2 (orange), ROI 3 (green) and ROI 4 (red). Starting with a continuous stimulus exposure, six lateral shift were induced by the syringe pumps. (E) Intensity over time in ROI 1 (ahead larva head) and ROI 2 (near Inlet 1 and 2) including relative time needed to reach saturation point in particular regions. Lateral shift was carried out using flow rate 10 μL/min in Inlet 3 and according to either left or right exposure 20 μL/min in Inlet 1 or 2. (F) Difference in colour distribution between ROI 3 and ROI 4 at low (left) and subsequentially also at high flow rates.
In another experiment, it was investigated how quickly the position of the stimulus delivery can be changed. In contrast to the previous experiment, the stimulus current at Inlet 3 was kept constant and only Inlet 1 or Inlet 2 was alternately supplied with oxygenated fresh medium at twice the volume flow rate as at Inlet 3 by programming the syringe pumps (Supplementary Video S4) to alternately expose the right or left half of the larva head with coloured Danieau solution (Figure 8B). Precise spatial control of stimulus application (left/right side of the larval head) could be demonstrated in this manner.
In order to evaluate also temporal precision of stimulus application, four regions of interest (ROIs) were analysed (Figure 8C). Using a movie provided in the (Supplementary Video S4) measurements of colour intensity values were carried out in the vicinity of the larva head (ROI 1 and ROI 3) and next to Inlets 1 and 2 (ROI 2 and ROI 4). Figure 8D shows green colour intensity changes over time in ROIs 1 to 4. Starting with a continuous stimulus exposure of the left side of the larva head, the shift to the right side by control of syringe pumps was first recognized by steep inversely related intensity changes in ROIs 2 and 4, followed with a short delay by ROIs 1 and 3 where the transition was slightly slower.
To determine time constants of right/left shifting, it was assumed that the change followed an exponential decay, which means that the time constant
Figure 8E shows the course of green intensity at ROI 1 (ahead larva head) and ROI 2 (near Inlet 1). For ROI 2
Figure 8F shows the courses of colour changes in ROI 3 and ROI 4 at different volume flow rates. At higher flow rates, even less delayed and steeper stimuli gradients can be achieved.
In summary, the NeuroExaminer 2.0 device is a reusable all glass light–sheet microscopy chip for non–invasively monitoring whole brain activity of Ca2+–dynamics at cellular resolution under defined microfluidic chemical stimuli. The NeuroExaminer 2.0 will therefore serve to depict physiological activity of distinct neuronal cells and populations in a time–resolved manner upon defined stimulation for powerful circuit analysis.
4 Conclusion
The development of a microfluidic perfusion system that can be operated in combination with light sheet imaging places much higher demands on the design, material and microfabrication of the chip when commercial microscopes are to be used. In particular restrictions regarding the light sheet coupling via two opposing and closely spaced mirrors require unique solutions for optical interrogation windows in the chip. Therefore, a monolithic thin glass chip was developed which offers substantially improved conditions for the in and out coupling of light, but poses high demands on microfabrication compared to relatively easy to fabricate PDMS microdevices, which are suitable in combination with tailored custom built light sheet microscopes (Sy et al., 2023). The NeuroExaminer 2.0 was fabricated from glass by femtosecond laser ablation and thermal bonding. Compared to the NeuroExaminer 1.0, (Mattern et al., 2020), decisive changes have been made in the design and manufacturing to allow a breakthrough in imaging quality particular at deeper brain levels, but also throughout the entire brain. Simulations confirm that two light sheets from opposing directions perfectly superimpose and precisely define the focal plane of the imaging lens. This was possible by implementing two light sheet ports using an appropriate femtosecond laser ablation technique. Also a second weakness of NeuroExaminer 1.0 was eliminated, which was that the fluorescent light entered the imaging objective through a glass cover layer that was not a perfect plane–parallel glass lid. Moreover, highest optical quality was achieved with very smooth inner surfaces of the chip achieved with thermal annealing, whereby the system turned into a nearly perfectly clear chamber. Furthermore, special attention was given to the geometries of the fish fixator unit to closely match a zebrafish larva’s anatomy. A channel profile exactly fitting the larva tail, yolk and head enabled whole brain in vivo imaging via light sheet microscopy in awake zebrafish. Loading/unloading of larvae was successfully demonstrated, which allows to reuse both the inert glass chamber and the larva repeatedly for iterative studies. The investigation of targeted stimuli application to different parts of the head was simulated with coloured solutions. Furthermore, this stimulus in the NeuroExaminer 2.0 can be focused by quick changes in flow rates either onto the left or right half of the larva’s head which will offer an interesting opportunity for investigating odor–evoking responses in the olfactory system either through the left or right olfactory pit respectively. The gentle fluidic manipulation and agarose–free immobilization allows for monitoring brain activity of zebrafish over longer time scales, enabling detailed studies that would not be possible using traditional methods. Because NeuroExaminer 2.0 can be used in the many laboratories that do not have the capability to develop their own light sheet microscope or build their own chips, it will be able to help answer basic research questions on a broad scale in the future, as well as serve efficient drug testing and development to improve the treatment of neuropsychiatric disorders such as anxiety, depression and drug addiction.
Data availability statement
The raw data supporting the conclusion of this article will be made available by the authors, without undue reservation.
Author contributions
DS: Investigation, Methodology, Writing–original draft, Writing–review and editing. MM: Investigation, Writing–review and editing. JF: Investigation, Software, Writing–review and editing. JT: Conceptualization, Investigation, Writing–review and editing. RK: Conceptualization, Supervision, Writing–review and editing. AD: Conceptualization, Supervision, Writing–review and editing.
Funding
The author(s) declare financial support was received for the research, authorship, and/or publication of this article. This work was supported by funding of the German Research Foundation/Deutsche Forschungsgemeinschaft (project number 427719460) and Publikationsfonds der TU Braunschweig.
Acknowledgments
The authors would like to thank Mr. Fabian Graef of the Institute of Materials Science at the TU Braunschweig for assistance with computed tomographic imaging.
Conflict of interest
The authors declare that the research was conducted in the absence of any commercial or financial relationships that could be construed as a potential conflict of interest.
Publisher’s note
All claims expressed in this article are solely those of the authors and do not necessarily represent those of their affiliated organizations, or those of the publisher, the editors and the reviewers. Any product that may be evaluated in this article, or claim that may be made by its manufacturer, is not guaranteed or endorsed by the publisher.
Supplementary material
The Supplementary Material for this article can be found online at: https://www.frontiersin.org/articles/10.3389/frlct.2024.1346439/full#supplementary-material
Footnotes
References
Ahrens, M. B., and Engert, F. (2015). Large-scale imaging in small brains. Curr. Opin. Neurobiol. 32, 78–86. doi:10.1016/j.conb.2015.01.007
Ahrens, M. B., Li, J. M., Orger, M. B., Robson, D. N., Schier, A. F., Engert, F., et al. (2012). Brain-wide neuronal dynamics during motor adaptation in zebrafish. Nature 485 (7399), 471–477. doi:10.1038/nature11057
Ahrens, M. B., Orger, M. B., Robson, D. N., Li, J. M., and Keller, P. J. (2013). Whole-brain functional imaging at cellular resolution using light-sheet microscopy. Nat. Methods 10 (5), 413–420. doi:10.1038/nmeth.2434
Albert-Smet, I., Marcos-Vidal, A., Vaquero, J. J., Desco, M., Muñoz-Barrutia, A., and Ripoll, J. (2019). Applications of light-sheet microscopy in microdevices. Front. Neuroanat. 13, 1. doi:10.3389/fnana.2019.00001
Aleström, P., D'Angelo, L., Midtlyng, P. J., Schorderet, D. F., Schulte-Merker, S., Sohm, F., et al. (2020). Zebrafish: housing and husbandry recommendations. Lab. Anim. 54 (3), 213–224. doi:10.1177/0023677219869037
Ali, S., Champagne, D. L., Spaink, H. P., and Richardson, M. K. (2011). Zebrafish embryos and larvae: a new generation of disease models and drug screens. Birth Defects Res. Part C Embryo Today Rev. 93 (2), 115–133. doi:10.1002/bdrc.20206
Antinucci, P., and Hindges, R. (2016). A crystal-clear zebrafish for in vivo imaging. Sci. Rep. 6, 29490. doi:10.1038/srep29490
Baillie, J. S., Stoyek, M. R., and Quinn, T. A. (2021). Seeing the light: the use of zebrafish for optogenetic studies of the heart. Front. Physiol. 12, 748570. doi:10.3389/fphys.2021.748570
Bruzzone, M., Chiarello, E., Albanesi, M., Miletto Petrazzini, M. E., Megighian, A., Lodovichi, C., et al. (2021). Whole brain functional recordings at cellular resolution in zebrafish larvae with 3D scanning multiphoton microscopy. Sci. Rep. 11 (1), 11048. doi:10.1038/s41598-021-90335-y
Candelier, R., Murmu, M. S., Romano, S., Jouary, A., Debrégeas, G., and Sumbre, G. (2015). A microfluidic device to study neuronal and motor responses to acute chemical stimuli in zebrafish. Sci. Rep. 5, 12196–12210. doi:10.1038/srep12196
Cole, R. W., Jinadasa, T., and Brown, C. M. (2011). Measuring and interpreting point spread functions to determine confocal microscope resolution and ensure quality control. Nat. Protoc. 6 (12), 1929–1941. doi:10.1038/nprot.2011.407
Erfle, P., Riewe, J., Bunjes, H., and Dietzel, A. (2019). Stabilized production of lipid nanoparticles of tunable size in taylor flow glass devices with high-surface-quality 3D microchannels. Micromachines 10 (4), 220. doi:10.3390/mi10040220
Fischer, R. S., Wu, Y., Kanchanawong, P., Shroff, H., and Waterman, C. M. (2011). Microscopy in 3D: a biologist's toolbox. Trends Cell Biol. 21 (12), 682–691. doi:10.1016/j.tcb.2011.09.008
Han, S., Zhang, D., Dong, Q., Wang, X., and Wang, L. (2021). Overexpression of neuroserpin in larval and adult zebrafish shows different behavioral phenotypes. Neurosci. Lett. 762, 136175. doi:10.1016/j.neulet.2021.136175
Hong, S., Lee, P., Baraban, S., and Lee, L. P. (2016). A novel long-term, multi-channel and non-invasive electrophysiology platform for zebrafish. Sci. Rep. 6, 28248. doi:10.1038/srep28248
Kaufmann, A., Mickoleit, M., Weber, M., and Huisken, J. (2012). Multilayer mounting enables long-term imaging of zebrafish development in a light sheet microscope. Development 139 (17), 3242–3247. doi:10.1242/dev.082586
Keller, P. J., Schmidt, A. D., Wittbrodt, J., and Stelzer, E. H. (2008). Reconstruction of zebrafish early embryonic development by scanned light sheet microscopy. Science 322 (5904), 1065–1069. doi:10.1126/science.1162493
Khalili, A., and Rezai, P. (2019). Microfluidic devices for embryonic and larval zebrafish studies. Briefings Funct. Genomics 18 (6), 419–432. doi:10.1093/bfgp/elz006
Khalili, A., van Wijngaarden, E., Youssef, K., Zoidl, G. R., and Rezai, P. (2022). Designing microfluidic devices for behavioral screening of multiple zebrafish larvae. Biotechnol. J. 17 (1), e2100076. doi:10.1002/biot.202100076
Khalili, A., van Wijngaarden, E., Zoidl, G. R., and Rezai, P. (2021). Zebrafish larva’s response and habituation to electric signal: effects of voltage, current and pulsation studied in a microfluidic device. Sensors Actuators A Phys. 332, 113070. doi:10.1016/j.sna.2021.113070
Lin, X., Wang, S., Yu, X., Liu, Z., Wang, F., Li, W. T., et al. (2015). High-throughput mapping of brain-wide activity in awake and drug-responsive vertebrates. Lab a Chip 15 (3), 680–689. doi:10.1039/c4lc01186d
Liu, P., Fu, L., Li, B., Man, M., Ji, Y., Kang, Q., et al. (2022). Dissolved oxygen gradient on three dimensionally printed microfluidic platform for studying its effect on fish at three levels: cell, embryo, and larva. Environ. Sci. Pollut. Res. 30, 21978–21989. doi:10.1007/s11356-022-23688-0
Loganathan, D., Wu, S., and Chen, C. (2023). Behavioural responses of zebrafish with sound stimuli in microfluidics. Lab. Chip 23, 106–114. doi:10.1039/d2lc00758d
Loring, M. D., Thomson, E. E., and Naumann, E. A. (2020). Whole-brain interactions underlying zebrafish behavior. Curr. Opin. Neurobiol. 65, 88–99. doi:10.1016/j.conb.2020.09.011
Mani, K., Hsieh, Y. C., Panigrahi, B., and Chen, C. Y. (2018). A noninvasive light driven technique integrated microfluidics for zebrafish larvae transportation. Biomicrofluidics 12 (2), 021101. doi:10.1063/1.5027014
Mateos-Pérez, J. M., Redondo, R., Nava, R., Valdiviezo, J. C., Cristóbal, G., Escalante-Ramírez, B., et al. (2012). Comparative evaluation of autofocus algorithms for a real-time system for automatic detection of Mycobacterium tuberculosis. Cytom. Part A 81A (3), 213–221. doi:10.1002/cyto.a.22020
Mattern, K., von Trotha, J. W., Erfle, P., Köster, R. W., and Dietzel, A. (2020). NeuroExaminer: an all-glass microfluidic device for whole-brain in vivo imaging in zebrafish. Commun. Biol. 3, 311. doi:10.1038/s42003-020-1029-7
Nady, A., Peimani, A. R., Zoidl, G., and Rezai, P. (2017). A microfluidic device for partial immobilization, chemical exposure and behavioural screening of zebrafish larvae. Lab. Chip 17, 4048–4058. doi:10.1039/c7lc00786h
Orger, M. B., and de Polavieja, G. G. (2017). Zebrafish behavior: opportunities and challenges. Annu. Rev. Neurosci. 40, 125–147. doi:10.1146/annurev-neuro-071714-033857
Pardo-Martin, C., Chang, T. Y., Koo, B. K., Gilleland, C. L., Wasserman, S. C., and Yanik, M. F. (2010). High-throughput in vivo vertebrate screening. Nat. Methods 7 (8), 634–636. doi:10.1038/nmeth.1481
Pech–Pacheco, J. L., Cristobal, G., Chamorro-Martinez, J., and Fernandez–Valdivia, J. (2000). Diatom autofocusing in brightfield microscopy: a comparative study. Proc. 15th Int. Conf. Pattern Recognit. Icpr. 3, 314–317.
Pertuz, S., Puig, D., and Garcia, M. A. (2013). Analysis of focus measure operators for shape-from-focus. Pattern Recognit. 46, 1415–1432. doi:10.1016/j.patcog.2012.11.011
Portugues, R., Severi, K. E., Wyart, C., and Ahrens, M. B. (2013). Optogenetics in a transparent animal: circuit function in the larval zebrafish. Curr. Opin. Neurobiol. 23 (1), 119–126. doi:10.1016/j.conb.2012.11.001
Rosa, J. G. S., Lima, C., and Lopes-Ferreira, M. (2022). Zebrafish larvae behavior models as a tool for drug screenings and pre-clinical trials: a review. Int. J. Mol. Sci. 23 (12), 6647. doi:10.3390/ijms23126647
Steenbergen, P. J. (2018). Response of zebrafish larvae to mild electrical stimuli: a 96-well setup for behavioural screening. J. Neurosci. Methods 301, 52–61. doi:10.1016/j.jneumeth.2018.03.002
Stewart, A. M., Braubach, O., Spitsbergen, J., Gerlai, R., and Kalueff, A. V. (2014). Zebrafish models for translational neuroscience research: from tank to bedside. Trends Neurosci. 37 (5), 264–278. doi:10.1016/j.tins.2014.02.011
Sy, S. K. H., Chan, D. C. W., Chan, R. C. H., Lyu, J., Li, Z., Wong, K. K. Y., et al. (2023). An optofluidic platform for interrogating chemosensory behavior and brainwide neural representation in larval zebrafish. Nat. Commun. 14, 227. doi:10.1038/s41467-023-35836-2
Symvoulidis, P., Lauri, A., Stefanoiu, A., Cappetta, M., Schneider, S., Jia, H., et al. (2017). NeuBtracker—imaging neurobehavioral dynamics in freely behaving fish. Nat. Methods 14, 1079–1082. doi:10.1038/nmeth.4459
Toepke, M. W., and Beebe, D. J. (2006). PDMS absorption of small molecules and consequences in microfluidic applications. Lab. Chip 6, 1484–1486. doi:10.1039/b612140c
Vladimirov, N., Mu, Y., Kawashima, T., Bennett, D. V., Yang, C. T., Looger, L. L., et al. (2014). Light-sheet functional imaging in fictively behaving zebrafish. Nat. Methods 11 (9), 883–884. doi:10.1038/nmeth.3040
Wang, J. D., Douville, N. J., Takayama, S., and ElSayed, M. (2012). Quantitative analysis of molecular absorption into PDMS microfluidic channels. Ann. Biomed. Eng. 40 (9), 1862–1873. doi:10.1007/s10439-012-0562-z
Wielhouwer, E. M., Ali, S., Al-Afandi, A., Blom, M. T., Olde Riekerink, M. B., Poelma, C., et al. (2011). Zebrafish embryo development in a microfluidic flow-through system. Lab. Chip 11, 1815–1824. doi:10.1039/c0lc00443j
Xi, Y., Noble, S., and Ekker, M. (2011). Modeling neurodegeneration in zebrafish. Curr. Neurol. Neurosci. Rep. 11 (3), 274–282. doi:10.1007/s11910-011-0182-2
Keywords: microfluidics, zebrafish larvae, monolithic glass chip, light-sheet microscopy, neural activity
Citation: Schrödter D, Mozafari M, Fichtner J, von Trotha JW, Köster RW and Dietzel A (2024) A 3D tailored monolithic glass chip for stimulating and recording zebrafish neuronal activity with a commercial light sheet microscope. Front. Lab. Chip. Technol. 3:1346439. doi: 10.3389/frlct.2024.1346439
Received: 29 November 2023; Accepted: 19 February 2024;
Published: 11 March 2024.
Edited by:
Nan Zhang, University College Dublin, IrelandReviewed by:
Georgette B. Salieb-Beugelaar, Münster University of Applied Sciences, GermanyAllen Mathew, University College Dublin, Ireland
Copyright © 2024 Schrödter, Mozafari, Fichtner, von Trotha, Köster and Dietzel. This is an open-access article distributed under the terms of the Creative Commons Attribution License (CC BY). The use, distribution or reproduction in other forums is permitted, provided the original author(s) and the copyright owner(s) are credited and that the original publication in this journal is cited, in accordance with accepted academic practice. No use, distribution or reproduction is permitted which does not comply with these terms.
*Correspondence: Dominika Schrödter, d.schroedter@tu-braunschweig.de ; Andreas Dietzel, a.dietzel@tu-braunschweig.de