Personalized social network activity feeds for increased interaction and content contribution
 Shlomo Berkovsky
 Jill Freyne
- Digital Productivity Flagship, CSIRO, Sydney, NSW, Australia
Online social networks were originally conceived as means of sharing information and activities with friends, and their success has been one of the primary contributors of the tremendous growth of the Web. Social network activity feeds were devised as a means to aggregate recent actions of friends into a convenient list. But the volume of actions and content generated by social network users is overwhelming, such that keeping users up-to-date with friend activities is an ongoing challenge for social network providers. Personalization has been proposed as a solution to combat social network information overload and help users to identify the nuggets of relevant information in the incoming flood of network activities. In this paper, we propose and thoroughly evaluate a personalized model for predicting the relevance of the activity feed items, which informs the ranking of the feeds and facilitates personalization. Results of a live study show that the proposed feed personalization approach successfully identifies and promotes relevant feed items and boosts the uptake of the feeds. In addition, it increases the contribution of user-generated content to the social network and spurs interaction between users.
Introduction
The growth of the Web is relentless and set to continue and accelerate in the near future, as the Web continues to accommodate new forms of centralized and user-generated content (Susarla et al., 2012). Online social networks (in short, SNs) have recently experienced remarkable popularity and they are fast becoming the place where information is shared and found. Designed to allow people to create and share textual and multimedia content, SNs have become rich and diverse information sources, often competing with conventional websites and search engines in the dispersion of information. SNs have billions of users and the volume of content that can be found therein is astounding. Facebook alone reports more than a billion users, with an average user connected to hundreds friends, and using the system for more than 1 hour a day1.
Most SNs allow their users to tune into streams of information and updates from other users, which act as virtual information filters for the incoming information. These streams, or activity feeds, typically contain a summary of the actions taken by other SN users, broadly defined as connections (friends, followers, contacts, articulated connections, and so on). This natural filter, where information items contributed by the trusted users are aggregated in the feed and presented in reverse chronological order, allows SN users to quickly discover updates and content of interest. The popularity of SN, their ubiquity, and the ease of content generation and sharing, however, has swamped the simple aggregation mechanism of the feed, as the number of connections made and the volume of content contribute has increased. While simple and easy to understand, the standard information aggregation mechanism of the feed can hardly cope with the sheer volume and diversity of content contributed by SN users, and it crumbled under the pressure being placed (Berkovsky and Freyne, 2015). Users could, in principle, remove undesired users their feed, but the personal and social unease at removing online connections overweighed the benefits and precluded many users from actively curating their feeds.
Automatic re-organization of feeds, aimed at filtering out irrelevant or less interesting updates and highlighting updates of a particularly high importance, offers a solid alternative to manual filtering (Chen et al., 2010; Freyne et al., 2010). Research at the intersection of the research areas of data mining, machine learning, natural language processing, and social sciences turned their focus to the problem of the SN feed filtering. Several orthogonal solutions to the problem were proposed: what intrinsic and extrinsic factors make SN posts valuable (Hurlock and Wilson, 2011; Lage et al., 2013), how can the feeds be ranked in a domain-agnostic manner (Das Sarma et al., 2010; Duan et al., 2010; Huang et al., 2012), and what approaches from the Semantic Web realm can alleviate the ranking task (Bontcheva and Rout, 2012). However, much of this work faced a major obstacle, the perceived importance of the feed items was found to be user dependent, which brought to the fore a rather complex challenge of filtering the feed in a personalized manner.
In response to this emergent challenge, in this work, we investigate the application of established personalization techniques, widely recognized solutions in other information overload situations, to the task of identifying interesting content in SN activity feeds (Berkovsky and Freyne, 2015). We capitalize primarily on earlier works of Gilbert and Karahalios (2009) and Wu et al. (2010), and propose a model that leverages observable SN activities, such as users’ interactions with content and other users, in order to elicit user preferences, predict relevance of feed items, and subsequently personalize activity feeds. Specifically, we judge the relevance of candidate feed items using two principal parameters: user-to-user relationship strengths and user-to-action interest score. The former incorporates 53 fine-grained factors reflecting the individual and mutual activity of users, which jointly quantify the degree of user-to-user closeness. The latter focuses on the actions performed by SN users and aims to derive individual action importance scores. The two parameters are combined in a linear manner, such that every candidate feed item is scored in a personalized manner tailored to the feed recipient. Finally, the feed gets re-ordered, such that high-scoring items appear on top of the feed, thus, highlighting relevant SN activities.
This paper extends our earlier work (Berkovsky et al., 2011; 2012). Specifically, we present in greater detail the developed model for feed scoring and personalization, and more thoroughly evaluate the proposed feed personalization mechanism. Initially, we outline the feed scoring mechanism, which capitalizes on prior works of Gilbert and Karahalios (2009) and Wu et al. (2010), but also contextualizes them to the target domain of the SN under investigation. Then, we present an elaborate evaluation conducted as part of a live study involving users of the Online Total Wellbeing Diet (TWD) portal designed to support diet and lifestyle program participants. The portal incorporated a dedicated SN component and the activity feed was personalized according to our methodology. The analysis touches upon several aspects of personalization: (i) general uptake of the feed, (ii) temporal evolution of the feeds, (iii) ranking of the feed items, (iv) impact of the feed on user activities, and (v) relationships between the feed and online user friending. Out of these aspects, the temporal evolution of the feeds was not addressed at all in (Berkovsky et al., 2012), whereas the other four aspects are evaluated more thoroughly in this paper. The results show a clear evidence supporting our argument that feed personalization is a valuable tool supporting the success and popularity of SNs. With regards to the above-mentioned five aspects, the evaluation results show that personalization (i) highlighted important SN activities, (ii) improved in accuracy over time, (iii) diverted user activities toward highly ranked feed items, (iv) increased the contribution of user-generated content, and (v) assisted users in establishing and maintaining online friendship links. Hence, we conclude that the personalization of activity feeds is an important means for sustaining the engagement of SN users and increasing content contribution and online friending.
The rest of this paper is structured as follows. Section 2 surveys related work on personalization of SN feeds. Section 3 details our evaluation platform, the Online TWD portal, and the proposed feed personalization mechanism. Section 4 presents the experimental evaluation conducted and discusses the obtained results. Finally, Section 5 concludes the paper and outlines future research directions.
Related Work
To facilitate a re-organization of the SN feed, a robust mechanism for scoring the relevance of the feed items is required (De Choudhury et al., 2011). In this section, we survey prior approaches to scoring feed items: we first focus on the user-to-user relationships; we then examine work that incorporates text and content factors; and, finally, we turn to SN- and graph-related considerations.
User-To-User Relationships
Perhaps, the central factor when scoring feed items is the strength of relationship between the user who performed the activity and the feed recipient (Berkovsky and Freyne, 2015). Several works looked into the quantification of the strength of ties between SN users. The first work in this area was conducted by Gilbert and Karahalios (2009). They modeled the tie-strength using seven dimensions of features: intensity of communication, use of intimacy language, duration of online ties, resources and information shared, common groups and communities, gifts or congratulations exchanged, and demographic similarity. The overall tie-strength score was computed as a linear combination of 70 individual features instantiating these dimensions. They found that the intimacy language dimension accounted for more than 30% of weight in the tie-strength score, whereas the most important individual features reflected the duration of communication between the two users.
A similar work, aimed at predicting the closeness of enterprise SN users, was conduct by Wu et al. (2010). They derived 60 predictive features for their model and split these into five categories: user who performed the activity, user receiving the feed, direct interaction between the two, indirect interaction through common friends, and distance between the two in the enterprise. The tie-strength score was computed as a linear combination of the features. Here, the dominant group of features was the direct interaction between the users, which accounted for 40–50% of weight, depending on the type of closeness being predicted. Jacovi et al. (2011) studied implicit indicators of interest of one user in another in an enterprise SN. They proposed four indicators that may signal interest: following the user, tagging the user in a people-tagging service, viewing content generated by the user, commenting on the user’s posts. Out of these, tagging was found to most strongly correlate with interest, followed by direct following.
Text and Content Factors
In addition to the tie-strength between the users, another fundamental predictor of interest is the content of (or, contributed by) the activity, which includes both the immediate text generated by the user and another auxiliary information, e.g., URLs, tags, user mentions, and so on. Paek et al. (2010) collected information on users’ perceived importance of feed entries and developed an ensemble model for predicting the binary importance of Facebook feed items. The model incorporated 50 features that were partitioned into three high-level groups: Facebook metadata (number of comments/views/likes, inclusion of URLs, and temporal information), textual contribution corresponding to the item, and background information (location, activities, interests, and more). The evaluation clearly highlighted the importance of the textual content of the feed items for the scoring model.
A similar model for ranking tweets on Twitter was developed and evaluated by Uysal and Croft (2011). They derived a set of predictive features, which were partitioned into four categories: reputation and activity of the tweet poster, inclusion of hashtags and user mentions, textual model of the tweet content, and past interactions between the recipient and the poster of the tweet. These categories of features were used individually as well as in combination, but the highest accuracy was demonstrated by the combined model. The included hashtags and mentions were found to be the top-performing category of features, whereas the performance of the textual content model was surprisingly poor (presumably, due to the very short and noisy nature of tweets).
Shen et al. (2013) proposed a method for personalized reordering of tweets. User interests were determined by analyzing the tweets published and consumed by users with respect to five parameters: freshness of the tweet, authority of the poster, length and inclusion of hashtags, match to the recipient’s interests, and interaction between the poster and recipient. A personalized ensemble model incorporating the features was trained and evaluated. The model outperformed a non-personalized model and simple temporal predictors, whereas the most important features were found to be the freshness of the tweet and the number of poster’s followers.
SN and Graph Factors
Considering that the value of textual content in Twitter-like microblogs is typically lower than in general-purpose SNs, Chen et al. (2012) proposed the incorporation of information pertaining to the structure of the SN user graph in predictive models. The authors devised a personalized tweet ranking model, which encapsulated a range of features that were categorized into four groups: graph-based similarity of the user nodes, relevance of the tweet content to the recipient, hashtags, and URLs included in the tweet, and the poster’s authority. These features were used to train a combined latent factor model, which was found to outperform several baseline models and the models exploiting the above groups of features individually.
The work of Feng and Wang (2013) also leveraged the graph-based representation of the Twitter graph to rank tweets. The nodes of the graph encapsulated the posters and recipient users as well as the tweets themselves, while the graph edges reflected the poster-recipient and recipient-tweet relationships. Additional features about the tweets (hashtags, URLs, age, popularity), users (similarity, mentions, reputation), and user-tweet relationships (content similarity, mentions, hashtags) were also considered. All the features were used to train a factorization model for predicting the probability of retweets. The accuracy of the model was high, while the importance of the poster-recipient and recipient-tweet relationship edges was found to dominate that of the poster and recipient nodes, highlighting the value encapsulated in the Twitter graph structure.
Yan et al. (2012) proposed a graph-theoretic model for tweet recommendations. The recommender leveraged a heterogeneous network model consisting of a graph of users and a graph of tweets. In both sub-graphs, the nodes represented the users and the tweets, respectively, while the edges reflected the degree of their similarity. The user-to-user similarity was established based on the commonality of followees, while the similarity of tweets was computed using their textual and semantic content. The nodes of the two sub-graphs were scored using the personalized PageRank algorithm, and then co-ranked, such that the tweet scores corresponded to the scores of their poster and retweeters, and vice versa. The model was evaluated using a very large corpus of retweets and the performance of the model was found to outperform several personalized ranking competitors.
Activity Feed Personalization
The TWD Online Portal
We now turn to the presentation of our feed personalization approach, which was deployed and evaluated within a live study of a diet and lifestyle intervention website, called the Online TWD portal. The goal of the portal was to support people embarking on a validated weight loss and maintenance program, the TWD diet (Noakes and Clifton, 2005). The portal contained dietary information, support tools, and a social component with typical SN functionalities. Figure 1 shows a coarse-grain layout of the portal’s front page. The static information presented included recipes (organized as per the content of the book, e.g., salads, chicken, beef, and deserts), exercises, menu plans, shopping lists, and links to additional health-related sites and material. The portal also included a suite of interactive tools aimed at supporting the TWD participants and strengthening their engagement with the portal, such as a meal planer and weight tracker. These provided to users real-time feedback on their decisions and their progress on the diet program (Freyne et al., 2011; Brindal et al., 2012).
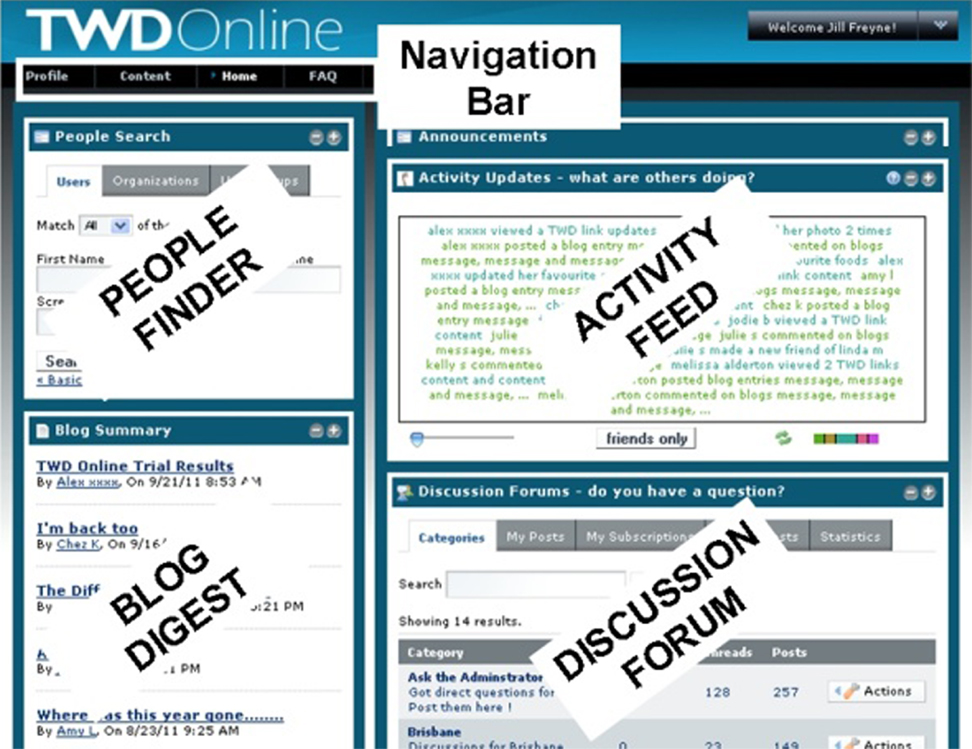
Figure 1. TWD online portal.
The goal of the SN component of the portal was to provide an online social support for program participants. Users registered for the portal were represented by a dedicated personal profile page, which contained some demographic information, an image gallery, a personal message board (wall) and a blog. Users were not issued with instructions on how the wall or the blog should be used as such they could freely contribute content as often as they wished on any topic they wished. Access to blogs was controlled by their respective owners. To facilitate community-based information sharing, the portal also contained a discussion forum open to all users. Here, users could ask questions, seek advice, provide support to others, and discuss ideas and thoughts with the community. The forum was moderated by domain experts, who responded to health-, exercise-, and nutrition-related questions raised by users.
Note that the SN of the Online TWD portal differed from other general-purpose SNs in a sense that it was not a familiarity-based SN. Indeed, most commercial SNs, such as Facebook or LinkedIn, reflect existing offline familiarity links; that is, online links and friendships mirror real-life links. On the contrary, Online TWD users were recruited online and had no offline familiarity with each other. Thus, the bootstrapping of the SN and the establishment of links between the users might have been slower than in general-purpose SNs. At the same time, this emphasized the importance of the TWD portal in supporting diet participants and strengthening their engagement with the diet through social learning and comparison, i.e., by exposing them to the thoughts and actions of other dieters. By highlighting activities, such as meal planning, weighing in, browsing recipes and exercises, and reading/writing blog posts, we aimed to persuade users to also carry out these activities (Fogg, 2003).
To this end, our portal included a dedicated SN activity feed, which aggregated the activities of other users with the portal, such as content being viewed, use of the support tools, content generation, and interactions taking place between the users (friending, commenting, and so on). The feed was displayed on the portal’s front page as a list of textual items corresponding to the observed SN activities. Feed items contained details of the user who performed the activity and the activity itself (or the content produced by the activity), as shown in Figure 2. Both the user and the activity were hyperlinked and could be clicked. By default, the feeds included 20 items, and the users had the opportunity to adjust the size of the feed. In practice, very few users utilized this feature such that we consider the size of the feed to be fixed across all the users for the entire duration of the study.
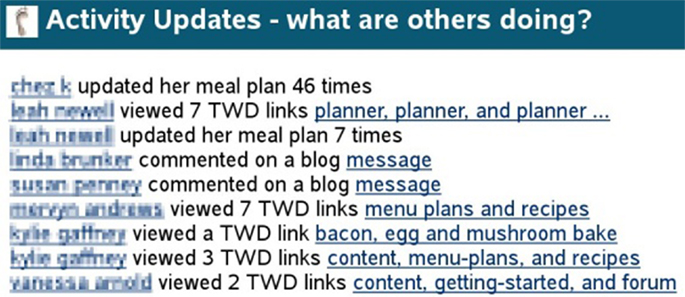
Figure 2. Social network activity feed.
Feed Personalization Mechanism
In this subsection, we outline the feed scoring and personalization mechanism. The feed presents to a target user ut a list of SN activities performed by other users. Each item ix included in the feed references two components: the subject user ux who performed the activity and the action ax that was performed (or the content resulting from performing ax), e.g., wall comments, forum posting, or content viewing. When the feed is visualized, both the name of ux and the action ax are hyperlinked, such that clicking on ux, i.e., user click, redirects the target user ut to the profile page of ux, whereas clicking on ax, i.e., action click, leads directly to the content viewed or contributed by the activity.
Our personalization mechanism assigns to each feed item a user-dependent relevance score S(ut, ix) that represents the predicted level of interest of the target user ut in item ix. We model S(ut, ix) as a linear combination of two parameters: a user-to-user score Su(ut, ux) and a user-to-action score Sa(ut, ax). These parameters are weighted in a linear manner according to their relative importance, ωu and ωa, respectively, as shown in Eq. 1:
We presume that feed items corresponding to activities of users with which ut has close online relationships, would attract more interest than feed items involving the actions of importance for ut, regardless of the user who conducted the actions. Hence, we parameterize the weights by static values of ωu = 0.8 and ωa = 0.2, which prioritize the activities performed by relevant users over relevant actions. The rationale of this weighting scheme is in line with several previous studies (Gilbert and Karahalios, 2009; Wu et al., 2010; Jacovi et al., 2011; Uysal and Croft, 2011; Feng and Wang, 2013; Shen et al., 2013).
The user-to-user relevance score Su(ut, ux) reflects the degree of closeness between the target user ut and the subject user ux, as derived from their observable online interactions. To compute this relevance score, we deploy a modified variant of the tie-strength model developed by Gilbert and Karahalios (2009) and adapt it according to the closeness factors and weighting schema proposed by Wu et al. (2010). It should be noted that some factors outlined in Wu et al. (2010) are restricted to the enterprise environment considered in that work and are inapplicable to the setting of the Online TWD portal. Thus, we consider in this work four categories of factors:
- User factors (UF) – online behavior and activity of the target user ut.
- Subject user factors (SUF) – online behavior and activity of the subject user ux.
- Direct interaction factors (DIF) – direct online interaction between ut and ux.
- Mutual connection interaction factors (MCIF) – indirect interaction between ut and ux, i.e., interactions between ut and {uy} and between ux and {uy}, where uy is a mutual friend of ut and ux.
Thus, the user-to-user relevance score Su(ut, ux) is computed as a weighted linear combination of the scores of these four categories of factors, as shown in Eq. 2:
As the functionality and the components of the SN presented in Wu et al. (2010) resemble those offered by the TWD Online portal, we assign to the scores of these four categories relative weights that are proportional to the original weights derived in Wu et al. (2010): ωuf = 0.178, ωsuf = 0.079, ωdif = 0.610, and ωmcif = 0.133.
The category scores Suf(ut, ux), Ssuf(ut, ux), Sdif(ut, ux), and Smcif(ut, ux) are computed as a combination of the scores of the individual factors belonging to each category. For the UF and SUF categories, we derived 26 factors that reflect the individual observable behavior of ut and ux. The behavior factors include the number of days they logged-in, number of pages they viewed, number of forum/blog/wall posts/threads/comments they added/deleted/viewed/rated, number of chat sessions they participated in, number of meals they planned, number of times they updated/viewed user profiles, number of images they viewed/updated, and more (see Table 1 for a complete list of UF and SUF factors). These factors are computed separately for the target user ut and for the subject user ux, and then weighted according to ωuf and ωsuf for the S(ut, ux) computation. Also, note that the weights of the factors are set a priori for the entire community of users and vary neither across the users nor over time. Adaptive setting of the factor weights was left beyond the scope of this work.
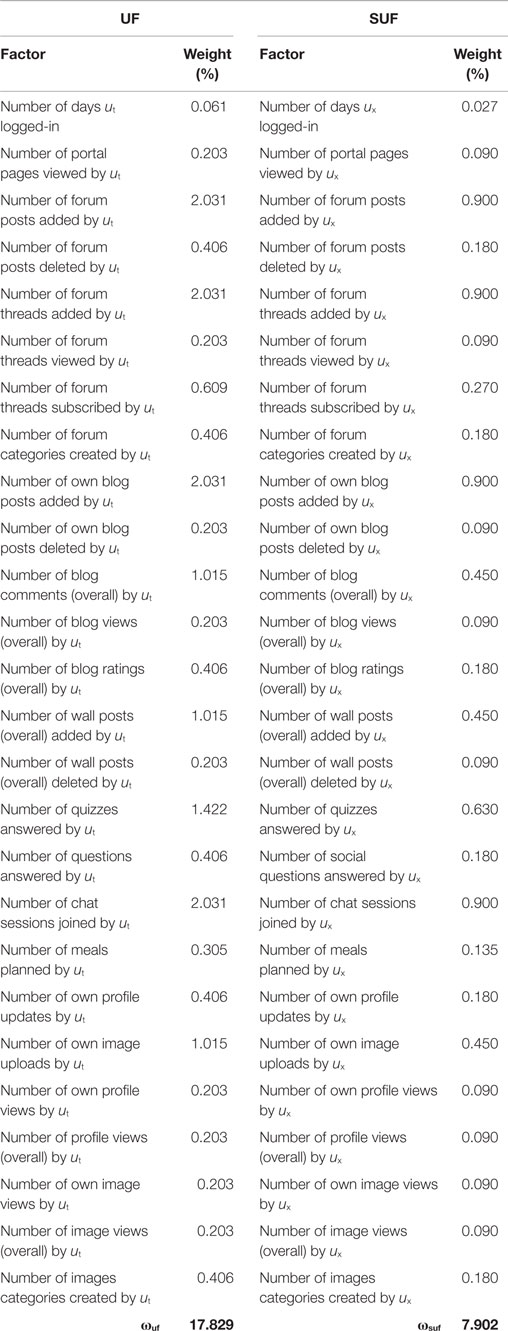
Table 1. Target and subject user factors and their weights.
Likewise, we derived 27 factors for the DIF and MCIF categories that, respectively, reflect the direct interaction between ut and ux, and their interaction with the set of mutual friends {uy}, i.e., other users friended by both ut and ux. The interaction factors include the direct friending, chat sessions, and blog subscription between the users, number of mutual/joint forum/blog/profile views/ratings/comments, number of appearances/selections in each other’s social comparison questions, number of joint friends, number of days the users interacted on the portal, number of days since friending and last interaction, and more (see Table 2 for a complete list of DIF and MCIF factors). It should be highlighted that for the MCIF factors, we compute individually the DIF factor scores for the user ut (or ux) and each of their mutual friends uy, and then average these across the entire set of mutual users {uy}. Eventually, the scores are weighted according to the parameters ωdif and ωmcif. Also, the weights of these factors were set a priori and were fixed for all the users and for the entire duration of the study.
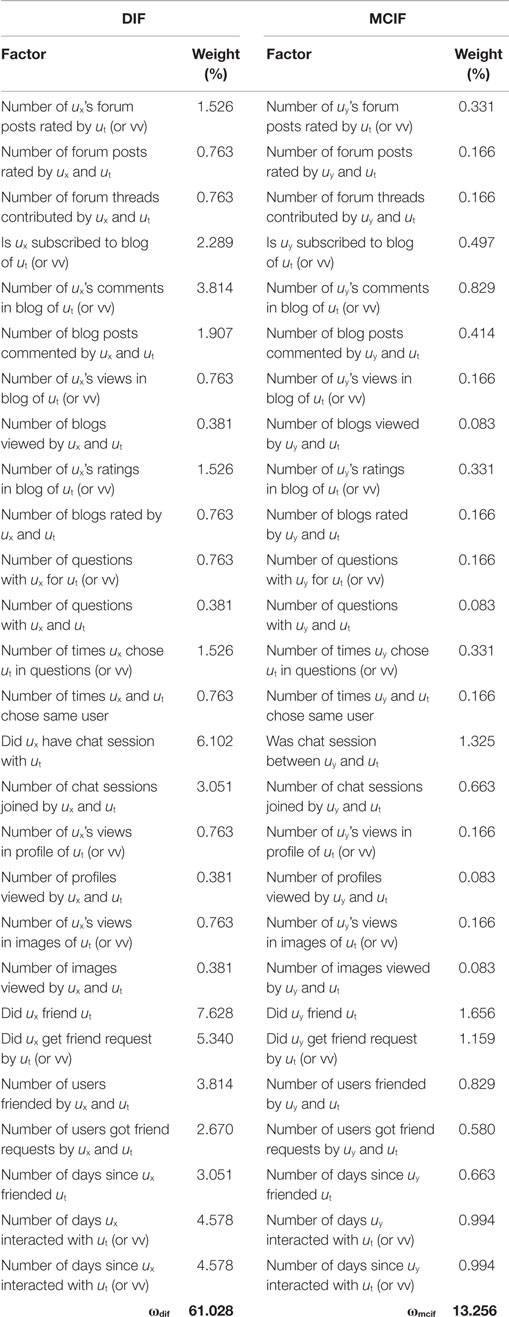
Table 2. Direct and mutual connection interaction factors and their weights.
Note that the factor scores are computed using the observed frequencies of user interactions with the TWD Online portal and other users, and then normalized to the [0,1] range. Specifically, the scores of the UF and SUF factors are normalized by dividing the observed frequency by the maximal frequency observed for the relevant action and any other user of the Online TWD portal. The scores of the DIF and MCIF factors, which involve multiple users, are normalized using Jaccard’s similarity coefficient. Also, note that the three most dominant factors in the personalization model: online friendship between the two users, friend request sent by one user to the other, and chat session between the two users, which account for, respectively, 7.628%, 5.340%, and 6.102% of the overall user-to-user score. All the three belong to the direct interaction group and naturally reflect the strength of the tie between the two users and the heavy weight assigned to ωdif.
We also calculate the user-to-action interest score Sa(ut, ax), which is rarely taken into consideration in other feed personalization works. Sa(ut, ax) reflects the importance of action ax for the target user ut and is informed by the frequency of ut (as well as the other users) performing the action ax and the frequencies of performing other actions (Bohnert et al., 2008). Specifically, we calculate the user-to-action relevance score Sa(ut, ax) as shown in Eq. 3. There, f(ut, ax) denotes the frequency of the user ut performing the action ax, f(ut,⋅) denotes the average frequency of all actions performed by ut, f(⋅, ax) is the average frequency of all the portal users performing ax, and f(⋅,⋅) is the average frequency of all actions performed by all users.
In a nutshell, this computation quantifies the relative importance of ax for ut and normalizes it by the relative importance of ax for all the portal users. The user-to-action score Sa(ut, ax) computed using and the user-to-user score Su(ut, ux) computed using Eq. 2 are finally aggregated into the overall feed item score S(ut, ix), as shown by Eq. 1. This scoring is performed for any candidate item for inclusion in the activity feed and items having the highest predicted scores are included in the feed. The items are shown in a decreasing order of scores, such that the highest-scoring items appear at the top of the feed.
Evaluation
More than 5000 individuals across Australia participated in the live evaluation of the TWD Online portal. The duration of the study was 12 weeks and it was conducted synchronously, such that all the users commenced and completed the study at the same time. The study mainly focused on health-related outcomes, such as weight loss, interactions with the portal, and user engagement with the diet. In this paper, we focus solely on the observed interaction of the users with the SN feeds. Details of user engagement and more general health-related trial outcomes can be found in Brindal et al. (2012).
At the beginning of the study, users were randomly assigned into one of two experimental groups: control group and personalized group. Users in the personalized group received personalized activity feeds, in which the items were scored as per the model described in Section “Activity Feed Personalization” and sorted in a decreasing order of relevance. In the non-personalized control group, the users were presented with chronologically ordered feeds, where the top items were the most recently occurred SN activities. In the first week of the study, the personalization was not applied and both groups were equal. We considered this period to be the bootstrapping of the SN, establishment of the portal interaction habits and social ties between the users, and initial content posting. At the end of the first week, all the behavior and interaction factors were computed and fed into the personalization model. Following this, the feeds of the users in the personalized group were scored and re-ranked. The scores of all the factors in the personalization model were dynamically re-computed on a nightly basis.
Feed Characterization
The overall level of user interaction with the feeds was lower than anticipated, with 167 users generating 679 feed clicks over the course of the study. Table 3 summarizes the number of unique users who interacted with the feed, i.e., clicked on feed items, number of sessions that included feed clicks, the number of logged clicks and their breakdown into the components selected (user clicks on the user who performed the activity and action clicks on the action that was carried out or the outcome of the action), and the user- and session-based click-through rates, CTRu and CTRs (Shani and Gunawardana, 2011). CTRu and CTRs were computed as the ratio between the number of clicks and the number of users and sessions, respectively. This metrics are compared for the groups of users that were exposed to the personalized and non-personalized feed.
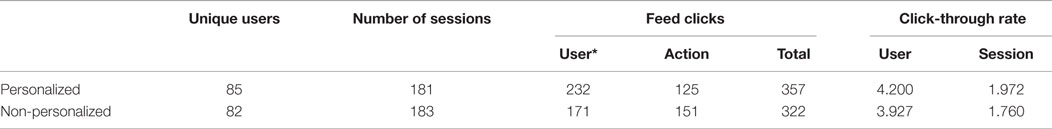
Table 3. Feed uptake statistics.
We note that users interacted with the personalized feeds slightly more than with the non-personalized: the overall number of clicks was 10.9% higher and the number of unique users was slightly higher, whereas the number of sessions involving feed clicks was comparable. Both the user- and the session-based click-through rates were higher for the personalized group (with more pronounced difference observed for CTRs), although the differences between the two groups were not statistically significant2. Out of the personalized clicks, the distribution between user clicks and actions clicks was 65.0% vs. 35.0%, whereas for the non-personalized clicks it stood at 53.1% vs. 46.9%. That is, users in the personalized group were more interested in the subject users who performed the activities than users in the non-personalized group. This should be attributed to the weighting mechanism of Eq. 1, assigning 80% of the overall weight to Su(ut, ux) and 20% to Sa(ut, ax). Breaking all the observed feed clicks into user clicks and action clicks, we note statistical difference between the groups with respect to user clicks.
Table 4 focuses on the actions corresponding to the feed items that were clicked by users and lists the six most popular actions in each group. As shown, the most popular actions were the same across the groups and their distribution was also very similar. The three most popular actions were content viewing, commenting on blog posts, and updating meal plans, which summed up to 70.6% and 71.1% of actions in the personalized and non-personalized groups, respectively. The next actions in both groups were recipe viewing, posting content in blogs, and commenting on forum posts. Altogether, these six actions account for a vast majority of actions of the clicked feed items – close to 93.8% of actions, both in the personalized and the non-personalized group.

Table 4. Clicked activities.
We also analyzed the sessions that included multiple feed clicks. For this analysis, we concentrated on sessions with three feed clicks or more, as an indicator of a strong user engagement with the feed. Overall, we observed 28 such sessions in the personalized group and 18 sessions in the non-personalized group. Figure 3 shows for each group the number of sessions, in which multiple feed clicks were observed. The number of clicks ranges from 3 to 11, with sessions with 12 clicks or more being aggregated in the last pair of bars. The number of sessions with multiple clicks in the personalized group was higher than in the non-personalized group for 4, 9, 10, and 11 clicks, the numbers were equal for 3, 6, and 8 clicks, and more sessions were observed in the non-personalized group for 7 and 12 or more clicks. This shows that feed personalization led to a stronger user engagement with the feed, especially in sessions with high number of clicks (eight and more), where the superiority of the personalized feeds was more pronounced.
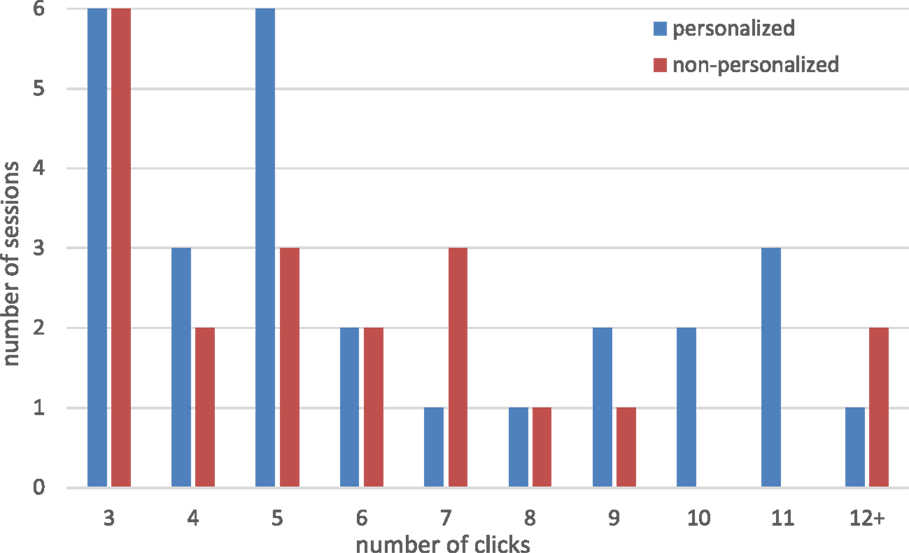
Figure 3. Number of sessions with multiple feed clicks.
Temporal Analysis
As discussed, the feeds were personalized from week 2 till the end of the study, whereas the data from the first week was used for the computation of the personalization model. Hence, it is of interest to analyze the evolution of the personalized feeds over time and compare it to the baseline behavior of the non-personalized feeds, which should not change over time.
We plot in Figure 4 the average weekly user-to-user score Su(ut, ux), user-to-action score Sa(ut, ax), and the overall score S(ut, ix) of the clicked feed items. These are shown for 8 weeks only: from week 2 to 9, since the volume of clicks for weeks 10, 11, and 12 was not sufficient for the analyses. A range of values of Su(ut, ux), Sa(ut, ax), and S(ut, ix) exists, such that the user and overall score values are shown on the left axis, while the action scores appear on the right axis. The user-to-action scores Su(ut, ux) of the clicked items steadily increase meaning that as more data becomes available to the personalization mechanism, the Su(ut, ux) computation becomes more reliable and activities performed by more relevant users are clicked. The observed user-to-action scores Sa(ut, ax) are stable over time. Since the overall item score S(ut, ix) is dominated by the user-to-user score (recall the 80–20% weight distribution in Eq. 1), the behavior of the overall item score resembles that of the user-to-action score and steadily increases over time.
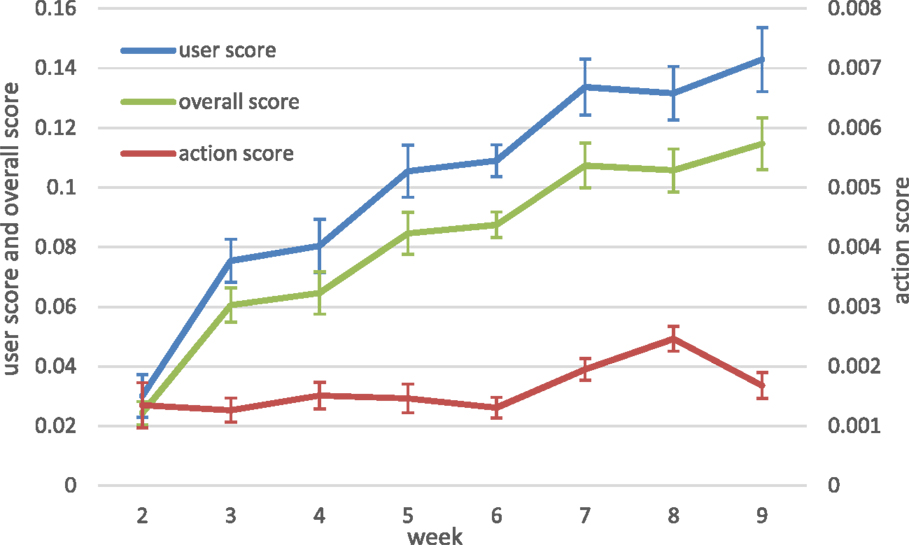
Figure 4. Average user, action, and overall score of the clicked items.
Another important dimension in the temporal analysis refers to the changes in the observed session-based click-through rate, CTRs. We focus here solely on CTRs since the difference between the groups with respect to CTRs were more pronounced than with CTRu (see Table 3). Figure 5 shows the average CTRs of the personalized and non-personalized feeds for weeks 2–9 of the study. Personalized feeds generally demonstrate higher CTRs than non-personalized feeds, with the differences between the two groups was more pronounced at weeks 7–9. This finding is in agreement with the observed overall uptake of the feeds toward the end of the study, when personalized feeds substantially outperformed the non-personalized feeds. Hence, users who were exposed to the personalized feeds discovered more content to engage with in the feeds, on a session basis, than the users exposed to non-personalized feeds.
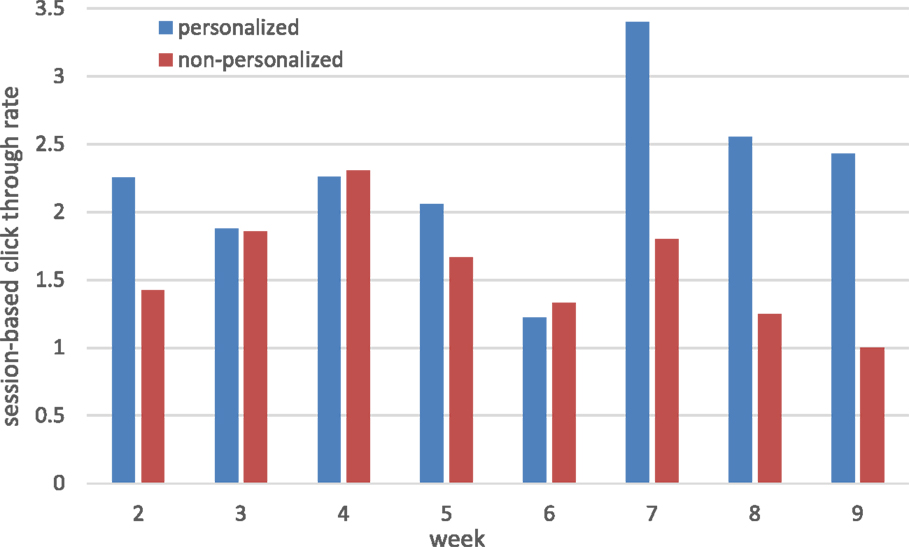
Figure 5. Session-based click-through rate.
Feed Ranking
We now turn to the analysis of the rank of the clicked items within the feed, i.e., the position of the selected feed items. The average rank of the clicked items in the personalized feeds was 4.35 in comparison to 5.66 in the non-personalized feeds (smaller numbers indicate higher ranks closer to the top of the feed) and the difference between the two was statistically significant, p < 0.05. Similarly to the previous evolution analysis, we computed the average rank of the clicked items observed for weeks 2–9 of the study. As shown in Figure 6, the personalized feeds consistently placed relevant items higher than the non-personalized feeds, with the difference between the groups being statistically significance, p < 0.01.
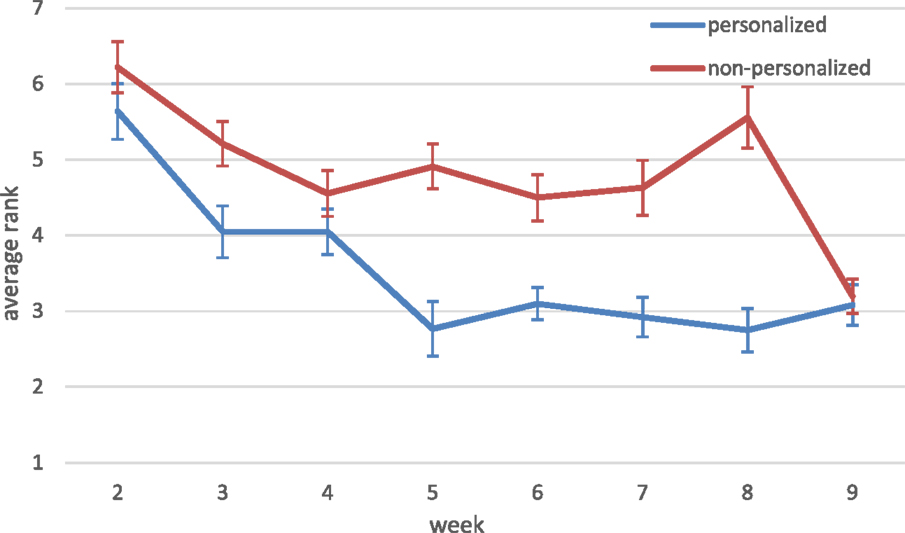
Figure 6. Average rank of clicked items.
We assessed the impact of feed personalization on the distribution of the clicked items. Figures 7 and 8 demonstrate the distribution of feed clicks observed for items in positions 1–15 in the feed for both groups: Figure 7 shows the probability density function (PDF) and Figure 8 – cumulative distribution function (CDF). Focusing on the PDF, we observe a strong dominance of the top two positions in the personalized feeds – they accounted for 29.2% and 15.2% of clicks each. Then we observe a decline in the clicks, such that items in positions 3–8 achieved about 7% of clicks each and items in further positions – only 2–3% each. However, the distribution is more balanced in the non-personalized feeds: top four positions account for 12–14% of clicks each, positions 5–9 – for 6–8% each, and then it decreases to 2–3% for further positions. Thus, users in the non-personalized group exhibited a comparable level of interest in a large group of items. On the contrary, in the personalized feeds we observed a stronger preference for items in the top positions.
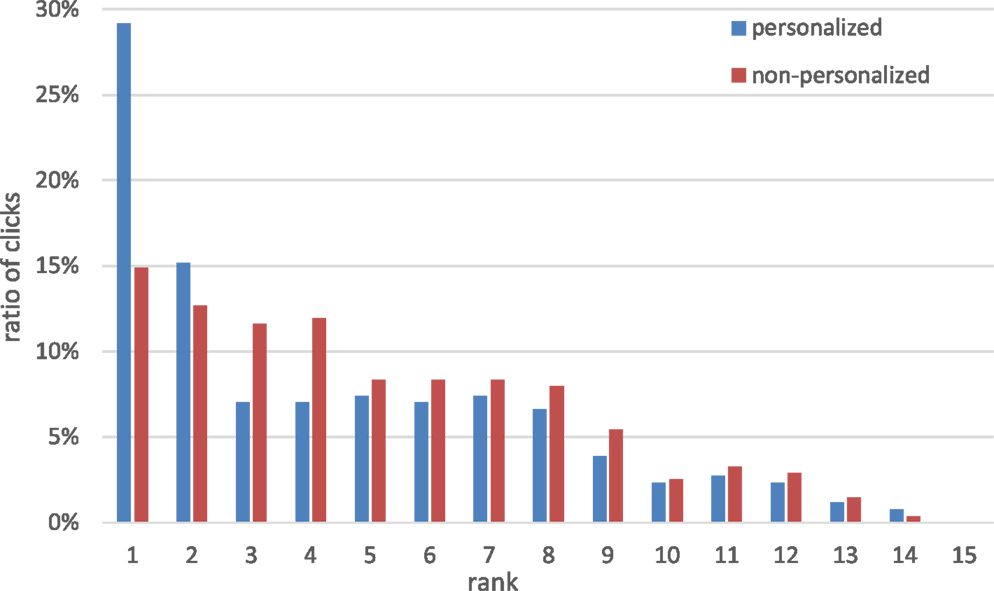
Figure 7. Rank of the clicked items: probability density function.
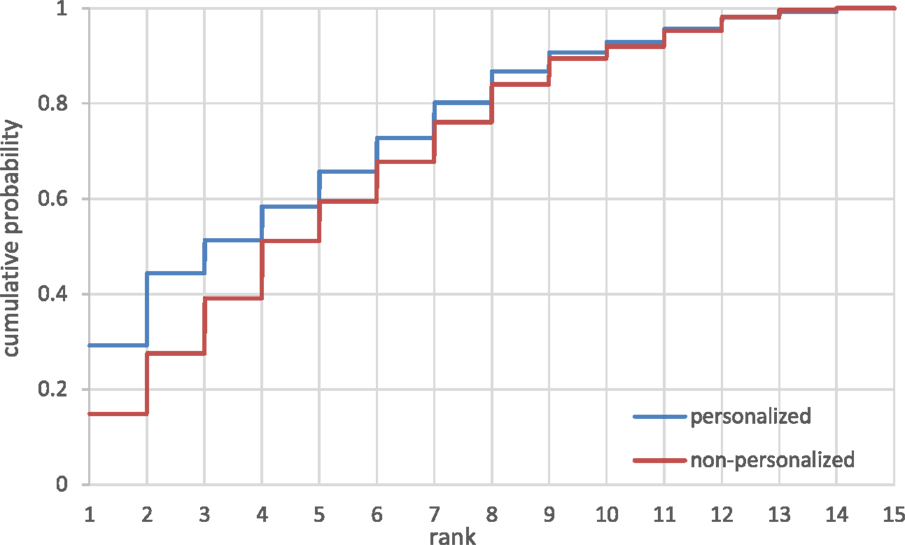
Figure 8. Rank of the clicked items: cumulative distribution.
This finding is supported also by the CDF plot shown in Figure 8. For example, the three highest positions in the personalized feeds accounted in summary for 51.4% of clicks, compared to 39.1% of clicks in the non-personalized feeds. The differences are less evident, although still noticeable, when progressing further down the feed, e.g., for the top 6 positions we observed 72.8% vs. 67.8% of clicks and for top 10 only 93.0% vs. 92.0%. The difference between the distributions observed in the two groups was statistically significant, p < 0.05. Interpreting the observed user clicks as implicit indicators of relevance, we conclude that the personalized feeds presented promoted relevant items to the top of the feed more effectively than the non-personalized feeds. The observed click distributions clearly show that users found items in the top positions in the personalized feeds more attractive than those in the non-personalized feeds.
Impact on User Activities
One of the goals of the activity feed, especially in the context of the portal, was to highlight activities of other portal users, in order to trigger social learning and encourage users to perform activities that others already perform. To understand the extent to which this was achieved, we examined the actions carried out by users in sessions, when they interacted with the feed. Focusing on the interactions with content, an important indicator of activity for SNs, we examined the number of blog and forum activities, wall posts, and user profile views, and wall posts observed in each session that also included feed interactions (see Table 5). Furthermore, we split the blog and forum activities into contribution activities (posting of posts, responding to posts of others) and consumption activities (viewing of posts), and split the profile views into views of the own user profile and views of profiles of other users (see Table 6).
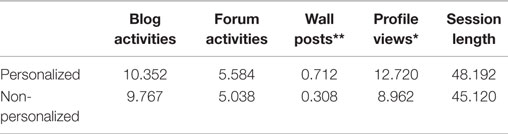
Table 5. Sessions with feed clicks: statistics.
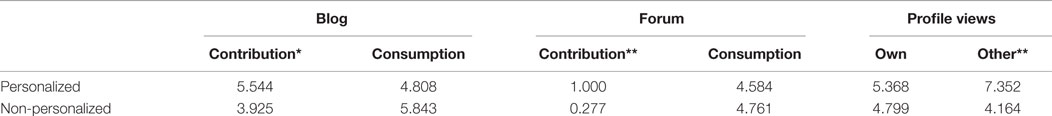
Table 6. Sessions with feed clicks: contribution vs. consumption.
As Table 5 indicates, the application of personalization to the feeds increased, although not significantly, from 45.1 to 48.2 activities, the overall length of user sessions. This was reflected by an increase in blog, forum, wall, and profile viewing activities. Of these, the increase in wall activities and profile viewing was statistically significant, p < 0.01 and p < 0.05, respectively. It should be noted that these two activities were not independent, as the wall was located on a user’s profile page, such that any wall post was necessarily preceded by a profile view. That said, <10% of profile views resulted in wall posts, showing that the majority of profile views were not a consequence of an intended wall posts. Furthermore, Table 6 clearly shows that significant increases in the contribution to blogs and forums, and in the views of other users’ profiles were observed in the personalized group. Thus, personalization was found to trigger an increased social interaction and to encourage contribution of user-generated content to blogs, walls, and forum.
Feeds and Friending
The proposed feed item scoring mechanism assigns more weight to activities of relevant users in general, and to activities of online friends in particular. To this end, we examined the interplay between online friending and feed clicks. Over the course of the study, more than 4500 online friendships were established, out of more than 9000 friend requests that had been initiated. This friendship rate may be lower than those observed in general-purpose SNs. However, it should be highlighted that our portal differs from the general-purpose SNs; indeed, the users are part of a health-driven virtual community and their links are not based on existing offline familiarity.
Figure 9 shows the portion of feed items corresponding to activities performed by online friends of the target user. In the personalized group, this was consistently higher than in the non-personalized group, and the difference between the groups was statistically significant, p < 0.01. Notably, the portion of friend activities in the feed steadily increased over time for both the personalized and non-personalized group, such that in weeks 8 and 9 more than 50% of activities included in the personalized feeds were performed by online friends, whereas in the non-personalized feeds it hovered around the 25% mark. We hypothesize that this finding should be attributed to the higher density of the SN graph toward the end of the study: less users remained active and more friendship links were established at the later stages, such that the portion of feed activities performed by online friends naturally increased in both groups. On top of this, recall the high weights assigned to the direct friendship link established between the users and the friendship request sent by one user to the other, and the dominance of friends’ activities in the personalized feeds becomes clear.
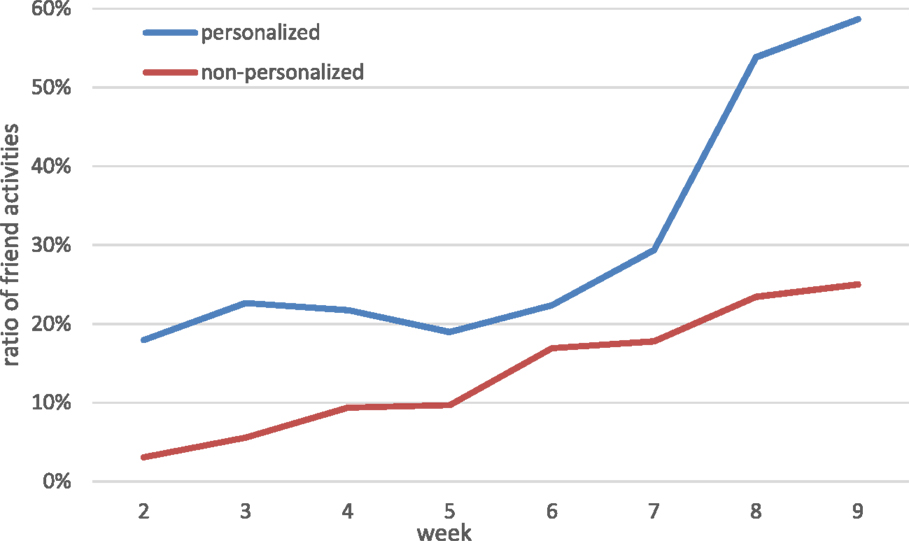
Figure 9. Ratio of friend activities in the feeds.
Overall, in 32.1% of clicks in the personalized feeds, the target and subject user established an online friendship over the course of the study, whereas in the non-personalized feeds, this was observed in 27.4% of clicks. We also attribute this to the weight assigned to the friendship between the users, which brought the actions of friends to the top of the feed. Figure 10 further details this analysis and shows the distribution of time between the clicks on activities of friends and the establishment of the friendship, as observed for both groups. We observe two dominant windows: in the personalized feeds 57.7% of friendship links were established more than 1 day before the click and 30.8% within 1 hour of the click, whereas in the non-personalized feeds, the corresponding numbers were 38.9 and 40.3%. This means that the majority of clicks in the personalized feeds were on activities performed by existing online friends and about 30% of clicks were likely to trigger new friendships. On the contrary, in the non-personalized feeds both the activities of existing friends and of those users who were friended shortly after the click accounted for about 40% of clicks. That is, activities of online friends were of relevance for the target user, but the lack of personalization required users to look these up in the feed. This exploration was found to boost the post-click friending rate, which was higher than in the personalized group.
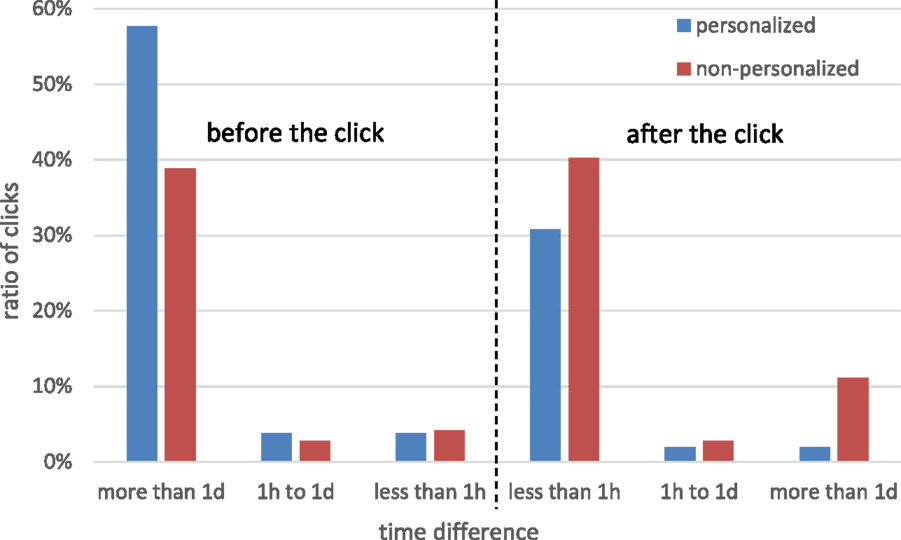
Figure 10. Time difference between feed clicks and establishment of friendship.
Conclusion and Discussion
This work was motivated by the information overload problem in SNs, which is exacerbated by the simplistic nature of activity feeds. We suggested that the problem can be addressed through the application of personalization to feeds, which has the potential to identify activities of particular interest for the feed recipient. To this end, we developed a model for personalized predictions of the relevance of feed items and applied this model to generate personalized feeds for the users of the Online TWD portal. The model incorporated a suite of observable features, primarily corresponding to the online activity of users and the level of their direct and indirect interaction. In this paper, we report on a thorough evaluation of the uptake and evolution of the personalized feed and its impact on the contribution of user-generated content and user interactions with the portal and other users.
The results show that the overall uptake of the personalized feeds was higher than of the non-personalized feeds. The most pronounced difference was observed for the clicks on users who performed the activities. Focusing on the evolution of the personalized feeds, we noted that over time they attracted clicks on activities performed by closer users, as more and more information facilitating accurate predictions was available to the model. We also observed session-based click-through rates of the personalized feeds outperforming those of the non-personalized feeds, especially toward the end of the study, when the SN became denser. Turning to the rank of the clicked items, we observed that the clicked items in the personalized feeds were ranked higher, i.e., closer to the top of the feed, than in the non-personalized feeds. That is, personalization successfully promoted relevant activities to re-organize the feed, assisting the users in accessing activities and people of interest.
We also investigated the impact of personalization on the observed SN activities, content contribution, and online friending. We found that the personalization notably increased the contribution of user-generated content; in particular, of blog and wall posts. Also, it increased the volume of profile viewing activities, specifically, of viewing profiles of other users. Not only the viewing was boosted but also an increase in online friending was triggered by the feeds. The personalized feeds were found to highlight the activities performed by online friends, while not limiting user awareness of the activities of other SN users. Hence, the application of personalization to activity feeds had a prolific impact on user engagement and content contribution, playing an important role in the sustainability of the social features of the Online TWD portal.
Considering the features used by the personalization model, we highlight the importance of strength of the user-to-user relationships. Although some insight can be obtained from the established SN links and friendship, a more fine-grained tie-strength quantification can be derived from their observable SN interactions, e.g., viewing contributed content, mentioning each other, sending direct messages, or even interacting with the same set of users. Being able to extrapolate the strength and context of relationships between users is a valuable means for not only filtering untrusted users from the feeds but also highlighting specific activities or content contributions, in order to satisfy the differences in user interests.
It should be noted that neither the textual content of the posts nor the network structure were exploited by our personalization model (Berkovsky and Freyne, 2015). The textual content of the posts was discarded primarily due to the fact that the majority of user activities in the Online TWD portal refer to content contribution rather than to content consumption, which is in line with trends observed on larger general-purpose SNs (Muller et al., 2009). The absence of network structure features is explained by the small scale and relative sparsity of the friendship graph, as the SN of the Online TWD portal differed from the usual familiarity-based SN. However, we note the great potential of features reflecting the network structure, which can be projected onto the reputation or authority of users, or their salience on the SN.
Another issue that deserves attention is the applicability of the feed personalization mechanism to other (and particularly general-purpose) SNs. Although this has not been done yet, we would like to point out two works that applied similar techniques. In Freyne et al. (2010) a similar personalization model was applied to IBM’s enterprise SN. Similarly to our work, this feed personalization incorporated user-to-user and user-to-action scores as the key relevance predictors. The evaluation focused on the temporal dimension and concluded that short-term models were suitable for the user-to-user relevance, whereas long-term were more appropriate for the user-to-action relevance. Another similar application of feed personalization was done in (Agarwal et al., 2015), where LinkedIn activity feeds were personalized. In addition to the above two relevance predictors, their model also included the fine-grained user-to-user-and-action score, reflecting the interest of the feed recipient in a specific action of a specific user. The evaluation found that each of these factors, deployed individually and exposed to a large number of users, caused a moderate improvement in the observed click-through rate. The greatest improvement was obtained when deploying the user-to-user relevance predictor. Nevertheless, broader applicability of feed personalization to other SNs and application domains still remains unclear.
In the context of SN activity feeds, an important consideration pertaining to their uptake is their contribution to the filter bubble (Pariser, 2011), i.e., situation where due to the SN information filtering some users may become isolated from cultural or ideological circles different to their opinions. This is unacceptable from an ethical perspective and SNs should strike a balance between personalizing feeds and promoting information exploration by their users. The feeds may also pose a privacy threat, as they may inadvertently expose potentially sensitive information about user activities to the user’s social circles, which can potentially be accessed by untrusted parties or malicious users, and then be used inappropriately. Hence, user privacy considerations and privacy-preserving mechanism should also be taken into account when filtering SN feeds (Xu et al., 2010).
All in all, we feel that the research into SN feed personalization is still in its infancy. Several solid algorithmic techniques have been developed and evaluated thus far. However, much of the feed personalization work focuses on the accuracy of identifying relevant posts, little work considers the user needs associated with the personalized feeds. SN designers should keep in mind that SNs are, in essence, user-facing systems (Burke et al., 2010). Hence, more attention should be devoted to user aspects of feed personalization, including what do users find valuable; what should the presentation mode be; how do users prefer to interact with the feed (Wang et al., 2014). We believe that there is ample space for research into interfaces, visualizations, and control mechanisms that can make user interactions with personalized feeds more intuitive and productive, and we conjecture that these topics will receive an increased attention in the future.
Conflict of Interest Statement
The authors declare that the research was conducted in the absence of any commercial or financial relationships that could be construed as a potential conflict of interest.
Footnotes
- ^Facebook Statistics, available at: http://newsroom.fb.com/company-info/
- ^All statistical significance results hereafter refer to a two tailed t-test assuming equal distribution. In the comparative tables, we mark significance (p < 0.05) with * and strong significance (p < 0.01) with **.
References
Agarwal, D., Chen, B. C., He, Q., Hua, Z., Lebanon, G., Ma, Y., et al. (2015). “Personalizing LinkedIn feed,” in Proceedings of the 21th ACM SIGKDD International Conference on Knowledge Discovery and Data Mining (ACM), 1651–1660.
Berkovsky, S., and Freyne, J. (2015). “Personalized network activity feeds: finding needles in the haystacks,” in Mining, Modeling, and Recommending ‘Things’ in Social Media (Springer International Publishing), 21–34.
Berkovsky, S., Freyne, J., Kimani, S., and Smith, G. (2011). “Selecting items of relevance in social network feeds,” in Proceedings of UMAP (Girona).
Berkovsky, S., Freyne, J., and Smith, G. (2012). “Personalized network updates: increasing social interactions and contributions in social networks,” in Proceedings of UMAP (Montreal).
Bohnert, F., Zukerman, I., Berkovsky, S., Baldwin, T., and Sonenberg, E. (2008). “Using collaborative models to adaptively predict visitor locations in museums,” in Proceedings of AH (Hannover).
Bontcheva, K., and Rout, D. P. (2012). Making sense of social media streams through semantics: a survey. Semant Web 1, 1–31. doi: 10.3233/FSW-130110
Brindal, E., Freyne, J., Saunders, I., Berkovsky, S., Smith, G., and Noakes, M. (2012). Features predicting weight loss in overweight or obese participants in a web-based intervention: randomized trial. J. Med. Internet Res. 14. doi:10.2196/jmir.2156
Burke, M., Marlow, C., and Lento, T. (2010). “Social network activity and social well-being,” in Proceedings of the SIGCHI Conference on Human Factors in Computing Systems (ACM), 1909–1912.
Chen, J., Nairn, R., Nelson, L., Bernstein, M. S., and Chi, E. H. (2010). “Short and tweet: experiments on recommending content from information streams,” in Proceedings of CHI (Atlanta, GA).
Chen, K., Chen, T., Zheng, G., Jin, O., Yao, E., and Yu, Y. (2012). “Collaborative personalized tweet recommendation,” in Proceedings of the 35th International ACM SIGIR Conference on Research and Development in Information Retrieval (ACM), 661–670.
Das Sarma, A., Das Sarma, A., Gollapudi, S., and Panigrahy, R. (2010). “Ranking mechanisms in twitter-like forums,” in Proceedings of the Third ACM International Conference on Web Search and Data Mining (ACM), 21–30.
De Choudhury, M., Counts, S., and Czerwinski, M. (2011). “Identifying relevant social media content: leveraging information diversity and user cognition,” in Proceedings of the 22nd ACM Conference on Hypertext and Hypermedia (ACM), 161–170.
Duan, Y., Jiang, L., Qin, T., Zhou, M., and Shum, H. Y. (2010). “An empirical study on learning to rank of tweets,” in Proceedings of the 23rd International Conference on Computational Linguistics (Association for Computational Linguistics), 295–303.
Feng, W., and Wang, J. (2013). “Retweet or not?: personalized tweet re-ranking,” in Proceedings of the Sixth ACM International Conference on Web Search and Data Mining (ACM), 577–586.
Fogg, B. J. (2003). Persuasive Technology: Using Computers to Change What We Think and Do. Morgan Kaufmann Publishing.
Freyne, J., Berkovsky, S., Baghaei, N., Kimani, S., and Smith, G. (2011). “Personalized techniques for lifestyle change,” in Artificial Intelligence in Medicine (Berlin, Heidelberg: Springer), 139–148.
Freyne, J., Berkovsky, S., Daly, E. M., and Geyer, W. (2010). “Social networking feeds: recommending items of interest,” in Proceedings of the Fourth ACM Conference on Recommender Systems (ACM), 277–280.
Gilbert, E., and Karahalios, K. (2009). “Predicting tie strength with social media,” in Proceedings of the SIGCHI Conference on Human Factors in Computing Systems (ACM), 211–220.
Huang, H., Zubiaga, A., Ji, H., Deng, H., Wang, D., Le, H. K., et al. (2012). “Tweet ranking based on heterogeneous networks,” in Proceedings of COLING (Mumbai).
Hurlock, J., and Wilson, M. L. (2011). “Searching twitter: separating the tweet from the chaff,” in ICWSM, 161–168.
Jacovi, M., Guy, I., Ronen, I., Perer, A., Uziel, E., and Maslenko, M. (2011). “Digital traces of interest: deriving interest relationships from social media interactions,” in ECSCW 2011: Proceedings of the 12th European Conference on Computer Supported Cooperative Work, 24–28 September 2011, Aarhus Denmark (London: Springer), 21–40.
Lage, R., Denoyer, L., Gallinari, P., and Dolog, P. (2013). “Choosing which message to publish on social networks: a contextual bandit approach,” in 2013 IEEE/ACM International Conference on Advances in Social Networks Analysis and Mining (ASONAM), (IEEE), 620–627.
Muller, M. J., Freyne, J., Dugan, C., Millen, D. R., and Thom-Santelli, J. (2009). “Return on contribution (ROC): a metric for enterprise social software,” in ECSCW 2009 (London: Springer), 143–150.
Paek, T., Gamon, M., Counts, S., Chickering, D. M., and Dhesi, A. (2010). “Predicting the importance of newsfeed posts and social network friends,” in Proceedings of AAAI (Atlanta, GA).
Shani, G., and Gunawardana, A. (2011). “Evaluating recommendation systems,” in Recommender Systems Handbook (Springer), 257–297.
Shen, K., Wu, J., Zhang, Y., Han, Y., Yang, X., Song, L., et al. (2013). Reorder user’s tweets. ACM Trans Intell Syst Technol 4, 6. doi:10.1145/2414425.2414431
Susarla, A., Oh, J., and Tan, Y. (2012). Social networks and the diffusion of user-generated content: evidence from youtube. Inf Syst Res 23, 23–41. doi:10.1287/isre.1100.0339
Uysal, I., and Croft, W. B. (2011). “User oriented tweet ranking: a filtering approach to microblogs,” in Proceedings of the 20th ACM International Conference on Information and Knowledge Management (ACM), 2261–2264.
Wang, B., Sun, Y., Tang, C., and Liu, Y. (2014). “A visualization toolkit for online social network propagation and influence analysis with content features,” in Proceedings of ICOT (Xian).
Wu, A., DiMicco, J. M., and Millen, D. R. (2010). “Detecting professional versus personal closeness using an enterprise social network site,” in Proceedings of the SIGCHI Conference on Human Factors in Computing Systems (ACM), 1955–1964.
Xu, H., Parks, R., Chu, C. H., and Zhang, X. L. (2010). “Information disclosure and online social networks: from the case of Facebook news feed controversy to a theoretical understanding,” in AMCIS, 503.
Keywords: social network feed, feed personalization, online evaluation, user engagement, content contribution
Citation: Berkovsky S and Freyne J (2015) Personalized social network activity feeds for increased interaction and content contribution. Front. Robot. AI 2:24. doi: 10.3389/frobt.2015.00024
Received: 21 July 2015; Accepted: 15 September 2015;
Published: 12 October 2015
Edited by:
David Balduzzi, ETH Zurich, SwitzerlandReviewed by:
Seyed Mohammad Hadi Daneshmand, ETH Zurich, SwitzerlandUtkarsh Upadhyay, Max Planck Institute for Software Systems, Germany
Copyright: © 2015 Berkovsky and Freyne. This is an open-access article distributed under the terms of the Creative Commons Attribution License (CC BY). The use, distribution or reproduction in other forums is permitted, provided the original author(s) or licensor are credited and that the original publication in this journal is cited, in accordance with accepted academic practice. No use, distribution or reproduction is permitted which does not comply with these terms.
*Correspondence: Shlomo Berkovsky, Digital Productivity Flagship, CSIRO, PO Box 76, Epping, NSW 1710, Australia, shlomo.berkovsky@csiro.au