MAP-Elites Enables Powerful Stepping Stones and Diversity for Modular Robotics
 Jørgen Nordmoen
 Frank Veenstra
 Kai Olav Ellefsen
 Kyrre Glette
- 1Department of Informatics, University of Oslo, Oslo, Norway
- 2RITMO, University of Oslo, Oslo, Norway
In modular robotics modules can be reconfigured to change the morphology of the robot, making it able to adapt to specific tasks. However, optimizing both the body and control of such robots is a difficult challenge due to the intricate relationship between fine-tuning control and morphological changes that can invalidate such optimizations. These challenges can trap many optimization algorithms in local optima, halting progress towards better solutions. To solve this challenge we compare three different Evolutionary Algorithms on their capacity to optimize high performing and diverse morphologies and controllers in modular robotics. We compare two objective-based search algorithms, with and without a diversity promoting objective, with a Quality Diversity algorithm—MAP-Elites. The results show that MAP-Elites is capable of evolving the highest performing solutions in addition to generating the largest morphological diversity. Further, MAP-Elites is superior at regaining performance when transferring the population to new and more difficult environments. By analyzing genealogical ancestry we show that MAP-Elites produces more diverse and higher performing stepping stones than the two other objective-based search algorithms. The experiments transitioning the populations to new environments show the utility of morphological diversity, while the analysis of stepping stones show a strong correlation between diversity of ancestry and maximum performance on the locomotion task. Together, these results demonstrate the suitability of MAP-elites for the challenging task of morphology-control search for modular robots, and shed light on the algorithm’s capability of generating stepping stones for reaching high-performing solutions.
1 Introduction
Contemporary research in robotics commonly investigates how to adapt the controllers of robots when exposed to damage or changing environments. These studies usually consider robots with a fixed morphology. In modular robotics, morphological adaptation is achieved through the reconfiguration of modules (Yim et al., 2007). With this approach, different morphological configurations can accommodate various tasks and environments (White et al., 2005). However, the possible combinations of modules and control strategies are vast, giving rise to a nontrivial design challenge.
The field of Evolutionary Robotics (ER) approaches this challenge by applying Evolutionary Algorithms (EAs) to design and adapt both control and morphology of robots. EAs have been successfully applied to modular robot design and control (Hornby et al., 2003; Marbach and Ijspeert, 2004; Faíña et al., 2013) although they are prone to premature convergence (Cheney et al., 2016). Premature convergence is the phenomenon of having most, or all, solutions in the population converge to local optima, and the prospect of escaping these are difficult without sufficient diversity in the population (Hornby, 2006). This challenge is compounded when evolving modular robots due to the connection between controller optimization and morphology. In one relevant study, Faíña et al. (2013) observe a high degree of deceptiveness in the search landscape when evolving modular robots, leading standard EAs to underperform. In addition, with the available variation operators, such as adding a module, one may easily invalidate the current control strategy (Cheney et al., 2016).
Overcoming challenges in modular robotics require optimization algorithms that can evolve high performing solutions while retaining morphological diversity to avoid premature convergence in the resulting deceptive fitness landscapes. While little research exists so far on this challenge in the context of modular robotics, proposed approaches include a custom constructive approach (Faíña et al., 2013), morphological protection mechanisms (Cheney et al., 2018), or introducing a controller learning phase for new morphologies (Jelisavcic et al., 2019). These techniques essentially allow the morphology and control to change on different time scales.
Recent advances in ER are based on promoting phenotypic diversity in the search process. One simple but powerful way to achieve this is by making phenotypic difference in the current population an additional objective to maximize (Mouret and Doncieux, 2009). This multi-objective approach utilizes traditional Multi-Objective Evolutionary Algorithms (MOEAs) where one objective is the traditional performance value and another objective is added to represent the diversity of solutions (Mouret, 2011). Quality Diversity (QD) is an emerging paradigm within the field of EAs (Pugh et al., 2016). This class of algorithms go beyond the singular focus on maximizing one or more objectives and instead actively construct a repertoire of phenotypically unique and high-performing solutions (Cully and Demiris, 2017).
QD algorithms differentiate solutions based on phenotypic properties, also called behavioral descriptors, which dictate the inclusion into an archive. The most popular variants of QD algorithms are Novelty Search with Local Competition (NSLC) (Lehman and Stanley, 2011), which uses an unstructured archive, and Multi-dimensional Archive of Phenotypic Elites (MAPElites) (Mouret and Clune, 2015), which uses a structured archive: an N-dimensional grid spanning the behavioral descriptor space. Focusing on novelty instead of fitness alone has shown to find solutions in deceptive fitness landscapes (Lehman and Stanley, 2008), and QD algorithms have successfully been applied to evolve diversity of virtual creatures (Lehman and Stanley, 2011). In Miras et al. (2018a), a morphological novelty measure was included in a composite fitness function when evolving modular robots. However, the study focused on the diversity of the resulting morphologies, and locomotion performance was negatively affected compared to pure performance-based fitness function. Consequently, the application of a complete QD approach to tackle the above-mentioned challenges of evolving morphology and control for modular robots warrants exploration.
One potential reason for the efficacy of QD algorithms is the notion that QD algorithms are better at promoting and exploiting stepping stones (Mouret and Clune, 2015). In the context of EAs, we can describe a stepping stone, in its most basic form, as an intermediate step to a final solution (Mouret, 2020). In that way, a stepping stone does not need to have any other quality apart from being in the genealogical ancestry of the concluding solution. However, literature suggests that stepping stones to a complex and high-performing solution may consist of a range of very different solutions, seemingly unrelated to the objective (Secretan et al., 2011; Woolley and Stanley, 2011; Stanley and Lehman, 2015). In Mouret and Clune (2015) the authors propose that MAP-Elites is better at finding high performing solutions because the search algorithm is better at promoting diverse stepping stones. Another comparison of QD algorithms and objective-based search for the generation of stepping stones can be found in Gaier et al. (2019). Here the authors argue that due to the ability of MAP-Elites to protect poor, but ‘novel’ solutions, that can later be built upon to become good solutions, it is able to overcome premature convergence experienced with the objective-based approach. This suggests that analysing the potential of QD algorithms for generating stepping stones could be a way to increase our knowledge about this class of search algorithms and help explain the difference between QD algorithms and objective-based search methods.
Building on our initial study in Nordmoen et al. (2020b), this paper compares three EAs on their ability to evolve high performing and morphologically diverse modular robots. We utilize two objective-based search algorithms, one without a diversity objective and one with a diversity objective, and the QD algorithm MAP-Elites (Mouret and Clune, 2015) to illuminate the difference between these two paradigms as applied to the modular robotics domain. Our goal is to understand how the morphological difference evolved with these three search algorithms affect the task, when the environment changes and different morphological needs arise. Furthermore, to understand the algorithmic differences, we present an analysis of the genealogical ancestry of the evolved populations to shed light on the hypothesis that QD algorithms perform better due to a difference in how stepping stones are generated and utilized. To achieve the stated goals we created a new modular robotics framework Robotics, Evolution and Modularity (REM) which is used to simulate and evolve the modular robots for this paper.
The contributions of our paper are three-fold: First we demonstrate that MAP-Elites is well suited for the difficult task of evolving both morphology and control in modular robotics. By extending our previous results, we show that differing the selection pressure can have a large impact on maximum fitness obtained for this QD algorithm. We expand on the performance results by transitioning the populations of the three search algorithms between two different environments showing that as environmental complexity grows, the necessity for morphological diversity increases. Secondly, we present a way of analysing the genealogical ancestry of all three algorithmic approaches to better understand how properties of the ancestry can help explain the differences in maximum fitness. By looking at the statistical properties of the ancestry we gain the ability to generalize over all experimental runs which increases the confidence in our results. Finally, in addition to the two previous contributions, we release a new framework for evolving modular robotics, the REM framework, which leverages OpenAI Gym and PyBullet to achieve fast and easy to extend simulations, opening modular robotics up to a wider machine learning audience.
1.1 Related Work
1.1.1 Modular Robotics
Evolving body and control for artificial creatures have a long history in the field of Artificial Life (Sims, 1994). Modular robotics is distinguished from these virtual creatures by comprising the morphology of re-usable homogeneous or heterogeneous building blocks, called modules (Stoy et al., 2010; Moubarak and Ben-Tzvi, 2012). This is in contrast to virtual creatures where individual body parts can evolve to have any shape and size. By using these building blocks, modular robotics provide a way to effectively transition from simulation to reality as modules can be fabricated individually and then combined based on designs optimized in simulation (Stoy, 2006). By designing modules in such a way as to make them easy to build in the real world, modular robotics offers a great deal of freedom for optimization in simulation since simulated robots can easily be put together from pre-built parts and transitioned to the real world for performance verification (Moreno et al., 2017). Through reusing modules and recent advances for potentially auto-assembling modular robots (Brodbeck et al., 2015; Moreno et al., 2018; Hale et al., 2019), this approach can become more feasible since the robot does not need to be constructed from the ground up.
One challenge in modular robotics is the interconnected relationship between control and morphology (Lipson and Pollack, 2000; Cheney et al., 2016). To overcome this challenge many different approaches such as generative encodings (Hornby et al., 2003; Veenstra et al., 2017) and different control architectures (Marbach and Ijspeert, 2005; Haasdijk et al., 2010) have been applied.
1.1.2 Quality Diversity
QD algorithms emerged from the realization that optimization through promoting phenotypic diversity can yield high performing solutions and, more importantly, can be better suited to exploring the whole problem space (Lehman and Stanley, 2008). Through actively searching for phenotypic diversity, QD algorithms traverse the search space without constraining the search to only finding better-fit solutions (Pugh et al., 2016). This separates QD algorithms from traditional MOEAs since Pareto dominated solutions can be kept as long as their phenotypic expression is sufficiently different from other solutions in the population (Mouret and Clune, 2015). An interesting property of QD algorithms is the capability to produce a repertoire of different solutions for the same problem (Cully and Demiris, 2017). The repertoire can be exploited, either at design time (Gaier et al., 2017) or during operation (Cully et al., 2015), to select different solutions depending on the circumstances of the situation.
Although QD algorithms have been applied to the evolution of artificial creatures (Lehman and Stanley, 2011) and morphological descriptors have been used to evolve robots (Samuelsen and Glette, 2014; Samuelsen and Glette, 2015) few examples exist applying the QD paradigm to modular robotics. A related area of inspiration is voxel-based soft robotics (Hiller and Lipson, 2012). Several works have explored soft robot design with QD algorithms such as Methenitis et al. (2015) which first applied novelty search, Gravina et al. (2018) which combines novelty- and surprise search and Gravina et al. (2019) which compares different forms of diversity with MAP-Elites in the soft robotics domain.
2 Materials and Methods
2.1 Robotics, Evolution and Modularity Framework
For our experiments we created a new simulation framework based on PyBullet (Coumans and Bai, 2016) and OpenAI Gym (Brockman et al., 2016), called Robotics, Evolution and Modularity (REM).1 PyBullet is the Python interface to the Bullet (Coumans, 2015) physics simulator and OpenAI Gym is a framework to standardize simulations, initially within the reinforcement learning domain, that prescribes a few necessary functions that together create and run a simulation. OpenAI Gym makes it easy to reproduce setups from different experiments through exposing multiple environments through a common interface. Through using OpenAI gym we thereby make our framework more accessible, especially for those already familiar with OpenAI gym. By building the framework on PyBullet the orchestration code can be programmed in Python while Bullet itself is written and optimized in ‘C’.
The modules supported by REM are based on the EMeRGE (Moreno et al., 2017) modules and have real-world properties for size, weight and joint forces. At the time of publication, the REM framework supports two different module types, one movable joint module which is based on Dynamixel AX-18—shown on the right in Figure 1, and a non-movable module with the same dimensions as the joint module. The connections between modules are based on magnets which makes the real-world modules easy to assemble and disassemble. Unfortunately, Bullet does not support connections that can break at a certain force threshold and so this is not supported yet. Simulation is default performed at 240 Hz, when graphical interface is not enabled, to give a high degree of accuracy for simulation.
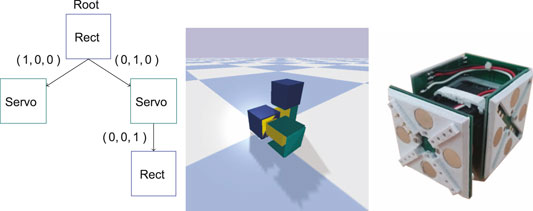
FIGURE 1. On the left the tree representation of the encoding is shown. The nodes in the graph represent modules and edges represent connections between modules. Each module has a certain number of possible connections where the triple (X, Y, Z) denotes where the connection is, relative to the parent, in 3D. Note that modules have additional properties, such as rotation, which is not shown in this illustration. In the middle the simulated modular robot corresponding to the encoding is shown in the REM framework. In the center is the root node, illustrated as a blue box. The root node has two direct connections, the two servo modules: one connected along its Y-axis and one connected along the X-axis. The servo module connected along the Y-axis has one rectangle module attached along its Z-axis. The rectangular modules have five connection sites to which other modules can be connected, corresponding to the surfaces exposed on the root module, and one which it can use to connect to others—which is the site underneath the root module. The joint modules have three connection sites which correspond to the exposed surfaces on the green bracket. The bottom of the joint module is used as a connection to other modules. On the right the real-world joint module is shown.
To support different genome encodings the REM framework utilizes a tree-based acyclic graph representation for phenotypes which describes the morphology to instantiate. This allows for both direct and indirect genome encodings as long as they unpack into the graph expected by REM.
2.2 Encoding and Control System
The morphological encoding employed in the experiments is a tree-based direct encoding similar to Faíña et al. (2013), illustrated in Figure 1. The encoding allows for any directed acyclic graph of modules to be represented, where each node in the graph represents a module and each edge is a connection between two modules. The encoding corresponds one-to-one with the phenotype encoding in the REM framework. For the experiments carried out in this article two different modules were utilized, one non-movable rectangular module supporting five child modules and one servo module capable of moving one side back-and-forth and supporting three child modules (Moreno et al., 2017). Each morphology starts with a single rectangular module as its root. To randomly initialize the morphology, a random size is selected between one and η. Modules are then added to the tree at random locations until the size of the morphology equals the selected size.
The morphological encoding supports mutation- and crossover-operators. When mutating the morphology three possibilities exist: 1) Add a random module. The tree is traversed and each available connection point is added as a possibility. A connection point is randomly selected along with a randomly selected module type before being inserted into the tree. 2) Remove a module. The tree is traversed adding all modules, except the root, into a list of candidates to remove. A module is randomly selected from the candidates before being removed along with any existing children. 3) Rotate a module. The two modules in use both support rotation around its connection axis and mutation will randomly select a new orientation in 90° increments. Note that only one of the three possible changes can occur per morphological mutation. These mutations cannot alter the type of a module.
For crossover, a branch exchange is implemented. For both parent morphologies the tree is traversed adding all modules, except the root, to a list of candidates. A random candidate is selected from both morphologies before being exchanged. The candidate module, including its children, from the first morphology, is inserted into the place of the candidate from the second morphology and vice versa.
Lastly, the morphology is limited to a maximum size,
The control systems of the joint modules are based on a decentralized wave pattern generator (Veenstra et al., 2017). Each joint module is initialized with a controller that is updated on each simulation tick to output desired angle of the joint,
where
The controllers are mutated using Gaussian noise,
2.3 Evolutionary Algorithms
To better understand how QD algorithms are able to evolve both high performance and diverse solutions we will compare three different EAs on the task of evolving both control and morphology in modular robotics. The comparison will initially utilize a flat terrain environment before experimenting in more complex simulated environments. The fitness objective of the EAs is the straight-line distance traversed, between the initial starting point and final position of the robot, during the evaluation.
For the diversity preserving EAs, morphological properties will be used to distinguish solutions. Selecting which morphological properties to utilize is a challenging problem, and may have a significant impact on the properties of the search space (Samuelsen and Glette, 2014; Miras et al., 2018b). In this paper we define the number of non-movable and the number of movable joint modules as morphological properties that can be used as our diversity metric. These features are relatively simple but combined they will relate to properties like size and agility of the robot morphologies, and should allow for a range of different morphological strategies, while being easy to use in conjunction with the applied search algorithms. By constraining our diversity metric to these two simple features we try to limit any added complexity that comes with adding more (and potentially more powerful) descriptors, and rather focus on the algorithmic approaches in these experiments.
The first EA is a single objective,
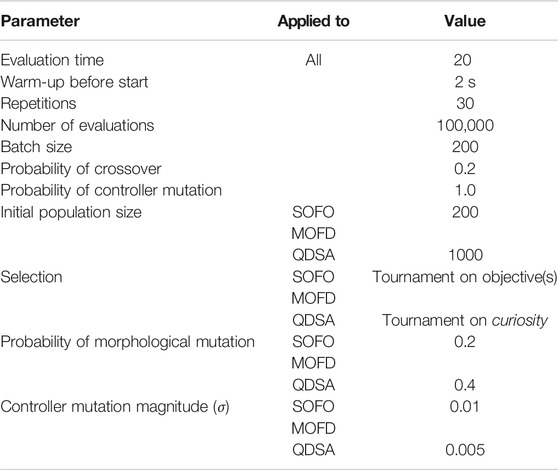
TABLE 1. Experiment parameters for the search algorithms.
The first of the diversity preserving algorithms is the MOEA, Non-dominated Sorting Genetic Algorithm-II (NSGA-II) (Deb et al., 2002). This EA also represents the objective optimization perspective, however, since NSGA-II is capable of optimizing multiple objectives the algorithm can be used to simultaneously optimize for diversity. This approach of using diversity in addition to the main objective is well-studied and has been shown to be efficient in the domain of ER (Mouret and Doncieux, 2012). In our study, the diversity metrics used are based on morphological descriptors of the evolved robots and comprise the number of non-movable modules and the number of movable modules. For NSGA-II to optimize for diversity, the average difference between morphologies is used as an objective (Lehman and Stanley, 2011), according to the following equations:
where Pn is the population, x and y are solutions in the population, mi is the number of non-movable modules and ji is the number of movable joint modules. Note that we treat each module type separately, which means the output of both equations is given in
The last EA used represents the QD paradigm and is the MAP-Elites algorithm (Mouret and Clune, 2015). Central to the MAP-Elites algorithm is the archive, or repertoire, which is utilized to store and select solutions. The archive is structured with cells of equal sizes that represent a specific combination of feature descriptors (Cully and Demiris, 2017). As with MOFD, we utilize morphological properties as feature descriptors. In contrast to MOEAs, MAP-Elites does not utilize multiple objectives, however, diversity is promoted through the archive by allowing multiple solutions to be differentiated by their feature descriptors. For the experiments carried out in this article, the archive consists of two dimensions where one axis represents the number of non-movable modules and the other axis represents the number of movable joint modules. The dimensions are scaled to the maximum size of a morphology and the cell at the origin represents the root module. For selection we utilize tournament selection based on the curiosity of solutions in the repertoire (Cully and Demiris, 2017). Curiosity is implemented by adding 1.0 to the curiosity score of a parent when a child is inserted into the repertoire and subtract 0.5 when a child fails to be inserted into the repertoire, which corresponds to the values suggested in Cully and Demiris (2017). For consistency, we will refer to this search algorithm as Quality Diversity with Structured Archive (QDSA). Parameters used for experiments for this algorithm can be found in Table 1.
To ensure a balanced comparison, the mutation parameters of each algorithm were optimized in advance in a parameter sweep (parameters detailed in Appendix 1). Each parameter was tested twice for each EA and 100,000 evaluations were done for each set of combined parameters. The simulation time for each evaluation was limited to 20 s in these initial runs. In total 180 runs were conducted to ascertain the best parameters for each search algorithm. Based on these results, a linear model was constructed to predict fitness based on the interaction of the two parameters tested. The best parameter combination of each algorithm was chosen to be used in the remaining experiments of this paper. A summary of all the runs is shown in Figure 2, which shows that QDSA is on average slightly better than the two other search algorithms—regardless of parameter combination.
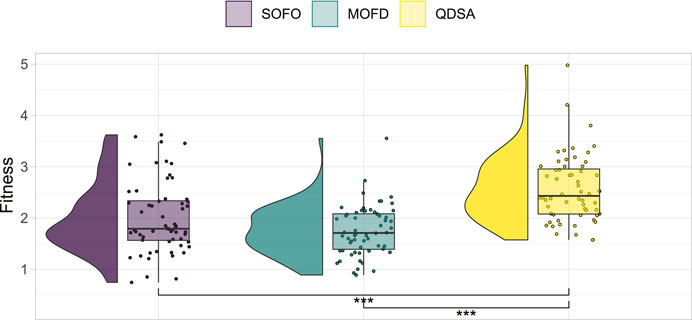
FIGURE 2. Summary of parameter optimization. All 60 runs for each search algorithm are shown together with the result of a Mann-Whitney U test which show statistically significant differences between QDSA and the two other search algorithms.
2.4 Objectives
The environment where the robots must move in shape the search space of our experiments. With a flat terrain, an evolutionary run might lead to a smooth progression due to the absence of obstacles/deceptive traps. To see whether all the approaches perform the same when changing the environment, we use three different environments: A flat terrain, a raised platform with a single wall, and a circular terrain where circular walls ripple outwards (Figure 3).
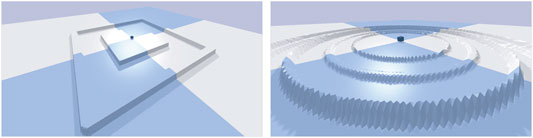
FIGURE 3. The more complex environments used to test transferred solutions. On the left the robots start on a raised platform until a ditch is created with a single wide wall. On the right the robots start on a flat terrain and several circular thin walls ripple outwards becoming taller and taller.
3 Results
3.1 Performance and Diversity
To begin analysing the performance of the three search algorithms, we will start by looking at the best fitness obtained by any single solution in the population. The best fitness is plotted in Figure 4, where on the left the fitness is shown over the number of performed evaluations, and on the right the single best individual found after the last evaluation is shown. A Mann-Whitney U test (Mann and Whitney, 1947) between the three distributions in the right plot of Figure 4, corrected for multiple comparison through Holm correction (Holm, 1979), shows that there is a significant difference between QDSA and the two other search algorithms. For locomotion, QDSA is able to find the best performing solution of the three search algorithms.
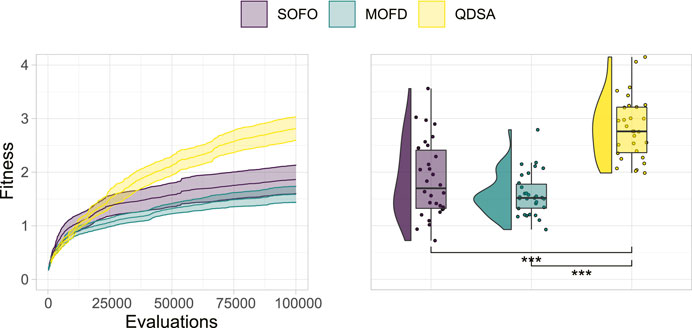
FIGURE 4. Fitness of the single best solution found in the population. On the left the mean is shown together with a 95% confidence interval over generational time. On the right, the best fitness after the last evaluation for all repetitions is shown. Statistically significant differences are marked on the right using a Mann-Whitney U test with Holm correction.
Since it is not only the fitness, or quality, of the solutions that we are interested in, it is informative to project the population of solutions into a repertoire using the morphological descriptors as axes. This projection gives an overview of the population as a whole and it is possible to visualize where in the morphological space the best solutions are found. The projection also enables us to visualize the quality-diversity trade-off, which shows that not all solutions, or morphologies, can obtain the same fitness. For the objective based search algorithms the projections are created by inserting solutions after each generation, accumulating solutions as the search progresses. In Figure 5 the top row shows the maximum fitness for each morphological niche, while the middle row shows the average fitness. The two figures illustrate the difference in diversity between the different search algorithms and shows how consistent the algorithms are at discovering solutions.
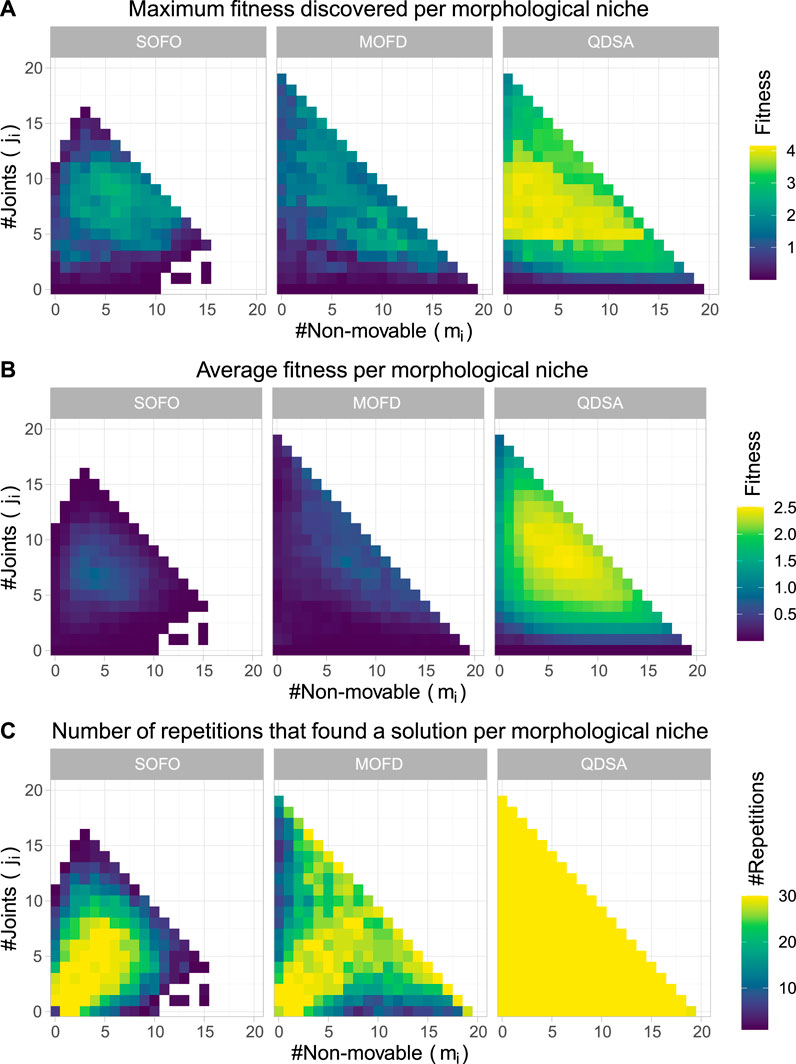
FIGURE 5. The figures show properties of the population for each search algorithm over all 30 runs. (A) shows maximum fitness of morphological niches, where the color represents fitness. (B) shows the average fitness, where for each niche the color is the average fitness calculated over the 30 runs. (C) shows the number of repetitions that found a solution for the given niche.
Although the middle row of Figure 5 shows diversity of the search algorithms, through the average fitness of morphologies, it is not able to show how proficient each algorithm is at finding diverse solutions, low performance may just indicate that the morphological niche cannot perform better. To alleviate this, the bottom row shows the number of experiments which found a solution for each morphological niche. From the figure it can be seen that QDSA and MOFD are more consistent in finding diverse solutions while the single objective SOFO is centered around a smaller cluster of morphologies. Although MOFD is able to find more diverse solutions than SOFO, only QDSA consistently finds solutions for all niches.
To summarize the projections in Figure 5 we can utilize metrics suggested by Mouret and Clune (2015) and Pugh et al. (2016). Figure 6 shows the coverage and QD-score of the three search algorithms. Coverage counts the number of unique niches found in the population and is normalized to the maximum coverage found in any run of all algorithms. Coverage can be viewed as a summation of the data shown in the bottom row of Figure 5 and shows the evolved diversity of the search algorithms. QD-score is the sum of fitness of each solution in the population and is a good summation of the quality and diversity trade-off. QD-score gives a more balanced view than either precision or reliability since both of these metrics decrease as new low fitness solutions are added due to the lower average performance, which disadvantages search algorithms that generate diversity. A Mann-Whitney U test demonstrates that the differences between all three search algorithms, after the last evaluations, for both plots in Figure 6, are significant. The two graphs in Figure 6 show the complexity of comparing algorithms on the trade-off between quality and diversity, even though MOFD has a much higher coverage compared to SOFO the difference in QD-score is much lower due to SOFO having on average high fitness in the niches it occupies.
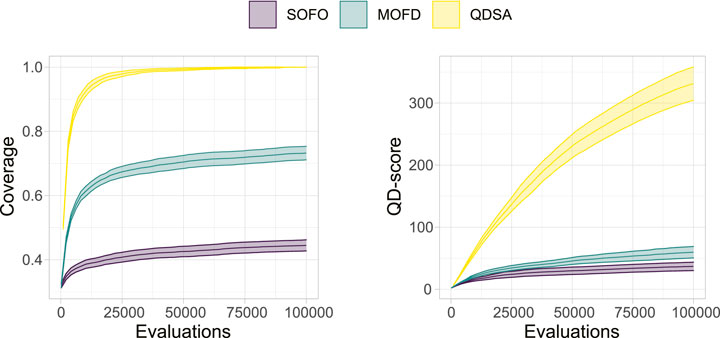
FIGURE 6. QD-Metrics. On the left the normalized coverage (Mouret and Clune, 2015), number of discovered morphological niches, is shown. Coverage has been normalized to the maximum number of niches found in any run for all three search algorithms. On the right the QD-score (Pugh et al., 2016), summation of fitness for all solutions in the population, is shown. Both plots show the mean and a 95% confidence interval.
To get an impression of the evolved morphologies, we selected the three best runs from each search algorithm and extracted the single best solution. The solutions are shown in Figure 7.
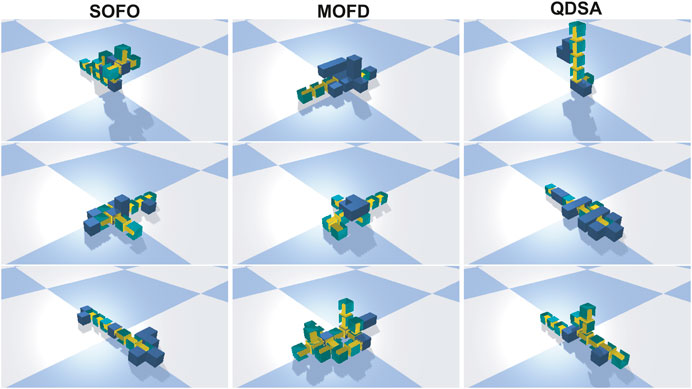
FIGURE 7. The best solution found in the three best runs of evolution for each search algorithm. Videos of these morphologies can be found on the supplementary material page.
3.2 Transitioning to New Environments
To better understand the value of diversity in our modular robotics scenario we created two new environments, with different obstacle profiles as shown in Figure 3, to see if the difference in evolved morphologies would lead to differing results in more challenging environments. The hypothesis being that a more diverse population should transition better into a different environment since an already discovered morphology could potentially lead to good performance in the new environment. Said in another way, convergence to a few good solutions in one environment could lead to slow evolution in another environment if none of the converged solutions are able to solve the new environment. We tested this hypothesis by transitioning the final population in Figure 4 into two different environments and ‘continue’ evolution from the population evolved for the default environment. The results are shown in the left column of Figure 8. From the left column it can be seen that QDSA is able to obtain the best fitness in both new environments. The difference between SOFO and MOFD is not significantly different, however, it is interesting to note that they seem to have changed relative position compared to Figure 4, a change that could indicate that the diversity of MOFD is aiding in transitioning into a new environment. In addition to testing the result of each search algorithm we also tested if the population evolved in the default environment with QDSA could aid the other two algorithms. The population of QDSA was transitioned from the default environment into the two new environments, but instead of using as mentioned in Cully and Demiris (2017) the two other search algorithms were utilized to continue evolution. The results of continuing from the population of QDSA in the two new environments are shown in the right column of Figure 8. Here it can be seen that there are no significant differences between the three search algorithms.
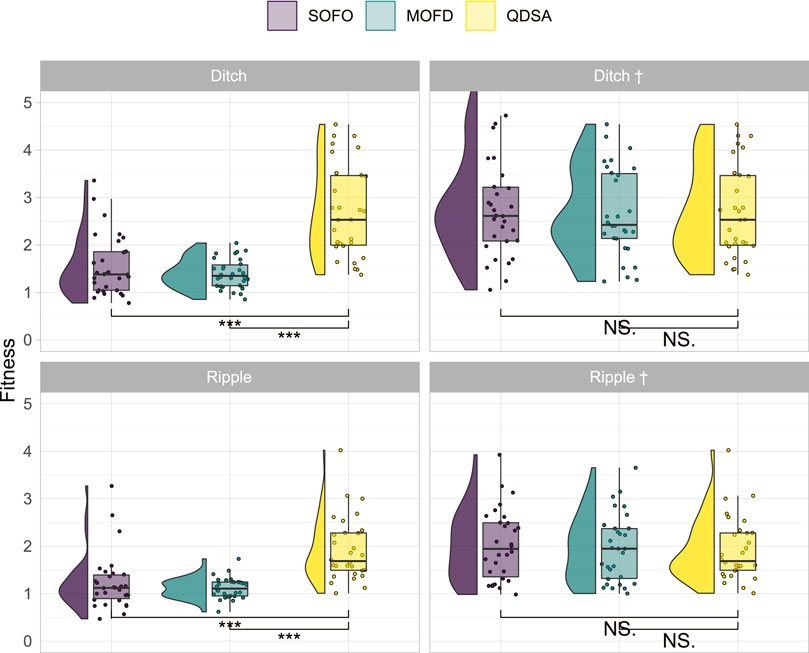
FIGURE 8. Fitness results after last evaluation for transitioning the population evolved in the default flat environment into two new environments. In the new environment evolution is continued from the initial seed population for 50,000 evaluations. Names with † signify that both SOFO and MOFD was initialized with the result of QDSA from the default flat environment.
To highlight the difference between the evolved populations in the different environmental settings, we projected the best-found solutions for the different morphological descriptions in Figure 9. This figure shows that both SOFO and MOFD are able to solve the more challenging environments when initialized with the result of QDSA. However, when started from their respective previous population from the flat environment they are not able to regain the same fitness as MOFD. Note that the figures show the cumulative best solution which accounts for the large difference in number of filled cells for the † environments.
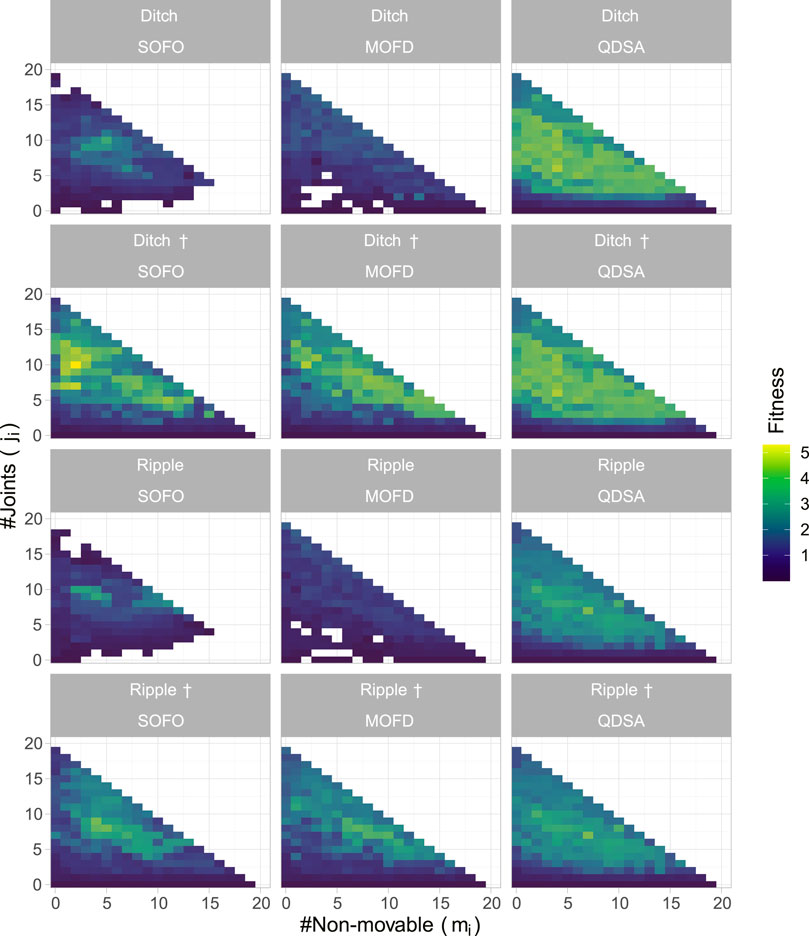
FIGURE 9. Population projection in the different environment settings. The projections show the best solution for each morphological descriptor over all runs after the last evaluation, where color represents fitness. Environment names with † signify that both SOFO and MOFD were initialized with the result of QDSA from the default flat environment.
3.3 Genealogical Analysis
Up until now the focus has been on the quality and diversity of the evolved populations, however, the previous graphs have not been able to show why the search algorithms evolve differently. We will therefore analyze the genealogical history of solutions to better understand how the solutions evolved and formed stepping stones. Figure 10 shows an illustration of the genealogical ancestry that we will analyze. The ancestry tree of a single solution is shown, as well as the ancestry’s projection into the morphological niches it occupies. The figures in this section are created by taking each solution in a given generation, extracting their genealogical ancestry—as shown in Figure 10—calculating various statistics on the whole ancestry and then collating the results of all the individual solutions in the considered generation.
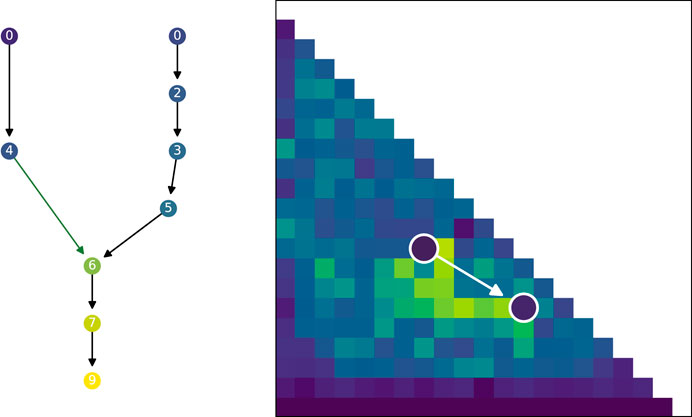
FIGURE 10. Visualized ancestry of a solution. On the left the circles represent solutions that are ancestors of the bottom most circle. The color of the circle represents the fitness of the solution. The number is the generation when the solution appeared in the population. Arrows indicate parenthood, where black arrows indicate that there is no morphological difference and green arrows indicate a morphological difference between parent and child. The two arrows joining to one new solution corresponds to a crossover operation while the other arrows correspond to mutation operations. On the right the tree is projected back into a repertoire and shows that the whole tree developed in just two different morphological descriptions, the white arrow indicates a change from parent to child in morphology.
Figure 11 shows the number of ancestors and the age of solutions over generational time. The number of ancestors is simply the size of the ancestry, for the example in Figure 10 the number of ancestors would be 8, and gives an indication of how often solutions are replaced. Another way to look at this replacement is to measure the age of solutions. Age in all examples is measured as the number of evaluations performed by the algorithm since a solution appeared in the population. For QD this means that newly inserted solutions in the archive will have an age of 0 that could have replaced older less fit individuals in the same location of the archive. Figure 11 illustrates that the generational replacement EA creates a lot of new solutions, making the average age in the population very low, while the two other search algorithms tend to generate fewer new solutions and thus have a higher age.
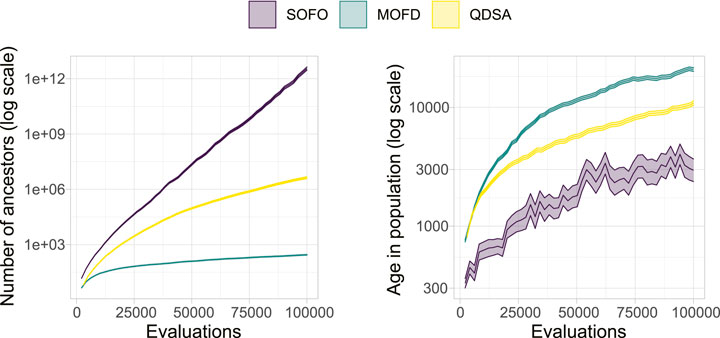
FIGURE 11. Genealogical ancestry attributes. On the left the average number of ancestors for each solution in the population is shown. On the right the age of each solution is shown, where age is number of evaluations since the solution first appeared in the population. The colored area represents the 95% confidence interval.
As shown in Figure 10, projecting the ancestry into a repertoire of morphological niches can be a way to gain insight into how a solution evolved over time. In other words, the projection discards some information from the complete ancestry tree and focuses on changes in features, as defined by the feature descriptors. In our case, this corresponds to when morphological changes are introduced. A projection covering a large portion of the feature space could thus be interpreted as having a large amount of different stepping stones. In Figure 12 the quality-diversity metrics coverage and QD-score are applied to the ancestry of solutions in the population. This summary is different from the data in Figure 6 as this utilizes the genealogical ancestor tree and projects that into a unique repertoire for each individual solution in the population, before applying the two metrics. The difference being that for the genealogical ancestry each solution in the population is used to generate a unique repertoire consisting of only ancestors of the concluding solutions before QD metrics are applied to each of these ‘ancestor repertoires’. Figure 12 shows the coverage of ancestry (left), and on the QD-score (right). From the figures it can be seen that the solutions in QDSA have an ancestry which covers a larger fraction of the morphological search space. This is contrasted with MOFD which is able to obtain quite good coverage, as seen in Figure 6, while the ancestry of solutions tends to have a much lower morphological diversity. One way to interpret this is that solutions in QDSA tend to share more ancestry with morphologically different solutions compared to MOFD.
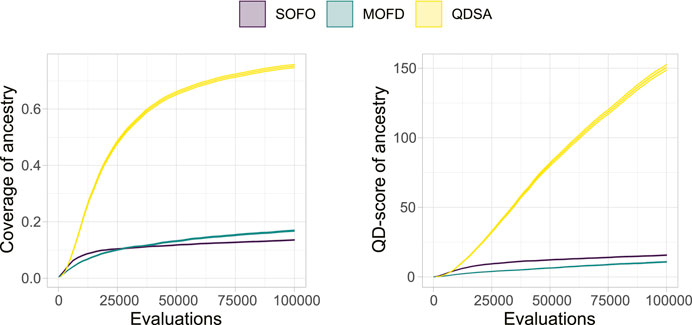
FIGURE 12. Quality Diversity metrics applied to the genealogical ancestry of each solution in the final population, after the ancestry is projected into a unique repertoire as illustrated in Figure 10. On the left, coverage is shown, which is the number of morphological niches occupied by the ancestry. On the right, the QD-score is shown, which is a summation of the fitness of the ancestry after the ancestry has been projected into a repertoire. The figure shows the mean and a 95% confidence interval.
To illustrate these genealogical statistics we selected a random run and plotted the ancestry of the best solution found during evolution. Figure 13 shows the visualized ancestry which underscores the above statistics. From the figure we can see that SOFO and QDSA have the largest ancestry trees. However, when projected down into the repertoire we can see that SOFO covers only a small area of the morphological search space, while QDSA covers the largest area.
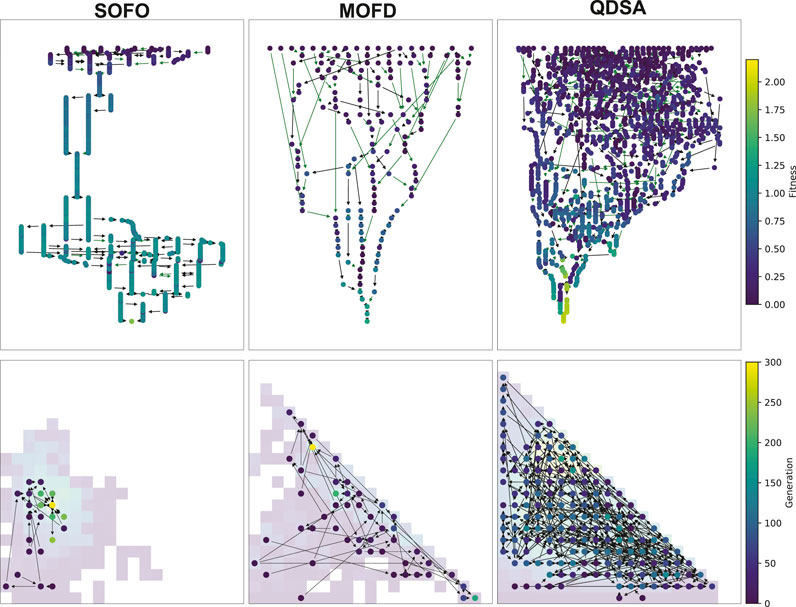
FIGURE 13. Visualized ancestry from a randomly selected seed. The top row shows the ancestry of the most fit solution for the algorithm and the bottom row shows the same ancestry projected down into a MAP-Elites repertoire, note that for SOFO and MOFD the repertoire shows the accumulated population throughout evolution. The color of the nodes in the top row corresponds to fitness while the color of the nodes in the bottom row shows the generation when the solution appeared in the search.
To investigate a possible connection between the QD properties of the ancestry, as shown in Figure 12, and the performance of the algorithms, we created a linear model as an analysis tool. The linear model predicts maximum obtained fitness based on logarithmic coverage and QD-score, both from ancestry. The model fit the data with an R2 of 0.9084, which indicates that the model fit the data quite well, coefficients can be found in Appendix 1.2 To verify if the model fit with the maximum fitness of Figure 4, we plotted the 95% confidence interval of the fitness, as shown in Figure 4, overlaid with the estimated fitness based on coverage and QD-score in Figure 14. From the figure it can be seen that the model is challenged by the larger difference in ancestry between the three search algorithms, Figure 12, compared to the lower difference in maximum fitness, Figure 4. The figure illustrates that the model, for a large part of the data, matches the obtained maximum fitness and thus could be an indication that these ancestry metrics are a good predictor of maximum fitness.
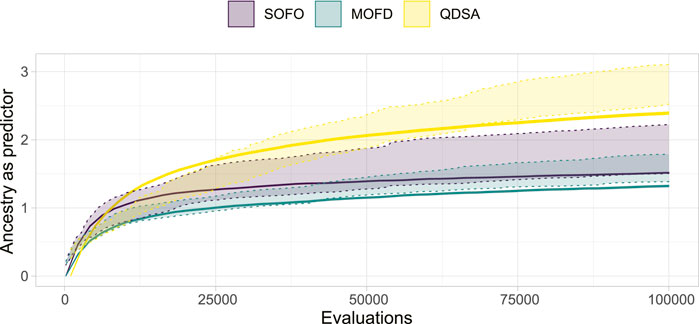
FIGURE 14. Using Quality Diversity metrics of ancestry to predict maximum fitness of each search algorithm. The dotted area represents the 95% confidence interval of maximum fitness, as shown in Figure 4, and the line represents the estimated fitness based on a linear model of Quality Diversity metrics of ancestry. The linear model achieves an R2 of 0.9084.
4 Discussion
The results for the locomotion task, in the default flat terrain, shows that QDSA produced the highest performing solutions for this problem (Figure 4). For the experiments in this paper we added a curiosity score that led to increased performance of QDSA within our computational budget. Since our previous work (Nordmoen et al., 2020b) showed no quantifiable difference between the three search algorithms, the addition of a curiosity score and selection on this score, corroborates the previous findings mentioned in Cully and Demiris (2017) of curiosity being a useful addition to MAP-Elites. From the performance results, it can also be seen that QDSA produces the most diverse populations going as far as filling out all the morphological niches defined and is the most consistent at finding high performing solutions (Figure 5).
With respect to morphological diversity we showed that explicitly promoting diversity through either objective- or QD-based search algorithms improved the assortment of morphologies. However, QDSA produces more diversity compared to MOFD, demonstrating the advantage of QD algorithms for this task. Coupled together, it is likely that the diversity produced in QDSA together with the selection pressure to improve in promising areas of the search landscape led to higher overall performance, underscoring the utility of diversity in EAs. The effect of this could potentially explain the slower rise in performance seen on in Figure 4 in contrast to the sharp growth of coverage in Figure 6. A potential explanation is that the search initially increases diversity, likely because it is easy to fill empty morphological niches, before being forced to improve performance of existing solutions.
When transitioning to different environments we showed that QDSA is able to gain significantly higher performance compared to the two other approaches. However, all approaches achieved equal fitness when seeded with the population of QDSA at the time of transition. The seeding also led to all three search algorithms finding good solutions in the same area of the search space (Figure 9). This shows the advantage of morphological diversity, as all three search algorithms are able to recover a large portion of fitness when initialized from a sufficiently diverse population. However, only the QDSA approach had managed to build up this level of diversity before the environmental change. The reason for the similar performance when initialized from the QDSA population could be due to a highly deceptive fitness landscape. This could mean that e.g. the EA on its own would be struggling to find a suitable morphology, whereas the seeded population of diverse morphologies may already contain a body in a good location of the search space, leaving time for controller optimization. The results from transitioning environments highlight two important aspects of diversity. Sufficient diversity is required to find solutions for difficult environments, and when experimenting with different environments in ER, it is difficult to a priori predict if a search algorithm is capable of finding a solution. However, search algorithms that produce and maintain diversity are more likely to handle the challenge.
The analysis of genealogical ancestry revealed several interesting aspects about how the population of solutions evolve for the three different search algorithms. Based on the number of ancestors and the age of individuals in the population (Figure 11), it can be seen that the generational replacement aspect of SOFO leads to many young solutions compared to the other approaches. This is to be expected and does not appear to disadvantage SOFO compared to MOFD in regard to performance. When looking at the difference between MOFD and QDSA it can be seen that QDSA is producing more solutions throughout evolution. One potential explanation for this is that due to the complex Pareto dominance calculated for solutions in MOFD solutions are rarely replaced based on fitness, and once diversity is maximized, as illustrated on the left in Figure 6, the search stagnates. This shows the complexities of introducing diversity into a maximization regime and it is likely that the two additional objectives are reducing the opportunity to improve on fitness.
Based on the QD metrics of the ancestry, shown in Figure 12, it can be seen that ancestors of solutions in QDSA cover a large area of the search space compared to the two other search algorithms. One could expect that since SOFO has many orders of magnitude more ancestors the solutions would cover a large area of the search space, however, the QD metrics show that the ancestors are not as morphological diverse as in QDSA. This result corroborates on the notion that MAP-Elites is better at generating diverse stepping stones, as proposed by Mouret and Clune (2015). This is also underscored by the ancestry’s QD-score (Figure 12), which shows that—in general, ancestors in QDSA are both diverse and high performing. Lastly, by building a linear model, predicting maximum fitness based only on coverage and QD-score of ancestry, we showed that diverse and high-performing ancestors could be a good predictor of performance. By modelling the relationship between genealogical ancestry and search performance, stepping stones can be seen in the larger context of evolution and gives an even stronger indication that MAP-Elites is able to produce impressive results based on diverse and high-performing intermediary solutions. By performing this analysis across populations, over many runs, we are able to gain statistical insight into the notion of stepping stones which strengthens the overall conclusion.
We showed how QDSA is an effective method for evolving both the morphology and control of modular robots for performance, diversification, and transfer to new environments. While the implementation of QDSA is promising for evolving both the morphology and control of modular robots, there are additional challenges related to how different selection methods could be further improved in QDSA. The modular robotics approach furthermore allows us to expand our module inventory to incorporate various types of other structural, sensing and actuator modules. This possible extension will convolute the search space further and possibly benefit more from QDSA than other algorithms. Experiments should also be conducted with different modular robotics systems to verify the results reported here for different modules, genotype-to-phenotype mappings, and tasks. One challenge with our setup is that different robotic blueprints can map to the same morphological features, which might be a problem as it can constrain the type of solutions found to particular robot morphologies. Therefore, additional morphological features could be implemented to create a multi-dimensional map that could lead to better and more unique solutions.
5 Conclusion
Optimizing both the morphology and controller for modular robots is challenging due to the large and unknown search space. As the amount of exploration vs. exploitation to be used for optimization strategies is usually determined by the complexity of the agent and the environment—the ruggedness of the resulting fitness landscape—we compared three evolutionary algorithms to determine how each performs on this challenging search space. The results showed that the QDSA approach based on MAP-Elites produced higher performing and more morphologically diverse solutions compared to the SOFO and MOFD approaches which were based on an objective-only EA and a diversity-augmented multi-objective EA, respectively. The importance of the diversity produced by MAP-Elites is corroborated through the successful transferal of evolved robots to two additional, and more difficult, terrain types. The genealogical ancestry produced by each algorithm furthermore indicated that MAP-Elites found more diverse and high performing stepping stones, shedding new light on how the algorithm achieves high-performing final solutions. The added pressure for diversification in the two morphological dimensions of the MAP-Elites-based approach bolsters how useful it can be for evolving both the morphology and control of modular robots.
Data Availability Statement
The datasets presented in this study can be found in online repositories. The names of the repository/repositories and accession number(s) can be found in the article/Supplementary Material.
Author Contributions
Idea and experiment design developed by JN, FV, KE and KG. Robot simulation framework developed by JN and FV. Experimental code and experiments run by JN. All the authors contributed to the analysis of the experiments and the writing of the article.
Funding
This work is partially supported by The Research Council of Norway through its Centers of Excellence scheme, project number 262762.
Conflict of Interest
The authors declare that the research was conducted in the absence of any commercial or financial relationships that could be construed as a potential conflict of interest.
The handling Editor declared a past co-authorship with one of the authors KE.
Acknowledgments
The simulations were performed on resources provided by UNINETT Sigma2 - the National Infrastructure for High Performance Computing and Data Storage in Norway.
Supplementary Material
The Supplementary Material for this article can be found online at: https://www.frontiersin.org/articles/10.3389/frobt.2021.639173/full#supplementary-material
Footnotes
1Source available at: https://github.com/nordmoen/gym-rem
2For the complete analysis see the Supplementary Material at: https://folk.universitetetioslo.no/jorgehn/modular_journal/
Appendix 1

TABLE A1. Morphological parameters for the evolved modular robots.
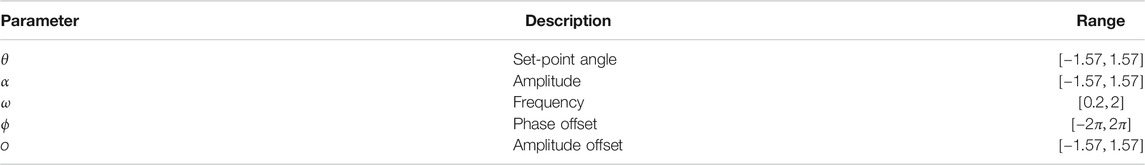
TABLE A2. Parameters for the decentralized wave pattern controllers. The value ranges are based on the servo used in the real world modules.

TABLE A3. Values tested during meta-optimization of experiment parameters.
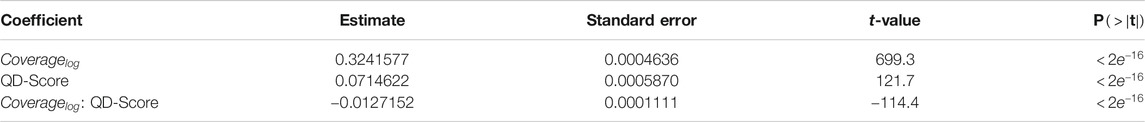
TABLE A4. Coefficients for the model predicting fitness based on ancestry. The model has a residual standard error of 0.5441 with 599538 degrees of freedom.
References
Brockman, G., Cheung, V., Pettersson, L., Schneider, J., Schulman, J., Tang, J., et al. (2016). OpenAI gym. Available at: https://arxiv.org/abs/1606.01540.
Brodbeck, L., Hauser, S., and Iida, F. (2015). Morphological evolution of physical robots through model-free phenotype development. PLoS One 10, 1–17. doi:10.1371/journal.pone.0128444
Cheney, N., Bongard, J., SunSpiral, V., and Lipson, H. (2018). Scalable co-optimization of morphology and control in embodied machines. J. R. Soc. Interface 15, 20170937. doi:10.1098/rsif.2017.0937
Cheney, N., Sunspiral, V., Bongard, J., and Lipson, H. (2016). “On the difficulty of co-optimizing morphology and control in evolved virtual creatures,” in Artificial life conference proceedings 13, July 4 8, 2016, Mayan Riviera, Mexico. Editors C. Gershenson, T. Froese, J. M. Siqueiros, W. Aguilar, E. J. Izquierdo, and H. Sayama (Cambridge, MA: MIT Press), 226–233.
Coumans, E., and Bai, Y. (2016). Pybullet, a python module for physics simulation for games, robotics and machine learning. San Francisco, CA: GitHub.
Coumans, E. (2015). “Bullet physics simulation,” in ACM SIGGRAPH 2015 courses (ACM), Los Angeles California, August 2015 (New York, NY: Association for Computing Machinery), 1.
Cully, A., Clune, J., Tarapore, D., and Mouret, J. B. (2015). Robots that can adapt like animals. Nature 521, 503–507. doi:10.1038/nature14422
Cully, A., and Demiris, Y. (2017). Quality and diversity optimization: a unifying modular framework. IEEE Trans. Evol. Comput. 22, 245–259. doi:10.1109/TEVC.2017.2704781
Deb, K., Pratap, A., Agarwal, S., and Meyarivan, T. (2002). A fast and elitist multi objective genetic algorithm: NSGA-II. IEEE Trans. Evol. Comput. 6, 182–197. doi:10.1109/4235.996017
A. E. Eiben, and J. E. Smith (Editors) (2003). Introduction to evolutionary computing. New York, NY: Springer, Vol. 53, 1–14.
Faíña, A., Bellas, F., López-Peña, F., and Duro, R. J. (2013). Edhmor: evolutionary designer of heterogeneous modular robots. Eng. Appl. Artif. Intell. 26, 2408–2423. doi:10.1016/j.engappai.2013.09.009
Gaier, A., Asteroth, A., and Mouret, J. B. (2019). “Are quality diversity algorithms better at generating stepping stones than objective-based search?,” in Proceedings of the genetic and evolutionary computation conference companion, Prague, Czech Republic, July 2019. Editors M. LÓpez-Ibáñez (New York, NY: Association for Computing Machinery), 115–116.
Gaier, A., Asteroth, A., and Mouret, J. B. (2017). “Data-efficient exploration, optimization, and modeling of diverse designs through surrogate-assisted illumination,” in Proceedings of the genetic and evolutionary computation conference, Berlin, Germany, July 2017. Editors G. Ochoa (New York, NY: ACM), 99–106.
Gravina, D., Liapis, A., and Yannakakis, G. N. (2019). “Blending notions of diversity for map-elites,” in Proceedings of the genetic and evolutionary computation conference companion, Prague, Czech Republic, July 2019. Editors M. López-Ibáñez (New York, NY: Association for Computing Machinery), 117–118.
Gravina, D., Liapis, A., and Yannakakis, G. N. (2018). Fusing novelty and surprise for evolving robot morphologies,” in Proceedings of the genetic and evolutionary computation conference, Kyoto, Japan, July 2018. Editors H. Aguirre (New York, NY: Association for Computing Machinery), 93–100.
Haasdijk, E., Rusu, A. A., and Eiben, A. (2010). “Hyperneat for locomotion control in modular robots,” in International conference on evolvable systems , September 6, 2010, Berlin, Heidelberg. Editors G. Tempesti, A. M. Tyrrell, and J. F. Miller (Berlin, Germany: Springer), 169–180.
Hale, M. F., Buchanan, E., Winfield, A. F., Timmis, J., Hart, E., Eiben, A. E., et al. (2019). “The are robot fabricator: how to (re)produce robots that can evolve in the real world,” in Artificial life conference proceedings, Newcastle, United Kingdom, July 29th, 2019 - August2nd, 2019. Editors H. Fellermann, J. G.-M. Bacardit, and R. M. Ángel Füchslin MIT Press, 95–102. doi:10.1162/isal\_a\_00147
Hiller, J., and Lipson, H. (2012). Dynamic simulation of soft heterogeneous objects. Available at: https://arxiv.org/abs/1212.2845.
Holm, S. (1979). A simple sequentially rejective multiple test procedure. Scand. J. Stat., 6, 65–70. doi:10.2307/4615733
Hornby, G. S. (2006). “Alps: the age-layered population structure for reducing the problem of premature convergence,” in Proceedings of the 8th annual conference on Genetic and evolutionary computation, Seattle, WA, July 8–12, 2006. Editors M. Keijzer (New York, NY: Association for Computing Machinery), 815–822.
Hornby, G. S., Lipson, H., and Pollack, J. B. (2003). Generative representations for the automated design of modular physical robots. IEEE Trans. Robot. Autom. 19, 703–719. doi:10.1109/TRA.2003.814502
Jelisavcic, M., Glette, K., Haasdijk, E., and Eiben, A. E. (2019). Lamarckian evolution of simulated modular robots. Front. Robot. AI 6, 1–9. doi:10.3389/frobt.2019.00009
Lehman, J., and Stanley, K. O. (2008). “Exploiting open-endedness to solve problems through the search for novelty,” in ALIFE, Winchester, United Kingdom, August 5, 2008 -August 8th, 2008, 329–336. 10.1162.365.3998
Lehman, J., and Stanley, K. O. (2011). “Evolving a diversity of virtual creatures through novelty search and local competition,” in Proceedings of the 13th annual conference on genetic and evolutionary computation, Dublin, Ireland, July 2011. Editors N. Krasnogor (New York, NY: Association for Computing Machinery), XI, 211–218.
Lipson, H., and Pollack, J. B. (2000). Automatic design and manufacture of robotic lifeforms. Nature 406, 974–978. doi:10.1038/35023115
Mann, H. B., and Whitney, D. R. (1947). On a test of whether one of two random variables is stochastically larger than the other. Ann. Math. Stat. 18, 50–60. doi:10.1214/aoms/1177730491
Marbach, D., and Ijspeert, A. J. (2004). “Co-evolution of configuration and control for homogenous modular robots,” in Proceedings of the eighth conference on intelligent autonomous systems (IAS8), Amsterdam, Netherlands, June 2004 (New York, United States: IOS Press), 712–719.
Marbach, D., and Ijspeert, A. J. (2005). “Online optimization of modular robot locomotion,” in IEEE international conference mechatronics and automation, 2005, Niagara Falls, ON, July 29–August 1, 2005. Editors J. Gu, and P. X. Liu (IEEE), Vol. 1, 248–253.
Methenitis, G., Hennes, D., Izzo, D., and Visser, A. (2015). “Novelty search for soft robotic space exploration,” in Proceedings of the 2015 annual conference on genetic and evolutionary computation, Madrid, Spain, July 2015 (New York, NY: Association for Computing Machinery), 193–200.
Miras, K., Haasdijk, E., Glette, K., and Eiben, A. (2018a). “Effects of selection preferences on evolved robot morphologies and behaviors,” in Artificial life conference proceedings, Newcastle upon Tyne, United States, July 29–August 2, 2019. Editors T. Ikegami, N. Virgo, O. Witkowski, M. Oka, R. Suzuki, and H. Iizuka (Cambridge, MA: MIT Press), 224–231.
Miras, K., Haasdijk, E., Glette, K., and Eiben, A. (2018b). “Search space analysis of evolvable robot morphologies,” in International conference on the applications of evolutionary computation, Parma, Italy, April 4–6, 2018. Editors K. Sim, and P. Kaufmann (Cham, Switzerland: Springer), 703–718.
Moreno, R., Liu, C., Faina, A., Hernandez, H., and Gomez, J. (2017). “The emerge modular robot, an open platform for quick testing of evolved robot morphologies,” in Proceedings of the genetic and evolutionary computation conference companion, Berlin Germany, July 2017. Editors S. Sundaram (New York, NY: ACM), 71–72.
Moreno, R., Veenstra, F., Silvera, D., Franco, J., Gracia, O., Cordoba, E., et al. (2018). “Automated reconfiguration of modular robots using robot manipulators,” in 2018 IEEE symposium series on computational intelligence (SSCI), Bengaluru, India, November 18–21, 2018 (IEEE: New York, United States), 884–891.
Moubarak, P., and Ben-Tzvi, P. (2012). Modular and reconfigurable mobile robotics. Robot. Auton. Syst. 60, 1648–1663. doi:10.1016/j.robot.2012.09.002
Mouret, J. B., and Clune, J. (2015). Illuminating search spaces by mapping elites. Available at: https://arxiv.org/abs/1504.04909.
Mouret, J. B. (2020). Evolving the behavior of machines: from micro to macroevolution. iScience 23, 1–13. doi:10.1016/j.isci.2020.101731
Mouret, J. B. (2011). “Novelty-based multiobjectivization,” in New horizons in evolutionary robotics. Editors Doncieux, S., and Bredeche, N. (New York, NY: Springer), 139–154.
Mouret, J. B., and Doncieux, S. (2012). Encouraging behavioral diversity in evolutionary robotics: an empirical study. Evol. Comput. 20, 91–133. doi:10.1162/EVCO_a_00048
Mouret, J. B., and Doncieux, S. (2009). “Overcoming the bootstrap problem in evolutionary robotics using behavioral diversity,” in 2009 IEEE congress on evolutionary computation, Trondheim, Norway, May 18–21, 2009 (IEEE: New York, United States), 1161–1168.
Nordmoen, J., Nygaard, T. F., amuelsen, E., and Glette, K. (2020a). On restricting real-valued genotypes in evolutionary algorithms. Available at: https://arxiv.org/abs/2005.09380.
Nordmoen, J., Veenstra, F., Ellefsen, K. O., and Glette, K. (2020b). “Quality and diversity in evolutionary modular robotics,” in 2020 IEEE symposium series on computational intelligence (SSCI), Canberra, Australia, December 1–4, 2020 (IEEE: New York, United States), 2109–2116. doi:10.1109/SSCI47803.2020.9308511
Pugh, J. K., Soros, L. B., and Stanley, K. O. (2016). Quality diversity: a new frontier for evolutionary computation. Front. Robot. AI 3, 1–17. doi:10.3389/frobt.2016.00040
Samuelsen, E., and Glette, K. (2015). “Real-world reproduction of evolved robot morphologies: automated categorization and evaluation,” in European conference on the applications of evolutionary computation, April 8-10, 2015, Copenhagen, Denmark. Editors A. M. Mora, and G. Squillero (Cham, Switzerland: Springer), 771–782.
Samuelsen, E., and Glette, K. (2014). “Some distance measures for morphological diversification in generative evolutionary robotics,” in Proceedings of the 2014 annual conference on genetic and evolutionary computation, Vancouver, BC, July 2014. Editors C. Igel, (New York, NY: ACM), 721–728.
Secretan, J., Beato, N., D’Ambrosio, D. B., Rodriguez, A., Campbell, A., Folsom-Kovarik, J. T., et al. (2011). Picbreeder: a case study in collaborative evolutionary exploration of design space. Evol. Comput. 19, 373–403. doi:10.1162/EVCO_a_00030
Sims, K. (1994). Evolving 3D morphology and behavior by competition. Artif. Life 1, 353–372. doi:10.1162/artl.1994.1.4.353
Stanley, K. O., and Lehman, J. (2015). Why greatness cannot be planned: the myth of the objective. Cham, Switzerland: Springer. doi:10.1007/978-3-319-15524-1
Stoy, K., Brandt, D., and Christensen, D. (2010). Self-reconfigurable robots: an introduction. New York, United States: MIT Press.
Stoy, K. (2006). “The deformatron robot: a biologically inspired homogeneous modular robot,” in Proceedings 2006 IEEE international conference on robotics and automation, Orlando, FL, May 15–19, 2006 (IEEE), 2527–2531.
Veenstra, F., Faina, A., Risi, S., and Stoy, K. (2017). “Evolution and morphogenesis of simulated modular robots: a comparison between a direct and generative encoding,” in European conference on the applications of evolutionary computation, Amsterdam, Netherlands, April 19–21, 2017. Editors S. Giovanni, and K. Sim (Cham, Switzerland: Springer), 870–885.
White, P., Zykov, V., Bongard, J. C., and Lipson, H. (2005). “Three dimensional stochastic reconfiguration of modular robots,” in Robotics: science and systems, June 8-11, 2005, Cambridge, Massachusetts. Editors S. Thrun, G. S. Sukhatme, and S. Schaal (Ithaca, NY: Cornell University), 161–168.
Woolley, B. G., and Stanley, K. O. (2011). “On the deleterious effects of a priori objectives on evolution and representation,” in Proceedings of the 2011 annual conference on genetic and evolutionary computation, Dublin, Ireland, July 12-16. Editors K. Natalio, and P. Luca Lanzi, 957–964. doi:10.1145/2001576.2001707
Keywords: evolutionary robotics, modular robotics, morphology evolution, stepping stones, diversity, multiple environments, quality diversity, MAP-elites
Citation: Nordmoen J, Veenstra F, Ellefsen KO and Glette K (2021) MAP-Elites Enables Powerful Stepping Stones and Diversity for Modular Robotics. Front. Robot. AI 8:639173. doi: 10.3389/frobt.2021.639173
Received: 08 December 2020; Accepted: 17 February 2021;
Published: 28 April 2021.
Edited by:
Stephane Doncieux, Sorbonne Universités, FranceReviewed by:
Antoine Cully, Imperial College London, United KingdomAnders Lyhne Christensen, University of Southern Denmark, Denmark
Copyright © 2021 Nordmoen, Veenstra, Ellefsen and Glette. This is an open-access article distributed under the terms of the Creative Commons Attribution License (CC BY). The use, distribution or reproduction in other forums is permitted, provided the original author(s) and the copyright owner(s) are credited and that the original publication in this journal is cited, in accordance with accepted academic practice. No use, distribution or reproduction is permitted which does not comply with these terms.
*Correspondence: Jørgen Nordmoen, jorgehn@ifi.uio.no