 Anahi Molar-Cruz
 Sergio A. Huezo Rodríguez
 Thomas Hamacher
- Department of Energy and Process Engineering, TUM School of Engineering and Design, Technical University of Munich, Munich, Germany
The transition toward sustainable cities requires evaluating current energy policies to reshape established patterns of energy supply and use. Ignoring socioeconomic and geographic differences among households in the energy policy-making process jeopardizes the government's ability to achieve a fair distribution of resources and advance energy equity. Hence, tailored urban energy strategies that address specific opportunities to improve local sustainable development and energy justice are needed. In this paper, we use the energy burden, i.e., the share of household income spent on energy services, as a metric to characterize energy affordability for urban households in Mexico. We estimate the electricity and gas consumption as well as their resulting financial burden for 17,850 urban households in 72 metropolitan areas. The calculated median monthly energy consumption of Mexican urban households is 453 kWh and is dominated by gas consumption. This results in a median energy burden of 3.5%. However, we observe a large diversity among households in energy consumption and, consequently, in energy burden, due to variations in energy use among urban households derived from their socioeconomic and geographic conditions. In addition, we analyze the role of the temperature-based residential electricity subsidy. We find that even with subsidized electricity prices, the current subsidy scheme is insufficient to alleviate energy vulnerability in urban Mexico, and at the same time, it has a regressive effect by benefiting those consuming more. Based on the analysis of the energy burden at the city level, we highlight evident problems and potential solutions missed by one-size-fits-all energy policies. This analysis provides a better understanding of the drivers and distribution of energy burden in urban households. It also presents practical insights that could help policymakers ensure that energy is available to all households according to their needs and that demands for reductions in energy consumption as well as for adoption of clean energy technologies and energy efficiency measures come from each according to their capacity.
1. Introduction
The transition toward sustainable cities requires that energy policies have equity and justice at their core (Jenkins, 2016; Jenkins et al., 2016). Ignoring the social, economic, and geographic factors of energy use in the development and implementation of energy policies jeopardizes the fulfillment of the population's energy needs and the fair and efficient distribution of resources. There is a need for more effective targeting to identify and react to the specific energy needs and opportunities of all households (Bednar et al., 2017). An initial step toward this goal is to draw attention to where energy injustices occur, including the unequal allocation of benefits and burdens, and to understand the underlying reasons for their uneven, inefficient, or unfair distribution (Walker, 2009; Bouzarovski and Simcock, 2017; Lamb et al., 2020; Velasco-Herrejon and Bauwens, 2020).
Inequitable impacts of residential energy consumption are often analyzed in the context of energy poverty. Even though there is no universal definition of energy poverty, it is widely described as the inability of a household to secure a socially and materially necessary level of domestic energy services (Bouzarovski and Tirado Herrero, 2017). Its assessment depends on the conceptualization and evaluation of the underlying factors (e.g., accessibility, adequacy and affordability of energy services) and these are usually particular to the case under study (Schuessler, 2014).
Energy poverty studies in Mexico are limited and focus mainly on measuring energy access (Garcia-Ochoa and Graizbord, 2016; García Ochoa and Graizbord Ed, 2016; Santillán et al., 2020). They do not take into account the affordability of energy services. Measuring affordability requires assessing the financial burden for households resulting from the satisfaction of their energy needs (Dubois and Meier, 2016). Studies of this sort traditionally address energy poverty in OECD countries, where energy access is not an issue (Schuessler, 2014; Dubois and Meier, 2016; Thomson et al., 2017; Kontokosta et al., 2020). However, cities in developing countries with high electrification rates are often overlooked in accessibility studies, as their energy vulnerability is only associated with access to energy services and not with the affordability or adequacy of such services (Nussbaumer et al., 2012; Schuessler, 2014; Santillán et al., 2020).
The energy burden, i.e., the percentage of household income used for energy expenditures, is a widely used objective metric to assess energy poverty in terms of affordability of energy services (Reames, 2016; Bednar et al., 2017; Thomson et al., 2017; Tirado Herrero, 2017; Agbim et al., 2020; Drehobl et al., 2020; Kontokosta et al., 2020). Drehobl et al. (2020) describes that the intensity of energy burdens is a consequence of the physical characteristics of the household (e.g., location, housing type, number and type of appliances, heating and cooling systems), the resident's socioeconomic status and behavioral patterns (e.g., recurrent income level, ability to afford up-front costs of energy-related investments, energy-saving practices), and the availability of policy-related resources (e.g., direct or indirect subsidies for bill assistance and energy efficiency). Therefore, causes of high or low energy burdens are usually a combination of these drivers.
High energy burdens can result in energy insecurity and create a negative feedback loop that reinforces social inequality (Urban, 2019; Drehobl et al., 2020). According to Brown et al. (2020), low-income households often make trade-offs between meeting alternative critical household expenditures like rent, food, healthcare or telecommunications, to avoid energy shut-offs. This can lead to or exacerbate poor health due to constant thermal discomfort and stress caused by the uncertainty of affording energy bills (Agbim et al., 2020; Drehobl et al., 2020; Memmott et al., 2021). However, high energy burdens might also be explained by high energy requirements or low levels of energy-saving practices (Evergreen Economics, 2016). On the other hand, low energy burdens might indicate hidden energy poverty, particularly for low-income households that prioritize other expenditures (Tirado Herrero, 2017). Yet, they might also result from energy efficiency strategies or low and distorted energy costs resulting from universal energy policies. Since the underlying factors of energy burdens are multifaceted and thus, lead to a broad spectrum of energy burden intensities among households, it is necessary to carry out studies that address the multiple dimensions of energy inequality and its drivers, including the geographic dimension.
The objective of this work is to characterize the distribution of energy burden of urban households in Mexico at the national level and across metropolitan areas. For this purpose, we first estimate the electricity and gas consumption of Mexican urban households based on their expenditure and local tariffs for these services. We investigate the variations in energy use among urban households derived from their socioeconomic and geographic conditions in terms of income, dwelling and household size, tenure status, education level, and local temperature. This analysis is key to understanding the underlying determinants of the wide range of energy burden values. Then, we categorize household energy burdens into five levels, from very low to very high. In doing so, we identify at one end, highly energy burdened households that, even with the current electricity subsidy scheme, spend disproportionately more of their income in energy bills, and at the other end, energy secure households for whom paying for energy services, with or without subsidy, represents only a small fraction of their income. In this way, we recognize the enormous diversity among urban households. We argue that one-size-fits-all energy policies, especially the current Mexican residential electricity scheme, invisibilize the particularities of household energy consumption and, at the same time, have a high fiscal cost due to their inefficiency in distributing the benefits. Furthermore, we investigate and compare the energy use and energy burden of 72 metropolitan areas in Mexico. We identify similarities and differences across cities that highlight specific needs and opportunities at this spatial level. Therefore, this study may assist policy-makers with the development and integration of better-targeted energy affordability and energy burden goals in policies toward sustainable cities.
2. Literature Review
2.1. Measuring Energy Poverty
Energy poverty is a complex phenomenon and has no universal definition (Schuessler, 2014; García Ochoa and Graizbord Ed, 2016). It can be generally described as the inability of a household to secure a socially and materially necessary level of domestic energy services (Bouzarovski and Tirado Herrero, 2017). Schuessler (2014) describes the crux of energy poverty as the unavailability and/or inappropriately high costs of procuring such services at the household level. However, how to measure energy poverty depends on the conceptualization and assessment of the underlying phenomena, which has prompted the development of different approaches for measuring it. Three main directions are identified in literature (Schuessler, 2014; González-Eguino, 2015; Tirado Herrero, 2017; Agbim et al., 2020): (1) comparing the level of domestic energy services vs a predefined standard for a quantitative measure of accessibility and/or adequacy of energy services, (2) expenditure-based indicators for a quantitative measure of affordability of energy services, and (3) subjective qualitative assessments of energy-related living conditions. Studies of energy poverty in developing countries traditionally focus on accessibility of energy services (Nussbaumer et al., 2012; García Ochoa and Graizbord Ed, 2016; Sadath and Acharya, 2017; Santillán et al., 2020), while high electrification rates and rising energy costs have extended energy poverty studies to adequacy and affordability of energy services, mainly in OECD countries (Drehobl and Ross, 2016; Dubois and Meier, 2016; Thomson et al., 2017; Brown et al., 2020).
Expenditure-based definitions are the most used quantitative instruments to define and measure the intensity of energy poverty (Schuessler, 2014; Tirado Herrero, 2017). Discussions in this regard began in the UK in the 1970s to identify households that were unable to attain adequate room warmth at reasonable costs. Boardman (1991) proposed the popular ten-percent-rule, which categorized households that spent more than 10% of their income in energy spending as fuel poor. This threshold served as the official energy poverty line indicator in the UK until 2012 and allowed the monitoring of the national incidence of energy poverty for more than a decade (Thomson et al., 2017). This expenditure-to-income ratio transitioned from being a metric with a focus on heating costs to an indicator that captures all domestic energy services, commonly referred as energy burden (Schuessler, 2014).
Similar to the ten-percent-rule, the energy burden has been used to identify energy-poor households by defining a threshold of maximum fraction of income spent on energy services (Schuessler, 2014). Due to their simplicity, energy burden studies spread from the UK to other European countries (Thomson and Snell, 2013; Heindl, 2015; Rademaekers et al., 2016) and recently also to the US (Drehobl and Ross, 2016; Cook and Shah, 2018; Agbim et al., 2020; Brown et al., 2020; Drehobl et al., 2020; Kontokosta et al., 2020). However, there is a lot of discussion around the assessment of energy poverty using solely an objective metric and an arbitrarily defined or uncritically transferred threshold, as it might not capture all those facing energy poverty (Tirado Herrero, 2017). Researchers argue that energy burden analyses often ignore social, economic and geographic factors, as well as the diversity in energy end-uses, and thus also fail to identify the drivers of energy poverty (Tirado Herrero, 2017; Agbim et al., 2020). Although it is recognized that the assessment of energy poverty should be a multi-dimension investigation and preferably follow a multi-indicator approach (Rademaekers et al., 2016; Thomson et al., 2017), such an analysis would require the availability of household-level information on all the dimensions to be investigated, which is rather a difficult task for most countries. This sustains that using the energy burden as a pragmatic indicator to establish a baseline for assessing energy poverty is a good option for case studies with limited information, provided that a fixed percentage threshold is empirically confirmed, adequately modified, and regularly updated to account for the temporal and spatial dynamics of energy poverty Schuessler (2014); Agbim et al. (2020).
The definition of an energy burden threshold for quantifying fuel poverty should not necessarily be the same for different countries and even for different cities within the same country; it is case-specific. Nevertheless, the underlying assumptions for its definition should be clearly stated for transparency, replicability, monitoring, and benchmarking purposes (Rademaekers et al., 2016). Consider for example, Boardman's fuel expenditure vs. household income maximum threshold of 10%. It represented the actual average share of energy spending among the 30% of the poorest households in the UK, as well as roughly twice the median share of the actual energy spending for all households in 1988 (Boardman, 1991). Another example is the 6% affordable burden for home energy bills commonly used in energy poverty studies in the US (Fischer Sheehan and Colton, 2013; Drehobl and Ross, 2016; Reames, 2016; Bednar et al., 2017; Cook and Shah, 2018; Brown et al., 2020). This maximum energy burden is based on the premise that housing costs should account for no more than 30% of household income, and household energy costs should not exceed 20% of housing costs (Fischer Sheehan and Colton, 2013; Drehobl et al., 2020). Both thresholds, widely used in literature, are defined differently, but seek to characterize energy affordability for low-income households in the UK and the US.
Worldwide, energy and sustainability strategies at the city level are becoming more common. One of the main reasons is that the city is often the administrative tier of the local government with the principal competence for energy policy (Asaporta and Nadin, 2020). This calls for the spatial characterization of energy burden, at least at this spatial scale, either through city-level comparison studies (Drehobl and Ross, 2016; Drehobl et al., 2020; Kontokosta et al., 2020) or detailed intra-city analyses (Mayer et al., 2014; Bednar et al., 2017; Agbim et al., 2020).
Drehobl and Ross (2016), measure individual energy burdens in several cities in the US and use the median percent of income used for energy expenditures of each city as a threshold for a household to be considered energy poor. In this way, they take into account regional differences in economic characteristics, climate and diversity in energy end-uses within the same country. Kontokosta et al. (2020) analyze energy audit reports of households in five US cities and examine the distribution of energy burdens among household demographic and socioeconomic characteristics. They report the median annual energy cost per square foot and resulting energy cost burden by city and income band, rather than the classic binary classification of households as being energy poor or not. This approach allows the direct comparison of energy burden values across cities, and furthermore, decouples energy poverty from a national fixed percentage threshold. In a similar way, Drehobl et al. (2020) present a snapshot of US energy burdens nationally, regionally, and in 25 selected metro areas. They also present the raw energy burden values and further compare them to a country-wide criterion of 6% and 10%, for high and severe energy burdens, respectively. Thus, they offer a clear overview of the intra-national differences while providing cities and states a starting point for incorporating energy burden goals in local energy policies and programs to achieve more equitable energy outcomes.
In summary, the existing literature shows that the energy burden is a straightforward metric that can provide an insight into the affordability of energy services. Statistical analyses of energy burden allow the identification of those households that spend disproportionately more -and less- of their income on energy costs. The understanding of the spatial and temporal distribution of the financial burden the population faces in meeting their energy needs is key to the generation of just energy policies, insofar as the underlying factors of high -and low- energy burdens are understood. Yet, most of the existing literature refers to studies conducted in Europe and the US. This calls for energy burden studies in other regions of the world, especially in developing countries, that consider the contextual differences of households in these regions.
2.2. Energy Use and Energy Poverty in Mexico
Electricity and domestic gas are the main energy sources in households in Mexico. According to Franco and Velázquez (2016), the percentage distribution of energy consumption by end-use activity in 2014 was: water heating (65.0%), food cooking (17.2%), air conditioning and ventilation (7.0%), food refrigeration (6.9%), lighting (2.8%), and entertainment and others (1.1%). Gas use in households is linked to cooking, hot water consumption, and clothes drying, the latter being by far the least common end-use activity (INEGI, 2019d). Still, electricity and other less usual energy carriers, such as wood, can replace gas use in some cases. In 2016, 95.5% of urban households reported using electricity and gas as energy sources (INEGI, 2019d). However, the share of clean and modern fuels in rural households decreases to 88.7% (Franco and Velázquez, 2016).
Several studies have analyzed the disparities in energy use in Mexican households, particularly regarding the effect of income inequality and consumption patterns within the country (Rosas et al., 2010; Rodriguez Oreggia and Yepez Garcia, 2014; Franco and Velázquez, 2016; Jimenez Mori and Yepez-Garcia, 2017; Santillán Vera and de la Vega Navarro, 2019). Scholars agree that there is a significant difference among the energy consumption of rural and urban households, with urban households consuming more energy and spending proportionately less of their income than rural households (Franco and Velázquez, 2016; Jimenez Mori and Yepez-Garcia, 2017). This inequality is not only driven by diverse energy consumption trends, but is also rooted in differences in energy access. Energy poverty assessments with a focus on accessibility of energy services show that households in rural areas have significantly less access to energy services than those in urban areas, particularly concerning lighting, entertainment, water heating and cooking (García Ochoa and Graizbord Ed, 2016). García Ochoa and Graizbord Ed (2016) find that the household income, the type of settlement (urban or rural) and the regional climate are the main determinant factors linked to energy deprivation.
Most of the existing literature on energy use and energy poverty in Mexico does not address the geographical inequities. To our knowledge, only (Garcia-Ochoa and Graizbord, 2016) offer a first approach to the geography of energy poverty. They identify a spatial pattern of energy poverty in which low-income states with a need for thermal comfort and located in the southern part of the country exhibit the highest levels of energy deprivation. States in the center of the country with moderate climates and no need for thermal comfort experience medium levels of energy deprivation. Moreover, states in the north with a need for thermal comfort but with above-average income levels have the lowest levels of energy deprivation. Apart from grouping urban and rural households in the subnational results, this analysis focuses only on quantifying energy deprivation and does not provide an insight on the financial burden of covering domestic energy needs.
Rodriguez Oreggia and Yepez Garcia (2014) and Jimenez Mori and Yepez-Garcia (2017) analyze the household energy expenses using microdata at the household level from the Income-Expenditure National Survey of 2010 and 2014, respectively. Rodriguez Oreggia and Yepez Garcia (2014) report that urban households spend around 10% of their income on energy, including electricity, domestic gas, and gasoline for private transportation. This energy burden is similar for all income groups, but gasoline accounts for a larger share with increasing income. A similar trend is reported by Jimenez Mori and Yepez-Garcia (2017) for all rural and urban households in Mexico. When considering only electricity and gas, the energy burden of households in the poorest quintile represents 6.8% of their income, whereas it decreases to 3.8% in the richest quintile. These studies already provide valuable information on energy spending and affordability at the national level. However, they overlook the geographically embedded and dependent nature of the underlying causes. The spatial disaggregation of the energy affordability and its determinants is fundamental to complete the geographic picture of energy poverty in Mexico. This work aims to address this gap by estimating the spatial distribution of energy burden at the city level.
3. Materials and Methods
The energy burden is calculated as the share of household income spent on energy services. This paper considers electricity and domestic gas expenditures and focuses only on urban households in Mexico. Even though the spatial unit of energy burden is the household, it has a local and specific nature, making it necessary to incorporate the spatial dimension as a contextual factor (Garcia-Ochoa and Graizbord, 2016). In this way, spatial and regional differences become relevant elements of analysis for a better understanding of the distribution of the energy burden in any given study area.
Our main data source is the National Survey of Household Income and Expenditure (ENIGH) of INEGI (2019c). The expenditure-to-income ratio can be estimated from this dataset alone. However, understanding the underlying drivers of the intensity of the resulting energy burdens requires the computation of the actual household energy consumption. For this purpose, we calculate the electricity and gas consumption at the household level based on their reported expenditure and local tariffs for these services. The latter are defined according to the national subsidy schemes, which, in the case of electricity, depend on the local average summer temperature of the household's geographic location. Therefore, we use a second dataset, the Digital Climate Atlas of Mexico (UNIATMOS, 2019), to estimate the average minimum summer temperature of surveyed households in the ENIGH to find out their corresponding electricity tariff and associated subsidy. We investigate the variations of energy use among urban households in terms of income, dwelling and household size, tenure status, education level, and local temperature. Furthermore, we analyze the distribution of energy burdens nationally and for 72 metropolitan areas defined in a third dataset, the National Urban System of CONAPO (2018). Additional details on the three main datasets as well as on the calculation methods for electricity and gas consumption and energy burden are found in the following subsections.
3.1. Data
3.1.1. Household Income and Expenditure
The National Survey of Household Income and Expenditure (ENIGH, Encuesta Nacional de Ingresos y Gastos de los Hogares) provides a statistical overview of the characteristics and trends of income and expenditures of Mexican households in terms of their amount, origin and distribution (INEGI, 2019c). It also offers information regarding the occupational and sociodemographic characteristics of household members, as well as an insight on the housing infrastructure and appliances. This survey is carried out every 2 years by the National Institute of Statistics and Geography (INEGI, Instituto Nacional de Estadística y Geografía). The ENIGH of 2018 has a sample size of 87,826 households and includes information on both rural and urban households throughout the country ensuring a statistical representativeness at the state-level (INEGI, 2019c). This study focuses only on urban households. The urban sample consists of 31,000 households as shown in Table 1.
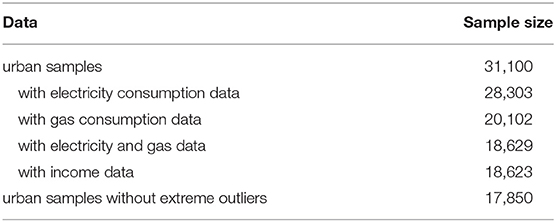
Table 1. Number of samples from ENIGH 2018 (INEGI, 2019a) that correspond to urban areas and have data for electricity consumption, gas consumption, and income.
Regarding household expenditure in energy services, the ENIGH includes electricity and domestic gas (liquefied petroleum gas (LPG) or natural gas) expenditure information corresponding to a billing period of 3 months (INEGI, 2019b). For each household, this information is usually the last paid bill closest to the time of the survey. Since the survey was conducted from August 21 to November 28, 2018, with most of the interviews carried out in the first half of this period, we assume that reported energy bills were paid between July and September. Additionally, we consider only observations with complete data for both electricity and gas expenditures because our analysis includes the correlation between the use of both energy carriers. We do not exclude users without access to electricity or gas as households without access to either service report a consumption of zero. Zero gas consumption is double-checked by verifying that the household does not report using gas-fired cooking or water heating appliances. Accordingly, the number of urban households in the survey containing complete entries for expenditures on electricity and gas is reduced to 18,629 (see Table 1).
From the reduced data set, we filtered out six households without income data. Furthermore, 773 observations (4% of the remaining households) were identified as extreme outliers and were removed from the dataset. These households include possible data entry errors and income or energy expenditure values that lie at least five times the interquartile range below the 1st quartile or above the 3rd quartile. Thus, our final sample size consists of 17,850 urban households with complete data on income and expenditure on both electricity and gas. Additional to the information on household income and energy expenses, four socioeconomic variables, namely, household size, status of dwelling ownership, number of rooms in the dwelling, and education level of the head of household were also extracted from the ENIGH to explore patterns of energy consumption among urban households Mexico.
3.1.2. Temperature
The Digital Climate Atlas of Mexico [UNIATMOS2019] provides raster maps of the mean monthly temperatures from 1902 to 2011 for the whole country. Using these maps, we calculate the average minimum summer temperature (average of June, July and August) of 2018 at the municipality level using a zonal statistics analysis. Due to privacy concerns, ENIGH observations have a geographic reference up to this level. Therefore, all households within a municipality are assumed to have the same temperature. The resulting temperature values at the metropolitan area level are listed in the Supplementary Material in Table B.
3.1.3. Definition of Metropolitan Areas
The National Urban System of 2018 defined by the National Population Council (CONAPO, Consejo Nacional de Población) identifies 401 cities that together host almost 93 million inhabitants, ca. 75% of the Mexican population. Among these, 74 cities are denominated metropolitan areas, which are characterized by their size and high functional integration, even when encompassing more than one municipality (CONAPO, 2018). This makes metropolitan areas the smallest administrative tier with the competence for energy policy. For this reason, we focus on a spatial energy burden analysis at this level.
The map in Figure 1 shows the 72 metropolitan areas considered in this study, all of them with a population above 100 thousand inhabitants (CONAPO, 2018). Each metro area has an identification code of the form X.Y, where X is the federal state and Y is an increasing number that enumerates the metropolitan areas within the same state. Their associated electricity tariff class, derived from the calculated average minimum summer temperature, is represented by the color of each polygon. Table A in Supplementary Material lists the metropolitan areas and their identification code, belonging federal state, population in 2015, and number of complete household observations. Two metropolitan areas, namely Ocotlán (14.02) and La Piedad-Pénjamo (16.01), were not included in this work, as the ENIGH 2018 reported no observations with complete information on expenditures for electricity and gas from these cities. The surface area of metropolitan areas in Figure 1 corresponds to the administrative area, and not to the actual built-up area. Therefore, especially in the north of the country, where administrative areas tend to be larder, urban households do not occupy all the space depicted but are concentrated in a smaller area (not visible in the map).
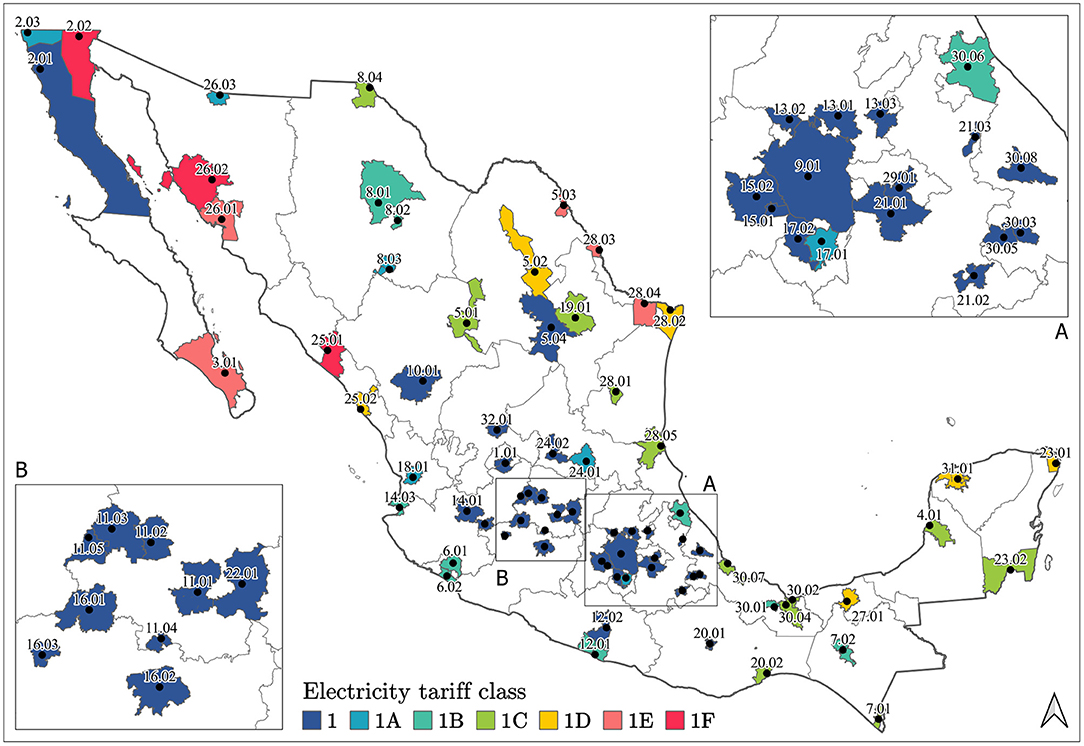
Figure 1. Metropolitan areas in Mexico according to the Urban National System (CONAPO, 2018) and their regular electricity tariff class. Each metropolitan area has an identification code of the form X.Y, where X is the federal state and Y is an increasing number that enumerates the metropolitan areas within the same state. Table A in the Supplementary Material lists the key information of the metropolitan areas in this map.
3.2. Calculation of Household Energy Consumption
3.2.1. Electricity Consumption
Residential electricity consumption in Mexico is heavily subsidized. The residential electricity tariff and subsidy structure is complex and is composed of 40 tariff levels (Sánchez et al., 2018). There are seven regular tariff classes: 1, 1A, 1B, 1C, 1D, 1E, and 1F, which are divided into three or four increasing consumption blocks and eight tariff regions linked to average minimum temperatures during summer months. All regular tariffs are below the supply cost and therefore, are subsidized. An additional tariff class, the high-consumption tariff (DAC, Tarifa Doméstica de Alto Consumo), applies above a specific consumption threshold which varies significantly depending on the tariff region. Once the consumer surpasses the monthly consumption threshold (calculated as the average of the last 12 months), DAC users are penalized by losing the federal subsidy and by paying their electricity at a price approximately 50% above the real supply cost (Hancevic and Lopez-Aguilar, 2019). The DAC price, composed of a fixed charge and a uniform marginal cost, applies to the whole consumption disregarding previous consumption blocks. This creates a strong incentive for DAC households to undertake actions to keep electricity consumption from the grid under the DAC threshold, such as the adoption of solar technologies and energy efficiency measures.
A subsidized scheme, where high temperature zones get lower marginal prices and have larger consumption blocks, is the backbone for determining the electricity price for all tariff levels (Hancevic and Lopez-Aguilar, 2019; Hancevic et al., 2019). Figure 2 illustrates the summer tariff structure in 2018. The average minimum temperature for each regular tariff class is shown in the legend. The electricity price, , varies according to the tariff class i and consumption block j. The monthly consumption threshold to be considered a DAC user, , is indicated with a colored circle for every regular tariff class i. The inferior and superior electricity consumption limits for every tariff i and consumption block j are and , respectively. The mathematical notation of the monthly consumption threshold to be considered a DAC user for tariff class 1E, , and the inferior and superior limits for the third consumption block of tariff class 1F, and , are displayed in Figure 2 for exemplary purposes. Notice that while the electricity price for tariffs with moderate minimum summer temperatures (1, 1A and 1B) can jump very quickly into the DAC price, , larger consumption blocks are allowed for users in warmer regions as higher electricity consumption is assumed due to cooling and ventilation needs.
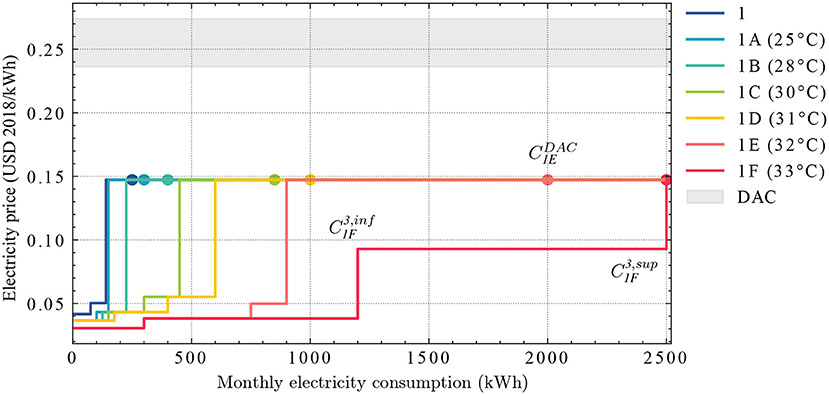
Figure 2. Residential tariff scheme for Summer 2018 with increasing block prices for the seven regular tariff classes and the unsubsidized DAC tariff. The mathematical notations of the monthly consumption threshold to be considered a DAC user for tariff class 1E and the inferior and superior limits for the third consumption block of tariff class 1F, , and , are displayed for illustrative purposes.
Data reported in the ENIGH likely correspond to the most recent utility bill. Therefore, we assume that reported values refer to quarterly expenditure on electricity at summer prices including taxes. The summer rate is billed from May 1st to October 31st. Let xelec be the monthly household expense for this service. A tax a of 16% is assumed for all households except for those located in municipalities at the border with the US where a= 11%. The untaxed expenditure on electricity services without taxes, , calculated in Equation (1), is used together with the summer tariff scheme in Figure 2 for the backwards calculation of the monthly electricity consumption, Eelec as shown in Equation (2). Eelec is computed for all households in the sample size. Each household is assigned a regular tariff class based on the calculated minimum summer temperature in section 3.1.2. Thus, a household in tariff class i with consumption blocks j = 1, ..., m, is assumed to lie within the consumption block L if with 0 < L ≤ m. Additionally and similarly to the calculation in Hancevic and Lopez-Aguilar (2019), in order to identify potential DAC households, the monthly electricity consumption that would emerge if it were a DAC user is compared with the monthly DAC threshold, . All users who exceed this threshold are considered DAC users. This is shown in the second case of the function in Equation (2).
3.2.2. Gas Consumption
Household gas consumption values are derived from the quarterly expenditures on natural gas and LPG. Although both energy carriers involve different infrastructures and supply chains, they are used for exactly the same purposes in the Mexican residential sector and can therefore be equated. The monthly gas expenditure, xgas is then the addition of the monthly expenditures on natural gas and LPG, xNG and xLPG (Equation 3). The use of natural gas, however, is limited to cities with a natural gas network. Thus, only households in the regions indicated in SENER (2020) have natural gas expenditure. Yet, it is possible that households in these cities also report LPG expenditure due to the fuel's high flexibility for transportation and storage. Consequently, the monthly gas consumption, Egas, is calculated as:
where pNG and pLPG are the retail prices for natural gas and LPG. The retail price of natural gas used in this study is 6.25 USD(2018)/GJ (0.02 USD(2018)/kWh) and corresponds to the average price of all residential distributors for the summer season of 2018 (SENER, 2020). For the case of LPG, two different retail prices are used: 0.54 USD(2018)/L for the refill of stationary tanks and 1.01 USD(2018)/kg for the sale of gas cylinders. Both prices correspond to the national average price reported for the summer season of 2018 (CRE, 2018). Additionally, a calorific value of 13.6 kWh/kg and a density of 0.51 kg/L were used for the energy calculation. This results in an energy price of 0.07 USD(2018)/kWh for the LPG, 3.2 times more expensive than natural gas.
3.3. Energy Burden
The energy burden, EB is computed in Equation (5) where I is the monthly household income.
Similar to Kontokosta et al. (2020), rather than defining an energy poverty line, we report the distribution of energy burden values at the national and city-levels. This approach allows the decoupling energy poverty from a national fixed percentage threshold. Furthermore, we classify the level or intensity of energy burden into five classes, from very low to very high and with equal intervals as shown in Table 2. In this way, we can easily identify those households that spend proportionately more —and less— of their income in energy services.
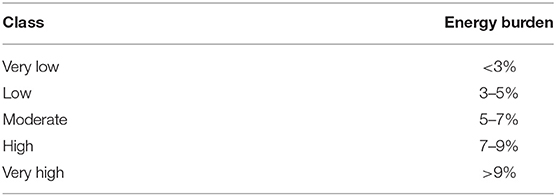
Table 2. Classification of levels of energy burden.
4. Results and Discussion
How much energy a household consumes is a key determinant of its energy burden. Therefore, we begin this section with a detailed analysis of the energy consumption of Mexican urban households. We first present a statistical analysis of energy consumption at the national level and then explore variations in energy use derived from households' socioeconomic and geographic characteristics. Next, considering these findings, we analyze the distribution of energy burden for all urban households focusing on disparities by consumption and income level. Finally, the energy burden is spatialized in a subnational analysis that benchmarks 72 metropolitan areas. At this spatial scale, we identify similar consumption and energy burden patterns and point out challenges and opportunities for a better-targeted energy policy toward sustainable cities.
4.1. Monthly Household Energy Consumption
The normalized histograms in Figure 3 show how energy consumption is distributed among Mexican households for electricity, domestic gas, and their aggregate consumption. The median consumption value is indicated with a dashed line and the legend in each subplot displays its skeweness and kurtosis for a better comparison of the shape of the distributions.
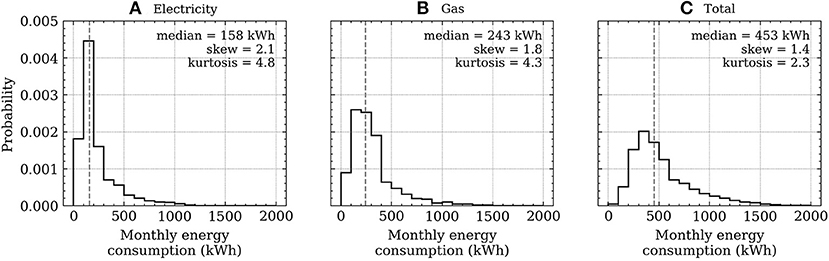
Figure 3. Normalized histogram (solid line) and median (dashed line) of monthly consumption of (A) electricity, (B) gas, and (C) total energy for urban households in Mexico (sample size = 17,850).
The national median monthly electricity consumption for urban households is 158 kWh (Figure 3A). This value corresponds to the summer season and is 7% lower than the average consumption of July, August, and September of 2018 reported by the Federal Electricity Comission (CFE, Comisión Federal de Electricidad) (CFE, 2018). Such difference is likely attributable to the uncertainty of the month reported in the ENIGH. While September remains a month of high temperatures in northern Mexico and, therefore, shows a high electricity demand, this is not the case in the central region, where temperatures have already dropped for that time of the year. Due to higher electricity consumption in summer months because of cooling and ventilation appliances, particularly in households with tariff classes 1D to 1F (see Table 4), the average monthly electricity consumption is significantly lower than the calculated value for the summer season; approximately 25% lower according to CFE (2018). In the absence of disaggregated consumption data at the household level outside the summer season, we carry out the rest of the study with these summer values.
Regarding domestic gas consumption in urban households, the national median monthly consumption is 243 kWh (Figure 3B). This value includes the consumption of both natural gas and LPG, which corresponds to 16 and 84% of the total observations, respectively. Overall, the median monthly energy consumption of the urban residential sector is dominated by the consumption of gas and reaches 453 kWh (Figure 3C). Computed as shares of the total household energy consumption, electricity and gas account for 40 and 60%, correspondingly. These values are similar to the percentages reported for urban households by Franco and Velázquez (2016) of 45% for electricity and 55% for gas use.
Median values of monthly energy consumption already provide a first glimpse of the differences in the amount of electricity and gas used in Mexican urban households. This difference is more noticeable if we compare their distributions in Figure 3. We observe that the three distributions are positively skewed indicating that most households are at the lower end of consumption. However, this skewness is more pronounced for electricity consumption (skew = 2.1). The kurtosis value of this distribution (kurtosis = 4.8), a measure of the thickness of the tails, is also the largest of the three distributions. This implies that the electricity consumption of the observed households tends to remain relatively close to the median value, while this distance increases for the gas consumption. Moreover, as illustrated in Figure 3C, the total consumption values are more spread out, suggesting that high electricity consumption does not necessarily correlate with high gas consumption.
These differences in energy use raise questions as to which factors are influencing gas and electricity consumption. Are households at the low end of the total energy consumption range meeting their energy needs, or are they potentially constrained by their income? At the other end of the spectrum, are households in the high consumption range victims of circumstance, i.e., trapped in a position of high energy need, or is their high consumption the result of immoderate energy use? To facilitate this assessment, we present further analyses in the following sections looking at how these consumption patterns relate to socioeconomic and geographic factors, and consequently, to the energy burden.
4.2. Assessing Variations in Energy Use
Once the average household direct energy consumption is estimated for each observation, it is possible to investigate the relationship between energy use and factors related to the household and its members. We present three sets of analyses in this section: firstly, the influence of household income in energy consumption is assessed; secondly, four sociodemographic variables namely household size, number of rooms, dwelling ownership, and education level of the household head, are linked to energy use; and thirdly, the impact of the local temperature is evaluated.
4.2.1. Energy Use and Income
Household income data is reported in the ENIGH as the aggregate of the last 3 months prior to the time of the survey. The household quarterly income in MXN is converted into monthly values in USD using the exchange rate 1 USD (2018) = 19.02 MXN. The median monthly income for urban households in Mexico reached 796 USD in 2018.
An initial investigation of the relationship between income and energy consumption indicates that energy consumption tends to increase by income decile. This finding is in line with previous studies (Rodriguez Oreggia and Yepez Garcia, 2014; Franco and Velázquez, 2016; Jimenez Mori and Yepez-Garcia, 2017; Santillán Vera and de la Vega Navarro, 2019). Figure 4 shows the distribution of monthly household energy consumption as a boxplot and the median income as a dot for each income decile. While each median consumption value is slightly higher than the previous one, there is a considerable overlap of the boxes, whiskers and outliers between deciles. Such overlaps illustrate the broad spectrum of individual practices and actions around domestic energy needs, which are permeated by climatic, social and cultural factors that determine a standard of living or social status (García Ochoa and Graizbord Ed, 2016). Determining whether energy needs for all income levels are adequate or whether these are satisfied is not within the scope of this paper. However, the direct comparison of median energy consumption by income level already yields an insight into the relationship between income and energy use.
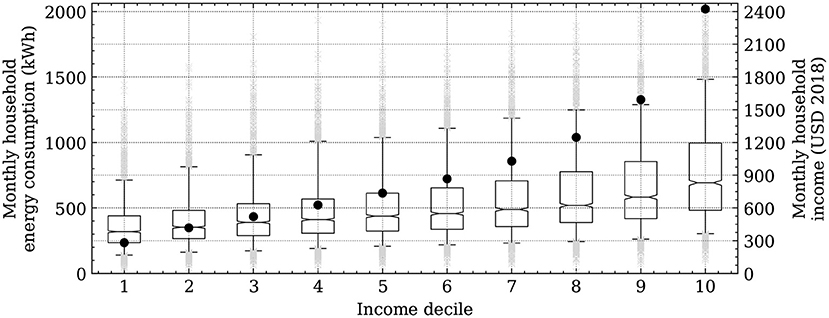
Figure 4. Monthly energy consumption (boxplots) and median income (dots) for Mexican households by income decile.
The relative difference in median income between deciles is larger than the difference in energy consumption, particularly for higher income deciles (Figure 4). Thus, income is not the overall determinant in energy consumption but certainly a relevant one. This finding is in line with the work of Steinberger et al. (2020) that demonstrates that electricity use is highly dynamically coupled to domestic purchasing power but highlights that satisfaction of energy services improves lives only up to a threshold of consumption. Moreover, investments in improving household energy efficiency are usually more common with ascending wealth (Chatterton et al., 2016; Baltruszewicz et al., 2021), potentially decoupling absolute consumption from income as the latter increases.
Similar to Chatterton et al. (2016) in their analysis of energy use for the UK, Table 3 shows the differences in the median household energy consumption between the lowest and the highest income deciles. In the case of electricity, households in the lowest income decile consume 59% of that in the highest decile. This difference is more evident for gas consumption. Overall, the median energy consumption of the wealthiest households (10th income decile) is more than double that of households in the lowest income decile, while their income is more than eight times higher. The income inequality among urban households is reflected not only in the inequality in energy consumption, but also in the per capita CO2 emissions gap. Santillán Vera and de la Vega Navarro (2019) calculate that in 2014 the CO2 emissions per capita of the richest 10% were 5.4 times those of the poorest 10%.
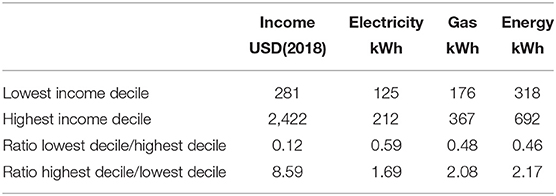
Table 3. Differences in the median monthly household energy consumption between highest and lowest income deciles.
4.2.2. Energy Use and Sociodemographic Variables
We explore the relationship of four sociodemographic variables in Figure 5. The first plot, Figure 5A, displays the variation of energy consumption depending on the household size. As the number of household members increases, so does the median monthly energy consumption. Even though each household member has specific energy needs, common spaces involving shared or simultaneous energy use dominate the overall household energy consumption. Increasing the size of the household by one person represents, on average, an increase of 18 kWh in the household monthly energy consumption. The level of dwelling ownership, from lent (L) to owned (O1 and O2), shows clear influence in the energy consumption in Figure 5B. Dwellings that are owned present the highest median energy consumption values. We observe an average jump of 29 kWh in the household monthly energy consumption between tenure levels. The size of the dwelling, expressed as number of rooms, has an incremental effect in the energy consumption of 33 kWh per extra room as depicted in Figure 5C. However, this behavior is not monotonic as from seven rooms on, having one more room does not considerably affect the household energy consumption. Finally, we observe in Figure 5D that a higher education level of the head of household results in a higher median energy consumption. We calculate an average increase of 40 kWh/month in the total energy consumption for each education level.
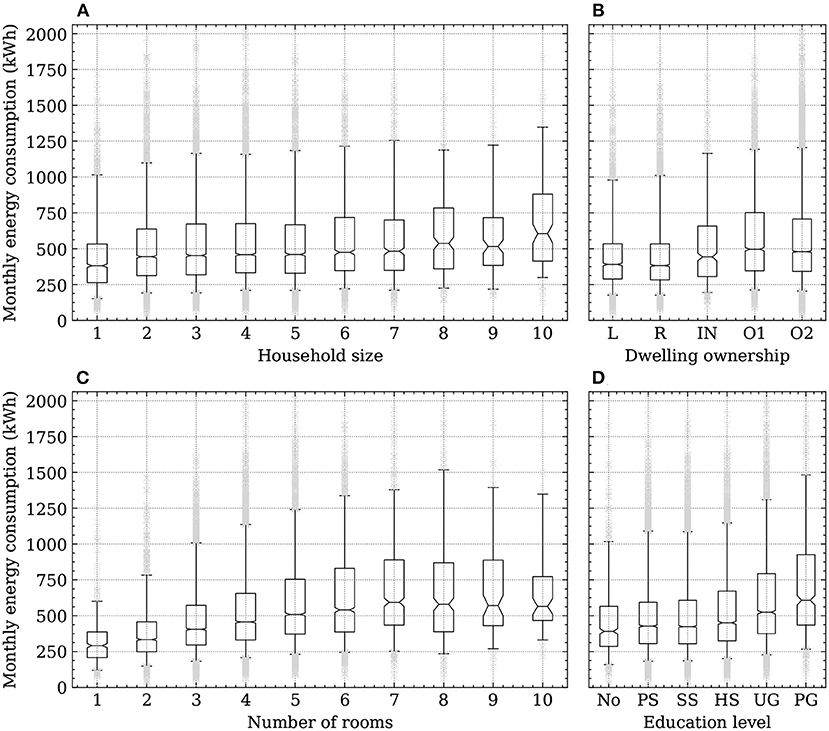
Figure 5. Socio-demographic variables and household energy consumption. (A) Number of persons living in the household. (B) Status of household ownership: R, rented; L. loaned; O1, own and still paying; O2, owned and paid; IN, intested. (C) Number of rooms in the dwelling. (D) Completed education level of the household head: no education, PS, primary school; SS, secondary school; HS, high school; UG, undergraduate studies; PG, postgraduate studies.
The variables dwelling ownership and dwelling size are directly associated to the household income. The wealthier the household, the greater the probability of owning a house. In any given tenure status, larger houses usually imply higher acquisition and maintenance costs, and therefore, greater purchasing power of the household members. Moreover, according to CEPAL (2018), in Latin America, the level of education is the factor that produces the most significant income differences in the labor market. Therefore, the rising household energy consumption observed in Figures 5B–D, can be explained by an implied increasing income. Yet, similarly to the boxplots in Figure 4, it is noticeable that, within the different categories for the four analyzed variables, there are likely to be households that are either well above or well below median household energy consumption values.
4.2.3. Energy Use and Temperature
Climatic conditions, in terms of ambient temperature, influence the use of cooling and ventilation equipment, as well as hot water for showering purposes. Table 4 shows the calculated median monthly electricity and gas consumption for urban households for different temperature values. These temperatures correspond to the average minimum summer temperature of each regular electricity tariff class.
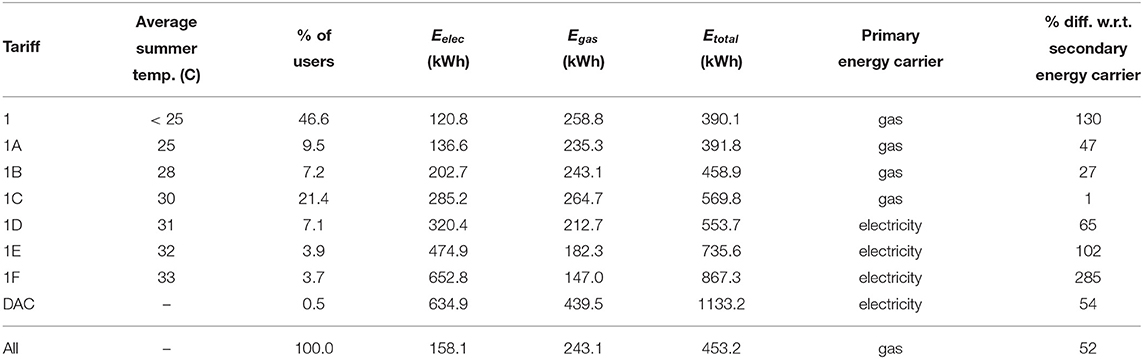
Table 4. Distribution of ENIGH 2018 households per tariff class and calculated median monthly energy consumption by energy carrier; primary energy carrier, i.e., energy carrier that dominates the total energy consumption, and its percentage difference with respect to the secondary energy carrier.
We observe that electricity consumption tends to increase with higher summer temperatures. Howell et al. (2017) determine a maximum temperature threshold of 26°C for active ventilation systems to operate. This implies that any household located in climatic zones whose average monthly temperature exceeds 26°C requires fans or air conditioning units for their thermal comfort. Certainly, not all households in tariff classes 1B to 1F in the northern and southern parts of the country (see Figure 1), own such appliances. González Osorio and Beele (2016) identify that the penetration of active ventilation systems depends not only on ambient temperature but also on the electricity tariff and household income, with the latter being the most influencing factor. Even so, higher ambient temperatures lead to more pronounced thermal discomfort and thus higher penetration of active ventilation systems, which in turn results in a higher residential energy demand. Our calculations show that the median electricity consumption of households located in regions with an average minimum summer temperature of 33°C (tariff class 1F), is 5.4 times that of households in mild climate regions (tariff class 1). Nonetheless, the impact of cooling and ventilation appliances on the national electricity consumption is smoothed since most households belong to tariff class 1 and only 14.7% of the total observations are located in regions with average minimum summer temperatures greater than 30%. This distribution is similar to the reported by CFE for 2018 (CFE, 2018).
Domestic gas consumption, on the other hand, presents an opposite but weaker trend. In general, the use of gas decreases with increasing temperatures. Diego-Ayala and Carrillo-Baeza (2015) show that polyethylene water tanks, usually located in residential building rooftops all over the country, heat the stored water up to 38°C during days with 30°C of average maximum temperature. Therefore, the demand of additional energy sources for heating water, including gas, is reduced.
Energy consumption patterns due to temperature, and thus, to the geographic heterogeneity of the country, are evident. Gas consumption clearly dominates the total household energy consumption for households with mild and warm temperatures (tariff classes 1 to 1C) while electricity dominates it for higher temperatures (tariff classes 1D-1F). The last two columns of Table 4 show the dominant or primary energy carrier and its median percentage difference with respect to the secondary energy carrier. Households in tariff class 1, for example, consume 130% more gas than electricity. Conversely, electricity consumption of households in tariff class 1F, is 285% greater than gas consumption. Households in tariff class 1C have similar consumption values for both energy carriers.
How dominant is the use of electricity or gas in a household does not depend on temperature alone. Figure 6 further disaggregates the tariff-based percentage difference between primary and secondary energy carriers in energy consumption deciles. The doted black line indicates an equal consumption of electricity and gas. Above this line, the household energy consumption is dominated by electricity and below this line, within the shaded area, it is dominated by gas. We identify significant differences in how households use electricity and gas depending upon their total energy consumption. The less energy consumed, the more equal is the use of electricity and gas across all tariffs. However, as energy consumption increases so does the difference between tariff classes and thus, the impact of temperature is accentuated. Households in regions with mild climates and in the high consumption range consume up to 500% more gas than electricity, a very different picture than the observed for households in lower consumption ranges.
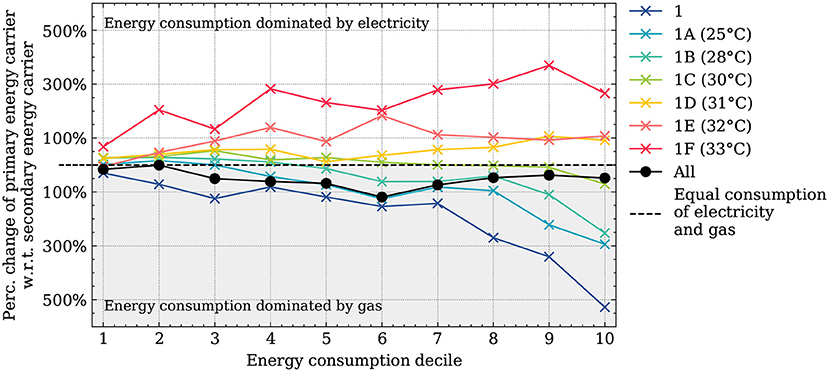
Figure 6. Percentage difference of monthly energy consumption of primary energy carrier with respect to secondary energy carrier by energy consumption decile and electricity tariff class.
4.2.4. Summary
Table 5 summarizes the correlation, r, between household energy consumption and the selected economic, sociodemographic and geographic factors analyzed in this section. We observe that household electricity consumption is mainly influenced by ambient temperature (r = 0.64), followed by household income (r = 0.25). In the case of gas consumption, household income is the most important influencing parameter (r = 0.36) followed by the dwelling size (r = 0.31).
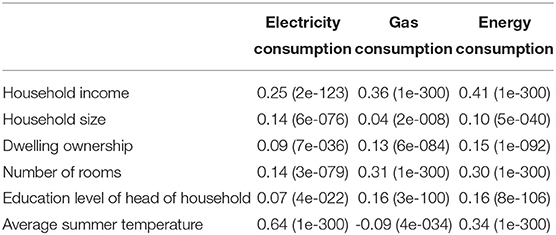
Table 5. Spearman correlation coefficients of household characteristics and household energy consumption; p-values are shown in parentheses.
4.3. Energy Burden of Mexican Urban Households
Household energy consumption has multiple drivers, as already investigated in the previous sections. This results in a wide range of energy consumption totals, which in turn, translates into varied energy burden values. For 2018, the calculated median energy burden, EB, for Mexican urban households is 3.5%. This value is slightly higher than the national average energy burden in the US of 3.1% reported in Drehobl et al. (2020). Figure 7A shows the distribution of the calculated energy burden as a normalized histogram. Here, the fraction of households facing a specific level of energy burden are identified by color. We observe that 35% of the total observed households have a very low energy burden, i.e., their expenses on energy services account for less than 3% of their income. An the opposite end, 10% of the households have a very high energy burden as they spend more than 9% of their income on energy bills.
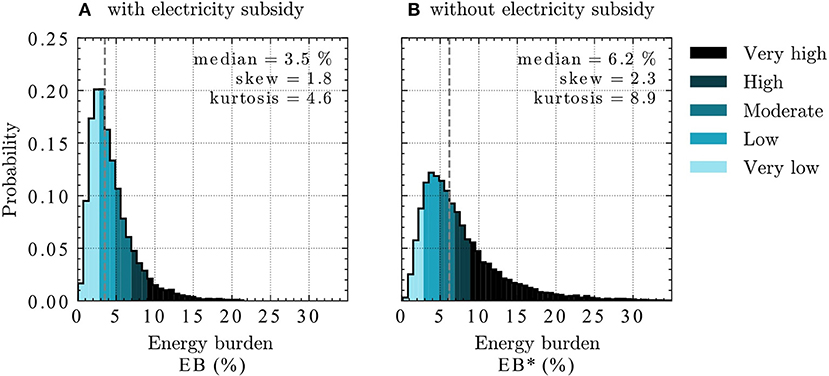
Figure 7. Distribution of energy burden with (A) and without (B) electricity subsidy. Levels of energy burden are identified by color.
The energy burden in Figure 7A considers the current residential electricity tariff system, which allocates a federal subsidy that increases according to the average minimum summer temperature, and decreases with increasing consumption (see Figure 2). If a household consumes more electricity than the consumption threshold defined to be considered a DAC user, the household is no longer eligible for the subsidy and is further penalized by an electricity price higher than the actual supply cost. This creates a strong incentive to avoid wasteful consumption. However, the median electricity consumption is well below the DAC threshold for all regular tariff classes as shown in Table 4. Here, we observe that only 0.5% of the households in the reduced ENIGH sample are identified as DAC users. This value is smaller than the actual share of DAC users reported by CFE (2018) of 1.2%. In any case, almost all Mexican households qualify for subsidized electricity. We calculate that urban households pay, on average, only 36% of the supply cost. Hancevic and Lopez-Aguilar (2019) and Hancevic et al. (2019) report similar values of subsidy and further calculate that the fiscal burden associated to the residential electricity subsidy represents approximately 0.5% of the national GDP.
Subsidies are often justified as policy instruments to protect the most vulnerable sectors from price increases. However, in the case of universal subsidies, the exclusion error is minimized at the cost of maximizing the inclusion error (Hancevic and Lopez-Aguilar, 2019). In the case of the electricity subsidy in Mexico, the risk of excluding vulnerable households is eliminated at the expense of including households who can afford the actual supply cost. This is observed in the energy burden distribution that results from households paying the unsubsidized electricity price in Figure 7B. Assuming an average DAC price 50% above the supply cost (Hancevic and Lopez-Aguilar, 2019), we calculate an unsubsidized electricity price of 0.17 USD(2018)/kWh and apply it for the whole consumption. Our findings show that even without the electricity subsidy, 15% of the households present a very low energy burden. Yet, the share of households with a very high energy burden increases to 34%. This suggests that, at the national level, the current electricity subsidy scheme does alleviate the financial burden, but does so for both vulnerable and non-vulnerable households.
Nonetheless, a more detailed analysis is necessary to characterize the distribution of the energy burden and thus, find out how the benefits of the electricity subsidy are distributed. Figure 8 shows the distribution of energy burden with and without subsidized electricity among urban households in Mexico by income and energy consumption decile. Each heat map is divided into 100 cells. Each cell clusters the urban households that lie in a specific income and consumption decile and displays three different outputs. The first number is the median energy burden as a percentage. This value is associated to a level of energy burden which is represented with the cell color. The second number, in parentheses, is the share of total households in that particular cell; this number is also a percentage. Adding these percentages per row or column yields 10%. For example, households in the fifth income decile and fifth energy consumption deciles in Figure 8A account for 1.1% of the total households and have a moderate energy burden with a value of 4.2%.
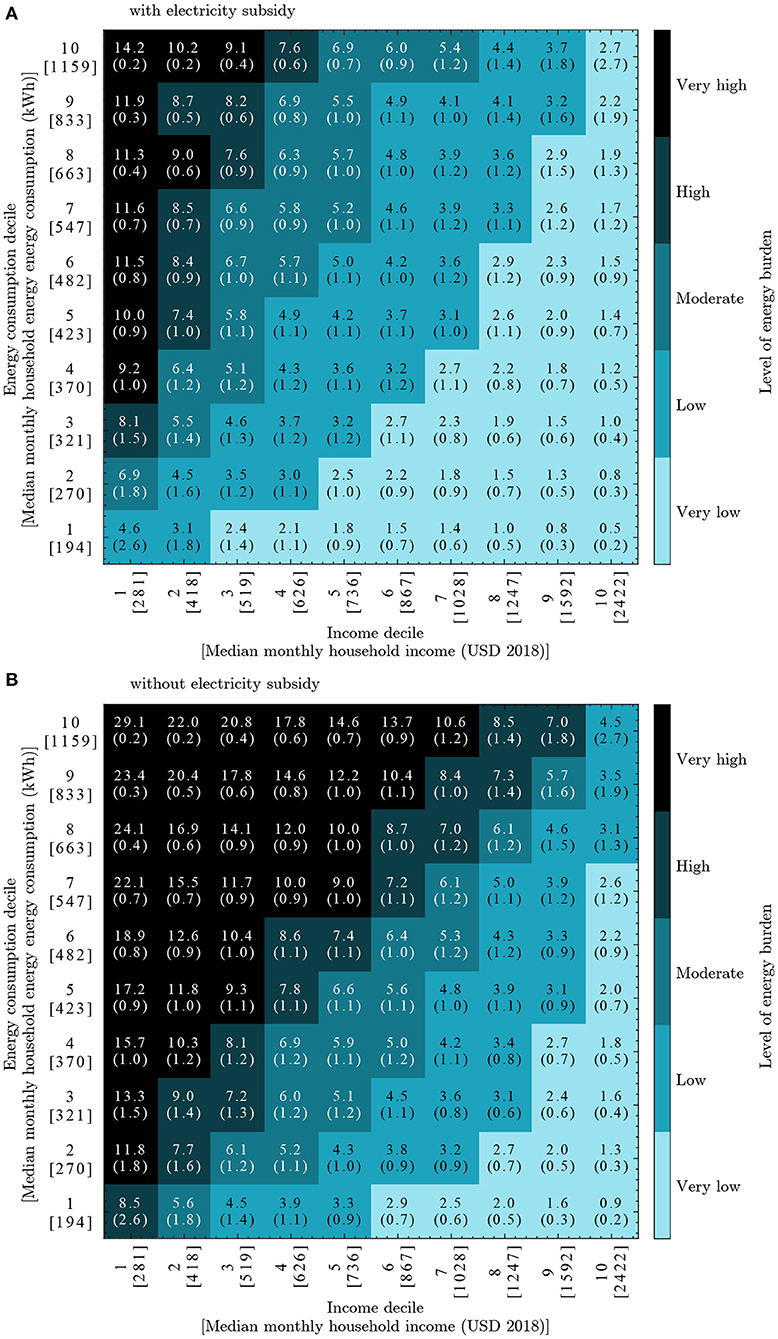
Figure 8. Distribution of energy burdens of Mexican urban households by income and energy consumption decile. Energy burden values and share of population (in parentheses) are displayed as percentages inside each cell. Median absolute values for each decile are shown in brackets for both axes. (A) with electricity subsidy. (B) without electricity subsidy.
There is a significant association between the intensity of energy burden and household income. We observe an inversely proportional relationship between the lowest income levels and the energy burden in both heat maps. This relationship weakens as income increases and strengthens as energy consumption increases. In the case of the energy burden considering the current electricity subsidy scheme in Figure 8A, we find that households in the lowest income and highest energy consumption deciles have a median energy burden of 14.2%. A similar consumption value (1,159 kWh/month) represents only 2.7% of the income of households in the tenth income decile, indicating an energy inequality. On the other hand, even the median energy consumption in the lowest consumption decile (194 kWh/month) signifies already 4.6% of the median income (194 USD) for the poorest households and 0.5% of that of the richest households (2 422 USD). Overall, low-income urban households spend 7.3 times more of their income on energy costs compared to the median spending of the tenth income decile (10.7 vs. 1.5%) and 3 times more than the national median energy burden. This inequality becomes more evident in Figure 8B which shows the energy burden values without the electricity subsidy. In this case, the energy burden for the poorest households (first decile) ranges from 8.5 to 29.1% while the wealthiest households keep a very low level of energy burden up to the seventh consumption decile.
The fact that low-income households still present very high and high levels of energy burden, even with subsidized electricity prices, demonstrates that the current residential electricity subsidy scheme is insufficient to alleviate energy vulnerability in urban Mexico. Particularly, the very high median energy burdens of households in the lowest income deciles and top consumption deciles in both heat maps, suggest that such households might be trapped in a position of high energy need, possibly driven by the use of active ventilation appliances and the limited agency to reduce their electricity consumption. At the other end, low-income households in the lowest energy consumption deciles might also reflect hidden energy poverty (Tirado Herrero, 2017). Their energy consumption might be potentially constrained by their income, preventing them from meeting their energy needs due to prioritizing more urgent household expenses.
Consequently, low-income households at both ends of the energy consumption range face energy insecurity. This situation can create a negative feedback loop that reinforces social inequality making it extremely hard for such households to break out the poverty cycle (Brown et al., 2020; Kontokosta et al., 2020). For example, the health effects due to constant thermal discomfort and the stress caused by the uncertainty of affording energy bills, reduce productivity and increases healthcare expenses (Drehobl et al., 2020). Moreover, energy insecurity can also result in energy theft. Briseño and Rojas (2020) identify that households with illegal electricity connections to the public network are often located in low-income areas where violence is already a means of covering basic needs.
Additionally, we observe that the widespread eligibility for subsidized electricity has a regressive effect as it benefits those that consume more. In Figure 8, the share of households in the top energy consumption deciles increases with increasing income, indicating that the wealthiest households are consuming more energy and therefore, receiving a disproportionate share of the total residential subsidies. Vagliasindi (2013) calculates that Mexican households in the top decile accounted for more than 15% of the total residential electricity subsidies in 2008. A situation that has not improved in recent years (Hancevic and Lopez-Aguilar, 2019; Hancevic et al., 2019).
The very low energy burden values found across almost all energy consumption deciles in the top income decile in both heat maps in Figure 8, suggest that the electricity subsidy does not considerably impact the finance of these households. Furthermore, as stated in Chatterton et al. (2016), the large difference between the energy burden of high- and low-income households indicates that expectations or compulsions for households to reduce their consumption might be placed much more fairly on high-consumption households, where high incomes and low energy burdens imply a greater capacity to control their energy consumption. However, distorted price signals due to inefficient subsidies encourage wasteful consumption and mute incentives for users to invest in energy efficiency, to take energy saving measures or to adopt green technologies (Komives et al., 2008; Vagliasindi, 2012, 2013; Sánchez et al., 2018; Hancevic and Lopez-Aguilar, 2019; Hancevic et al., 2019). This is not only economically costly to taxpayers, but also has an important opportunity cost to society and the environment.
The highly regressive nature of the residential electricity subsidies in Mexico has been confirmed in several studies (Komives et al., 2008; Vagliasindi, 2013; Sánchez et al., 2018; Hancevic and Lopez-Aguilar, 2019; Hancevic et al., 2019). The varied energy burden values among urban households in Mexico reflect that inter-household diversity is not adequately considered in the current universal subsidy scheme. Nevertheless, subsidies could be more effectively allocated with policy instruments that fit the segments of target groups. This requires as a first step, identifying target groups and understanding the drivers of their behavior (Egmond et al., 2006). To this end, we compare 72 metropolitan areas and pinpoint patterns of energy use and energy burdens that might be useful to address targeted energy needs and opportunities.
4.4. Energy Use and Energy Burden in Metropolitan Areas
A national energy burden analysis does not account for regional differences in economic characteristics, climate and diversity in energy end-uses (Agbim et al., 2020); thus, analyses at higher spatial resolutions are needed. In this way, we recognize the geographic variation of energy-related (in)justices and its underlying drivers. We select the metropolitan area as the spatial unit to carry out a detailed analysis on energy use and resulting energy burdens as it is often the smallest area with economic, social and territorial cohesion (CONAPO, 2018) as well as the administrative tier of the local government with the principal competence for energy policy (Asaporta and Nadin, 2020).
Figure 9 condenses key information on energy use and the resulting financial burden of covering energy services for households in 72 Mexican metropolitan areas in six charts. The first column displays the median energy burden value, EB, in 2018. This value considers the current subsidized electricity tariff. The second column is the median energy burden without the electricity subsidy, EB*. The median price-cost ratio, P/C, i.e., the fraction of the supply cost paid by households in each metropolitan area, is visualized in the third column. A lower ratio corresponds to a higher federal subsidy. The fourth chart concerns the distribution of urban households by energy burden level and shows the median household income in the upper x-axis. The median monthly energy consumption divided into the corresponding shares of electricity and gas (lower x-axis) along with the average minimum summer temperature (upper x-axis) in the city are shown in the fifth chart. Finally, the size of the city in terms of number of inhabitants is presented in the sixth column. The metropolitan areas are sorted in descending order according to their energy burden, EB. Additional details to better understand the spatial picture of energy affordability in Mexico are found in Figure A and Table C in the Supplementary Material. Table C in Supplementary Material lists the metropolitan areas along with the distribution of energy burdens across the defined five levels and Figure A in Supplementary Material shows the geographic distribution of the energy burden in Mexico.
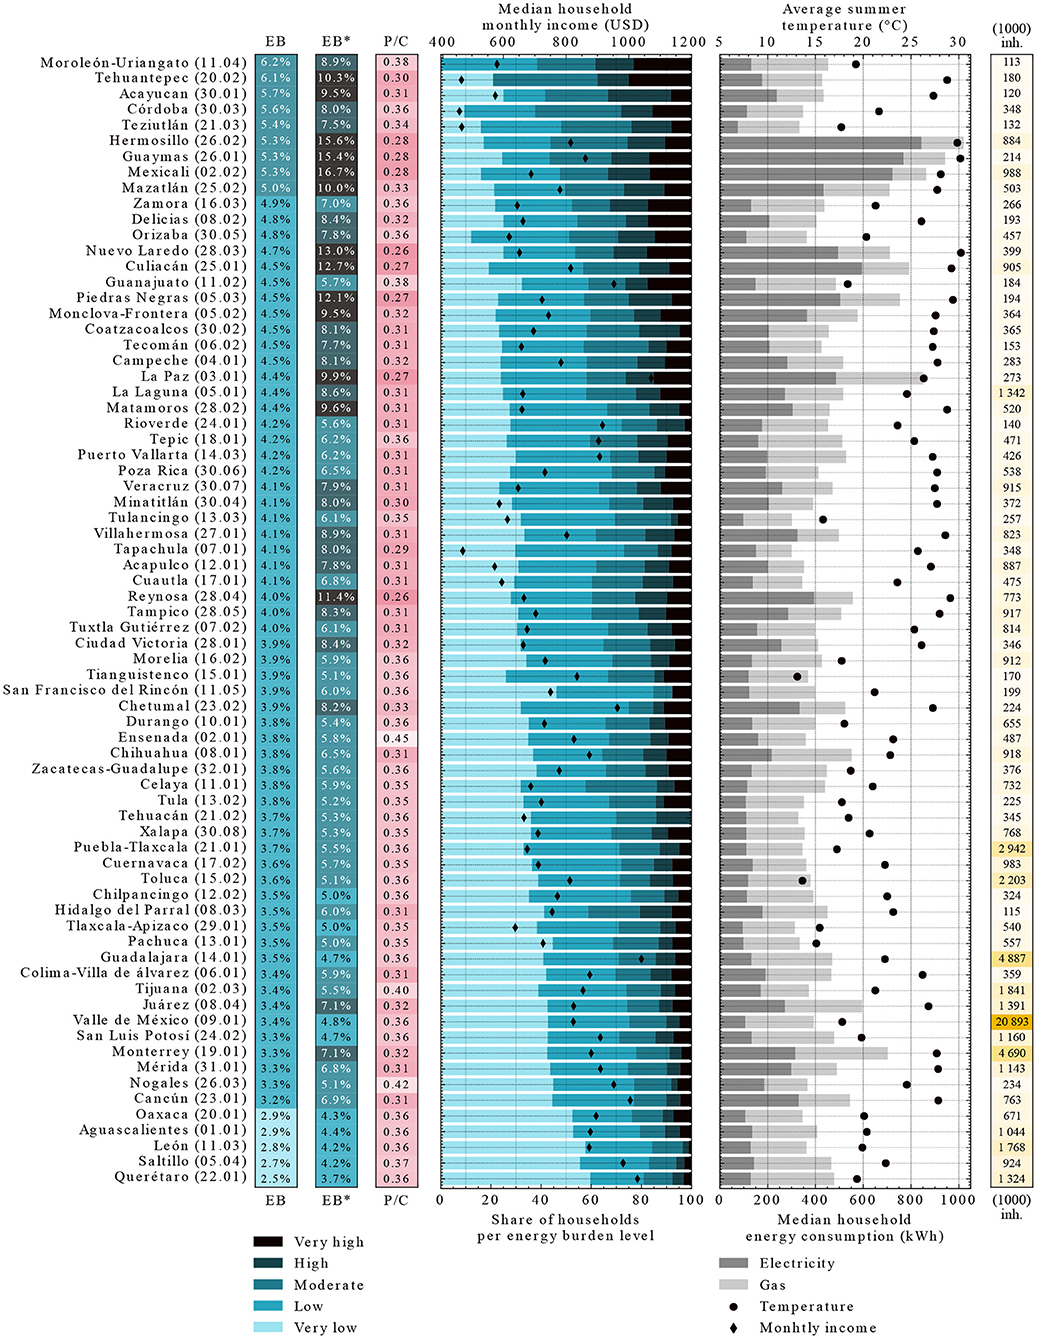
Figure 9. Energy burden with and without subsidy, electricity price/cost ratio, distribution of energy burden, household income, energy consumption, average minimum summer temperature, and population of 72 metropolitan areas in Mexico.
We observe that most metropolitan areas have a moderate median energy burden. Nevertheless, more than a third of them (27 out of 72) have more than 20% of households facing high and very high energy burdens. Conversely, 90% of the cities show at least 20% of the households with a very low energy burden, and this shares reaches up to 40% for a quarter of the analyzed urban centers. This suggests that one-size-fits-all energy policies jeopardize the government's to ensure a fair distribution of resources and advance energy equity. Instead, there is a need for tailored urban energy strategies that address particular opportunities for improving local sustainable development and energy justice, two agendas that are closely intertwined (Jenkins, 2016).
The five cities with the highest energy burden levels are relatively small cities that also show some of the lowest levels of energy consumption and income. At the same time, two of them, namely, Tehuantepec (20.02) and Acayucan (30.01), have higher than average summer temperatures, indicating that households in these cities are potentially unable to switch on active ventilation systems, despite the high electricity subsidy of 70%. González Osorio and Beele (2016) identify that the penetration of air conditioning units and fans in high temperature regions augments with increasing household income. They show that without economic restrictions, the probability of a household owning active ventilation systems would drastically increase, particularly in the southern part of the country, where Tehuantepec and Acayucan are located (see Figure A in Supplementary Material). Therefore, the median low energy consumption in contrast to the high expected electricity demand in these two cities suggests that the median household cannot afford to meet its energy needs. Households in the other three cities in this cluster, Moreolón-Uriangato (11.04), Córdoba (30.03), and Teziutlán (21.03), might be able to cover their energy needs, but their low income might push them into energy insecurity. Poverty alleviation strategies, tailored to the needs of energy-insecure households to avoid getting caught in cycles of poverty, might improve the economic situation, and consequently, the energy burden in these five cities (Bohr and McCreery, 2020).
At the other end of the spectrum, the five cities with the lowest energy burden, namely, Querétaro (22.01), Saltillo (05.04), León (11.03), Aguascalientes (01.01), and Oaxaca (20.01), have a similar moderate energy consumption dominated by gas and an average-to-high median household income. Due to their geographic location (see Figure 1), they have a mild climate and therefore, the federal subsidy represents more than 63% of their electricity price. With close to 80% of the households in these cities with low energy burdens, electricity subsidies could be reduced by, for instance, decreasing the DAC threshold or adjusting the consumption blocks (Sánchez et al., 2018). Except for Oaxaca, these cities host close or more than one million inhabitants. Therefore, there is a significant saving potential of federal budget that could be directed to other sustainable development goals.
Moreover, given a reformed residential electricity tariff with a focus on reducing energy vulnerability, households in metropolitan areas with above-average energy consumption and incomes, like Guaymas (26.01), La Paz (03.01), Chetumal (23.02), Chihuahua (08.01), Monterrey (19.01), and Cancún (23.01), are likely to have a greater ability to undertake action to reduce their energy consumption and energy burden given their greater level of financial freedom. Chatterton et al. (2016) suggest that such users also share structural factors such as control over their housing, either through ownership or because they live in a house rather than an apartment, that can potentially unlock greater willingness to take up energy efficiency measures or invest in clean energy technologies. This could trigger a faster market development of solar photovoltaic panels and solar thermal collectors, which according to Báez Fumero and Molar-Cruz (2021) is still unexploited despite the vast solar potential in Mexico. The use of large-scale renewable energy in urban environments is a concrete solution to promote sustainable development, as it maximizes economic opportunities while minimizing the impact of urban energy demand by reducing CO2 emissions.
The metropolitan areas with the highest median household electricity consumption are Hermosillo (26.02), Guaymas (26.01), Mexicali (02.02), and La Paz (03.01). These cities are located in hot climatic regions and consequently, receive some of the highest subsidies paying only 28% of the actual supply cost. In spite of their low electricity price and because of their high electricity demand, Hermosillo, Guaymas, and Mexicali still have a high energy burden. More than 10% of the observed households have very high energy burdens and an additional 15% face high burdens. Nevertheless, their resulting energy burden without considering a subsidized electricity price, would surpass more than 15% of the median household income. This indicates that the temperature-based residential subsidy scheme is actually effective in these cities. However, better-targeted energy-efficiency programs might help reduce the electricity consumption of, for example, active ventilation systems and thus, lessen the fiscal burden due to the electricity subsidy. Hancevic and Lopez-Aguilar (2019) show that a national energy efficiency improvement program could reduce the residential electricity consumption by 9.9%, decreasing the associated expenditure by 11.3%.
La Paz (03.01), on the other hand, shows a high consumption of electricity and gas. Even though this city shows the highest median household income, its energy burden reaches 4.4%. Gas use is mainly associated to cooking and hot water, with the latter being usually the highest energy consumption activity. The inversely proportional relationship between the increase in ambient temperature and gas demand for water heating purposes (see Section 4.2.3) suggests that households in La Paz might be consuming energy, particularly gas, immoderately. This might be the result of wealth and cultural conventions that determine a standard of living or social status.
The transition toward sustainable cities requires the evaluation of current energy policies to reshape the established patterns of energy supply and energy use. The analyses above highlight that one-size-fits-all energy policies, particularly, the Mexican residential electricity subsidy, are not effective as they usually miss evident problems and solutions. Nonetheless, the design and implementation of energy policies toward sustainable development at this spatial level would require a new sampling and survey for each city to ensure the representativeness of the results.
5. Conclusion
This work presented an overview of the distribution of the energy burden, i.e., the percentage of household income used for energy expenditures, in urban residential Mexico. Using three publicly available data sets, namely the National Survey of Household Income and Expenditure (ENIGH) of 2018, the Digital Atlas of Mexico and the Urban National System, we calculated the consumption of electricity and gas, as well as the resulting financial burden for paying for these services for 17 850 households in 72 metropolitan areas.
The median monthly consumption of urban Mexican households in 2018 reached 158 kWh for electricity, 243 kWh for domestic gas, and 453 kWh for both energy carriers. However, we observed a large inter-household diversity. We found that the variations of energy use are mainly influenced by the household's income and temperature. Households in the top income decile consume 2.17 times as much energy as households in the bottom income decile. Moreover, households in the electricity regular tariff class 1F (minimum average summer temperature ≥33°C) consume 2.22 times as much energy as households in the regular tariff class 1 (minimum average summer temperature <25°C). Our analysis showed that the energy consumption for households located in the warmest regions is dominated by the consumption of electricity due to the need for active ventilation systems, whereas gas is the primary energy carrier for households in temperate regions, which comprises the majority of the urban households.
How much energy a household consumes is a key determinant of its energy burden. However, so is the price of energy services and, certainly, the household income. For 2018, the calculated median energy burden for Mexican urban households was 3.5%. We analyzed the role of the current electricity subsidy and found that it does alleviate the financial burden of electricity services. However, it does so for both vulnerable and non-vulnerable households, thus resulting in an inefficient mechanism that is not only economically costly to taxpayers, but also has an important opportunity cost to society and the environment.
Our analysis of the distribution of energy burdens across income and consumption deciles demonstrated that even with subsidized electricity prices, the temperature-based electricity subsidy scheme is insufficient to alleviate energy vulnerability in urban Mexico. This is confirmed in the analysis at the city level where more than a third of the 72 metropolitan areas analyzed presented more than 20% of households facing high and very high energy burdens. On the other hand, our calculations showed that 90% of the cities had at least 20% of the households with a very low energy burden (<3%), and this share reached up to 40% for a quarter of the analyzed urban centers. Even without the electricity subsidy, 15% of the urban households in Mexico would still have a very low energy burden.
The transition toward sustainable cities requires the evaluation of current energy policies to reshape the established patterns of energy supply and energy use. Tailored urban energy strategies that address particular opportunities for improving local sustainable development and energy justice must be at the core of this transition. Therefore, we identified evident problems and possible solutions at the city-level, as strategies at this spatial scale could better address the particularities of households and take advantage of the economic, social and territorial cohesion of the city. However, this is only the first step, as future research toward the design and implementation of such strategies require analysis at an even higher spatial resolution to capture the intra-city household diversity.
An analysis of the distribution of energy burden already provides valuable information on the affordability of energy services. However, this indicator does not cover all dimensions of the agendas of sustainable development and energy justice. Further efforts to create city databases that allow for a more detailed analysis of the dynamic urban system are key to drawing a more complete picture of the urban energy system. Only in this way can we develop just energy policies that are as targeted as possible to exploit as many opportunities as possible to improve urban sustainability.
Data Availability Statement
The original contributions presented in the study are included in the article/Supplementary Material, further inquiries can be directed to the corresponding author.
Author Contributions
AM-C: conceptualization, methodology, investigation, validation, formal analysis, visualization, writing–original draft, supervision, and administration. SH: methodology, software, data curation, visualization, and writing–original draft. TH: resources, writing–review and editing, and supervision. All authors contributed to the article and approved the submitted version.
Funding
The authors disclosed receipt of the following financial support for the research and authorship of this article: CONACyT scholarships [nos. 535272 and 837441].
Conflict of Interest
The authors declare that the research was conducted in the absence of any commercial or financial relationships that could be construed as a potential conflict of interest.
Publisher's Note
All claims expressed in this article are solely those of the authors and do not necessarily represent those of their affiliated organizations, or those of the publisher, the editors and the reviewers. Any product that may be evaluated in this article, or claim that may be made by its manufacturer, is not guaranteed or endorsed by the publisher.
Acknowledgments
The authors are grateful to the reviewers for their constructive comments and suggestions to improve the manuscript.
Supplementary Material
The Supplementary Material for this article can be found online at: https://www.frontiersin.org/articles/10.3389/frsc.2021.662968/full#supplementary-material
References
Agbim, C., Araya, F., Faust, K. M., and Harmon, D. (2020). Subjective versus objective energy burden: a look at drivers of different metrics and regional variation of energy poor populations. Energy Policy 144:111616. doi: 10.1016/j.enpol.2020.111616
Asaporta, K., and Nadin, V. (2020). Energy strategies, the urban dimension, and spatial planning. Energies 13:25. doi: 10.3390/en13143642
Báez Fumero, A., and Molar-Cruz, A. (2021). Development, current status, and outlook for the residential solar market in the metropolitan Area of Guadalajara, Mexico. Handbook Clim. Change Manag. 1–16. doi: 10.1007/978-3-030-22759-3_251-1
Baltruszewicz, M., Steinberger, J. K., Ivanova, D., Brand-Correa, L. I., Paavola, J., and Owen, A. (2021). Household final energy footprints in Nepal, Vietnam and Zambia: Composition, inequality and links to well-being. Environ. Res. Lett. 16:025011. doi: 10.1088/1748-9326/abd588
Bednar, D. J., Reames, T. G., and Keoleian, G. A. (2017). The intersection of energy and justice: modeling the spatial, racial/ethnic and socioeconomic patterns of urban residential heating consumption and efficiency in Detroit, Michigan. Energy Build. 143, 25–34. doi: 10.1016/j.enbuild.2017.03.028
Boardman, B.. (1991). Fuel Poverty: From Cold Homes to Affordable Warmth. Belhaven Press (London: Now Wiley).
Bohr, J., and McCreery, A. C. (2020). Do energy burdens contribute to economic poverty in the United States? A panel analysis. Soc. Forces 99, 155–177. doi: 10.1093/sf/soz131
Bouzarovski, S., and Simcock, N. (2017). Spatializing energy justice. Energy Policy 107, 640–648. doi: 10.1016/j.enpol.2017.03.064
Bouzarovski, S., and Tirado Herrero, S. (2017). The energy divide: Integrating energy transitions, regional inequalities and poverty trends in the European Union. Eur. Urban Reg. Stud. 24, 69–86. doi: 10.1177/0969776415596449
Brise no, H., and Rojas, O. (2020). Factors associated with electricity theft in Mexico. Int. J. Energy Econ. Policy 10, 250–254. doi: 10.32479/ijeep.9002
Brown, M. A., Soni, A., Lapsa, M. V., Southworth, K., and Cox, M. (2020). Low-income energy affordability in an era of U.S. energy abundance. Progr. Energy 2, 042003. doi: 10.1088/2516-1083/abb954
CEPAL (2018). Condiciones de vida y Desigualdad Social. Una propuesta para la selección de indicadores. [Living conditions and social inequality. A proposal for the selection of indicators]. Technical report, comisión Económica para América Latina y el Caribe (CEPAL) [Economic Commission for Latin America and the Caribbean].
CFE (2018). Usuarios y consumo de electricidad por municipio (A partir de 2018) [Users and electricity consumption by municipality (As of 2018)]. Available online at: https://www.datos.gob.mx/busca/dataset/usuarios-y-consumo-de-electricidad-por-municipio-a-partir-de-2018.
Chatterton, T. J., Anable, J., Barnes, J., and Yeboah, G. (2016). Mapping household direct energy consumption in the United Kingdom to provide a new perspective on energy justice. Energy Res. Soc. Sci. 18, 71–87. doi: 10.1016/j.erss.2016.04.013
CONAPO (2018). Sistema Urbano Nacional 2018 [National Urban System 2018]. Available online at: http://atlasclimatico.unam.mx/atlas/kml/.
Cook, J. J., and Shah, M. (2018). Reducing Energy Burden with Solar : Colorado's Strategy and Roadmap for States Reducing Energy Burden with Solar: Colorado's Strategy and Roadmap for States. Technical Report NREL/TP-6A20-70965, National Renewable Energy Laboratory.
CRE (2018). Historial de Precios Promedio al público de gas LP Reportados por los Distribuidores [Historical average retail prices of LPG reported by distributors]. Available online at: https://www.gob.mx/cre/documentos/historial-de-precios-promedio-al-publico-de-gas-lp-reportados-por-los-distribuidores?state=published
Diego-Ayala, U., and Carrillo-Baeza, J. (2015). Study of the thermal behaviour of water for residential use in tanks of concrete and polyethylene in humid subtropical climate. Ingeniería Investigación y Tecnologia 16, 573–583. doi: 10.1016/j.riit.2015.09.009
Drehobl, A., and Ross, L. (2016). Lifting the High Energy Burden in America's Largest Cities: How Energy Efficiency Can Improve Low-Income and Underserved Communities. Technical Report April.
Drehobl, A., Ross, L., and Ayala, R. (2020). How High Are Household Energy Burdens? An Assessment of National and Metropolitan Energy Burden across the United States. Technical report, American Council for an Energy-Efficient Economy.
Dubois, U., and Meier, H. (2016). Energy affordability and energy inequality in Europe: Implications for policy-making. Energy Res. Soc. Sci. 18, 21–35. doi: 10.1016/j.erss.2016.04.015
Egmond, C., Jonkers, R., and Kok, G. (2006). One size fits all? Policy instruments should fit the segments of target groups. Energy Policy 34, 3464–3474. doi: 10.1016/j.enpol.2005.07.017
Evergreen Economics (2016). Needs Assessment for the Energy Savings Assistance and the California Alternate Rates for Energy Programs. CALMAC ID: SCE0396.01. Technical report.
Franco, A., and Velázquez, M. (2016). La situación demográfica de México 2016 [The demographic situation of Mexico 2016]. Mexico City: Conapo. 159–182. Available online at: https://www.equidad.org.mx/pdf/Situacion%20Demografica%20Mexico%202016.pdf.
García Ochoa, R., and Graizbord Ed, B. (2016). Privation of energy services in Mexican households: An alternative measure of energy poverty. Energy Res. Soc. Sci. 18, 36–49. doi: 10.1016/j.erss.2016.04.014
Garcia-Ochoa, R., and Graizbord, B. (2016). Caracterizació espacial de la pobreza energética en México. Un análisis a escala subnacional[Spatial characterization of fuel poverty in Mexico. An analysis at the subnational scale]. Economía, Sociedad Y Territorio 16, 289–337. doi: 10.22136/est002016465
González Osorio, L. M., and Beele, A. (2016). Estudio de Caracterización del Uso de Aire Acondicionado en Viviendas de Interés Social [Characterization of the Use of Air Conditioning in Social Housing]. Technical report, Conuee/GIZ.
González-Eguino, M.. (2015). Energy poverty: an overview. Renew. Sustain. Energy Rev. 47, 377–385. doi: 10.1016/j.rser.2015.03.013
Hancevic, P., Nú nez, H., and Rosellón, J. (2019). Tariff Schemes and Regulations: What Changes are Needed in the Mexican Residential Electricity Sector to Support Efficient Adoption of Green Technologies? Technical report, Inter-American Development Bank.
Hancevic, P. I., and Lopez-Aguilar, J. A. (2019). Energy efficiency programs in the context of increasing block tariffs: the case of residential electricity in Mexico. Energy Policy 131, 320–331. doi: 10.1016/j.enpol.2019.04.015
Heindl, P.. (2015). Measuring fuel poverty: general considerations and application to german household data. Finanz Arch. 71, 178. doi: 10.1628/001522115X14285723527593
Howell, R. H., Coad, W. J., and Sauer, H. J. (2017). Principles of Heating, Ventilating and Air Conditioning, 8th Edn. Atlanta: Ashrae.
INEGI (2019a). Encuesta Nacional de Ingresos y Gastos de los Hogares 2018: Nueva serie: Datos Abiertos [National Survey on Household Income and Expenditure 2018: New series: Open Data]. Available online at: https://www.inegi.org.mx/programas/enigh/nc/2018/#Datos_abiertos.
INEGI (2019b). Encuesta Nacional de Ingresos y Gastos de los Hogares 2018: Nueva serie: Descripción de base de datos [National Survey on Household Income and Expenditure 2018: New series: Database description]. Technical report, Instituto Nacional de Estadística y Geografía (INEGI) [National Institute of Statistics and Geography].
INEGI (2019c). Encuesta Nacional de Ingresos y Gastos de los Hogares 2018: Nueva serie: Dise no conceptual [National Survey on Household Income and Expenditure 2018: New series: Conceptual design]. Technical report, Instituto Nacional de Estadística y Geografía (INEGI) [National Institute of Statistics and Geography].
INEGI (2019d). Encuesta Nacional sobre Consumo de Energéticos en Viviendas Particulares 2018: Datos Abiertos [National Survey on Energy Consumption in Private Households 2018: Open Data]. Available online at: https://www.inegi.org.mx/rnm/index.php/catalog/495/study-description?idPro=.
Jenkins, K.. (2016). Sustainable Development and Energy Justice: Two Agendas Combined. London: Edinburgh University Press.
Jenkins, K., McCauley, D., Heffron, R., Stephan, H., and Rehner, R. (2016). Energy justice: a conceptual review. Energy Res. Soc. Sci. 11, 174–182. doi: 10.1016/j.erss.2015.10.004
Jimenez Mori, R., and Yepez-Garcia, A. (2017). Understanding the Drivers of Household Energy Spending: Micro Evidence for Latin America. Technical Report May, Inter-American Development Bank.
Komives, K., Johnson, T. M., Halpern, J., Aburto, J. L., and Scott, J. (2008). Residential Electricity Subsidies in Mexico: Exploring Options for Reform and for Enhancing the Impact on the Poor. Technical report, The World Bank.
Kontokosta, C. E., Reina, V. J., and Bonczak, B. (2020). energy cost burdens for low-income and minority households: evidence from energy benchmarking and audit data in five U.S. Cities. J. Am. Planning Assoc. 86, 89–105. doi: 10.1080/01944363.2019.1647446
Lamb, W. F., Antal, M., Bohnenberger, K., Brand-Correa, L. I., Müller-Hansen, F., Jakob, M., et al. (2020). What are the social outcomes of climate policies? A systematic map and review of the ex-post literature. Environ. Res. Lett. 15, 1–28. doi: 10.1088/1748-9326/abc11f
Mayer, I., Nimal, E., Nogue, P., and Sevenet, M. (2014). The two faces of energy poverty: a case study of households' energy burden in the residential and mobility sectors at the city level. Transport. Res. Procedia 4, 228–240. doi: 10.1016/j.trpro.2014.11.018
Memmott, T., Carley, S., Graff, M., and Konisky, D. M. (2021). Sociodemographic disparities in energy insecurity among low-income households before and during the COVID-19 pandemic. Nat. Energy 6, 186–193. doi: 10.1038/s41560-020-00763-9
Nussbaumer, P., Bazilian, M., and Modi, V. (2012). Measuring energy poverty: Focusing on what matters. Renew. Sustain. Energy Rev. 16, 231–243. doi: 10.1016/j.rser.2011.07.150
Rademaekers, K., Pye, S., and Karásek, J. (2016). Selecting Indicators to Measure Energy Poverty. Under the Pilot Project Energy Poverty–Assessment of the Impact of the Crisis and Review of Existing and Possible New Measures in the Member States. Contract ENER/A4/516-2014. Technical report, Triconomics.
Reames, T. G.. (2016). Targeting energy justice: exploring spatial, racial/ethnic and socioeconomic disparities in urban residential heating energy efficiency. Energy Policy 97, 549–558. doi: 10.1016/j.enpol.2016.07.048
Rodriguez Oreggia, E., and Yepez Garcia, R. A. (2014). Income and energy consumption in Mexican households. Policy Res. Working Pap. 6864, 1–34. doi: 10.1596/1813-9450-6864
Rosas, J., Sheinbaum, C., and Morillon, D. (2010). The structure of household energy consumption and related CO2 emissions by income group in Mexico. Energy Sustain. Dev. 14, 127–133. doi: 10.1016/j.esd.2010.04.002
Sadath, A. C., and Acharya, R. H. (2017). Assessing the extent and intensity of energy poverty using multidimensional energy poverty index: empirical evidence from households in India. Energy Policy 102, 540–550. doi: 10.1016/j.enpol.2016.12.056
Sánchez, L., Echeverría, D., Wooders, P., Kuehne, K., Lean, T., Beaton, C., et al. (2018). Improving and Refocusing Electricity Subsidies: Options for Optimization in Mexico. Technical report, Enhancing the Coherence of Climate and Energy Policies in Mexico (CONEC) and the German-Mexican Energy Partnership.
Santillán Vera, M., and de la Vega Navarro, A. (2019). Do the rich pollute more? Mexican household consumption by income level and CO2 emissions. Int. J. Energy Sector Manag. 13, 694–712. doi: 10.1108/IJESM-07-2018-0016
Santillán, O. S., Cedano, K. G., and Martínez, M. (2020). Analysis of energy poverty in 7 Latin American countries using multidimensional energy poverty index. Energies 13, 1–19. doi: 10.3390/en13071608
Schuessler, R.. (2014). “Energy poverty indicators: conceptual issues,” in Centre for European Economic Research (ZEW), Discussion Paper Series 2014, 14,37.
SENER (2020). Actividades reguladas por tipo de hidrocarburo de SENER: Tarifas de distribución de Gas Natural para el sector residencial por zona geográfica de distribución [Regulated activities by SENER fuel type: Natural Gas distribution tariffs for the residential sector by distribution region]. Available online at: https://datos.gob.mx/busca/dataset/actividades-reguladas.
Steinberger, J. K., Lamb, W. F., and Sakai, M. (2020). Your money or your life? The carbon-development paradox. Environ. Res. Lett. 15, 1–9. doi: 10.1088/1748-9326/ab7461
Thomson, H., Bouzarovski, S., and Snell, C. (2017). Rethinking the measurement of energy poverty in Europe: a critical analysis of indicators and data. Indoor Built Environ. 26, 879–901. doi: 10.1177/1420326X17699260
Thomson, H., and Snell, C. (2013). Quantifying the prevalence of fuel poverty across the european union. Energy Policy 52, 563–572. doi: 10.1016/j.enpol.2012.10.009
Tirado Herrero, S.. (2017). Energy poverty indicators: a critical review of methods. Indoor Built Environ. 26, 1018–1031. doi: 10.1177/1420326X17718054
UNIATMOS (2019). Atlas Climático de México [Digital Climate Atlas of Mexico]. Available online at: http://atlasclimatico.unam.mx/atlas/kml/.
Vagliasindi, M.. (2012). Implementing energy subsidy reforms: an overview of the key issues. Policy Res. Working Pap. 34, 1–348. doi: 10.1596/1813-9450-6122
Vagliasindi, M.. (2013). Implementing Energy Subsidy Reforms: Evidence from Developing Countries. Washington, DC: World Bank.
Velasco-Herrejon, P., and Bauwens, T. (2020). Energy justice from the bottom up: a capability approach to community acceptance of wind energy in mexico. Energy Res. Soc. Sci. 70:101711. doi: 10.1016/j.erss.2020.101711
Keywords: energy burden, electricity consumption, gas consumption, urban households, Mexican metropolitan areas, electricity subsidy
Citation: Molar-Cruz A, Huezo Rodríguez SA and Hamacher T (2022) Characterizing the Energy Burden of Urban Households in Mexico: The Impact of Socioeconomic and Temperature Conditions Across Metropolitan Areas. Front. Sustain. Cities 3:662968. doi: 10.3389/frsc.2021.662968
Received: 02 February 2021; Accepted: 15 December 2021;
Published: 25 January 2022.
Edited by:
Mari Martiskainen, University of Sussex, United KingdomReviewed by:
Lina Isabel Brand Correa, University of Leeds, United KingdomPeter James Forman, Northumbria University, United Kingdom
Joao Ferreira, University of Florida, United States
Copyright © 2022 Molar-Cruz, Huezo Rodríguez and Hamacher. This is an open-access article distributed under the terms of the Creative Commons Attribution License (CC BY). The use, distribution or reproduction in other forums is permitted, provided the original author(s) and the copyright owner(s) are credited and that the original publication in this journal is cited, in accordance with accepted academic practice. No use, distribution or reproduction is permitted which does not comply with these terms.
*Correspondence: Anahi Molar-Cruz, YW5haGkubW9sYXItY3J1ekB0dW0uZGU=