Exploring Residential Rooftop Solar Potential in the United States by Race and Ethnicity
 Tony G. Reames
- Urban Energy Justice Lab, School for Environment and Sustainability, University of Michigan, Ann Arbor, MI, United States
Over the last decade, the United States has experienced continued growth in residential rooftop solar photovoltaic (PV) adoption. However, solar adoption disparities have been shown across household income, homeownership status, and more recently racial and ethnic demographics. A key component to ensuring a just clean energy transition is understanding the existing landscape to establish realistic goals. Motivated by studies on solar adoption disparities, this descriptive study aims to evaluate the distribution of estimated single-family rooftop potential across racial and ethnic majority census tracts to discern whether rooftop potential disparities may justify solar adoption disparities. Across all census tracts, the median rooftop potential was 80%. Three-fourths of all census tracts had a rooftop potential >72%, regardless of racial/ethnic majority. Compared to majority-white census tracts, majority-Black, majority-Hispanic, and majority-Asian census tracts had slightly lower rooftop potential, 6, 7, and 9%, respectively, while majority-American Indian census tracts had an 11% higher rooftop potential. The slightly lower rooftop potential in communities of color compared to majority-white and non-racial/ethnic majority census tracts, alone, was not of the magnitude to justify documented racial/ethnic disparities in solar adoption. This study concludes, that while a majority of homes in communities of color are solar suitable, an equitable clean energy transition is only possible with policies, programs, and incentives that center on racial equity while recognizing the interplay between race, income, and homeownership status.
Introduction
The United States has experienced continued growth in residential rooftop solar photovoltaic (PV) adoption over the last decade. Federal policies like the solar Investment Tax Credit (Internal Revenue Code, Section 48), various state and local policies, rapidly declining costs, and increasing demand have resulted in 18 GW of installed solar capacity in 2020, up from 0.6 GW in 2010, enough to power 3.6 million homes (Solar Energy Industries Association, 2021). Solar costs have declined nearly 70% over the last decade allowing for expansion into new markets (Solar Energy Industries Association, 2021). A Pew Research Center survey found a growing share of homeowners considering installing solar panels. In 2019, approximately 46% of homeowners reported giving serious thought to adding solar panels to their homes, up from 40% in 2016 (Kennedy and Thigpen, 2019). However, in the era of the clean energy transition, scholars have demonstrated that distributional inequities are evident in the adoption and the social, environmental, and economic benefits of residential solar (Kwan, 2012; Vaishnav et al., 2017; Lukanov and Krieger, 2019; Sunter et al., 2019; Brown et al., 2020; Reames, 2020; Schunder et al., 2020). This has led many to call for a “Solar with Justice” or an energy justice approach to the clean energy transition (Clean Energy States Alliance, 2019; Fortier et al., 2019; Carley and Konisky, 2020). Solar adoption disparities in the United States have been shown across household income, homeownership status, and more recently racial and ethnic demographics (Kwan, 2012; Vaishnav et al., 2017; Lukanov and Krieger, 2019; Sunter et al., 2019; Brown et al., 2020; Reames, 2020; Schunder et al., 2020).
Although studies in solar adoption motivations found that low-income and non-low-income adopters are more alike than different, it has long been recognized that solar adoption growth has not been equitably distributed across household income classes and is instead linked to spending power (Kwan, 2012; Schunder et al., 2020; Wolske, 2020). Higher-income households represent a greater share of solar adopters than their share in the population (Barbose et al., 2018). For instance, in a study of residential solar installations in California, New Jersey, Massachusetts, and New York (which represented 65% of all residential PV installations at the time) 87% of solar installations were completed by households with annual incomes of $45,000 or greater (Kann, 2017). Although households with annual incomes < $45,000 represented 25% of the total population, those households were underrepresented in the solar market, accounting for just 13% of PV installations (Kann, 2017). Solar adoption has been gradually migrating toward lower-income ranges over time, reflecting both a broadening and a deepening of U.S. solar markets. For example, households with incomes < $100 k grew from 39% of solar adopters in 2010 to 48% in 2018, while households with incomes >$200 k dropped from 26 to 16% of solar adopters (Barbose et al., 2020). Moreover, higher rooftop potential, or the percentage of solar suitable rooftops, does not only exist in higher-income communities. Homes in low- to moderate-income (LMI) communities also offer significant rooftop potential (Reames, 2020). The National Renewable Energy Lab (NREL) has explored LMI solar adoption as well as rooftop potential that exists in LMI communities. LMI households, defined as having income levels lower than 80% of the area median income (AMI), make up 43% of the population in the United States. Similarly, NREL estimates that the LMI rooftop potential is ~42% of all the United States' solar rooftop potential, or ~330 GW (Sigrin and Mooney, 2018). However, higher rooftop potential rates do not necessarily result in higher rates of solar installations, especially if the higher rooftop potential is in LMI communities (Reames, 2020).
Beyond income, other socioeconomic and demographic characteristics are associated with rooftop solar penetration. For instance, homeownership status is another characteristic of distinct solar adoption disparity (Barbose et al., 2018). Homeowners are far more able than renters to install rooftop solar and benefit from solar installation incentives (Borenstein, 2017; Crago and Chernyakhovskiy, 2017). The split-incentive challenge is a well-known and well-studied principal-agent problem in the energy literature (Bird and Hernández, 2012; Gillingham et al., 2012; Reames, 2016, 2020; Melvin, 2018). The split-incentive problem occurs when landlords or property owners, as the energy improvement decision-maker, decide against investing because they receive no direct benefit from doing so (Bird and Hernández, 2012; Gillingham et al., 2012; Reames, 2016, 2020; Melvin, 2018). This is important to note considering that 75% of renters pay all energy costs directly, not landlords (United States Energy Information Administration, 2018). Geographic areas with higher percentages of renter-occupied housing have lower solar penetration rates (Graziano et al., 2019; Reames, 2020). A study on rooftop solar potential in western New York found that areas with higher shares of renters had less rooftop area compared to areas with higher shares of homeowners (Schunder et al., 2020). However, the Schunder et al. (2020) study did not distinguish between single- and multi-family buildings.
More recently, studies have found that race and ethnicity are significant indicators for solar adoption (Kwan, 2012; Sunter et al., 2019; Reames, 2020; Schunder et al., 2020). Large racial and ethnic disparities in solar deployment are apparent. Kwan (2012) found that areas with a higher share of Black population were associated with lower solar adoption. Sunter et al. (2019) further established significant racial and ethnic disparities in national solar deployment, even after accounting for household income and homeownership. Compared to census tracts with no racial/ethnic majority, majority-Black and majority-Hispanic census tracts had 69% and 30% less installed solar, respectively, while majority-white census tracts had 21% more solar (Sunter et al., 2019). The relationship between solar adoption and race and ethnicity can also be dependent upon the geography, or location, of analysis. For instance, Reames (2020) found that race and ethnicity were not statistically significant predictors for census tract solar penetration rates in Riverside, CA, Chicago, IL, and Washington, DC. However, for the majority non-white San Bernardino, CA, the percentage of non-white population in a census tract was positively associated with solar penetration (Reames, 2020).
Furthermore, a substantial amount of research explores the causes and consequences of residential segregation, primarily from the fields of sociology and public health (Wilson, 1987; Sampson, 2012; Sharkey, 2013). Urban sociologists associate residential segregation with concentrated social and economic disadvantage (Klinenberg, 2002; Sampson, 2012; Sharkey, 2013). Thus, exploring the interplay between the dynamics of racial segregation and residential energy is necessary to understand geographic disparities in rooftop solar potential. In western New York, Schunder et al. (2020) found that communities with a greater percentage of racial and ethnic minorities had ~60% of the rooftop potential found in majority-white communities. This difference was especially pronounced for majority-Black communities which had the lowest rooftop potential (Schunder et al., 2020). In this instance, communities with low incomes and high minority populations not only had relatively low rooftop potential but also had limited access to potential community solar sites in their neighborhoods (Schunder et al., 2020). Again, it is important to note, this study did not distinguish between single- and multi-family buildings. Moreover, this type of analysis into racial/ethnic disparities in rooftop potential is absent at the national scale.
A key component to ensuring a just clean energy transition is understanding the existing landscape to establish realistic rooftop solar deployment goals. Or put another way, what is a realistic goal based on the rooftop potential that exists in underserved and underrepresented communities? In this case, the exercise of exploring the solar rooftop potential that exists in communities of color may assist with the development of well-thought, targeted and attainable energy transition goals. For instance, knowing how many households could be targeted and exactly where those rooftops are located. This study is motivated by the numerous studies on solar adoption disparities and aims to evaluate the energy justice landscape relative to the rooftop potential estimated to exist in communities of color. Further, it asks whether racial and ethnic disparities in rooftop solar potential explain documented racial and ethnic disparities in solar adoption.
Materials and Methods
This research utilized a publicly available data source, the National Renewable Energy Lab's (NREL) Rooftop Energy Potential of Low-Income Communities in America (REPLICA). The REPLICA dataset provides census tract-level estimates for the number of solar suitable residential rooftops in the United States, determined by rooftop shading, azimuth, tilt, and a minimum 10 m2 area (Mooney and Sigrin, 2018). The model year vintage of REPLICA is 2015.
REPLICA estimates that the majority of solar suitable residential rooftops (68.4%) exist on single-family dwellings (61.8 million rooftops) and exceed multi-family rooftop potential across all income groups (Sigrin and Mooney, 2018). If solar were installed on all solar suitable single-family rooftops, the estimated annual energy-generating potential was 683 TWh, compared to 316 TWh for multi-family dwellings (Sigrin and Mooney, 2018). Therefore, this study focuses exclusively on only solar suitable single-family homes.
From REPLICA, three variables were calculated for each census tract. First, the total rooftop potential (TRP) for each census tract was calculated by dividing the total number of single-family solar suitable rooftops (SSR) by the total number of single-family rooftops (TR), Equation (1).
Next, the share of rooftop potential (SRP) on either LMI-occupied rooftops or renter-occupied rooftops was calculated. REPLICA estimates the proportion of LMI-occupied and renter-occupied solar suitable rooftops. Equation (2) illustrates that the total number of single-family solar suitable rooftops for each group, where subscript g is either the total number of LMI-occupied or renter-occupied single-family solar suitable rooftops, is divided by the total number of single-family solar suitable rooftops for that census tract. For example, if a census tract has 100 single-family homes, 50 solar suitable rooftops, and 20 LMI-occupied solar suitable rooftops, the census tract stats would be, TRP = (50/100 × 100) = 50%, and SRPLMI = (20/50 × 100) = 40%.
In addition to rooftop potential data, REPLICA includes United States Census Bureau tract-level demographic and socioeconomic estimates from the American Community Survey (ACS, 2011–2015, 5-year). Of import to this study are census tract-level characteristics on race and ethnicity and median household income. Similar to Sunter et al. (2019), to explore racial/ethnic relationships with rooftop potential, census tracts were categorized as no majority or majority by racial/ethnic groups (Black/African American, Hispanic/Latinx, American Indian, Asian, or white). A census tract with more than 50% of the population identified as one race or ethnicity was categorized as a majority census tract for that race or ethnicity. More diverse or census tracts with no race/ethnicity having a proportion >50% were categorized as a no-majority census tract (Sunter et al., 2019).
The analysis consists of three components. First, the distribution of rooftop potential, LMI- occupied share of rooftop potential, and renter-occupied share of rooftop potential were explored across all census tracts, no-majority census tracts, and racial/ethnic majority census tracts. Next, to compare results across different groups, the locally weighted scatterplot smoothing (LOWESS) method was applied to fit local linear relationships between rooftop potential and median household income and percent renter-occupied (Sunter et al., 2019). LOWESS is a popular nonparametric smoother and “can be used to locate a smooth curve among the data points without requiring any advance specification of the functional relationship between the variables” (Jacoby, 2000). The smoothing parameter, which gives the proportion of observations to be used in each regression, was 0.65 (Jacoby, 2000; Sunter et al., 2019). Lastly, two regression models were executed to further explore how rooftop potential varied across race and ethnicity while controlling for median household income, percent renter-occupied, and state effects. One model with no-majority census tracts as the reference and another model with majority-white census tracts as the reference. Census tracts are embedded within states and differences across states may impact outcome variables. Therefore, this analysis used a state fixed effect approach to model rooftop potential. All statistical analyses were performed using Stata version 16.1.
In the Table A1 presents descriptive statistics. There were an estimated 79,289,041 single-family homes and 61,111,100 single-family homes with solar suitable rooftops. Thus, the national rooftop potential was 77.1%. An estimated 29.6 million LMI-occupied single-family rooftops represented just over one-third (36.6%) of the total single-family rooftop potential. An estimated 9.95 million renter-occupied single-family homes represented 16.3% of the total single-family rooftop potential. The final data set included 70,759 census tracts or 97% of all census tracts in the United States. Majority-white census tracts represented 83% of all tracts, followed by majority-Black census tracts (9%), no-majority census tracts (5%), majority-Hispanic census tracts (3%), majority-Asian census tracts (0.7%), and majority-American Indian census tracts (0.2%).
Figure A1 illustrates the distribution of census tracts across race, ethnicity, and median household income deciles. A higher number of majority-white and majority-Asian census tracts were distributed across higher-income deciles. While a higher number of other communities of color (Black, Hispanic, American Indian) and no-majority census tracts were distributed across lower-income deciles.
Results
Racial/Ethnic Distribution of Total Rooftop Potential
Figure 1 illustrates the distribution of rooftop potential across all census tracts, no-majority census tracts, and racial/ethnic majority census tracts. Across all census tracts, the median rooftop potential was 79.8%. Moreover, three-fourths of all census tracts had a rooftop potential >72.3%.
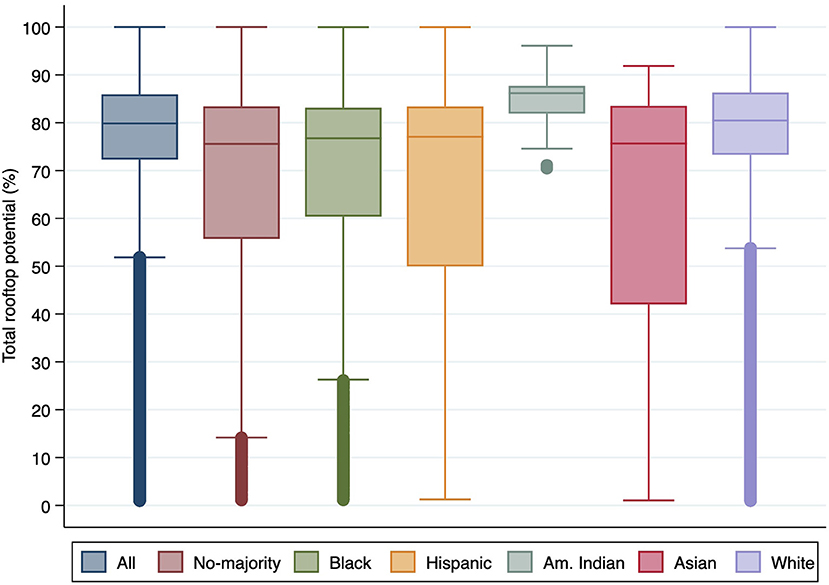
Figure 1. Distribution of total rooftop potential.
Majority-American Indian census tracts had the highest median rooftop potential, 86.2%. The interquartile range (IQR) was small, and all majority-American Indian census tracts had rooftop potential >70%. Nearly three-quarters of majority-American Indian census tracts were located in just five states (Arizona, New Mexico, South Dakota, North Carolina, and Montana) with relatively high solar resources, according to NREL's National Solar Radiation Database (https://nsrdb.nrel.gov).
The second-highest median rooftop potential was 80.4% (IQR, 72.3–89.5%) for majority-white census tracts. Majority-Hispanic and majority-Black census tracts had similar median rooftop potentials, 77% (IQR, 50–83.4%) and 76.7% (IQR, 60.4–83.1%), respectively. Both no-majority (IQR, 55.7–83.4%) and majority-Asian (IQR, 42–83.5%) census tracts had a 75.6% median rooftop potential. Rooftop potential for majority-Asian census tracts had the broadest IQR.
The mean rooftop potential for majority-American Indian census tracts (85%, SD =4) was nearly 19% higher than in no-majority census tracts (66.3%, SD = 23.7), nearly 10% higher than across all census tracts (75.3%, SD = 17.3), and nearly 8% higher than for majority-white census tracts (77.1%, SD = 17.3). While the mean rooftop potential in other communities of color demonstrates that a majority of homes are solar suitable, the rooftop potential was slightly lower, compared to the mean rooftop potential across all census tracts and majority-white census tracts. For majority-Black census tracts, the mean rooftop potential (67.4%, SD = 23.7) was 10% and 8% lower than majority-white census tracts and all census tracts, respectively, but 1% higher than no-majority census tracts. For majority-Hispanic census tracts, the mean rooftop potential (64.2%, SD = 26.3) was 13, 11, and 2% lower than majority-white census tracts, all census tracts, and no-majority census tracts, respectively. For majority-Asian census tracts, the mean rooftop potential (62.1%, SD = 26.9) was 15, 13, and 4% lower than majority-white census tracts, all census tracts, and no-majority census tracts, respectively. The mean rooftop potential for majority-white census tracts was nearly 11% more than no-majority census tracts and nearly 2% more than the mean for all census tracts. An analysis of variance showed only the mean rooftop potential for majority-Hispanic and majority-Asian census tracts were not statistically different from one another.
Racial/Ethnic Distribution of the LMI-Occupied Share of Rooftop Potential
Figure 2 illustrates the distribution of LMI-occupied share of rooftop potential across all census tracts, no-majority census tracts, and racial/ethnic majority census tracts. Across all census tracts, the median LMI-occupied share of rooftop potential was 38.1% (IQR, 27.4–50%).
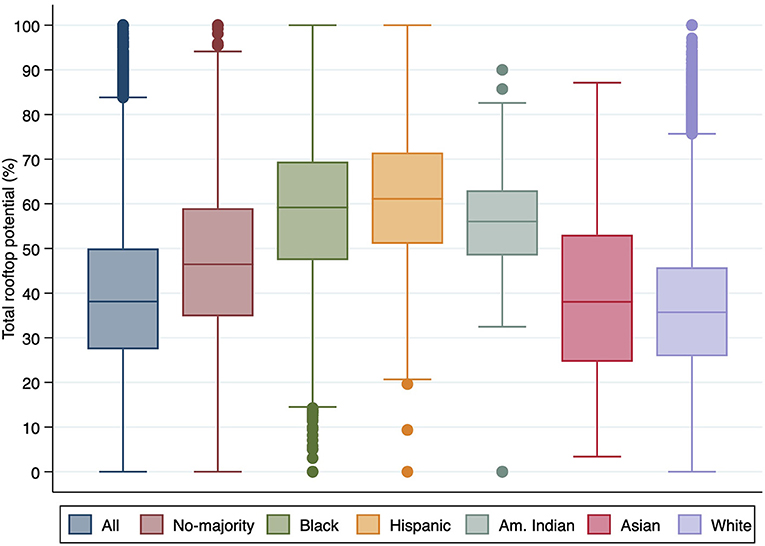
Figure 2. Distribution of LMI-occupied share of rooftop potential.
The median LMI-occupied share of rooftop potential was higher in communities of color compared to all census tracts, majority-white census tracts (35.7%, IQR 25.9–45.8%), and no-majority census tracts (46.5%, IQR 34.8–59%). In most majority-Hispanic, majority-Black, and majority-American Indian census tracts, LMI-occupied households represented a majority share of rooftop potential. Majority-Hispanic census tracts had the highest median LMI-occupied share of rooftop potential, 61.1% (IQR, 51–71.5%). The median LMI-occupied share of rooftop potential for majority-Black census tracts was 59.2% (IQR, 47.4–69.4%) and 56% (IQR, 48.4–63%) for majority-American Indian census tracts. The median LMI-occupied share of rooftop potential for majority-Asian census tracts (38%, IQR 24.6–53%) was slightly higher than for majority-white census tracts, lower than in no-majority census tracts, and nearly the same as across all census tracts.
The mean LMI-occupied share of rooftop potential for majority-Hispanic census tracts (60.5%, SD = 14) was 24% higher than majority-white census tracts (36.5%, SD = 14.9), 21% higher than across all census tracts (39.5%, SD = 16.7), and nearly 14% higher than in no-majority census tracts (46.9%, SD = 17.1). The mean LMI-occupied share of rooftop potential for majority-Black census tracts (57.9%, SD = 16) was 21.4% higher than for majority-white census tracts, 18.4% higher than across all census tracts, and 11% higher than in no-majority census tracts. The mean LMI-occupied share of rooftop potential for majority-American Indian census tracts (55.1%, SD = 12.8) was nearly 19% higher than for majority-white census tracts, nearly 16% higher than across all census tracts, and 8.2% higher than in no-majority census tracts. The mean LMI-occupied share of rooftop potential for majority-Asian census tracts (39.2%, SD = 17.8) was nearly 3% higher than for majority-white census tracts, 0.3% lower than across all census tracts, and nearly 8% lower than in no-majority census tracts. The mean LMI-occupied share of rooftop potential for majority-white census tracts was 10.4% less than no-majority census tracts and 3% lower than the mean for all census tracts. An analysis of variance showed only the mean LMI-occupied share of rooftop potential for majority-Black and majority-American Indian census tracts were not statistically different from one another.
Racial/Ethnic Distribution of the Renter-Occupied Share of Rooftop Potential
Figure 3 illustrates the distribution of the renter-occupied share of rooftop potential across all census tracts, no-majority census tracts, and racial/ethnic majority census tracts. Across all census tracts, the median renter-occupied share of rooftop potential was 16.2% (IQR, 11.3–21.9%).
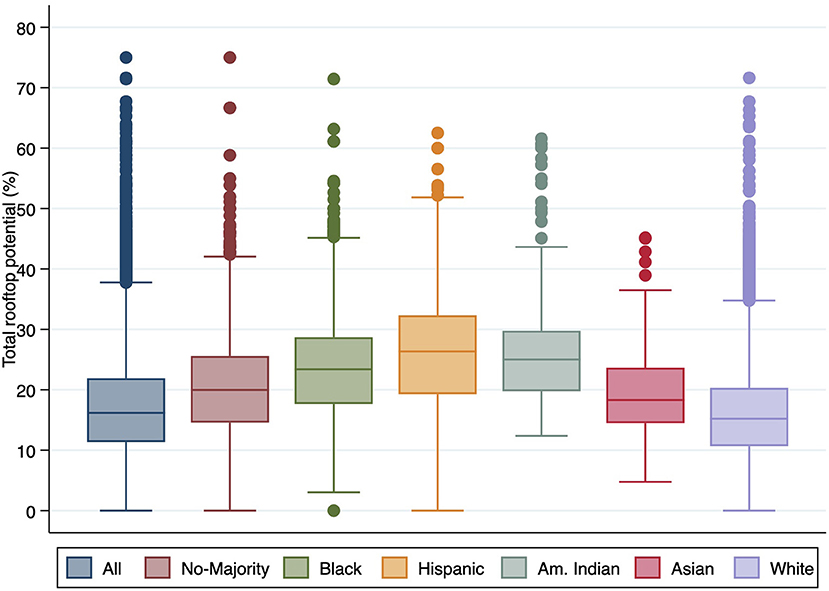
Figure 3. Distribution of renter-occupied share of rooftop potential.
Similar to the LMI-occupied share of rooftop potential, the median renter-occupied share of rooftop potential was higher in communities of color compared to all census tracts, majority-white census tracts (15.2%, IQR 10.7–20.3%), and no-majority census tracts (20%, IQR 14.6–25.6%). The median renter-occupied share of rooftop potential was highest for majority-Hispanic census tracts, 26.3% (IQR, 19.3–32.3%). The median renter-occupied share of rooftop potential for majority-American Indian census tracts was 25% (IQR, 19.8–29.8%) and 23.4% (IQR, 17.7–28.7%) for majority-Black census tracts in no-majority census tracts. For majority-Asian census tracts, the median renter-occupied share of rooftop potential (18.3%, IQR 14.5–23.6%) was higher than across all census tracts and majority-white census tracts but lower than no-majority census tracts.
Majority-American Indian census tracts had the highest mean renter-occupied share of rooftop potential (26.7%, SD = 10.2), which was nearly 11% higher than majority-white census tracts (16%, SD = 7.1), nearly 10% higher than the mean for all census tracts (17.1%, SD = 7.8), and 6.3% higher than no-majority census tracts (20.4%, SD = 8). Similarly, the mean renter-occupied share of rooftop potential for majority-Hispanic census tracts (26%, SD = 8.9), was 10% higher than majority-white census tracts, nearly 9% higher than the mean for all census tracts, and nearly 6% higher than no-majority census tracts. The mean renter-occupied share of rooftop potential for majority-Black census tracts (23.4%, SD = 8) was 7.4% higher than majority-white census tracts, 6.3% higher than the mean for all census tracts, and 3% higher than no-majority census tracts. For majority-Asian census tracts, the mean renter-occupied share of rooftop potential (19.1%, SD = 7) was 3.1% higher than majority-white census tracts and 2% higher than across all census tracts, but 1.3% lower than no-majority census tracts. The mean renter-occupied share of rooftop potential for majority-white census tracts was 4.4% less than no-majority census tracts and 1.1% lower than the mean for all census tracts. An analysis of variance showed only the mean renter-occupied share of rooftop potential for majority-American Indian and majority-Hispanic census tracts were not statistically different from one another.
Relationship Between Rooftop Potential and Median Household Income
Figure 4 shows LOWESS smoothing curves for the relationships between rooftop potential and median household income across no-majority and racial/ethnic majority census tracts (Figure A2 shows the LOWESS smoothing curve for all census tracts). In no-majority census tracts, the rooftop potential remains relatively flat, hovering between 65 and 70% across median household income. Majority-Hispanic and majority-Asian census tracts exhibited positive trends between rooftop potential and median household income. For majority-Hispanic census tracts, rooftop potential increased sharply with income from just under 50% in lower median household income census tracts to around 75% in census tracts with median household incomes around $100,000. Rooftop potential for majority-Asian census tracts nearly doubled from 45 to 80% as median household income increased to around $200,000. Rooftop potential exhibited negative trends for majority-American Indian, majority-Black, and majority-white census tracts as median household income increased. Majority-American Indian census tracts had a slight decline in rooftop potential as median household income increased. For majority-Black census tracts, rooftop potential declined from around 70% in census tracts with lower median household incomes to around 60%, with a slight increase in census tracts with median household incomes around $100,000 or greater. Majority-white census tracts exhibited a gradual decline in rooftop potential from 80 to 70% as median household income increased. The LOWESS smoothing curve for majority-Black census tracts is a somewhat truncated version of the LOWESS smoothing curves for majority-white census tracts and all census tracts (Figure A2), exhibiting a 10% lower rooftop potential range and no census tracts with median household incomes >$150,000.
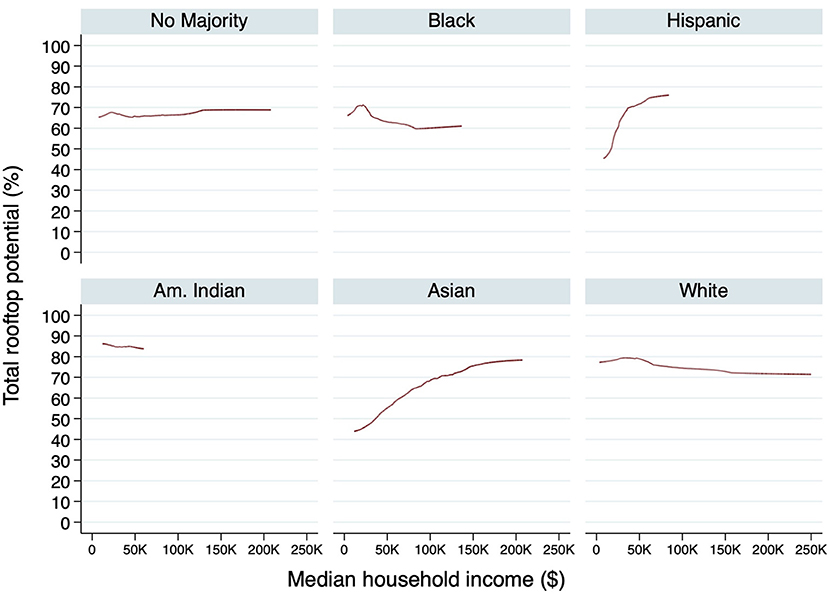
Figure 4. Relationship between rooftop potential and median household income across no-majority and racial/ethnic majority census tracts.
Relationship Between Rooftop Potential and Percent Renter-Occupied Homes
Figure 5 displays LOWESS smoothing curves for the relationships between rooftop potential and percent renter-occupied single-family homes across no-majority and racial/ethnic majority census tracts (Figure A3 shows the LOWESS smoothing curve for all census tracts). While Figure 5 shows declining trends in rooftop potential as the percentage of renter-occupied households increased, in some communities, the rooftop potential remained high, >70%, even as the majority of homes were renter-occupied. Rooftop potential declined only as the percentage of renter-occupied households increased beyond 80% for majority-Black census tracts, 60% for majority-Hispanic census tracts, and 65% for majority-white census tracts. However, rooftop potential declined with lower percentages of renter-occupied homes, beyond 40%, in both no-majority and majority-Asian census tracts. The LOWESS smoothing curve for all census tracts (Figure A3) illustrates a similar pattern to majority-white census tracts, with a rooftop potential decline beyond 65% renter-occupied. In contrast, the percentage of renter-occupied households had little impact on rooftop potential for majority-American Indian census tracts, which remained consistent as the percentage of renter-occupied homes increased.
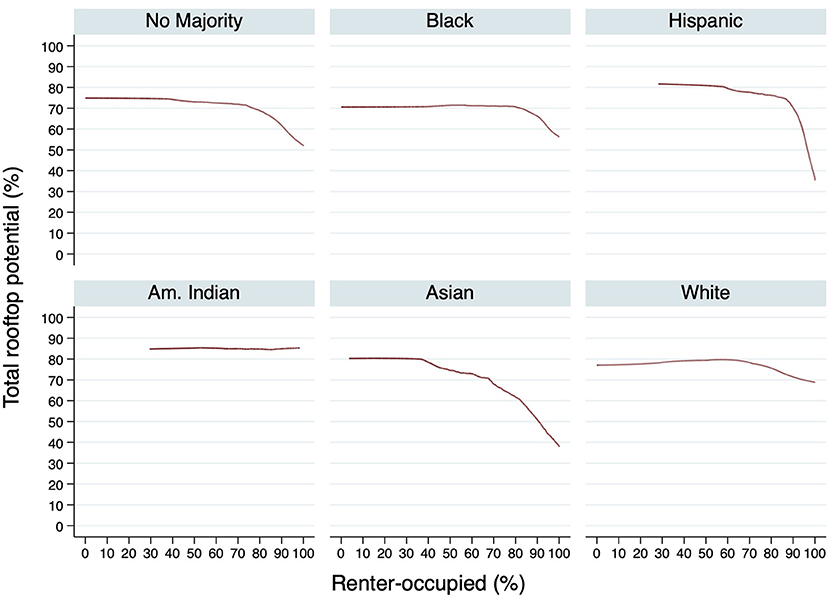
Figure 5. Relationship between rooftop potential and percent renter-occupied homes across no-majority and racial/ethnic majority census tracts.
Regression Results
Results for two regression models (see Table A2) examining the rooftop potential for racial/ethnic majority census tracts while controlling for median household income, percent renter-occupied homes, and state effects revealed that majority-American Indian census tracts maintained an advantage in rooftop potential compared to both no-majority census tracts and majority-white census tracts. On the other hand, census tracts that were majority other communities of color, on average, had just slightly less rooftop potential compared to both no-majority census tracts and majority-white census tracts.
Compared to no-majority census tracts, majority-American Indian census tracts had 16% greater rooftop potential, while majority-white census tracts had a slight 5% greater rooftop potential. Majority-Asian census tracts had 3.1% less rooftop potential, majority-Hispanic census tracts had 1.4% less rooftop potential, and majority-Black census tracts had only 0.93% less rooftop potential than no-majority census tracts.
Compared to majority-white census tracts, majority-American Indian census tracts had 10.6% more rooftop potential. All other communities of color had slightly less rooftop potential (all <9%) compared to majority-white census tracts. Majority-Asian census tracts had 8.5% less rooftop potential, followed by majority-Hispanic census tracts with 6.8% less rooftop potential, majority-Black census tracts with 6.4% less rooftop potential, and no-majority census tracts with 5.4% less rooftop potential compared to majority-white census tracts. The model statistics for both models are, R2 = 0.39, F = 812.99, p < 0.001.
Discussion and Conclusions
This study explored the racial and ethnic distribution of residential rooftop solar potential for single-family homes across 97% of census tracts in the United States. While every four out of five census tracts were majority-white, census tracts with majority populations of color, on average, exhibited relatively high rooftop potential. Majority-American Indian census tracts had the highest mean rooftop potential of all groups. While research on the adoption of rooftop solar in tribal communities is limited, efforts to support adoption and grow a local tribal solar workforce exist. For instance, the U.S. Department of Energy has financially supported tribal residential solar programs (https://www.energy.gov/indianenergy/office-indian-energy-policy-and-programs), and national non-profit organizations like GRID Alternatives (https://gridalternatives.org/what-we-do/tribal-program) and Solar Energy International (https://www.solarenergy.org/native-american-communities/) work with American Indian communities to expand solar access. Although rooftop potential in communities of color was on average lower than the national rooftop potential average, communities of color all had median rooftop potentials >75%. Thus, in many communities of color, at least three out of every four homes are estimated to be solar suitable, based on rooftop shading, azimuth, tilt, and a minimum 10 m2 area (Mooney and Sigrin, 2018). While this analysis explores solar suitability-based technical potential estimates, it should be noted that roof quality or condition can be a major impediment to solar. The U.S. Census Bureau's American Housing Survey (AHS) estimated that more than 5% of U.S. housing units had sagging roofs, are missing roofing material, or have holes in the roof (United States Census Bureau, 2019). Higher incidence of poor roof conditions is associated with lower-income households, racial/ethnic minority households, and renter-occupied households (United States Census Bureau, 2019).
Communities of color had a larger share of rooftop potential on LMI rooftops than majority-white and no-majority census tracts. The data show particularly higher shares of rooftop potential on LMI rooftops in majority-Hispanic, majority-Black, and majority-American Indian census tracts. This fact lends support for policies and programs supporting expanding solar access to LMI households which focus on economic models to overcome the barrier of high upfront solar costs for resource-strapped households (O'Shaughnessy et al., 2020). Several states and municipalities have been at the forefront of developing policies and mechanisms to expand solar to underrepresented households and communities, focused primarily on LMI households and often motivated by three primary objectives: reduce overall energy demand; reduce household energy burdens; and job creation (O'Shaughnessy et al., 2020; Reames, 2020). For instance, California's Single-family Affordable Solar Homes (SASH) program which began in 2009 and targets LMI households, also has special targeting for environmental justice communities overburdened by pollution (Reames, 2020). Washington, DC's Solar for All program launched in 2017 to provide solar electricity to 100,000 LMI households and reduce energy bills by 50%. In 2019, Illinois launched a Solar for All program to support both rooftop and community solar in low-income communities and communities of color. Including not only an income requirement but making an explicit connection between race/ethnicity and income in program design and targeting can facilitate addressing the gaps in targeting that result from only focusing on income (Clean Energy States Alliance, 2019).
This study finds that the majority of rooftop potential across census tracts regardless of racial and ethnic majority is on owner-occupied housing. However, the renter-occupied share of rooftop potential was higher in communities of color compared to all census tracts, majority-white census tracts, and no-majority census tracts. Particularly for majority-Hispanic, majority-American Indian, and majority-Black census tracts. The proportion of rooftop potential on renter-occupied homes requires special attention and programming designed to overcome the split-incentive dilemma. Therefore, while there remains great market potential to target and expand solar adoption for racial/ethnic minority homeowners, programs should be designed and targeted toward landlords of color and landlords with large rental property portfolios, located primarily in communities of color, to incentivize solar on rental homes.
While significant racial and ethnic disparities in solar adoption have been demonstrated, this study demonstrates that significantly less rooftop potential in communities of color is not a justification for the magnitude of adoption disparities. Compared to no-majority census tracts, when controlling for household income, Sunter et al. (2019) found majority-Black and majority-Hispanic census tracts had deployed 69 and 30% less solar, respectively, and 61 and 45% less solar, respectively, when controlling for homeownership. Controlling for both income and homeownership, compared to the rooftop potential in no-majority census tracts, this study found the rooftop potential was <2% lower for majority-Hispanic census tracts and <1% lower for majority-Black census tracts. Therefore, with relatively high rooftop potential on single-family homes in communities of color, interventions to overcome the limitations and barriers to adoption must center on racial equity while recognizing the interplay between race, income, and homeownership status. The clean energy transition will only be just and equitable with a recognition justice approach to the persistence of distributional disparities in technology adoption and an acknowledgment of the rooftop potential that exists in communities of color, often larger than would otherwise be assumed.
Data Availability Statement
Publicly available datasets were analyzed in this study. This data can be found here: https://dx.doi.org/10.7799/1432837.
Author Contributions
The author confirms being the sole contributor of this work and has approved it for publication.
Funding
This work was supported by the National Renewable Energy Laboratory, operated by Alliance for Sustainable Energy, LLC, for the United States Department of Energy (DOE) under Contract No. DE-AC36-08- GO28308. Funding was provided by the United States Department of Energy Office of Energy Efficiency and Renewable Energy Solar Energy Technology Office.
Disclaimer
The views expressed in the article do not necessarily represent the views of the DOE or the United States Government. The United States Government retains and the publisher, by accepting the article for publication, acknowledges that the United States Government retains a non-exclusive, paid-up, irrevocable, worldwide license to publish or reproduce the published form of this work, or allow others to do so, for United States Government purposes.
Conflict of Interest
The author declares that the research was conducted in the absence of any commercial or financial relationships that could be construed as a potential conflict of interest.
Supplementary Material
The Supplementary Material for this article can be found online at: https://www.frontiersin.org/articles/10.3389/frsc.2021.666411/full#supplementary-material
References
Barbose, G. L., Darghouth, N. R., Hoen, B., and Wiser, R. H. (2018). Income Trends of Residential PV Adopters: An Analysis of Household-Level Income Estimates. Electricity Markets and Policy Group, Energy Analysis and Environmental Impacts Division, Berkeley Lab, Berkeley, CA, United States. doi: 10.2172/1433126
Barbose, G. L., Forrester, S., Darghouth, N. R., and Hoen, B. (2020). Income Trends among US Residential Rooftop Solar Adopters. Lawrence Berkeley National Lab (LBNL), Berkeley, CA, United States. doi: 10.2172/1603637
Bird, S., and Hernández, D. (2012). Policy options for the split incentive: increasing energy efficiency for low-income renters. Energy Pol. 48, 506–514. doi: 10.1016/j.enpol.2012.05.053
Borenstein, S. (2017). Private net benefits of residential solar PV: the role of electricity tariffs, tax incentives, and rebates. J. Assoc. Environ. Resour. Econ. 4, S85–S122. doi: 10.1086/691978
Brown, M. A., Soni, A., Doshi, A. D., and King, C. (2020). The persistence of high energy burden: results of a bibliometric analysis. Energy Res. Soc. Sci. 70:101756. doi: 10.1016/j.erss.2020.101756
Carley, S., and Konisky, D. M. (2020). The justice and equity implications of the clean energy transition. Nat. Energy 5, 569–577. doi: 10.1038/s41560-020-0641-6
Clean Energy States Alliance (2019). Solar with Justice: Strategies for Powering Up Under-Resourced Communities and Growing an Inclusive Solar Market. Available online at: https://www.cesa.org/resource-library/resource/solar-with-justice/ (accessed May 31, 2021).
Crago, C. L., and Chernyakhovskiy, I. (2017). Are policy incentives for solar power effective? Evidence from residential installations in the Northeast. J. Environ. Econ. Manage. 81, 132–151. doi: 10.1016/j.jeem.2016.09.008
Fortier, M. O. P., Teron, L., Reames, T. G., Munardy, D. T., and Sullivan, B. M. (2019). Introduction to evaluating energy justice across the life cycle: a social life cycle assessment approach. Appl. Energy 236, 211–219. doi: 10.1016/j.apenergy.2018.11.022
Gillingham, K., Harding, M., and Rapson, D. (2012). Split incentives in residential energy consumption. Energy J. 33:3. doi: 10.5547/01956574.33.2.3
Graziano, M., Fiaschetti, M., and Atkinson-Palombo, C. (2019). Peer effects in the adoption of solar energy technologies in the United States: an urban case study. Energy Res. Soc. Sci. 48, 75–84. doi: 10.1016/j.erss.2018.09.002
Jacoby, W. G. (2000). Loess: a nonparametric, graphical tool for depicting relationships between variables. Elec. Stud. 19, 577–613. doi: 10.1016/S0261-3794(99)00028-1
Kann, T. (2017). How wealthy are residential solar customers? Household income and solar adoption in the United States. GTM Res.
Kennedy, B., and Thigpen, C. L. (2019). More U.S. homeowners say they are considering home solar panels. Pew Research Center. Available online at: https://www.pewresearch.org/fact-tank/2019/12/17/more-u-s-homeowners-say-they-are-considering-home-solar-panels/ (accessed April 3, 2021).
Klinenberg, E. (2002). Heat Wave: A Social Autopsy of Disaster in Chicago. Chicago, IL: University of Chicago Press. doi: 10.7208/chicago/9780226026718.001.0001
Kwan, C. L. (2012). Influence of local environmental, social, economic and political variables on the spatial distribution of residential solar PV arrays across the United States. Energy Pol. 47, 332–344. doi: 10.1016/j.enpol.2012.04.074
Lukanov, B. R., and Krieger, E. M. (2019). Distributed solar and environmental justice: exploring the demographic and socio-economic trends of residential PV adoption in California. Energy Pol. 134:110935. doi: 10.1016/j.enpol.2019.110935
Melvin, J. (2018). The split incentives energy efficiency problem: evidence of underinvestment by landlords. Energy Pol. 115, 342–352. doi: 10.1016/j.enpol.2017.11.069
Mooney, M., and Sigrin, B. (2018). Rooftop Energy Potential of Low Income Communities in America REPLICA. Golden, CO: National Renewable Energy Laboratory. doi: 10.7799/1432837
O'Shaughnessy, E., Barbose, G., Wiser, R., Forrester, S., and Darghouth, N. (2020). The impact of policies and business models on income equity in rooftop solar adoption. Nat. Energy 6, 84–91. doi: 10.1038/s41560-020-00724-2
Reames, T. G. (2016). A community-based approach to low-income residential energy efficiency participation barriers. Local Environ. 21, 1449–1466. doi: 10.1080/13549839.2015.1136995
Reames, T. G. (2020). Distributional disparities in residential rooftop solar potential and penetration in four cities in the United States. Energy Res. Soc. Sci. 69:101612. doi: 10.1016/j.erss.2020.101612
Sampson, R. J. (2012). Great American City: Chicago and the Enduring Neighborhood Effect. Chicago, IL: University of Chicago Press. doi: 10.7208/chicago/9780226733883.001.0001
Schunder, T., Yin, D., Bagchi-Sen, S., and Rajan, K. (2020). A spatial analysis of the development potential of rooftop and community solar energy. Remote Sens. Appl. 19:100355. doi: 10.1016/j.rsase.2020.100355
Sharkey, P. (2013). Stuck in Place: Urban Neighborhoods and The End of Progress Toward Racial Equality. Chicago, IL: University of Chicago Press. doi: 10.7208/chicago/9780226924267.001.0001
Sigrin, B., and Mooney, M. (2018). Rooftop Solar Technical Potential for Low-to-Moderate Income Households in the United States. Golden, CO: National Renewable Energy Laboratory. NREL/TP-6A20- 70901. Available online at: https://www.nrel.gov/docs/fy18osti/70901.pdf
Solar Energy Industries Association (2021). Solar Industry Research Data. Available online at: https://www.seia.org/solar-industry-research-data (accessed February 9, 2021).
Sunter, D. A., Castellanos, S., and Kammen, D. M. (2019). Disparities in rooftop photovoltaics deployment in the United States by race and ethnicity. Nat. Sustain. 2, 71–76. doi: 10.1038/s41893-018-0204-z
United States Census Bureau (2019). American Housing Survey (AHS) Table Creator. Available online at: https://www.census.gov/programs-surveys/ahs/data/2019/ahs-2019-summary-tables.html (accessed April 7, 2021).
United States Energy Information Administration (2018). 2015 Residential Energy Consumption Survey. U.S. Department of Energy, Washington, DC, United States.
Vaishnav, P., Horner, N., and Azevedo, I. L. (2017). Was it worthwhile? Where have the benefits of rooftop solar photovoltaic generation exceeded the cost? Environ. Res. Lett. 12:094015. doi: 10.1088/1748-9326/aa815e
Wilson, W. J. (1987). The Truly Disadvantaged: The Inner City, the Underclass, and Public Policy. Chicago, IL: The University of Chicago.
Keywords: energy justice, just transition, solar energy, race and ethnicity, single-family homes
Citation: Reames TG (2021) Exploring Residential Rooftop Solar Potential in the United States by Race and Ethnicity. Front. Sustain. Cities 3:666411. doi: 10.3389/frsc.2021.666411
Received: 10 February 2021; Accepted: 20 May 2021;
Published: 14 June 2021.
Edited by:
Neil Simcock, Liverpool John Moores University, United KingdomReviewed by:
Edgar Antonio Barragán, Salesian Polytechnic University, EcuadorEmma Elizabeth Heffernan, University of Wollongong, Australia
Copyright © 2021 Reames. This is an open-access article distributed under the terms of the Creative Commons Attribution License (CC BY). The use, distribution or reproduction in other forums is permitted, provided the original author(s) and the copyright owner(s) are credited and that the original publication in this journal is cited, in accordance with accepted academic practice. No use, distribution or reproduction is permitted which does not comply with these terms.
*Correspondence: Tony G. Reames, treames@umich.edu