Optimal Operations Management of Mobility-on-Demand Systems
 Salomón Wollenstein-Betech
 Ioannis Ch. Paschalidis
  Christos G. Cassandras
- Division of Systems Engineering, Boston University, Brookline, MA, United States
The emergence of the sharing economy in urban transportation networks has enabled new fast, convenient and accessible mobility services referred to as Mobilty-on-Demand systems (e.g., Uber, Lyft, DiDi). These platforms have flourished in the last decade around the globe and face many operational challenges in order to be competitive and provide good quality of service. A crucial step in the effective operation of these systems is to reduce customers' waiting time while properly selecting the optimal fleet size and pricing policy. In this paper, we jointly tackle three operational decisions: (i) fleet size, (ii) pricing, and (iii) rebalancing, in order to maximize the platform's profit or its customers' welfare. To accomplish this, we first devise an optimization framework which gives rise to a static policy. Then, we elaborate and propose dynamic policies that are more responsive to perturbations such as unexpected increases in demand. We test this framework in a simulation environment using three case studies and leveraging traffic flow and taxi data from Eastern Massachusetts, New York City, and Chicago. Our results show that solving the problem jointly could increase profits between 1% and up to 50%, depending on the benchmark. Moreover, we observe that the proposed fleet size yield utilization of the vehicles in the fleet is around 75% compared to private vehicle utilization of 5%.
1. Introduction
In recent years, urban mobility has evolved rapidly as a result of worldwide urbanization and technological development. In terms of urbanization, a United Nations report indicates that 56.3% of the earth's population lived in urban areas in 2018, a number expected to reach 60% by 2030. At the same time, urban areas have increased in number. In 2000, there were 371 cities with more than one million inhabitants around the globe. By 2018, this number had grown to 548 and it is projected to increase to 706 by 2030 (United Nations, 2018). It is evident then, that the sustainability and management of urban settlements is a critical challenge that our society faces. Thus, cities have begun investing in becoming “smart” by developing innovative services for transportation, energy distribution, healthcare, environmental monitoring, business, commerce, emergency response, and social activities (Cassandras, 2017).
Focusing on human mobility, only half of the world's urban population has convenient access1 to high-capacity (public) transportation according to data from 610 cities in 95 countries (Daniel, 2015). Extending these high-capacity transportation modes is expensive, slow, and requires negotiating land with many private owners, hence it is not done regularly. Besides public transportation, the use of private vehicles has been extensively adopted in the last century due to their availability and flexibility for door-to-door transportation. Yet, private vehicles have been criticized due to their dependency on gasoline, their harmful emissions to the environment, their underutilization (according to Bates and Leibling, 2012, private vehicles are parked for more than 95% of the time), their impact on traffic congestion, and their land and infrastructure requirements for parking spaces and wider roads. Therefore, although private vehicles are convenient and fast, they are also an unsustainable solution for the future of urban mobility (Mitchell et al., 2010).
In the last few years, the concept of a sharing economy has become ubiquitous across industries including transportation. Although there is no widely-accepted definition of this term, Schlagwein et al. (2020) has described it as follows: “the sharing economy is an Information Technology (IT)-facilitated peer-to-peer model for commercial or non-commercial sharing of underutilized goods and service capacity through an intermediary without a transfer of ownership.” A key tenet of a sharing economy is that the consumer's cost for using a resource will shift from ownership of it to on-demand access based on need. This will require enforcing compliance to the rules of sharing resources through new pricing mechanisms relying on digital ledger technologies which ensure ease-of-use, privacy, fairness, and adherence to widely accepted ethical principles. It will also require new business models for operators who provide access and maintain such resources (Crisostomi et al., 2020). In transportation, the sharing economy has had a large expansion in the so-called Mobility-on-Demand (MoD) platforms for which many (especially young) citizens have shifted from owning a car to exclusively using MoD services and public transportation (Etehad and Nikolewski, 2016). These MoD systems, like Uber or Lyft in the United States, provide a similar transportation service to users as taxis do. Its main difference relies on the convenience they provide by the use of IT and geolocalization services which reduce customer's waiting times. In addition to user convenience, their connectivity feature provides economical advantages to society. For example, they can offer a lower cost service by employing ride-sharing services in which two or more passengers share a vehicle.
This paper studies optimal strategies to operate a MoD system. Specifically, our goal is to answer three operational decisions. (i) How many vehicles does the platform require to offer good service? (ii) How should the system set prices in order to maximize profits? (iii) How should vehicles be reallocated across the network in order to reduce customer wait times? It is relevant to note that these three decisions are inter-related; for example, if we increase the price for a specific origin-destination, we expect its demand to decrease, therefore, requiring less reallocation of vehicles to that region and presumably a smaller fleet. Therefore, we focus on answering these three questions jointly.
In the literature, the joint pricing and rebalancing problem has been addressed using two different perspectives: one-sided, and two-sided markets. One-sided markets assume full control over the fleet of vehicles (Turan et al., 2019; Wollenstein-Betech et al., 2020a) and have been proposed for prospective MoD systems that operate with robotic taxis known as Autonomous Mobility-on-Demand (AMoD) systems. In contrast, two-sided markets consider self-interested drivers, typically human, that reallocate themselves in order to maximize their own profit (Banerjee et al., 2015; Bimpikis et al., 2019). For two-sided markets, the MoD platform has to design compensation schemes to steer drivers' behavior toward the global MoD objective. To facilitate the analysis in this paper, we will focus on one-sided markets as we expect that future MoD and AMoD platforms will gain more control on their vehicles by the inclusion of robotaxis or by well-designed compensation schemes. For one-sided markets, Banerjee et al. (2015) uses a queueing model to show that static policies, those that do not vary with the real-time state of the system, will always perform better than dynamic pricing policies when the objective function of the problem is concave and when analyzing the steady-state solution of the problem. This asymptotic optimality result is well-known in the pricing literature and was first stated in Gallego and Van Ryzin (1997) and Paschalidis and Tsitsiklis (2000), and then extended to networked systems in Paschalidis and Liu (2002). On the other hand, static policies lack responsiveness when compared with dynamic policies. This is especially true when the system experiences perturbations or when the realization of the arrival process deviates with respect to the parameters assumed by the static policy. To account for such perturbations, Turan et al. (2019) uses Reinforcement Learning (RL) in a microsimulator environment to maximize the revenue of an electric fleet of robotaxis. However, even though good solutions are found, RL converges slowly and its learned parameters are hard to transfer to a different setting.
The minimum fleet size problem together with rebalancing is not an easy one to solve as it encompasses several trade-offs. For example, from a user's perspective, a larger fleet is desirable in order to serve each customer instantaneously when required. In contrast, the MoD system is interested in smaller fleet sizes to maximize the system's and the drivers' profits. In addition, an urban planner prefers a small fleet size in order to reduce empty driven miles which translates to mitigating traffic congestion and the environmental impact associated with it. Since all these interests are not aligned, the solution typically is a sweet spot of these trade-offs (Badger, 2018). To that end, Zhang et al. (2016) proposes a real-time rebalancing policy using a queueing model and show that, under a real-time rebalancing policy, the taxi fleet can be reduced by 30% while still satisfying demand. In the same spirit, Vazifeh et al. (2018) solve the minimum fleet problem by mapping it to a minimum cover path formulation and solving it using the Hopcroft and Karp (1973) algorithm for bipartite matching. Their results show that a comparable service in NYC can be achieved using 30% less vehicles than the actual number of taxis in NYC. In addition to these research, Wallar et al. (2019) show the impact of increasing the vehicles' capacity demonstrating that the NYC demand can be serviced with 2,864 four-passenger vehicles while for 2-passenger vehicles NYC would require a total of 3,761 vehicles.
Aside from pricing and fleet sizing, rebalancing alone is tackled employing a planning (or proactive) approach which redistributes the vehicles across regions to satisfy a forcasted demand. In this context, Pavone et al. (2012) show that rebalancing is needed to avoid stacking unbounded customers in queues and to stabilize the system. The authors use a static rebalancing policy that minimizes the empty driven time using a fluidic model. Later, Zhang and Pavone (2016) extended this work using a queueing-theoretical model in order to account for customers abandoning the platform when waiting times are long. This method consists of solving a linear program periodically that balances the available vehicles across regions. Furthermore, Spieser et al. (2016) solves the rebalancing problem such that the number of customer dropouts is minimized instead of the empty driven miles as in the previous works. The authors provide Pareto optimal curves that showcase the existing trade-off between the quality of service and fleet size. Different from queueing models, simulation-based methods have also been employed to solve the issue of rebalancing. In particular, Swaszek and Cassandras (2019) proposed an event-driven parametric controller that rebalances the system once a threshold (defined as the maximum number of tolerable imbalances) is exceeded. Other simulation-based approaches can be found in Levin et al. (2017), Hörl et al. (2018). Finally, Wallar et al. (2018) propose a three-step method in which first they discretize the network topology into rebalancing regions, then forecast the demand and perform rebalancing by solving an Integer Linear Program (ILP).
The contribution of this paper is three-fold. First, we devise an optimization framework that jointly addresses the three questions described above giving rise to a suggested fleet size and static policies for pricing and rebalancing. An important distinction of our work is the use of passenger destination information when defining the pricing policy. From a technical perspective, this refinement allows formulating the system as a fluid approximation of a queueing-theoretical model for which we can prove that by selecting appropriate prices, one can ensure a balanced and stable system (Wollenstein-Betech et al., 2020a). From a practical perspective, this joint optimization yields higher profits than other approaches. Second, we utilize this static policy to define dynamic strategies for rebalancing while using the suggested fleet size and static pricing policy in order to account for perturbations to the system. Third, we build a simulation environment to test the proposed methods and perform case studies using real data. We utilize traffic flow and taxi data records for the transportation networks of Eastern Massachusetts, New York City, and Chicago.
In prior work (Wollenstein-Betech et al., 2020a), we proposed a macroscopic model to solve the joint problem and show the existence and stability of the balanced system when designing optimal pricing strategies. In this paper, we incorporate real-time rebalancing strategies in conjunction with the static solutions. Moreover, we build a simulator to analyze, in a microscopic manner, the performance of the proposed policies and report its outcomes. We utilize this framework to extend our analysis to more cities with different topologies and different demand patterns.
The remainder of this paper is organized as follows. In section 2, we introduce the system model and the formal problem formulation. In section 3, we derive the optimal static policies for the pricing, rebalancing and joint problems. In section 4, we introduce real-time rebalancing strategies. In section 5, we present our case studies and in section 6 we conclude.
2. Model and Problem Formulation
To model the MoD system, we use a closed Jackson queueing network as depicted in Figure 1. Formally, let the MoD fleet be composed of m vehicles who travel across the transportation network , where is the set of N regions, and is the set of arcs connecting all regions. For every region i, we let xi(t) ∈ {1, …, m} be a queue of available vehicles ready to serve a user request at time t and x(t) = (xi(t), …, xN(t)) the vehicle queue vector.
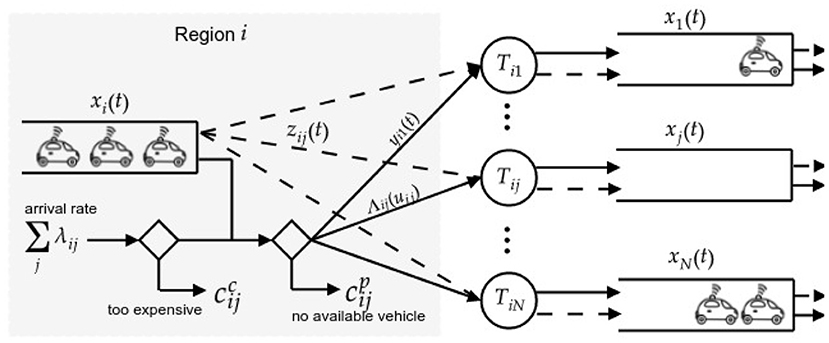
Figure 1. Prospective customers wishing to travel from i to j arrive at a rate λij. Then, if they accept price uij and there is an available vehicle they travel to j in Tij units of time. If the price uij is above their willingness to pay, the MoD incurs a cost composed by the loss of a trip and a cost for disappointing the customer. Moreover, if the customer is willing to pay uij but no vehicle in i is available, then the customer is rejected and the platform incurs a cost . The objective of the MoD provider is to plan a pricing policy u and a rebalancing policy r such that its profit (or other utility function) is maximized.
We model the arrival process of potential customers going from i to j using a time-invariant Poisson process with a rate λij. Upon a customer arrival, she either (i) pays a fee pij and is served by one of the vehicles or (ii) leaves the system because the fee was above her willingness to pay, or because there were no available vehicles in region i to serve her. For every Origin-Destination (OD) in the network, the fee pij is formed by the product of a base fee and a surge price (or simply price) uij(t). We assume the platform is not willing to charge less than the base fee for any trip, hence, we have that uij(t) ≥ 1 for all i and j and all t ≥ 0.
To determine the fraction of customer arrivals that are willing to pay the fee , we assume there is a known demand function which establishes this relationship. We assume this function to be (i) continuous; (ii) strictly decreasing, such that a higher price always results in a lower demand; and (iii) lower bounded by zero such that there exists a price that makes for all . Consequently, the resulting arrival process considering the users' willingness to pay is described by the modulated demand Λij(uij(t)) which follows a Poisson point process with rate .
After a customer arrival at region i who is willing to pay the fee, the MoD platform assigns her a vehicle immediately. Then, the travel time experienced by the customer and vehicle is an exponential random variable with rate 1/Tij, where Tij is the average travel time from i to j. This is a standard assumption for queueing models, however, it can be replaced by a deterministic travel time if desired. Additionally, we let yij(t) be the number of customer-carrying vehicles traveling from i to j at t.
We assume the MoD service is capable of rebalancing the system, i.e., sending empty vehicles across regions to avoid having excess or fewer vehicles at every region. Hence, we let rij(t) be a decision variable denoting the number of vehicles that the platform will send from i to j at time t. Finally, we let zij(t) and be the number of empty vehicles en-route at t and the cost incurred for an empty trip from i to j, respectively.
The problem we are aiming to solve is how to properly select a fleet size m, the prices and a rebalancing policy so as to maximize a utility function. Examples of this utility function are profit maximization of the MoD service or, from a societal perspective, customer welfare maximization. We discuss both utility functions in the next section as well as static and dynamic strategies to solve this problem.
3. Optimal Strategies
As pointed out by Swaszek and Cassandras (2019) and Turan et al. (2019), one way in which we can derive optimal strategies for this problem is to frame it as a Markov Decision Process and use Dynamic Programming to solve it. Unfortunately, they observe that the problem suffers from the curse of dimensionality and becomes intractable even for small instances of the problem. One way in which we can address this complexity issue is to define static policies. The idea is to analyze the problem at its steady-state and find policies that are time-invariant, i.e., u(t) = u and r(t) = r. To achieve this, it is convenient (although not necessary) to use a fluidic abstraction of the real system. The main advantage of fluidic models is two-fold. First, to relax the discrete system (vehicles and customers are discrete entities) to a continuous system in order to facilitate the optimization procedure. Second, to ensure that the system is balanced, which means that the total incoming flow of vehicles to any region is equal to the summation over the all modulated customers leaving i. In general, to claim that the solution of the fluidic abstraction is a good solution for the original queueing system, the following mild assumptions are required: (i) The solution is only optimal when analyzing the steady state of the system, not during transient periods; (ii) the Poisson processes modeling the modulated customer demand and rebalancing are independent. With these assumptions, all the stochastic processes in the queueing model are Poisson processes. For the modulated customer demand, a thinning (or splitting) Poisson process will result by interpreting the willingness-to-pay function for a given price as defining Bernoulli trials of customers accepting the price or leaving the system. Likewise, the process of vehicles leaving stations will result in a superposition of two independent Poisson processes (which remain a Poisson process) stemming from the customer-carrying and the rebalancing vehicles. This is equivalent to observing Bernoulli trials governed by the probability that the vehicle leaving a station is an empty (rebalancing) or a customer-carrying vehicle. In addition, to maintain feasibility and tractability of the solution, we consider the following assumptions: (iii) the rebalancing rate encourages rather than forces the vehicles to rebalance (e.g., if no vehicles are available in a station, then no rebalancing will occur); (iv) there exists a maximum price for which no customer is willing to travel (customer demand goes to zero). For a formal analysis on the well-posedness and stability of the pricing and rebalancing fluidic models we refer the reader to Wollenstein-Betech et al. (2020a) and Zhang and Pavone (2016), respectively.
3.1. Static Pricing
As stated earlier, we aim to select time-invariant static prices u with the objective of maximizing the profit of a MoD provider while ensuring a balanced system. Similar to this approach, we also present an equivalent formulation that maximizes user social welfare rather than MoD profit.
3.1.1. Profit Maximization
Let be the operational cost of providing a transportation service from i to j and cf be a fixed cost associated with the value of owning a vehicle for a period of time. Moreover, let cc be an additional cost that the MoD service incurs when a costumer leaves the platform because of a high price. For example, a customer who thinks the service is too expensive might not consider to use this MoD platform in the future. With these definitions we write the profit maximization problem as follows:
where in the objective function Λij(uij) is the modulated demand and is the difference between the charged fee and the operational cost . Equation (1b) ensures the MoD system not to accumulate vehicles in any region, as well as to make sure that no region is being constantly rejecting customer due to a lack of vehicles. Constraint (1c) restricts the minimum number of vehicles the fleet has to have in order to provide such a service. Finally, (1d) ensures that the optimization process happens within prices range. Note that in order for (1) to be tractable, we have to maximize a concave objective function (1a) in the range of [1, umax] over a convex feasible set. Both of these requirements are accomplished when using a linear willingness-to-pay function as the problem becomes to minimize a convex quadratic objective over linear equality constraints. Notice that in this fluidic formulation, we do not include a cost of losing a customer due to the shortage of vehicles. This is because constraint (1b) ensures a balanced system and since for the fluidic model we assume non-stochastic behavior, this cost is equal to zero.
3.1.2. Welfare Maximization
It is relevant for the discussion on smart cities to consider the case where social welfare is maximized instead of the platform's profit. To do this, we associate a utility with every customer arrival, which we model using a random variable Uij with probability density function fij(uij) and support in . If Uij exceeds price uij, then the customer will accept the fee, which result in a modulated demand . Consequently, the expected utility of a customer conditional on the fact that the customer is willing to pay the fee uij is 𝔼[Uij|Uij ≤ uij]. Hence, the welfare maximization problem is
Notice that the objective (2a) has a similar form as (1a), and thus, the two problems can be solved using the same optimization methods. Therefore, from now on, we will focus on the profit maximization problem.
3.2. Static Rebalancing
Following the rebalancing model developed in Pavone et al. (2012), we are interested in finding a static rebalancing policy that balances the system without adjusting prices. Let rij be the rebalancing flow from i to j, in other words, the rate (veh/h) at which we have empty vehicles traveling from i to j. We can formulate and solve this problem using a Linear Program (LP) that minimizes the empty travel time while ensuring a balanced system. Formally, this is stated as
Notice that in this formulation, u is a known parameter (not a decision variable) in the optimization problem. Therefore, we do not consider the possibility of decreasing the demand by adjusting prices. This LP is always feasible as one can always choose rij = Λji(uji) for all which satisfies the set of constraints (3b). For more details about this formulation, we refer the interested reader to Pavone et al. (2012) and Zhang and Pavone (2016).
3.3. Joint Pricing and Rebalancing
We are interested in choosing the best policy that leverages multiple decisions that the MoD platform faces. In particular, we would like to optimize the pricing, rebalancing and fleet sizing problem. We write this joint optimization problem as the combination of (1) and (3) which leads to
where cr and cf are the cost of rebalancing and the cost of owning and maintaining a vehicle per unit of time, respectively. Note that problem (4) is always feasible as it can always admit the solution u = umax, r = 0, and m = 0. However, in order to numerically solve (4) in polynomial time, and to ensure we have found the global maximum, we must validate that the objective function is concave for u ∈ [1, umax] and that the constraints (4b)–(4d) form a convex set. If these conditions are satisfied, then (4) yields a solution with higher profits than the individual formulations (1) and (3), or the sequential approach of solving first the rebalancing problem (3) and then selecting optimal prices (1). This happens given that the problem is jointly solving for m, u and r rather than using an individual or a greedy sequential approach.
4. Real-Time Strategies
So far, we have discussed static pricing and rebalancing policies which are desirable economically (there is no better dynamic pricing policy that can exceed its static counterpart in steady-state) and socially (avoiding drastic fluctuation in prices generates a more desirable platform for users). However, one characteristic that static policies lack is their responsiveness to perturbations in the environment.
In this section, we introduce real-time (or dynamic) policies to optimize the operation of the MoD platform. The main idea is to exploit real-time information to operate the system more efficiently. For example, we can use the status of vehicle queues x(t) and traveling vehicles y(t) at time t to decide a rebalancing strategy r(t) or to adjust prices u(t). Due to the desired theoretical static prices, we will focus on designing rebalancing policies r(t) that are dynamic in order to account for fluctuations, while we keep the prices static u(t) = u. Hence, from now on, we will focus on finding r(t) and we assume we use the optimal static pricing resulting from solving the joint problem (4).
To implement a dynamic controller we are required to define the state variables that will be available to control the system. Let us propose a state vector s(t) ∈ 0, 1, …, m}N composed of state variables indicating the actual and prospective vehicles at every region expressed by
where we recall that yij(t) and zij(t) are the number of customer-carrying vehicles and empty vehicles traveling from i to j, respectively, and where si(t) is the sum of all available vehicles at a region i and all vehicles traveling to i. Figure 2 shows an illustrative example of the state variables for different regions.
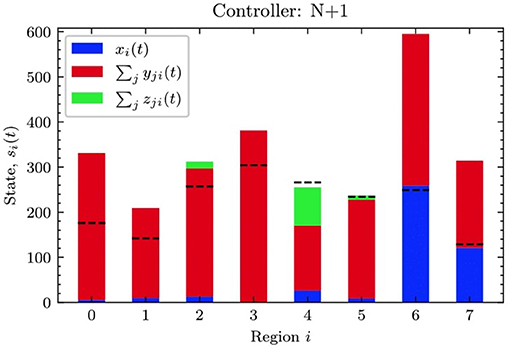
Figure 2. A diagram of the state of the system for the EMA network. Every bar in the plot represents the state of a region composed of the available vehicles (blue), the en-route customer-carrying vehicles (red), and the empty rebalancing vehicles (green). The dotted line represent the parameter θi for every region i which indicates the minimum desired level to be satisfied when performing a rebalancing action.
We let a rebalancing event be an event happening at a specific moment in time in which the platform decides to rebalance the system. Different from the fluidic controller in which vehicles are sent at a constant rate, the dynamic controllers herein trigger a rebalancing event once a condition is satisfied based on the state s(t) and a vector of d parameters denoted with Θ(t) ∈ ℝd.
Giving more structure to the dynamic policies presented here, let us define a set of parameters corresponding to a desired level of vehicles in every region at time t. In other words, for region i at time t, we would like to have a number of θi(t) idle or prospective vehicles. The choice of θ(t) is not known in advance and learning methods such as concurrent estimation (Cassandras and Lafortune, 2009) or RL (Sutton and Barto, 2018) can be leveraged to learn good choices of θ(t). With these parameters, we can define an optimization problem that rebalances the system to guarantee that every region has at least θi(t) prospective vehicles at the time of a rebalancing event. Therefore, at a fixed time t, we solve the rebalancing problem:
where rij(t) is the number of rebalance vehicles to be send from i to j, (5b) ensures that the minimum number of current and prospective vehicles at every region is greater or equal than its corresponding parameter, (5c) allows rebalancing only idle vehicles in a region, and (5d) ensures that the solution is integer.
Solving general ILPs such as (5) is computational-expensive. Thus, we would like to write an alternative formulation which is faster to solve. To achieve this, we follow Pavone et al. (2012) which exploits the total unimodularity structure of the problem. Informally, total unimodularity implies that if the right hand side vector of a network flow problem is integer-valued and the incidence matrix of the network exclusively contains entries in the set {−1, 0, 1}, then, the solution to the linear program relaxation is guaranteed to be integer. Note that in our case, the vectors θ(t) and s(t) are integer-valued. Hence we rewrite (5) as a network flow model as follows:
Note that (6b) encompasses both equations (5b) and (5c). When si(t) − θi(t) < xi(t) holds, then (6b) equals (5b). When xi(t) < si(t) − θi(t), the constraint (6b) indicates that region i has enough idle vehicles to send to other regions and it is identical to (5c). All the real time parametric controllers presented in the following subsections will be based on solving problem (6) at specific times t. Then, our next question is, when should we perform a rebalancing event?
4.1. Single Parameter
We begin by considering the simple time-driven controller which triggers a rebalancing event every Ω units of time. The controller solves (6) by choosing the thresholds θ(t) to be uniform and time-invariant, i.e., for all t and for all i in . This is a single-scalar policy since it is based on a single parameter Θ = Ω ∈ ℝ+}. This controller is quite effective, however, defining a uniform θ vector can be inefficient since demand rates for different regions are not uniform. For example, a region with a high volume of requests would benefit for a higher θi.
4.2. N+1 Parameter Controller
To address the limitation of using only uniform thresholds, we can define a controller that chooses a good time-invariant vector θ. One way to select θi is to consider a number that is proportional to the outgoing flow from node i, i.e., . Another approach is to select θ using simulation-based optimization methods such as concurrent estimation [see Swaszek and Cassandras (2019)] or RL. In addition to these N parameters coming from θ, we consider an additional parameter (this is why we called it the “N+1 controller”) which triggers the rebalancing event. A natural option for this is to use a time-driven parameter as in the single parameter controller. In addition to this, we also consider triggering the rebalancing event using a metric of the total vehicle imbalances in the system. In this manner, if the system is balanced, the controller would not activate any rebalancing event, conversely, if the system is imbalanced, the rebalancing event will be triggered more often. Formally, let Ω be a selected parameter which accounts for the minimum number of negative imbalances that the system is willing to tolerate before triggering a rebalancing event. That is, at every time t, the controller will solve problem (6) if where the set is composed of the regions which have less than the desired number of vehicles, i.e., . Here, Θ(t) = θ, Ω}. Both of these parameters can be selected by using any non-convex global optimization approach or by leveraging concurrent estimation techniques as in Swaszek and Cassandras (2019).
4.3. Dynamic N+1 Controller
Up to this point we have discussed polices where our parameters are time-invariant. The question we now ask is: can we update these parameters in real-time such that these can improve the overall performance? To do this, we introduce the notion of episodes. We think of an episode as a interval of τ units of time for which we will gather information and will use the data to update our future decisions. By employing this approach, we assume that the last episode observation contains relevant information for our next decision. In our case, for every episode k = 1, …, K, we would like to estimate the demand rate Λ(u(t)) with by counting the number of observed arrivals and dividing it by τ. Then, we update the θ vector either by using a naive approach:
or by taking a step in the direction of the new estimate, that is:
where ηk is a pre-specified stepsize or learning rate for all k in 1, …, K.
5. Numerical Results
We perform experiments to showcase the advantages and disadvantages of the static and dynamic policies. To carry out the experiments, we employ the transportation networks of Eastern Massachusetts Area (EMA), Chicago (CHI), and New York City (NYC), shown in Figures 3–5. The EMA network is composed of 8 regions and we retrieved its topological and demand information using speed data provided by the Central Transportation Planning Staff (CTPS) of the Boston Metropolitan Planning Organization (MPO) and processed as in Wollenstein-Betech et al. (2019). The NYC network is composed of 70 regions distributed across the Manhattan area and we use open-source travel times and taxi trip data available in NYC taxi and Limousine Commission (2020). Finally, the Chicago network is composed of 76 regions for which we retrieve the open-source data from Chicago Data Portal (2021).
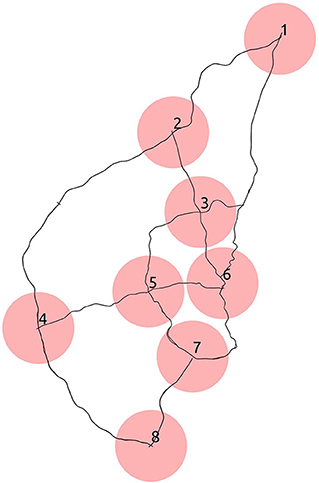
Figure 3. EMA.
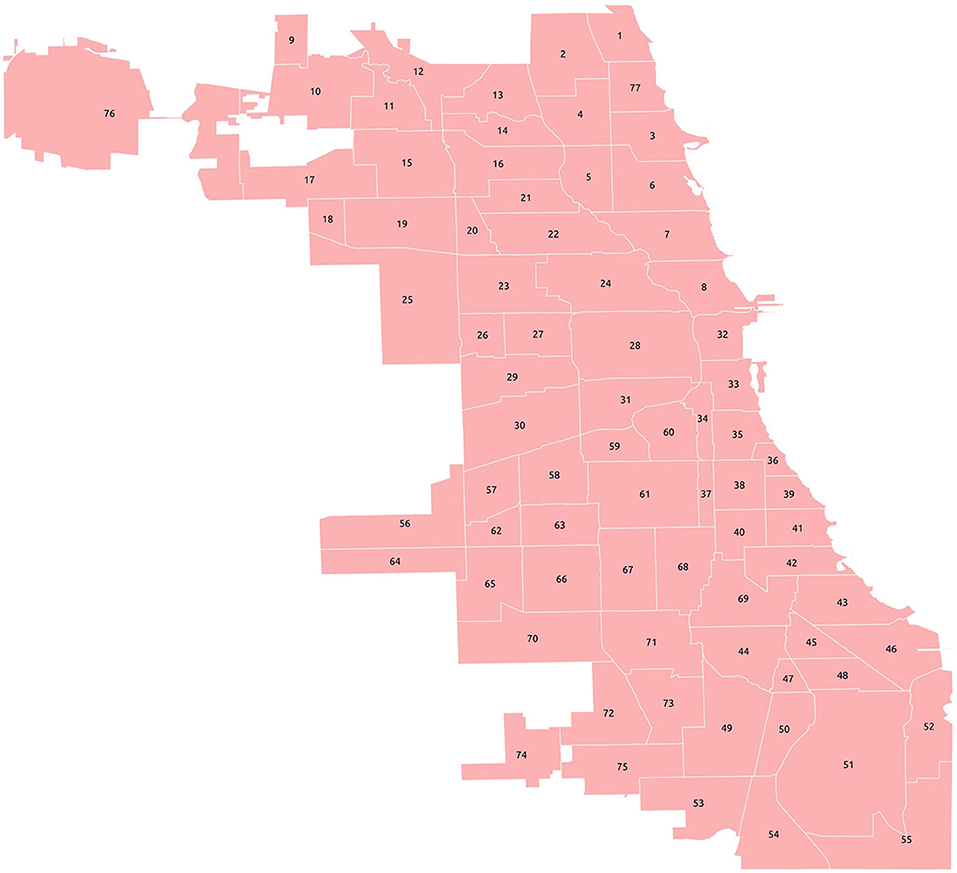
Figure 4. Chicago.
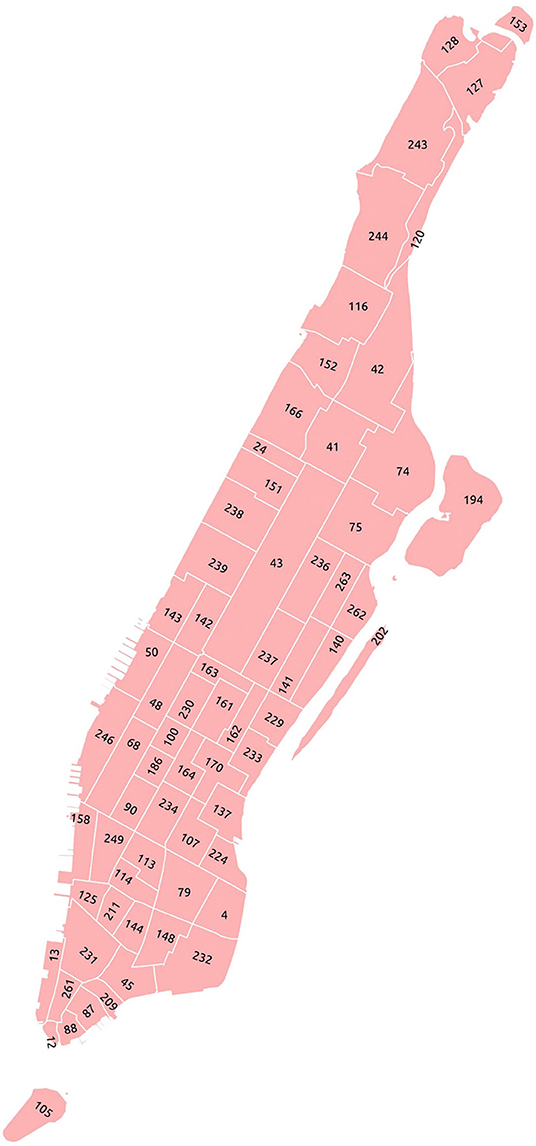
Figure 5. NYC.
To analyze the stable distributions of the demanded trips, we filter the data by only considering working days (Monday to Friday). Then, we focus on four time slots: Morning Peak (AM) from 7:00 to 10:00 h, Noon (MD) from 12:00 to 15:00 h, Afternoon Peak (PM) from 17:00 to 20:00 h and Night (NT) from 00:00 to 3:00 h. For every time slot we compute the average hourly demanded trips and travel times for every origin-destination pair and we use this information to preform our experiments.
Before stating our results, note that the static formulations (1)–(4) still require to define the demand functions Λij(uij). We assume that customers within and across OD pairs are homogeneous (have the same demand function), and, since we are interested in explicitly solving (1)–(4) to optimality, we assume a linear willingness to pay function of the form:
where we select . We made this choice using the empirical results reported in (Cohen et al., 2016, Table 2) where the number of active customers in the platform looking for drivers for a surge price greater than 4 is negligible. Using (7), our static problem becomes a Quadratic Program (QP) with linear constraints.
For all three experiments we let the operational cost and rebalancing cost be equal and proportional to the travel time, , where we select α = 0.72 by transforming the distance-based cost suggested in (Bösch et al., 2018, section 2.1.2) for a midsize vehicle to a time-based cost (dollars per minute). Additionally, we let the base price be a multiplier of the operational cost where we select β = 1.75 which can be interpreted as the minimum margin over the operation cost that the platform is willing to charge. We set the cost of losing customers due to the absence of vehicles in that region to be cp = $5, and the car ownership cost be cf = $1.98 per vehicle per hour as suggested in AAA (2019).
5.1. Joint Solution
We are interested in understanding the achievable benefits of solving the joint problem over different static approaches. We refer to as the joint strategy stated in (4), which solves the pricing and rebalancing for every origin and destination. First, we compare with an individual pricing policy that only adjusts prices without rebalancing the system, equivalent to solving (1). In the same spirit, we also consider the policy of only solving the rebalancing problem (3) with a fixed set of prices, in particular for this policy we set u = $2.66 which is the maximizer of (7). Third, we consider a sequential approach which involves solving the the rebalancing and using its solution to solve the pricing problem. Our motivation for this methodology comes from the fact that current MoD platforms tend to separate their pricing and rebalancing processes. Note that the sequential policy is not included because once the pricing problem is solved, the system is already balanced and the rebalancing problem becomes trivial (i.e., r = 0). Finally, we also consider the joint with fixed prices by origin policy which is motivated by the fact that current MoD services only use the origin (not the destination) when setting surge prices (see Chen et al., 2015; Cohen et al., 2016).
In Table 1, we report the relative deviation between a policy π and the joint policy . Formally, let Jπ be the optimal value of (4a) for a policy π. Then, the relative deviation is , which measures the improvement in performance of relative to policy π. In Table 1, we observe that outperforms all the other policies, highlighting the benefit of solving this problem using a joint approach. In particular, we observe that each of the individual strategies performs on average worse than strategies that optimize both pricing and rebalancing. Also, it is relevant to stress the 2% to 3% deviation of the policy with fixed surge price by origin, as it matches our expectations of the relevance of considering the destination when pricing. This happens because considering the destination in the pricing policy helps to balance the system via the selection of prices.
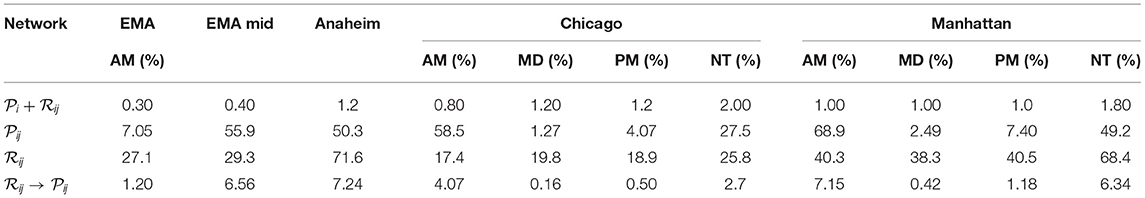
Table 1. Relative deviation in of each policy compared to the joint policy for different networks and time slots.
5.2. Fleet Size Selection and System Utilization
An important challenge for MoD systems is to properly select the correct number of drivers or autonomous vehicles to satisfy demand. One of the benefits of our static formulation is that its solution includes the variable m indicating the minimum fleet size to operate the system. However, this value is calculated assuming the steady-state solution of the system and does not account for the variance and perturbations that occur in the real world. In this experiment, we are interested in analyzing how this fleet size suggestion behaves in a more dynamic environment where perturbations exist. To test this, we have built a simulator of the MoD system which is publicly available on an online repository2. The variance (or randomness) of the simulation comes from the Poisson processes modeling the modulated customer arrivals and rebalancing vehicle departures. The customer arrivals times come from a Poisson process with a rate estimated from the data and modulated by the static prices. Similarly, the rebalancing events arrive following a Poisson process with rate equal to the solution of the static problem.
We perform this experiment using the EMA network for which we first solve problem (4). Let the optimal solution to (4) be u*, r*, and m*. Then, in our simulator we fix prices to u* and vary the fleet size by selecting m = γm* for γ = [0, 3]. Note that γ = 1 is equivalent to using the suggested fleet size m*. We run our simulations until a steady-state is reached, using two different rebalancing policies: fluidic and N+1. In Figure 6 we observe that the fleet size m* performs very well. The top left plot shows that for γ ≤ 1 the profit increases as we add vehicles to the fleet. This happens since the fleet size is too small to provide service to the platform's demand. In contrast, for γ > 1, we see that the profit decreases as γ increases. This is because the negative fixed cost of owning and maintaining an extra vehicle in the fleet is higher than profit it can produce (since most demand is already satisfied). As a result, this experiment suggests that solving (4) provides an automated procedure to determine a nominal fleet size. In addition, we are interested in quantifying the utilization for different fleet sizes. In other words, we would like to measure how much time the fleet of vehicles spends waiting for customers, transporting a passenger, or driving to rebalance the system. Figure 7 shows the results for a simulation of the system for a total time of 10 h where we observe that vehicle utilization, defined as the time that a vehicle is either transporting a customer or rebalancing, is around 75% compared with typical private vehicle utilization of 5%. Interestingly, the percentage of the total time that vehicles are rebalancing is practically negligible. We believe this value is small because the pricing policy is helping the system to be balanced, in other words, the “User” flow in Figure 7 is helping to balance the system. This is an interesting observation as there is an ongoing debate on the congestion effects that MoD rebalancing has caused in our cities (Fitzsimmons and Hu, 2017; Wollenstein-Betech et al., 2020b).
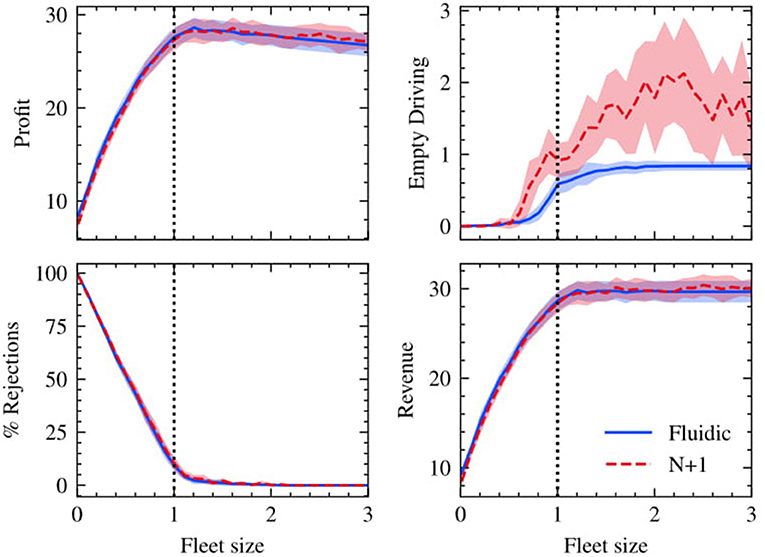
Figure 6. Performance indicators for different fleet sizes. Upper left plot shows the expected profit per minute. The upper right plot shows the percentage of time that vehicles are rebalancing. The lower left shows the percentage of customer requests that were rejected because there were no available vehicles to serve the customer. Finally, the lower right plot shows the revenue per minute.
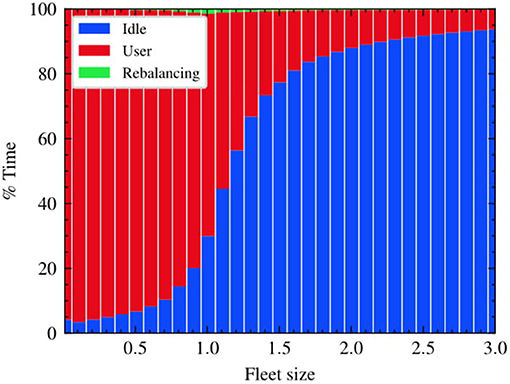
Figure 7. System utilization over different fleet sizes. At the suggested fleet size, corresponding to γ = 1.0, we observe that vehicle utilization is around 70% compared to 5% for private vehicles.
5.3. Responsiveness
One characteristic that static policies lack is their responsiveness to system perturbations or to changes in the environment. For example, consider the case when a sports event or concert finishes and all its attendees are requesting a transportation service to reach their destinations. In this situation, the steady demand is perturbed for a certain amount of time. We showcase this situation by running 15 simulations of the EMA network over a time period of 10 h. For each of these simulations we intentionally perturb the system between minutes 300 and 380 by multiplying the demand from a particular region to all its destinations by a constant factor; in this example we use 3. We select the update rule of parameter θ(t) to be the naive approach presented in section 4.3 with τ = 10 min and Ω = 15.
Figure 8 shows the trajectory of the (i) profit per minute, (ii) the fraction of loss requests due to a lack of vehicles in the region, and (iii) the percentage of empty driving. We observe that the N+1 controller, which operates in real time, is capable of responding to demand perturbations in comparison with the fluidic controller. In the second plot of Figure 8, we see how the percentage of rejections for the N+1 controller is lower than the fluidic one within the perturbation range [300, 380]. Moreover, in the last plot we see how the the N+1 controller increases its empty driving minutes responding to the demand shift experienced by the system. Finally, in the upper plot we see minimal differences on profits as we have assumed that the cost of rejecting a customer is small. In conclusion, Figure 8 shows that the N+1 controller provides service to more customers and hence incurs a higher rebalancing cost. In contrast, the fluidic model lowers its rebalancing costs by dropping more customers and incurs a reduction in profits and an additional cost for lost customers. Either strategy could be efficient for a given cost function but, in general, the N+1 approach is more responsive and customer-friendly as it adjusts to customer demand in real-time. This is especially important at times when the system might be transitioning from one stationary distribution to another, for example from an AM to MD period.
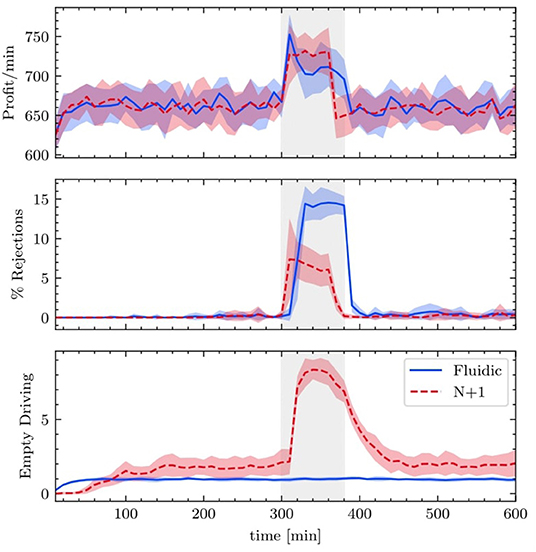
Figure 8. Responsiveness of the dynamic policy vs. a static policy. Between minutes 300 to 380 (shaded region) we have perturbed the demand of a single region by multiplying it by a factor of three. We observe in the two lower plots how the real time controller N+1 responds to this by sending more vehicles to these region compared with the static fluidic controller. As a result, N+1 provides a better service as the number of customer rejections is lower compared to the fluidic controller.
6. Conclusion
In this paper, we have addressed difficult operational decisions that shared mobility services face when operating their platforms. We discussed how to properly select the right number of vehicles to operate the platform, as well as how to choose prices to maximize a utility function while providing good service to customers.
Of particular interest, we have designed automated models that take as input the network topology, the estimated demand and a willingness-to-pay function of customers, and provide a framework to define the fleet size, the prices, and a real-time rebalancing policy for their proper operation.
We observe that it is of high value to design pricing together with rebalancing policies as well as to consider the customers' destination when defining prices. This modification in the pricing strategy achieves higher profits for the platform and helps rebalancing the system in a more equitable fashion, i.e., if a passengers' destination is helping to balance the system, her price will be lower compared with other passengers whose destination generate imbalances.
Arguably, our model deals with a simple linear willingness-to-pay function in order to provide tractable optimization models and be able to compare our results. Nevertheless more flexible willingness-to-pay functions such as logarithmic or exponential functions can be explored as part of future research in this area.
Data Availability Statement
The original contributions presented in the study are included in the article/supplementary material, further inquiries can be directed to the corresponding author/s.
Author Contributions
SW-B co-designed and analyzed the methods, co-wrote the manuscript, performed the analysis, and produced results and figures. IP and CC co-led the study, co-designed the methods, and co-wrote the manuscript. All authors contributed to the article and approved the submitted version.
Funding
This work was supported in part by NSF under grants ECCS-1509084, DMS-1664644, CNS-1645681, IIS-1914792, and CMMI-1454737, by AFOSR under grant FA9550-19-1-0158, by ARPA-E under grant DE-AR0001282, by the MathWorks, by the ONR under grant N00014-19-1-2571, and by the NIH under grant R01 GM135930.
Conflict of Interest
The authors declare that the research was conducted in the absence of any commercial or financial relationships that could be construed as a potential conflict of interest.
Footnotes
1. ^Within 500 m walking distance of low-capacity transport systems (buses and trams) and 1,000 m distance to high-capacity systems (trains, subways, and ferries).
References
AAA, (2019). Your Driving Costs: How Much Are You Really Paying to Drive? AAA Association Communication.
Badger, E. (2018). What's the Right Number of Taxis (or Uber or Lyft Cars) in a City? Washington, DC: New York Times.
Banerjee, S., Johari, R., and Riquelme, C. (2015). “Pricing in ride-sharing platforms: a queueing-theoretic approach,” in ACM Conference on Economics and Computation (Portland), 639–639. doi: 10.1145/2764468.2764527
Bates, J., and Leibling, D. (2012). Spaced Out. Perspectives on Parking Policy. London, UK: Royal Automobile Club Foundation.
Bimpikis, K., Candogan, O., and Saban, D. (2019). Spatial pricing in ride-sharing networks. Operat. Res. 67, 744–769. doi: 10.1287/opre.2018.1800
Bösch, P. M., Becker, F., Becker, H., and Axhausen, K. W. (2018). Cost-based analysis of autonomous mobility services. Transport Policy 64, 76–91. doi: 10.1016/j.tranpol.2017.09.005
Cassandras, C. G. (2017). Automating mobility in smart cities. Annu. Rev. Control 44, 1–8. doi: 10.1016/j.arcontrol.2017.10.001
Cassandras, C. G., and Lafortune, S. (2009). Introduction to Discrete Event Systems. New York, NY: Springer Science & Business Media. doi: 10.1007/978-0-387-68612-7
Chen, L., Mislove, A., and Wilson, C. (2015). “Peeking beneath the hood of uber, in Proceedings of the 2015 Internet Measurement Conference (Tokyo), 495–508. doi: 10.1145/2815675.2815681
Chicago Data Portal (2021). Taxi Trips. Available online at: https://data.cityofchicago.org/Transportation/Taxi-Trips/wrvz-psew#column-menu
Cohen, P., Hahn, R., Hall, J., Levitt, S., and Metcalfe, R. (2016). Using big data to Estimate Consumer Surplus: the Case of Uber. Technical report, National Bureau of Economic Research. doi: 10.3386/w22627
Crisostomi, E., Ghaddar, B., Häusler, F., Naoum-Sawaya, J., Russo, G., and Shorten, R. (2020). Analytics for the Sharing Economy: Mathematics, Engineering and Business Perspectives. Cham: Springer Nature. doi: 10.1007/978-3-030-35032-1
Daniel, K. (2015). Make cities and human settlements inclusive, safe, resilient and sustainable. UN Chronicle 51, 26–27. doi: 10.18356/54bc8fad-en
Etehad, M., and Nikolewski, R. (2016). Millennials and Car Ownership? It's Complicated. Los Angeles, CA: Los Angeles Times.
Fitzsimmons, E., and Hu, W. (2017). The Downside of Ridehailing: More New York City Gridlock. New York, NY: New York Times.
Gallego, G., and Van Ryzin, G. (1997). A multiproduct dynamic pricing problem and its applications to network yield management. Operat. Res. 45, 24–41. doi: 10.1287/opre.45.1.24
Hopcroft, J. E., and Karp, R. M. (1973). An n5/2 algorithm for maximum matchings in bipartite graphs. SIAM J. Comput. 2, 225–231. doi: 10.1137/0202019
Hörl, S., Ruch, C., Becker, F., Frazzoli, E., and Axhausen, K. W. (2018). “Fleet control algorithms for automated mobility: a simulation assessment for Zurich,” in Annual Meeting of the Transportation Research Board (Washington, DC).
Levin, M. W., Kockelman, K. M., Boyles, S. D., and Li, T. (2017). A general framework for modeling shared autonomous vehicles with dynamic network-loading and dynamic ride-sharing application. nSystems 64, 373–383. doi: 10.1016/j.compenvurbsys.2017.04.006
Mitchell, W. J., Borroni-Bird, C. E., and Burns, L. D. (2010). Reinventing the Automobile: Personal Urban Mobility for the 21st Century. Cambridge, MA: MIT Press. doi: 10.7551/mitpress/8490.001.0001
NYC Taxi Limousine Commission (2020). Taxi and Limousine Commission Trip Record Data. Available online at: https://www1.nyc.gov/site/tlc/about/tlc-trip-record-data.page
Paschalidis, I. C., and Liu, Y. (2002). Pricing in multiservice loss networks: static pricing, asymptotic optimality and demand substitution effects. IEEE/ACM Trans. Network. 10, 425–438. doi: 10.1109/TNET.2002.1012372
Paschalidis, I. C., and Tsitsiklis, J. N. (2000). Congestion-dependent pricing of network services. IEEE/ACM Trans. Network. 8, 171–184. doi: 10.1109/90.842140
Pavone, M., Smith, S. L., Frazzoli, E., and Rus, D. (2012). Robotic load balancing for Mobility-on-Demand systems. Int. J. Robot. Res. 31, 839–854. doi: 10.1177/0278364912444766
Schlagwein, D., Schoder, D., and Spindeldreher, K. (2020). Consolidated, systemic conceptualization, and definition of the “sharing economy”. J. Assoc. Inform. Sci. Technol. 71, 817–838. doi: 10.1002/asi.24300
Spieser, K., Samaranayake, S., Gruel, W., and Frazzoli, E. (2016). “Shared-vehicle mobility-on-demand systems: a fleet operator's guide to rebalancing empty vehicles,” in Annual Meeting of the Transportation Research Board (Washington, DC).
Sutton, R. S., and Barto, A. G. (2018). Reinforcement Learning: An Introduction. Cambridge, MA: MIT Press.
Swaszek, R. M., and Cassandras, C. G. (2019). “Load balancing in mobility-on-demand systems: reallocation via parametric control using concurrent estimation,” in Proc. IEEE Int. Conf. on Intelligent Transportation Systems (Auckland), 2148–2153. doi: 10.1109/ITSC.2019.8917333
Turan, B., Pedarsani, R., and Alizadeh, M. (2019). Dynamic pricing and management for electric autonomous mobility on demand systems using reinforcement learning. arXiv preprint arXiv:1909.06962. doi: 10.1016/j.trc.2020.102829
United N.ations (2018). The World's Cities in 2018-Data Booklet. Department of Economic and Social Affairs, Population Division.
Vazifeh, M. M., Santi, P., Resta, G., Strogatz, S. H., and Ratti, C. (2018). Addressing the minimum fleet problem in on-demand urban mobility. Nature 557, 534–538. doi: 10.1038/s41586-018-0095-1
Wallar, A., Alonso-Mora, J., and Rus, D. (2019). “Optimizing vehicle distributions and fleet sizes for shared mobility-on-demand,” in Proc. IEEE Conf. on Robotics and Automation (Montreal, QC: IEEE Press), 3853–3859. doi: 10.1109/ICRA.2019.8793685
Wallar, A., Van Der Zee, M., Alonso-Mora, J., and Rus, D. (2018). “Vehicle rebalancing for mobility-on-demand systems with ride-sharing,” in IEEE/RSJ Int. Conf. on Intelligent Robots and Systems (Madrid: IEEE Press), 4539–4546. doi: 10.1109/IROS.2018.8593743
Wollenstein-Betech, S., Cassandras, C. G., and Paschalidis, I. C. (2020a). “Joint pricing and rebalancing of autonomous mobility-on-demand systems,” in Proc. IEEE Conf. on Decision and Control (Jeju Island), 2573–2578. doi: 10.1109/CDC42340.2020.9304517
Wollenstein-Betech, S., Houshmand, A., Salazar, M., Pavone, M., Cassandras, C. G., and Paschalidis, I. C. (2020b). “Congestion-aware routing and rebalancing of autonomous mobility-on-demand systems in mixed traffic,” in 2020 IEEE 23rd International Conference on Intelligent Transportation Systems (ITSC) (Rhodes: IEEE), 1–7.
Wollenstein-Betech, S., Sun, C., Zhang, J., and Paschalidis, I. C. (2019). “Joint estimation of od demands and cost functions in transportation networks from data,” in 2019 IEEE 58th Conference on Decision and Control (CDC) (Nice: IEEE), 5113–5118.
Zhang, J., Pourazarm, S., Cassandras, C. G., and Paschalidis, I. C. (2016). “The price of anarchy in transportation networks by estimating user cost functions from actual traffic data,” in Proc. IEEE Conf. on Decision and Control (Las Vegas, NV), 789–794. doi: 10.1109/CDC.2016.7798364
Keywords: transportation, mobility-on-demand, pricing, routing, rebalancing, fleet sizing, operations management, autonomous vehicles
Citation: Wollenstein-Betech S, Paschalidis IC and Cassandras CG (2021) Optimal Operations Management of Mobility-on-Demand Systems. Front. Sustain. Cities 3:681096. doi: 10.3389/frsc.2021.681096
Received: 15 March 2021; Accepted: 11 June 2021;
Published: 08 July 2021.
Edited by:
Emanuele Crisostomi, University of Pisa, ItalyReviewed by:
Federico Rossi, NASA Jet Propulsion Laboratory (JPL), United StatesRichard Grant Gilmore III, College of Charleston, United States
Hend Bouziri, Tunis University, Tunisia
Suiming Guo, Jinan University, China
Copyright © 2021 Wollenstein-Betech, Paschalidis and Cassandras. This is an open-access article distributed under the terms of the Creative Commons Attribution License (CC BY). The use, distribution or reproduction in other forums is permitted, provided the original author(s) and the copyright owner(s) are credited and that the original publication in this journal is cited, in accordance with accepted academic practice. No use, distribution or reproduction is permitted which does not comply with these terms.
*Correspondence: Salomón Wollenstein-Betech, salomonw@bu.edu