Long-Term (2003–2019) Air Quality, Climate Variables, and Human Health Consequences in Dhaka, Bangladesh
 Md Riad Sarkar Pavel
 Shahid Uz Zaman
 Farah Jeba
  Abdus Salam
- Department of Chemistry, University of Dhaka, Dhaka, Bangladesh
Long-term trends in air quality by studying the criteria pollutants (PM2.5, PM10, CO, O3, NO2, and SO2) and climate variables (temperature, surface pressure, and relative humidity) were depicted in this study. The 17-year (2003–2019) average values of PM2.5, PM10, CO, O3, NO2, and SO2 were 88.69 ± 9.76 μg/m3, 124.57 ± 12.75 μg/m3, 0.69 ± 0.06 ppm, 51.42 ± 1.82 ppb, 14.87 ± 2.45 ppb, and 8.76 ± 2.07 ppb, respectively. The trends among the ambient pollutants were increasingly significant (p < 0.05) except for O3 with slopes of 1.83 ± 0.15 μg/m3/year, 2.35 ± 0.24 μg/m3/year, 0.01 ± 0.002 ppm/year, 0.47 ± 0.03 ppb/year, and 0.40 ± 0.02 ppb/year for PM2.5, PM10, CO, NO2, and SO2, respectively. Pearson correlations revealed a significant association among the pollutants while a noteworthy correlation was observed between ambient pollutants and surface temperature. Principal component analysis (PCA) and positive matrix factorization (PMF) have been employed collectively to examine the main sources of the pollutants. PCA revealed similar trends for PMs and CO, as well as NO2 and SO2 being equally distributed variables. PMF receptor modeling resulted in attributing four sources to the pollutants. The factors inferred from the PMF modeling were signified as vehicular emissions, road/soil dust, biomass burning, and industrial emissions. The hazard quotient (HQ) values were not antagonistic (HQ < 1) in acute exposure levels for the three age groups (infants, children, and adults) while showing significant health risk (HQ > 1) in chronic exposure for infants and children. Children are identified as the worst sufferers among the age groups, which points to low breathing levels and high exposure to traffic pollution in Dhaka, Bangladesh.
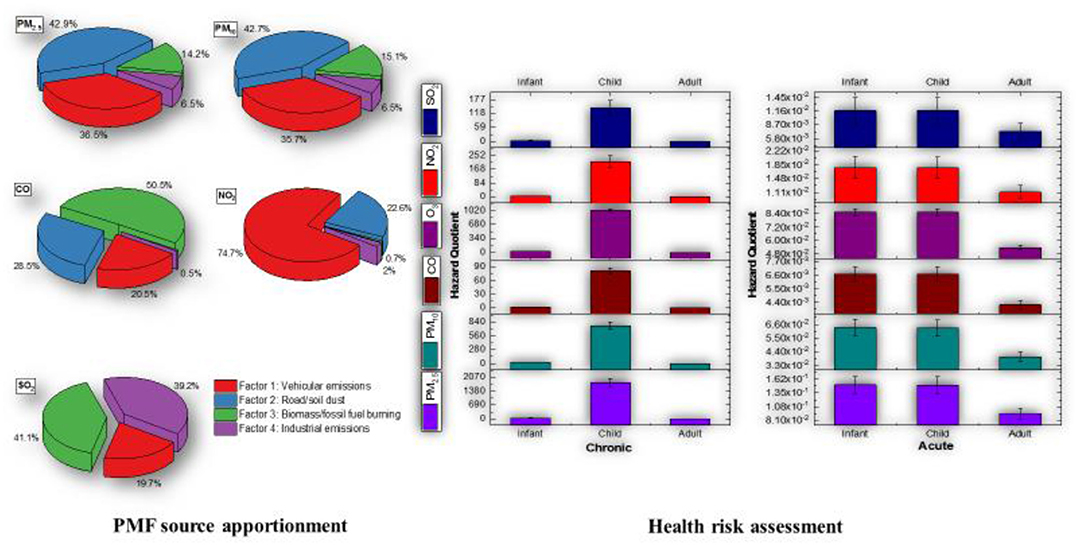
Graphical Abstract. Source apportionment and hazard quotients of ambient air pollutants in Dhaka.
Highlights
- Long-term trends of criteria air pollutants and climate variables were analyzed.
- Significant positive trends were observed for the pollutants except ozone.
- Four factors were characterized as estimated sources from PMF modeling.
- HQ exceeded the acceptable limit (>1) for chronic exposure to children and infants.
Introduction
Air pollution and climate change are the two most significant and interconnected challenges plaguing the 21st century. If existing policies remain unchanged, air pollution would be the most important environmental factor affecting premature deaths by 2050 (OECD, 2012). Global warming has culminated in a 43% increase in anthropogenic radiative forcing (RF) since 2005, according to the new IPCC report, focusing on human behavior as the most significant influencer (Stocker et al., 2013). The urban heat-island effect causes towns to be far warmer than their neighboring rural area due to enhanced anthropogenic activities. Owing to associations between warming and air emissions, this effect would pose extreme health problems for cities around the world by 2050 (Schmale et al., 2014). Lancet Commission on Pollution and Health reported 6.5 million deaths in 2015 due to atmospheric air pollution (Landrigan et al., 2017). while mortality due to past climate change on air quality was much lower: ~1500 and ~2200 deaths per year due to ozone and PM2.5, respectively (Silva et al., 2013). The global air quality scenarios are unlikely to change anytime soon, and the crisis in the megacities of developing countries is expected to worsen. As a result, it is important to continue tackling air quality problems in tandem with climate change mitigation initiatives (Williams, 2012).
Approximately 91% of the world's population live in areas where WHO air quality standards have been exceeded. However, due to its large population, Bangladesh is one of the most polluted countries in terms of air quality, with Dhaka ranking as one of the world's two most polluted cities (AirVisual, 2018). In Bangladesh, there had been little to no effort and administrative works to track or mitigate ambient air pollution before 1999. In 1999, the government began establishing frameworks and regulations to meet US EPA and Bangladesh National Air Quality Standards, especially in Dhaka. In this regard, a number of controls have been implemented, including the prohibition of leaded gasoline in July 1999 and the replacement of old two-stroke engine three-wheelers with compressed natural gas (CNG)-powered four-stroke three-wheelers beginning in January 2003; introducing CNG-powered cars, buses, and trucks; and regulating brick kiln emanations, which resulted in a reduction of airborne Pb concentrations and improved air quality than before (Salam et al., 2013; Begum and Hopke, 2019). However, since the introduction of CNG and the prohibition of two-stroke engines, traffic congestion in Dhaka city has greatly worsened air quality, and numerous brick kilns using crude oil, fossil fuel, coal, natural gas, electricity, and biomass as a source of energy have sprung up all over the city and have been discharging many air pollutants including black carbon and organic carbon (Salam et al., 2013). In addition, research on the results of CNG conversion in other megacities (Rio de Janeiro, Mexico City, and New Delhi) and the greenhouse gas (GHG) benefits of such conversion showed that switching from diesel vehicles increased high-emission particulates and black carbon, which are more potent as GHGs than CO2 or CH4. Thus, large-scale conversion of petrol vehicles embodies the risk of reduced GHG benefit or even negative GHG impacts (Wadud and Khan, 2013). Furthermore, permanent wetlands have been disappearing at an unprecedented pace as a result of unplanned urbanization to accommodate the huge population, with more than 49% of wetland areas disappearing in Dhaka city between 1960 and 2008 (Rai et al., 2017). As a result of such adverse situations, Dhaka had very high (>1) toxicity potential (TP) values of PM2.5 and PM10 (Zaman et al., 2021) and recorded the highest mortality and morbidity rates (hospital admissions) among the megacities studied, with about 7,000 deaths and 2,100 excess cases (cardiovascular and respiratory) each year (Gurjar et al., 2010). Table 1 reports several previous researches on ambient air quality and climate impact in Dhaka, Bangladesh, undertaken after 2003.
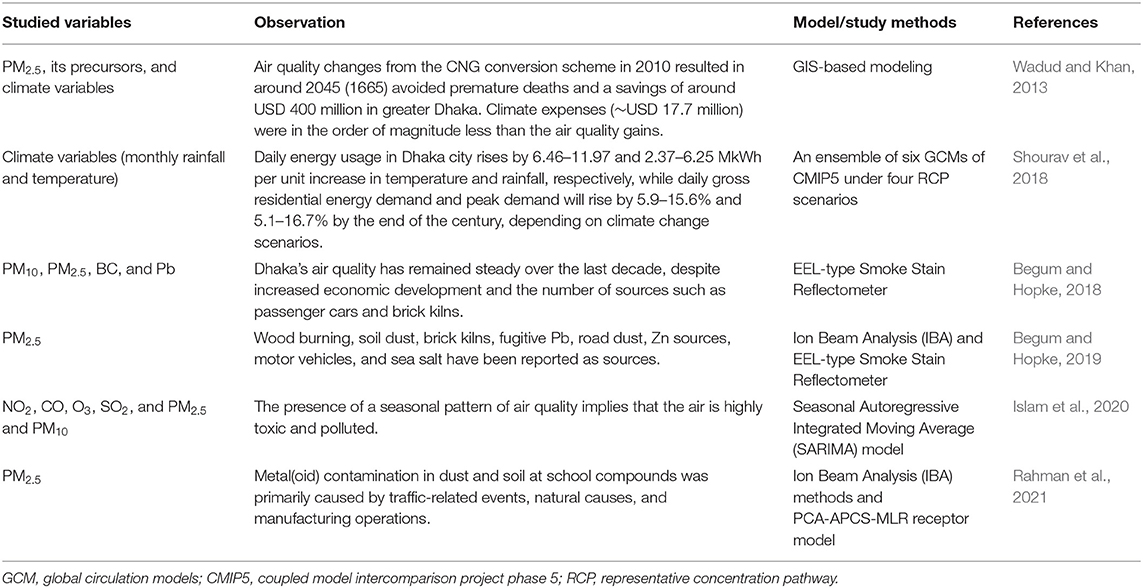
Table 1. Recent studies concerning air quality and climate variables in Dhaka, Bangladesh.
Carbon monoxide, lead, ground-level ozone, particulate matter (PM), nitrogen dioxide, and sulfur dioxide have been designated as criteria air contaminants by the Environmental Protection Agency (EPA) and the World Health Organization (WHO), and national and global ambient air quality standards (NAAQS) have been developed for these six pollutants (EPA). These contaminants, which are made up of various materials, have a broad range of sources of pollution and varying degrees of health impacts and toxicity, dictating the use of source apportionment studies to understand the formation processes and their sources. On source apportionment, two chemometric techniques, principal component analysis (PCA) and positive matrix factorization (PMF) receptor model, were employed collectively. PCA is utilized to relate the air pollutants and their overall changes in the aerosol composition while PMF is used to determine the different sources of pollution and the temporal variability of each pollutant without considering their correlations (Padoan et al., 2020).
Dhaka is one of the most contaminated cities in the world and is in dire need of effective mitigation policies to attain national and global air quality standards. Unfortunately, there is limited information for the criteria air pollutants levels, sources apportionment, impact on human health, and climate variables based on long-term datasets. Therefore, the objective of this study is to understand the long-term (2003–2019) evolution of major atmospheric contaminants (PM2.5, PM10, CO, O3, NO2, and SO2) and the effect of meteorological parameters (temperature, pressure, and relative humidity) on these pollutants following the January 2003 ban on old two-stroke engine three-wheelers in favor of CNG-powered four-stroke three-wheelers. Although there have been recent comparative studies for fine and coarse fractions of PM in terms of source attribution in the seasonal and short-term periods, long-term studies for all of the criteria contaminants and their health effects, as well as their origins, have been scarce. This study will help evaluate the aftermath of implementing the CNG-powered vehicles and how the vehicles and other sources might be regulated in the future to improve the ambient air quality in Dhaka, Bangladesh.
Description of the Study Area
Dhaka, Bangladesh's capital and most populous city, is situated at the northeastern end of the Indo-Gangetic Plain (IGP). Dhaka is the center of Bangladesh with an elevation of ~9 m above sea level (Figure 1). Dhaka encompasses a total area of 1463.60 square kilometers (565.10 square miles) and possesses a population of 12.5 million and, hence, is one of the most densely populated cities in the world with a density of 8,229 per square kilometer. Dhaka has a population growth rate of 3.48% per year due to ever-growing urbanization (urbanization rate = 77.36%), which drives a huge chunk of the population toward urban life every year from rural/suburban areas (www.dhaka.gov.bd). As a result, Bangladesh with a mean PM2.5 concentration of 77.1 μg/m3 and megacity Dhaka with the same mean concentration of that of Bangladesh has emerged as the 1st and 2nd most polluted country and capital city in the world (Amato et al., 2020).
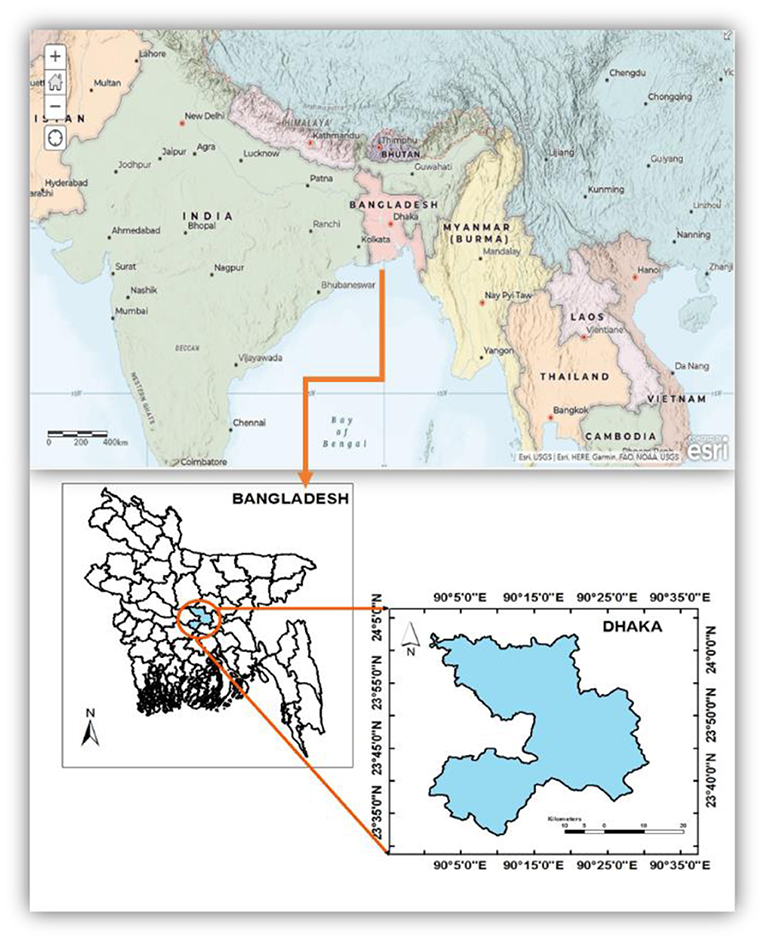
Figure 1. Location of Bangladesh and the district of Dhaka.
Air Pollution and Meteorological Data
Although the Department of Environment (DoE) has some ground-based monitoring stations for atmospheric pollutants, long-term datasets are still scarce for Dhaka. As a result, 24-h ambient concentrations of the air pollutants (PM2.5, PM10, CO, O3, NO2, and SO2) and meteorological data (temperature, surface pressure, and relative humidity) were collected from the EAC4 (ECMWF Atmospheric Composition Reanalysis 4) global reanalysis dataset produced by the European Centre for Medium-Range Weather Forecasts (ECMWF) from Copernicus Atmosphere Monitoring Service (CAMS) for the period January 2003 to December 2019. The dataset contains gridded global data with 0.75° × 0.75° horizontal resolution and has the following vertical coverage: surface, total column, model levels, and pressure levels. This period was chosen to depict long-term air quality and its consequences on climate variables and human health in Dhaka, Bangladesh.
CAMS Reanalysis Data
Reanalysis combines model data with measurements from around the world to construct a globally robust and coherent resource using a physics and chemistry-based model of the atmosphere. The data integration is defined as a technique used by numerical weather prediction centers and air quality forecasting centers, in which a preceding prediction is merged with currently available measurements in an optimized way every so many hours (12 h at ECMWF) to create a new best estimate of the atmospheric situation, known as analysis, from which an updated, enhanced forecast is produced (ads.atmosphere.copernicus.eu). The CAMS reanalysis is the most recent global reanalysis data collection of atmospheric composition (AC) developed by the Copernicus Atmosphere Monitoring Service, and it consists of three-dimensional time-consistent AC fields, including aerosols, chemical species, and greenhouse gases, through the CAMS global greenhouse gas reanalysis (EGG4). The dataset improves on the knowledge obtained during the development of the Monitoring Atmospheric Composition and Climate (MACC) reanalysis and the CAMS interim reanalysis. The assimilation method estimates observational biases and separates high-quality data from low-quality data. Estimates are made using the atmosphere model in places where data collection is limited or for pollutants for which no direct measurements are possible. Reanalysis is a very easy and common dataset to work with since it provides forecasts at each grid point across the world at each daily production time, over a long period of time, and in the same format.
The CAMS reanalysis was created with 60 hybrid sigma/pressure (model) levels in the vertical, with the top level at 0.1 hPa, using 4DVar data assimilation in ECMWF's Integrated Forecast System (IFS) CY42R1. The 4DVar data assimilation employs 12-h assimilation periods spanning 09 UTC to 21 UTC and 21 UTC to 09 UTC, respectively. The IFS model documentation for various model cycles can be found at https://www.ecmwf.int/en/forecasts/documentation-and-support/changes-ecmwf-model/ifs-documentation. On these levels, atmospheric data are available, which are also interpolated to 25 strain, 10 potential temperature, and 1 potential vorticity level(s). Data on the “surface” or “single stage” are also available.
EAC4 is the fourth-generation ECMWF global reanalysis of AC. Monthly surface data were utilized to study human exposure to the selected pollutants and the effect of the climate variables. Monthly means for assessments and instantaneous predictions are calculated using data with a valid time in the month, ranging from 00 to 23 UTC, except the time 00 UTC on the first day of the next month. Data with a prediction date that falls within the month are used to establish monthly means for accumulations and mean rates.
However, there have been some issues associated with assimilation of the CAMS global reanalysis (EAC4). During 2003 and between March and August 2004, the ozone analysis has a degraded quality, while from 2013 onwards, there is a larger seasonally varying bias in ozone in the free troposphere, particularly in the Arctic and Antarctic that is not seen in the control run. Furthermore, NO2 in the CAMS reanalysis is mainly influenced by prescribed emissions (e.g., anthropogenic MACCity, GFAS biomass burning) and only to a lesser extent by assimilated findings due to its short lifespan. As a result, patterns or deviations derived from NO2 reanalysis fields will primarily represent trends in underlying pollution. More details about the EAC4 data products, i.e., the observation techniques, data assimilation methods, bias correction, etc. have been described by Inness et al. (2019) and Flemming et al. (2015).
Validation of the Reanalysis Data
The CAMS-84 is a sub-project of CAMS that deals with service product validation. The validation reports for the global and regional services are updated every 3 months by CAMS-84. The validation is focused on a variety of measurements and measuring methods, including in situ observations, surface remote sensing, airplane observations, balloon sounding, ship observations, and satellite observations. With a deadline of ~1 month after sensing, the validation reports' three-monthly interval adds restrictions on the timely availability of the findings. Table 2 represents the assimilation and validation products for specific species along with their vertical range. The validation reports and the verification websites can be found at http://atmosphere.copernicus.eu/user-support/validation/verification-global-services.
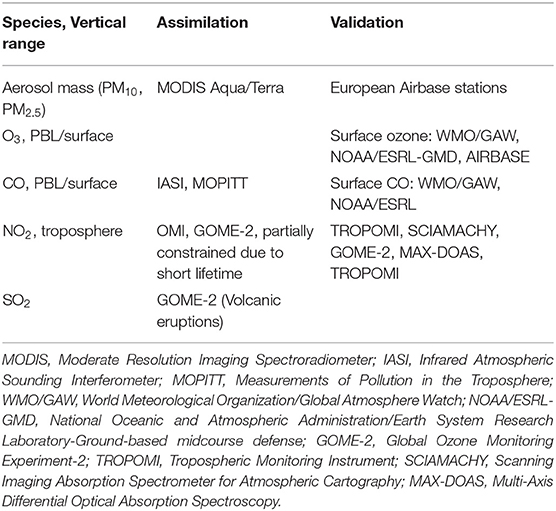
Table 2. Observations used in the assimilation and validation of CAMS, ordered by species.
For this study, the selected reanalysis products were validated with the monthly average air pollution concentration data overlapping the months of the analysis period obtained from the Department of the Environment (DoE, CASE project) in Dhaka, Bangladesh. Validation of PM2.5 and PM10 NO2, and SO2 with the DoE data has been depicted in the following figure and the concentrations showed R2 values of 0.93, 0.85, 0.58, and 0.76, which confirms that the reanalysis data are capable of reflecting the ground-based air pollution data (Figure 2). Validation for the other pollutants was not done due to temporal anomalies between the reanalysis and ground-based data.
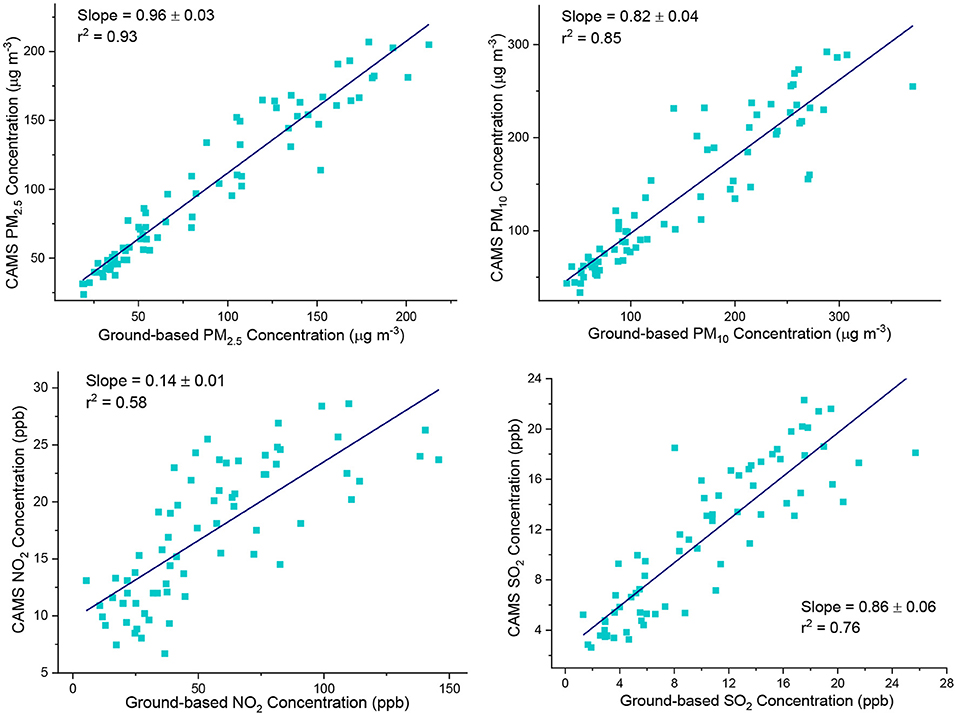
Figure 2. Validation of the Copernicus Atmosphere Monitoring Service (CAMS) products with ground-based products obtained from the Department of Environment (DoE), Bangladesh.
Source Apportionment Using PCA and PMF Modeling
Correlations among the variables were studied through Pearson correlation coefficients instead of non-parametric tests as non-parametric tests are better suited for datasets having no linear relationships or violating normality (Hauke and Kossowski, 2011). Source apportionment has always been tricky in the case of environmental datasets (Gao et al., 2016). PCA has been used robustly (Cotta et al., 2020) and coupled with other techniques (Sun and Sun, 2017; Franceschi et al., 2018; Gao et al., 2020; Liu et al., 2020). On the other hand, the contribution of various sources to PM and other contaminants around the world have been studied by PMF analysis, as well as references therein (Cesari et al., 2016, 2018; Sharma et al., 2016a,b; Crilley et al., 2017; Liu et al., 2017; Ryou et al., 2018; Jain et al., 2019, 2020). Although PCA is useful for evaluating the association between variables and measurements, it can also be used to describe each observation independently, whereas PMF is more based on the overall dataset definition. As a result, PCA can be used to explain how each attribute affects the observations, as well as whether certain observations or classes of observations have unusual characteristics. Instead of focusing on each observation or indicator, PMF explores the temporal pattern of all variables to find a potential common source. As a result, combining PCA and PMF to achieve an aggregate statistical summary of data is a safe way to view each observation as “independent” and as part of a temporal pattern (Padoan et al., 2020).
Firstly, the distribution of the variables over the studied period was evaluated through PCA, a widely used chemometric technique (Jollife and Cadima, 2016). PCA allows rotating the space spanned by the original variables to a new space spanned by the principal components (PCs), in which the first (generally two or three) PCs report the majority of the details found in the original data. As a result, analyzing the behavior of samples (in the scores plot) and variables is made easier by visualizing the two- or three-dimensional plot of PC1 vs. PC2 (and/or PC3) (in the loading plot).
Then, PMF modeling was employed for the allocation of sources and the inner characteristics of ambient air pollutants (PM2.5, PM10, CO, O3, NO2, and SO2) on a monthly basis using EPA PMF (version 5.0). PMF also rotates space spanned by the original variables but the calculated factors are not orthogonal to each other like PCA. This way, a better or worse solution can be obtained by PMF modeling by rotating the variables. Standard deviations associated with each measurement are also required to choose the most suitable number of factors and to evaluate the rotational stability of the obtained solution in the PMF analysis (Paatero and Tapper, 1994). PMF allows for the visualization of diverse sources of air contaminants as well as their contributions to specific pollutant concentrations. Several previous research and related sources enumerated in those publications had detailed explanations of PMF algorithms and their use (EPA PMF 5.0 guide; Sharma et al., 2016a; Cesari et al., 2018; Jain et al., 2020). Therefore, only the compulsory information to elucidate PMF modeling has been described here.
The PMF decomposes a matrix composed of the factors (p), source profiles (f), and the contribution (g) of each source to individual samples based on the following equation (Liu et al., 2017):
where ij signifies species residuals, i is the number of concentrations, j is the number of chemical components, and X denotes i by j matrix.
Monthly average concentrations of the ambient air pollutants were utilized in the PMF modeling. To attain acceptable results reducing the uncertainties of online datasets, the following precautions were employed: (1) purging of the outliers (far-off values compared to the average value); (2) apportionment of the sources from monthly datasets (using daily mean concentrations obtained from hourly values); and (3) employment of multiple receptor model (Belis et al., 2015; Cesari et al., 2016). Photochemical oxidation of carbon monoxide (CO) and volatile organic compounds (VOCs) in the presence of nitrogen oxides (NOx = NO + NO2) and sunlight is the primary source of ozone (Lu et al., 2018). Thus, including O3 concentrations could bias the source apportionment of the receptor models by using PMF. Therefore, O3 was excluded from the input dataset in the modeling.
Standard deviations for each month were included to account for uncertainties of each data point and ease the model to estimate results with a significant confidence level for each pollutant. PMF has the establishment of considering uncertainties accompanying each chemical component of the data (EPA PMF 5.0 guide).
where Error fraction is defined as a measure of the standard deviation of particular pollutants divided by the square root of the total number of concentrations. The signal-to-noise (S/N) ratio is utilized to categorize quality of data and the S/N ratios found in this study fall within the acceptable range of those presented in many PMF studies (Sharma et al., 2016a; Cesari et al., 2018; Amato et al., 2020; Jain et al., 2020). The data used in the modeling were specifically divided into three groups based on S/N ratios, with variables with S/N ratios of >2 being labeled as “strong variables,” variables with S/N ratios of 0.2–2 being labeled as “weak variables,” and the model employing three-fold uncertainty with them. Variables that had S/N ratios <0.2 were disregarded from further analysis and denoted as “bad variables” (Amato et al., 2020). The S/N ratio of all the variables of the air pollutants has been reported in Supplementary Table 1.
PMF modeling was employed to run in robust mode, and the Q robust and Q true values were found to be in good agreement with the base run for a four-factor solution. Supplementary Table 2 displays the Q robust and Q true values for the base runs. The little discrepancies between the two Q-values indicate that the models were able to achieve a satisfactory fit for the data and outliers. Furthermore, 100% convergence rate for all analytical runs was obtained in the model runs, which also affirms the steadiness of the model and the ability to fit all the variables suitably (Nayebare et al., 2018). Extra modeling uncertainty is an additional important parameter that pronounces the fitness of the model. No (0%) error constant (extra modeling uncertainty) was found for all the air pollutants. The results obtained for the air pollutants by PMF modeling had a significant agreement between measured and modeled concentrations specified by R2 that further confirmed that the concentrations were well-reconstructed (Cusack et al., 2013). R2 values [from the one-way analysis of variance (ANOVA) F-test] for all the air pollutants were detected to be higher than 0.98, and p-values [from the two-sample Kolmogorov–Smirnov (KS) test] were close to 0 (Supplementary Table 2). The performance factor profiles' uncertainties were also assessed using error estimation methods, namely, the Bootstrap (BS) and Displacement (DISP) methods. Details about error estimation methods used in EPA PMF software, 5.0, have been described by Brown et al. (2015). A strong mapping of the PMF species was observed for all datasets in the BS study, with unmapped cases accounting for <5% of the total. Furthermore, the findings are consistent since no factor profile swap was observed in DISP for any of the datasets (Manousakas et al., 2017).
Human Health Risk Assessment
Adverse effects due to exposure to toxic agents can be inclusively estimated through health risk assessment (USEPA, 1989). This procedure predicts effects on human health caused by a particular pollutant utilizing existing exposure data (WHO, 1996). Exposure to PM2.5, PM10, CO, O3, NO2, and SO2 and their adverse effects has been studied in this study through the US EPA human health risk assessment framework. This method has been employed in several previous studies to assess non-carcinogenic risk due to the criteria pollutants (Megido et al., 2017; Piersanti et al., 2018; Embiale et al., 2020; Mundackal and Ngole-jeme, 2020; Edlund et al., 2021; Morakinyo et al., 2021). The four steps involved in the HHRA are depicted below:
Hazard Identification
Firstly, PM2.5, PM10, CO, O3, NO2, and SO2 have been identified as criteria air pollutants by the WHO as well as USEPA (World Health Organization, 2005; USEPA, 2016).
Dose–Response Assessment
Secondly, the amount of pollutants absorbed by the body was calculated as a function of concentration and exposure time. This research did not have a dose–response analysis. Rather, WHO and the DoE environmental quality guidelines for these air contaminants were used as a benchmark in this study (depicted in Table 3).
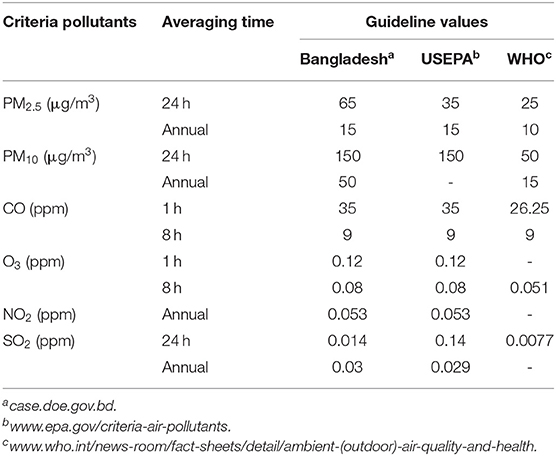
Table 3. Comparison of ambient guideline values of the criteria pollutants in Bangladesh.
Exposure Assessment
Then, identification of the exposed population and the magnitude of hazard and duration of exposure are estimated through exposure assessment. Inhalation is considered the major route of exposure to pollutants. Chronic (annual) and acute (1-h) exposure assessments were determined for three different age groups, namely, infants (birth to a year), children (6–12 years), and adults (19–75 years).
The acute exposure assessment for the non-carcinogenic pollutants (PM2.5, PM10, CO, O3, NO2, and SO2) was based on the rate equation as follows:
where AHD stands for average hourly dosage for inhalation (μg/kg/h), C stands for chemical concentration (μg/m3), IR stands for inhalation rate (m3/hour), and BW stands for bodyweight (kg) (WHO, 1999).
The rate equation for the chronic exposure assessment for the non-carcinogenic pollutants (PM2.5, PM10, CO, O3, NO2, and SO2) was:
where ADD represents the average daily dosage of the chemical of interest (μg/kg/day), C represents the volume of the chemical in ambient air (μg/m3), IR represents the inhalation rate (m3/day), ED represents the exposure period (days), BW represents the exposed group's body weight (kg), and AT represents the averaging time (days) (WHO, 1999). ED is defined by the following equation:
where ET denotes exposure time (h/day), EF denotes exposure frequency (days/year), and DE denotes exposure period (year). Table 4 shows the estimated values of each variable used in this assessment for each population group in terms of acute and chronic exposure periods (Morakinyo et al., 2017, 2021; Embiale et al., 2020).
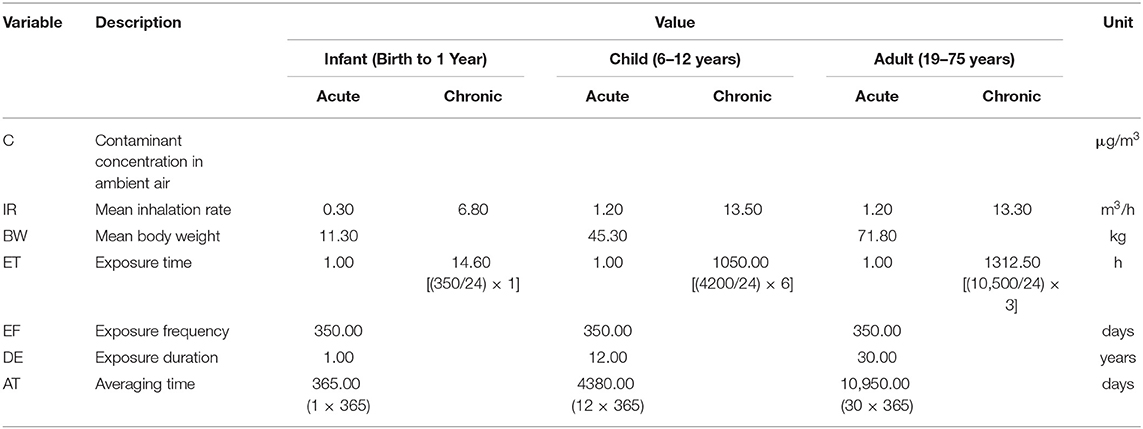
Table 4. The variables used in the calculation of exposure rate and risk assessment factors for different age groups.
Risk Characterization
Finally, using the hazard quotient (HQ), the potential non-carcinogenic consequences of exposure to a known pollutant are quantified via the “Risk characterization” process (Morakinyo et al., 2017). HQ expresses the likelihood of a negative health outcome among stable and/or sensitive people. The adverse health outcome occurring among different individuals of different age groups is reflected by this process. Thus, non-cancer risks associated with the air pollutants were estimated through HQ. Acute and chronic non-cancer risks were calculated according to the following equations:
where RfC is an approximation containing uncertainty of considerable scale of an incessant inhalation exposure to the human population (including sensitive subgroups) that possesses a substantial risk of lethal effects during a lifetime (www.epa.gov). The chemical identifications, RfC values, and affecting organs are presented in Supplementary Table 2.
An HQ value of 1.0 indicates no risk to human health, while an HQ value of 1.0 indicates a marginal risk, indicating that the considered contaminant is not a potential health risk, to even a sensitive person. However, an HQ > 1.0 signifies risks to some extent upon exposure to different individuals, adults, and/or children (USEPA, 1989).
Results and Discussion
Ambient PM Trends in Dhaka
Long-term yearly as well as monthly trends of PM2.5 and PM10 have been depicted in Figure 3. Supplementary Table 4 shows the statistics of PM2.5 and PM10 during the studied period. Both PM2.5 and PM10 showed normal distribution for the studied period with mean yearly concentrations of 88.69 ± 9.76 and 124.57 ± 12.75 μg/m3, respectively. The yearly values of PM2.5 and PM10 exceeded the national air quality standards respectively by nearly 6.0 and 2.5 times while exceeding WHO standards by 9.0 and 6.0 times. The linear regression analysis has been performed to determine the trends and statistical significances of PM2.5 and PM10. Increasing trends have been observed for PM2.5 and PM10 over the years with slopes of 1.83 ± 0.15 and 2.35 ± 0.24 μg/m3/year, respectively. One-way ANOVA showed that the increasing trends were statistically significant (p < 0.05) for both the PMs (Figure 3). Rana et al. (2016) reported similar findings in Dhaka that showed that PM2.5 concentrations exceeded the WHO guideline value by 8–13 times. Begum and Hopke (2018) also showed that long-term trends for PM2.5 and PM10 exceed the USEPA standards in Dhaka.
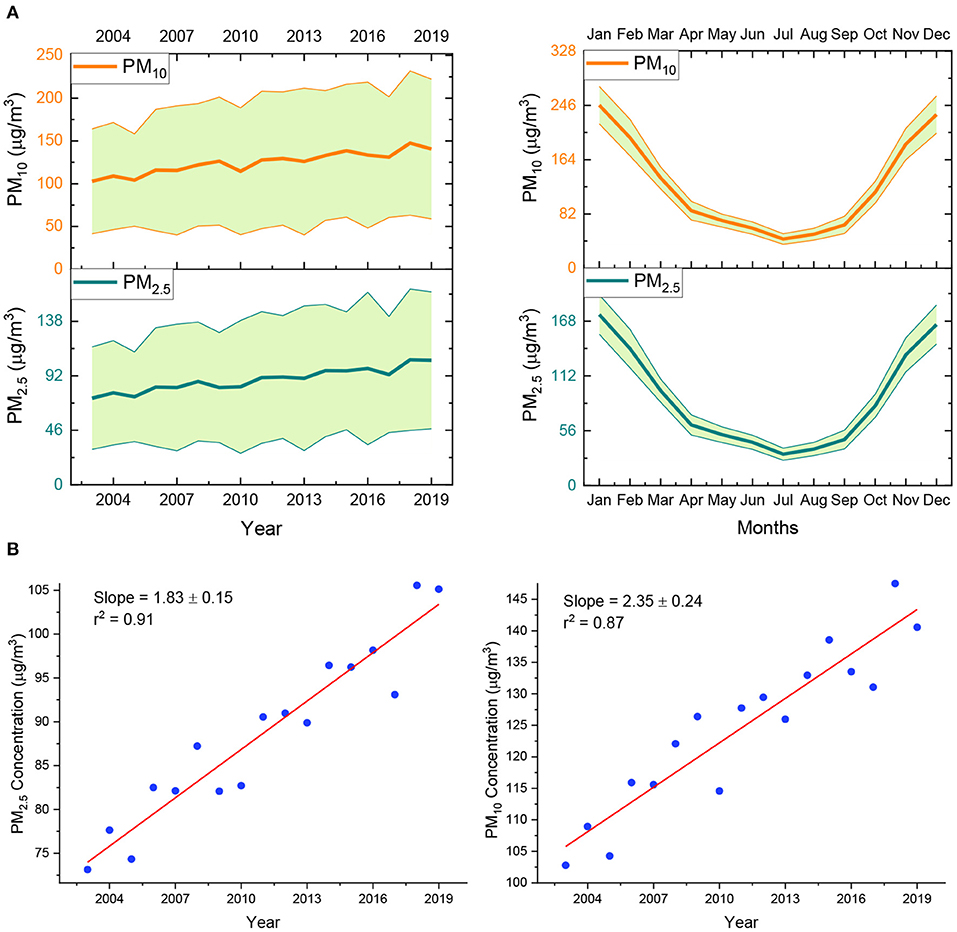
Figure 3. Yearly and monthly trends (A) of particulate matters (PM2.5 and PM10) and the long-term evolution of PM2.5 and PM10 (B) for 2003–2019 (the shaded regions represent the standard deviations).
Monthly variations were identical for the PMs with the highest values observed in winter (November–February) and the lowest in monsoon (June–August). Previous studies also supported such seasonality of PMs with the highest values being associated with the dry season compared to the wet season (Rana et al., 2016; Rahman et al., 2020).
Gaseous Pollutants' Trends in Dhaka
Trace gases CO, O3, NO2, and SO2 showed yearly concentrations of 0.69 ± 0.06 ppm, 51.42 ± 1.82 ppb, 14.87 ± 2.45 ppb, and 8.76 ± 2.07 ppb, respectively for 2003–2019. Normal distribution was observed for all the trace gases over the studied period (Supplementary Figure 1). NO2 and SO2 were below the annual national guideline values set by DoE. Yearly trends of CO, O3, NO2, and SO2 showed slopes of 0.01 ± 0.002 ppm/year, 0.13 ± 0.09 ppb/year, 0.47 ± 0.03 ppb/year, and 0.40 ± 0.02 ppb/year for the studied period. One-way ANOVA showed that the trends of the trace gases were statistically significant (p < 0.05) except for O3 (Figure 4). Rahman M. M. et al. (2019) showed similar significant positive trends for SO2 and CO in Dhaka, Bangladesh for 2013–2017.
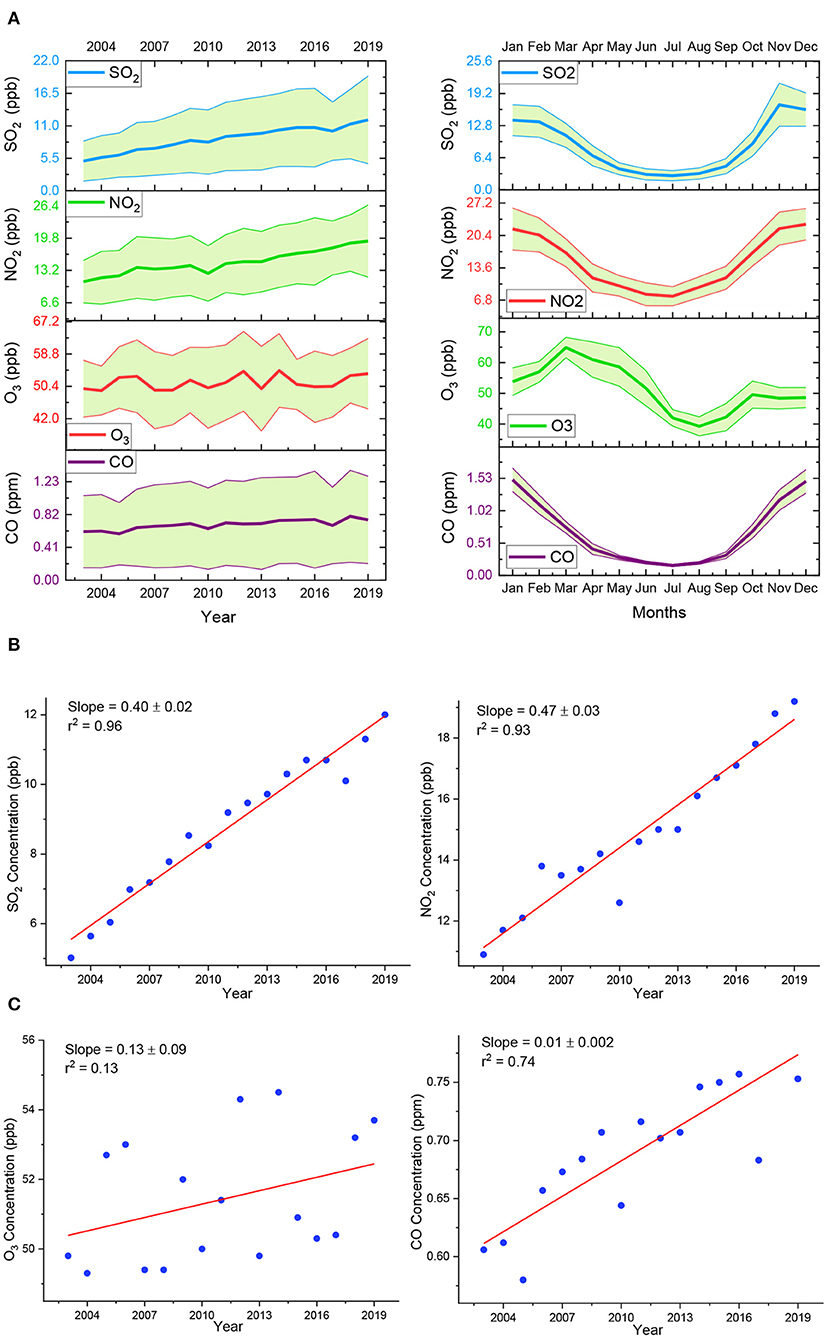
Figure 4. Yearly and monthly trends (A) of the gases (SO2, NO2, O3, and CO) and the long-term evolution of SO2, NO2, (B) O3, and CO (C) for 2003–2019 (the shaded regions represent the standard deviations).
Monthly observations showed that CO, NO2, and SO2 followed an almost similar pattern over the year with the highest values in winter (November–February) and the lowest in monsoon (June–August). On the contrary, O3 showed the maximum values in March–May and the minimum in July–September. The seasonal trends of ozone in Dhaka differed from those of other contaminants, which all exhibited distinct seasonal variation with a peak in the winter and a trough in the monsoon (Rahman M. M. et al., 2019).
Meteorological Parameters' Trends in Dhaka
The air quality of an urban area is heavily influenced by meteorological factors (Rahman M. S. et al., 2019; Afrin et al., 2021). Long-term trends of the meteorological parameters have been depicted in Figure 5. Surface temperature, pressure, and relative humidity showed yearly values of 25.99 ± 0.750°C, 1006.46 ± 0.54 hPa, and 71.30 ± 1.36%, respectively, over the studied period. Monthly variation of temperature showed the highest values in April–June and lowest in December–January. Surface pressure showed opposite monthly variation with the highest values observed in June–July and lowest in December–January. Relative humidity, on the other hand, showed the highest values in June–September and lowest in February–March. Linear regression of the parameters showed slopes of 0.12 ± 0.02°C/year, 0.03 ± 0.02 hPa/year, and 0.11 ± 0.07%/year, respectively, for temperature, pressure, and RH. The one-way ANOVA study revealed that the trends were statistically insignificant except for temperature.
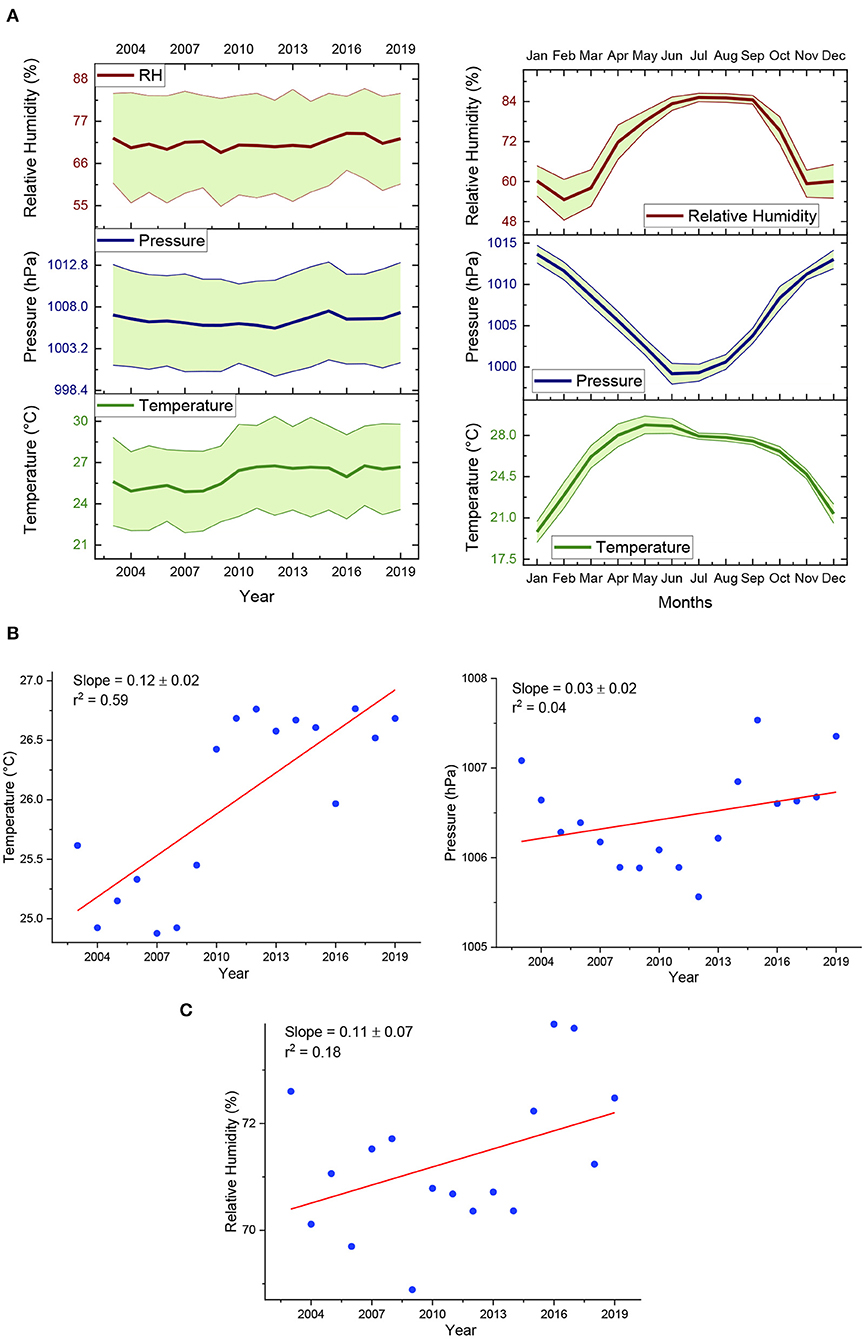
Figure 5. Yearly and monthly trends (A) of temperature, pressure, and relative humidity and the long-term evolution of temperature, pressure, (B) and relative humidity (C) for 2003–2019 (the shaded regions represent the standard deviations).
Correlation Among the Pollutants and Meteorological Parameters
Pearson correlation analyses were employed to quantify relationships among the ambient air pollutants and meteorological parameters as the variables did not violate the normality test (Table 5; Supplementary Figure 1). PM2.5 and PM10 showed significant positive values with PMs, NO2, and SO2. Furthermore, NO2 and SO2 also showed significant positive values with each other, PMs, and CO. The significant positive correlations among the air pollutants suggested similar production pathways for them.
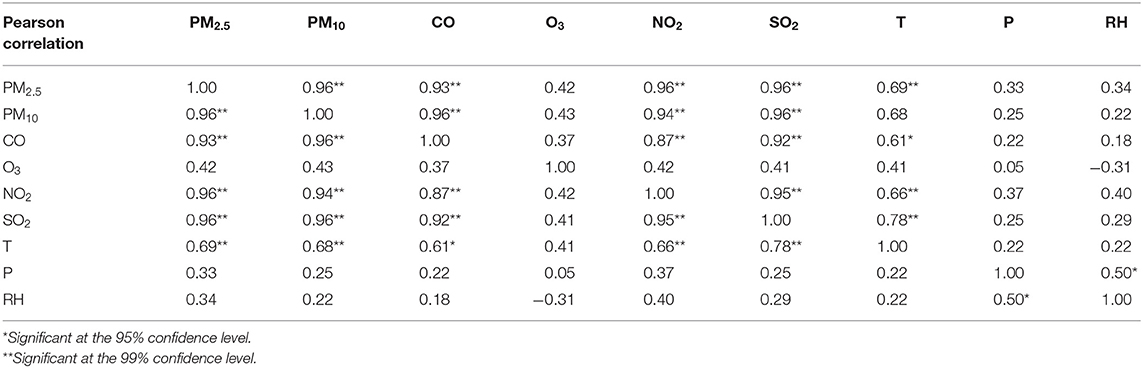
Table 5. Pearson correlation coefficients among the air pollutants (PM2.5, PM10, CO, NO2, and SO2) and the meteorological parameters (surface temperature, pressure, and relative humidity).
Previous studies also investigated associations among the air pollutants and meteorological parameters. Ozone had non-significant associations with the other pollutants, according to Rahman M. M. et al. (2019). Although not significant, O3 has a positive association with PMs, CO, NO2 (R2 > 0.37), suggesting that the other pollutants could play important roles in the development of O3. Besides, O3 showed a negative correlation with RH but a positive correlation with temperature.
In the case of the meteorological parameters, temperature showed significantly positive correlations with all the pollutants but not in the case of the other meteorological variables. Surface pressure did not show any significant association with any other variables other than RH. Lastly, RH did not exhibit any significant connection with the variables. However, according to Afrin et al. (2021), air temperature, wind speed, and wind direction could account for more than 90% of PM2.5 variability.
Source Apportionment
Principal Component Analysis
PCA was employed on the monthly datasets of the air pollutants. The datasets were auto-scaled before the analysis. This indicates that the column mean has been subtracted from each digit of the dataset, and the result has been separated by the column standard deviation. Figure 6 shows the bi-plots obtained by the PCA carried out on the datasets. It reports both scores and loadings in the same PC1 vs. PC2 graph. PC1 and PC2 loadings account for 98.88% of the total variance of the pollutants. PC1 carries 45.20, 45.20, 45.02, 44.09, and 44.09% of explained variance for PM2.5, PM10, CO, NO2, and SO2 and PC2 carries 55.32 and 55.25% of explained variance for NO2 and SO2 (Figure 6). The two PMs, CO, NO2, and SO2 have the same characteristics as they are distributed evenly along the x-axis, which accounts for almost ~45% of the variance. Thereby, PC1 can be inferred to be vehicular emissions according to the component variance test, whereas NO2 and SO2 showed similar discrimination along the y-axis, contributing ~55% of these variables. Thus, PC2 can be attributed to the industrial emissions enriched in NO2 and SO2. Furthermore, the variables are almost evenly distributed in the positive and negative regions of PC1 and PC2. It indicates that the chemical composition of the studied compounds has similar concentrations in the case of these two variables.
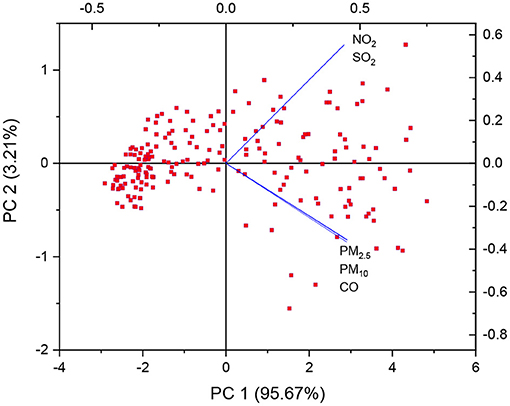
Figure 6. PCA bi-plot of the monthly datasets of the pollutants (PM2.5, PM10, CO, NO2, and SO2).
PMF Modeling
The factor profiles of all the sources of the air pollutants (PM2.5, PM10, CO, NO2, and SO2) are depicted in Supplementary Figure 2. Four factors were attributed to be the estimated sources contributing to the aforementioned ambient air pollutants. The percent contributions of the factors influencing the air pollutants have been depicted in Figure 7.
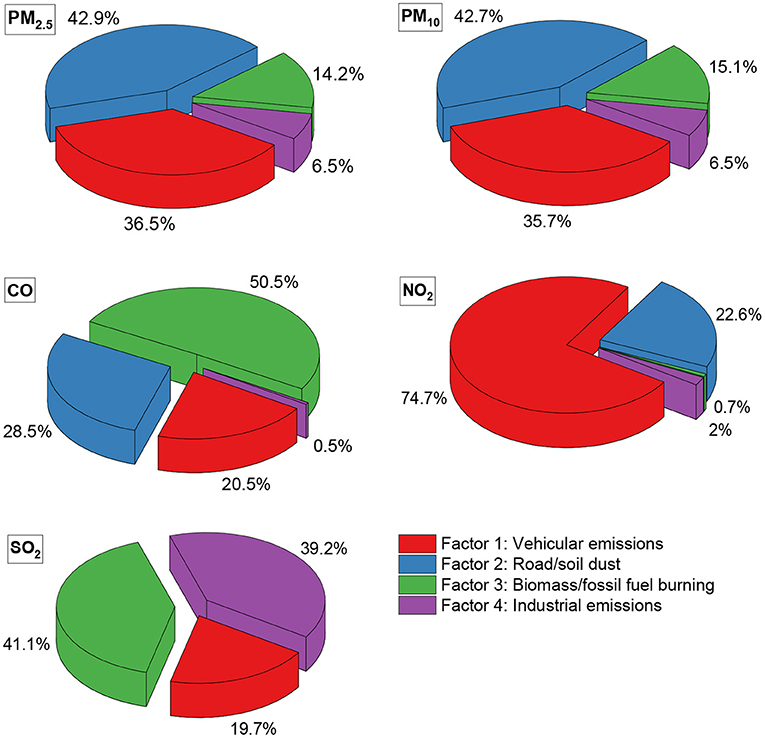
Figure 7. Contribution of the sources to the air pollutants (PM2.5, PM10, CO, NO2, and SO2) obtained from PMF modeling.
Factor 1: The first factor is characterized by the highest contribution (74.7%) to NO2 followed by the signature of 36.5, 35.7, 20.5, and 19.7%, respectively, for PM2.5, PM10, CO, and SO2 (Figure 7). Thus, factor 1 is inferred to be vehicular emissions as these pollutants were significantly correlated, suggesting similar sources. Despite the fact that many buses in Dhaka have been converted to CNG engines, heavy-duty trucks that are limited continue to run on diesel between the hours of 10 p.m. and 6 a.m. However, the lower contribution to SO2 suggests that the conversion of most light-duty vehicles and buses to CNG has resulted in significant reductions in light-duty vehicle and bus emissions (Begum and Hopke, 2018).
Factor 2: PM loadings appeared to be highest (42.9 and 42.7%, respectively, for PM2.5 and PM10) for factor 2 with contributions of 28.5 and 22.5% for CO and NO2, suggesting that this factor can be inferred to be road/soil dust or secondary sources. Elemental characterization is needed to correctly attribute this factor to the ambient pollutants. Spearman correlation revealed that PMs have significant correlations with CO, NO2, and SO2 that further affirms traces of the same factor in the case of these pollutants. Due to both anthropogenic and natural sources, dust has been identified as a significant contributor to measure PM2.5 in Dhaka, accounting for 11% of total PM2.5 (Weagle et al., 2018).
Factor 3: This factor is characterized by the highest contribution (50.5%) to CO with significant contributions to SO2. PMs are also influenced by this factor with loadings of 14.2 and 15.1%, respectively, for PM2.5 and PM10. This factor can be inferred to biomass or fossil fuel burning as suggested by the high loading of CO. Ommi et al. (2017) reported the transboundary influence of biomass burning from the IGP to be an important factor in Dhaka, mainly arising from the preparations of the lands through field burning. Furthermore, Salam et al. (2008) reported that the higher concentration of SO2 in the city center is possibly due to the high content of sulfur in fossil fuel.
Factor 4: Factor 4 can be inferred as industrial emissions as it contributes mostly (39.2%) to SO2 with traces in the case of CO (0.5%) and NO2 (2.0%). Both PM2.5 and PM10 are associated with about 6.5% for factor 2. The high contribution to SO2 from this factor signifies the effect of industrialization centered in Dhaka, which has increased exponentially in the last decade or so. The commercial areas of Dhaka had the highest SO2 concentration (76.8 μg/m3) (Salam et al., 2008).
However, since sources of atmospheric pollutants are extremely complicated and diverse, particularly for unorganized emission sources, ambient pollutants cannot be apportioned perfectly through receptor modeling, and some factors remain unknown (Liu et al., 2016, 2017). Furthermore, the dearth of element analysis for metals limits the capability of receptor models to categorize all the sources present regionally. Moreover, the transboundary effects are also significant for ambient regional pollutants in Bangladesh that might affect the ambient air quality as reported by many previous studies (Rana et al., 2016; Rahman et al., 2020).
Human Health Risk Assessment
The HQ was calculated for three age groups (infant, child, and adult) in acute and intermediate level exposures, which have been reported in Figure 8. At the acute exposure level, no pollutants showed an adverse effect, that is, HQ values were below 1, for any of the age groups. On the other hand, the HQ values posed significant health risk (HQ > 1) at the chronic exposure level for infants and children while no antagonistic health effects risk (HQ < 1) were observed for the pollutants in the case of the adults. Among the pollutants, PM2.5 (1.81 × 10³ ± 2.00 × 10²) and O3 (1.03 × 10³ ± 3.65 × 101) were observed to be the most harmful pollutants affecting the studied age groups, especially the children. In terms of the studied age groups, children were observed to be affected far more than infants and adults at the chronic exposure level. These results suggest that the air pollutants affect all age groups significantly when considered at the chronic level with children being the worst sufferers while negligible effects are observed at the acute level. Owing to a variety of factors, including their comparatively higher level of air inhalation (a resting infant's air consumption per weight unit is double that of an adult), their immune system and lungs not being fully grown, children are the population most impaired by indoor air contamination (Lina Thabethe et al., 2014). Morakinyo et al. also demonstrated a similar adverse impact on children when compared to other age groups. These results essentially signify that low breathing heights could be the main factor along with other indoor and outdoor air pollution sources behind this phenomenon in children who are particularly susceptible to ground-level pollution. In a study conducted at a local school, Sharma and Kumar (2020) found that in-pram babies are exposed to up to 44% higher fine particle concentrations than adults. Table 6 lists some more previous studies comparing health risks associated with ambient air pollutants.
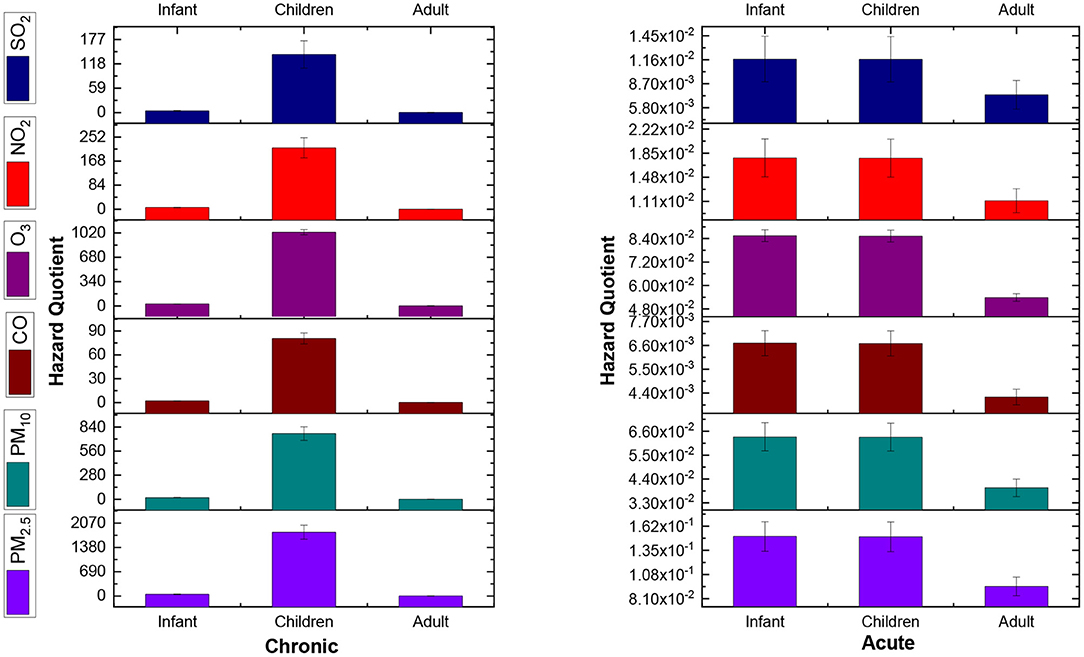
Figure 8. Hazard quotients associated with the ambient pollutants (PM2.5, PM10, CO, O3, NO2, and SO2) for infants, children, and adults in chronic and acute levels.
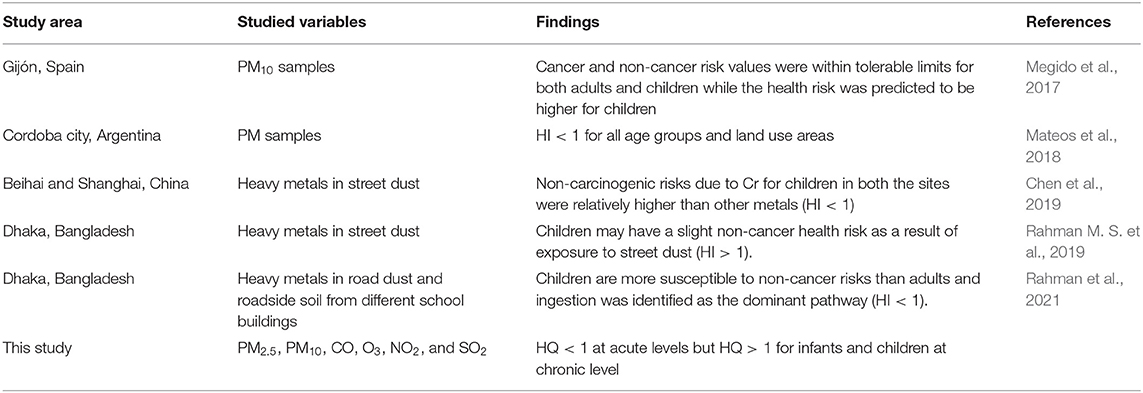
Table 6. Human health risk assessments in various samples and sites according to the USEPA method.
Discussion and Future Implications
The air pollutant (PM2.5, PM10, CO, NO2, and SO2) concentrations except O3 showed significantly increasing trends in this study. However, an analysis of Dhaka's air quality over two decades (1996–2015) found that the city's air quality has remained constant over the last decade, despite increased economic development and the number of sources such as passenger cars and brick kilns (Begum and Hopke, 2018). On the contrary, a recent analysis found that PM2.5 concentrations in Dhaka decreased slightly (statistically non-significant) from 2013 to 2017, but fine PM concentrations remained elevated and presumably continue to affect human health (Rahman M. M. et al., 2019). Therefore, there remains a need for further study into long-term seasonal cycles, as well as their assessment concerning actions taken by relevant bodies.
Among the meteorological parameters, the temperature seemed to significantly correlate with the air pollutants (PM2.5, PM10, CO, NO2, and SO2) except O3. However, according to Afrin et al. (2021), meteorological factors (temperature, relative humidity, etc.) account for about 57% and 35% of the variations in PM2.5 and PM2.5−10 concentrations, respectively, implying that the finer PM fraction is affected more by meteorology than the coarser fraction. Thus, more quantitative approaches to how climate change affects urban air quality may provide further insights into contaminant reduction policies.
This study estimates four probable main sources contributing to the emission of the six air pollutants in Dhaka, Bangladesh, which are vehicular emissions, road/soil dust, biomass burning, and industrial emissions. In a study on NOx pollution from vehicular emissions in Dhaka, Iqbal et al. (2019) found that, while a critical urban health ecosystem already exists, the current pattern of vehicular expansion, combined with current vehicle technology and on-road traffic management systems, may soon lead to an unbecoming situation. As a result of these findings, the vehicular management system in Dhaka should be strengthened, and further research into PMs, CO, and NOx emissions caused by them should be conducted. Furthermore, according to Rahman M. S. et al. (2019), ingestion of dust particles increases the risk of heavy metals (Cr, Cd) in children and adults in Dhaka City, where children were facing a possible health risk. Dhaka is witnessing several infrastructure schemes, such as the Dhaka Metrorail Project and the Dhaka Elevated Expressway Project, which have raised the risk of dust contamination by a factor of many. So, heavy metal contamination caused by dust particles should be investigated more thoroughly in Dhaka, as it poses a threat to children in particular. Rahman et al. (2020) suggested that air pollution in Dhaka is influenced by both local and transboundary sources, but biomass-related PM2.5 was found to be the most prevalent during cycles of crop-burning in the IGP. Thus, biomass burning is a major contributor to Dhaka's poor air quality, necessitating further study into the source's impact and mitigation. Finally, the rising pattern of SO2 in this study and previous studies (Rahman M. M. et al., 2019) indicates that industrial operations in Dhaka, especially brick kiln operations and high sulfur diesel usages, are still contributing significantly to detrimental air quality. More studies encompassing the brick kiln operations and other industrial usage of high sulfur materials in Dhaka are also of paramount importance. Begum et al. (2011) described vehicular emissions and emissions from brick kilns as the two major sources of air pollution in Dhaka and stated that the government of Bangladesh is exploring various measures to minimize emissions from those sources through the adoption of regional policies. However, the pollutant patterns in this study indicate that effective implementation of such measures is still scarce in Dhaka, Bangladesh.
Conclusion
In this study, monthly ambient concentrations of the air pollutants (PM2.5, PM10, CO, O3, NO2, and SO2) and meteorological data (temperature, surface pressure, and relative humidity) were utilized to explore long-term variations of these parameters and their association with each other. Long-term trends of the ambient pollutants were observed to be increasing significantly in the one-way ANOVA test except for surface ozone while the meteorological parameters showed no significant trends over the studied period. Pearson correlation studies revealed that the ambient pollutants were significantly (CI > 95%) correlated with each other, suggesting probably the same sources. The PCA bi-plot revealed that the PMs and CO demonstrated similar variance while NO2 and SO2 followed an analogous pattern. However, four factors emerged as estimated sources of the pollutants in PMF receptor modeling, which were vehicular emissions, road/soil dust, biomass burning, and industrial emissions. PMs were dominated (~42%) by the road/soil dust along with emissions from vehicles. Biomass burning played a major role in CO (50.5%) and SO2 (41.1%) production while industrial emissions were another prominent factor (39.2%) in the case of SO2. On the contrary, NO2 was identified to be mainly emitted from vehicular emissions (74.7%).
Health risk assessment of the pollutants for three age groups (infant, child, and adult) in acute level exposures indicated no adverse effect (HQ < 1) for any of the age groups. On the other hand, the HQ values posed significant health risk (HQ > 1) at the chronic exposure level for infants and children while no antagonistic health effects risk (HQ < 1) were observed for the pollutants in the case of the adults.
This study reveals that the implementation of CNG wheelers in 2003 might have reduced Pb emissions in megacity Dhaka, but vehicular emissions along with road dust, biomass burning, and industrial emissions remain the most prominent sources that have a significant hazard risk on children and infants particularly. However, since most studies have focused on Dhaka, there is still room to assess long-term possible health risks and the effect of climate variables on air quality at the divisional and district levels in Bangladesh.
Data Availability Statement
The raw data supporting the conclusions of this article will be made available by the authors, without undue reservation.
Author Contributions
All authors listed have made a substantial, direct and intellectual contribution to the work, and approved it for publication.
Conflict of Interest
The authors declare that the research was conducted in the absence of any commercial or financial relationships that could be construed as a potential conflict of interest.
The reviewer SH declared a past co-authorship with the authors FJ and AS to the handling Editor.
Acknowledgments
The authors acknowledge the support of the Department of Chemistry, University of Dhaka, Bangladesh. The authors also acknowledge the Department of Environment (DoE), Bangladesh, and the EAC4 (ECMWF Atmospheric Composition Reanalysis 4) global reanalysis dataset produced by the European Centre for Medium-Range Weather Forecasts (ECMWF) from Copernicus Atmosphere Monitoring Service (CAMS) for data support.
Supplementary Material
The Supplementary Material for this article can be found online at: https://www.frontiersin.org/articles/10.3389/frsc.2021.681759/full#supplementary-material
References
Afrin, S., Islam, M. M., and Ahmed, T. (2021). A meteorology based particulate matter prediction model for megacity dhaka. Aerosol. Air. Qual. Res. 21, 1–14. doi: 10.4209/aaqr.2020.07.0371
AirVisual (2018). 2018 World Air Quality Report PM2.5 Ranking. Available online at: https://www.iqair.com/us/blog/press-releases/IQAir-AirVisual-2018-World-Air-Quality-Report-Reveals-Worlds-Most-Polluted-Cities (accessed March 15).
Amato, F., Alastuey, A., Karanasiou, A., Lucarelli, F., and AirVisual (2020). 2020 World Air Quality Report PM2.5 Ranking. Available online at: https://www.iqair.com/us/blog/press-releases/IQAir-AirVisual-2020-World-Air-Quality-Report-Reveals-Worlds-Most-Polluted-Cities (accessed March 15).
Begum, B. A., Biswas, S. K., and Hopke, P. K. (2011). Key issues in controlling air pollutants in Dhaka, Bangladesh. Atmos. Environ. 45, 7705–7713. doi: 10.1016/j.atmosenv.2010.10.022
Begum, B. A., and Hopke, P. K. (2018). Ambient air quality in dhaka bangladesh over two decades: impacts of policy on air quality. Aerosol. Air Qual. Res. 18, 1910–1920. doi: 10.4209/aaqr.2017.11.0465
Begum, B. A., and Hopke, P. K. (2019). Identification of sources from chemical characterization of fine particulate matter and assessment of ambient air quality in Dhaka, Bangladesh. Aerosol. Air Qual. Res. 19, 118–128. doi: 10.4209/aaqr.2017.12.0604
Belis, C. A., Karagulian, F., Amato, F., Almeida, M., Artaxo, P., Beddows, D. C. S., et al. (2015). A new methodology to assess the performance and uncertainty of source apportionment models II: the results of two European intercomparison exercises. Atmos. Environ. 123, 240–250. doi: 10.1016/j.atmosenv.2015.10.068
Brown, S. G., Eberly, S., Paatero, P., and Norris, G. A. (2015). Science of the total environment methods for estimating uncertainty in pmf solutions: examples with ambient air and water quality data and guidance on reporting PMF results. Sci. Total Environ. 518–519, 626–635. doi: 10.1016/j.scitotenv.2015.01.022
Cesari, D., De Benedetto, G. E., Bonasoni, P., Busetto, M., Dinoi, A., Merico, E., et al. (2018). Seasonal variability of PM2.5 and PM10 composition and sources in an urban background site in Southern Italy. Sci. Total Environ. 612, 202–213. doi: 10.1016/j.scitotenv.2017.08.230
Cesari, D., Donateo, A., Conte, M., and Contini, D. (2016). Inter-comparison of source apportionment of PM10 using PMF and CMB in three sites nearby an industrial area in central Italy. Atmos. Res. 182, 282–293. doi: 10.1016/j.atmosres.2016.08.003
Chen, X., Guo, M., Feng, J., Liang, S., Han, D., and Cheng, J. (2019). Characterization and risk assessment of heavy metals in road dust from a developing city with good air quality and from Shanghai. Environ. Sci. Pollut. Res. 26, 11387–11398. doi: 10.1007/s11356-019-04550-2
Cotta, H. H. A., Reisen, V. A., Bondon, P., and Filho, P. R. P. (2020). Identification of redundant air quality monitoring stations using robust principal component analysis. Environ. Model. Assess. 25, 521–530. doi: 10.1007/s10666-020-09717-7
Crilley, L. R., Lucarelli, F., Bloss, W. J., Harrison, R. M., Beddows, D. C., Calzolai, G., et al. (2017). Source apportionment of fine and coarse particles at a roadside and urban background site in London during the 2012 summer ClearfLo campaign. Environ. Pollut. 220, 766–778. doi: 10.1016/j.envpol.2016.06.002
Cusack, M., Pérez, N., Pey, J., Alastuey, A., and Querol, X. (2013). Source apportionment of fine PM and sub-micron particle number concentrations at a regional background site in the western Mediterranean: a 2.5 year study. Atmos. Chem. Phys. 13, 5173–5187. doi: 10.5194/acp-13-5173-2013
Edlund, K. K., Killman, F., Moln, P., Boman, J., Stockfelt, L., and Wichmann, J. (2021). Health risk assessment of PM 2.5 and PM 2.5-bound trace elements in thohoyandou, South Africa. Int. J. Environ. Res. Public Health 18:1359. doi: 10.3390/ijerph18031359
Embiale, A., Chandravanshi, B. S., Zewge, F., and Sahle-Demessie, E. (2020). Health risk assessment of total volatile organic compounds, particulate matters and trace elements in PM10 in typical living rooms in Addis Ababa, Ethiopia. Int. J. Environ. Anal. Chem. doi: 10.1080/03067319.2020.1814266. [Epub ahead of print].
Flemming, J., Huijnen, V., Arteta, J., Bechtold, P., Beljaars, A., Blechschmidt, A. M., et al. (2015). Tropospheric chemistry in the integrated forecasting system of ECMWF. Geosci. Model Dev. 8, 975–1003. doi: 10.5194/gmd-8-975-2015
Franceschi, F., Cobo, M., and Figueredo, M. (2018). Discovering relationships and forecasting PM10 and PM2.5 concentrations in Bogotá Colombia, using Artificial Neural Networks, Principal Component Analysis, and k-means clustering. Atmos. Pollut. Res. 9, 912–922. doi: 10.1016/j.apr.2018.02.006
Gao, J., Peng, X., Chen, G., Xu, J., Shi, G. L., Zhang, Y. C., et al. (2016). Insights into the chemical characterization and sources of PM2.5 in Beijing at a 1-h time resolution. Sci. Total Environ. 542, 162–171. doi: 10.1016/j.scitotenv.2015.10.082
Gao, S., Zhao, H., Bai, Z., Han, B., Xu, J., Zhao, R., et al. (2020). Combined use of principal component analysis and artificial neural network approach to improve estimates of PM2.5 personal exposure: a case study on older adults. Sci. Total Environ. 726:138533. doi: 10.1016/j.scitotenv.2020.138533
Gurjar, B. R., Jain, A., Sharma, A., Agarwal, A., Gupta, P., Nagpure, A. S., et al. (2010). Human health risks in megacities due to air pollution. Atmos. Environ. 44, 4606–4613. doi: 10.1016/j.atmosenv.2010.08.011
Hauke, J., and Kossowski, T. (2011). Comparison of values of pearson's and spearman's correlation coefficients on the same sets of data. Quaest. Geogr. 30, 87–93. doi: 10.2478/v10117-011-0021-1
Inness, A., Ades, M., Agustí-Panareda, A., Barr, J., Benedictow, A., Blechschmidt, A. M., et al. (2019). The CAMS reanalysis of atmospheric composition. Atmos. Chem. Phys. 19, 3515–3556. doi: 10.5194/acp-19-3515-2019
Iqbal, A., Afroze, S., and Rahman, M. (2019). Probabilistic health risk assessment of vehicular emissions as an urban health indicator in Dhaka City. Sustainability 11:6427. doi: 10.3390/su11226427
Islam, M. M., Sharmin, M., and Ahmed, F. (2020). Predicting air quality of Dhaka and Sylhet divisions in Bangladesh: a time series modeling approach. Air Qual. Atmos. Heal. 13, 607–615. doi: 10.1007/s11869-020-00823-9
Jain, S., Sharma, S. K., Srivastava, M. K., Chaterjee, A., Singh, R. K., Saxena, M., et al. (2019). Source apportionment of PM 10 over three tropical urban atmospheres at indo-gangetic plain of india: an approach using different receptor models. Arch. Environ. Contam. Toxicol. 76, 114–128. doi: 10.1007/s00244-018-0572-4
Jain, S., Sharma, S. K., Vijayan, N., and Mandal, T. K. (2020). Seasonal characteristics of aerosols (PM2.5 and PM10) and their source apportionment using PMF: a four year study over Delhi, India. Environ. Pollut. 262:114337. doi: 10.1016/j.envpol.2020.114337
Jollife, I. T., and Cadima, J. (2016). Principal component analysis: a review and recent developments. Philos. Trans. R. Soc. A Math. Phys. Eng. Sci. 374:20150202. doi: 10.1098/rsta.2015.0202
Landrigan, P. J., Fuller, R., Acosta, N. J. R., Adeyi, O., Arnold, R., Basu, N. N., et al. (2017). The lancet commission on pollution and health. Lancet 391, 462–512. doi: 10.1016/S0140-6736(17)32345-0
Lina Thabethe, N. D., Engelbrecht, J. C., Wright, C. Y., and Oosthuizen, M. A. (2014). Human health risks posed by exposure to PM10 for four life stages in a low socio-economic community in South Africa. Pan Afr. Med. J. 18, 1–12. doi: 10.11604/pamj.2014.18.206.3393
Liu, B., Song, N., Dai, Q., Mei, R., Sui, B., Bi, X., et al. (2016). Chemical composition and source apportionment of ambient PM2.5 during the non-heating period in Taian, China. Atmos. Res. 170, 23–33. doi: 10.1016/j.atmosres.2015.11.002
Liu, B., Yang, J., Yuan, J., Wang, J., Dai, Q., Li, T., et al. (2017). Source apportionment of atmospheric pollutants based on the online data by using PMF and ME2 models at a megacity, China. Atmos. Res. 185, 22–31. doi: 10.1016/j.atmosres.2016.10.023
Liu, D., Deng, Q., Ren, Z., Zhou, Z., Song, Z., Huang, J., et al. (2020). Variation trends and principal component analysis of nitrogen oxide emissions from motor vehicles in Wuhan City from 2012 to 2017. Sci. Total Environ. 704:134987. doi: 10.1016/j.scitotenv.2019.134987
Lu, X., Hong, J., Zhang, L., Cooper, O. R., Schultz, M. G., Xu, X., et al. (2018). Severe surface ozone pollution in china: a global perspective. Environ. Sci. Technol. Lett. 5, 487–494. doi: 10.1021/acs.estlett.8b00366
Manousakas, M., Papaefthymiou, H., Diapouli, E., Migliori, A., Karydas, A. G., Bogdanovic-Radovic, I., et al. (2017). Assessment of PM2.5 sources and their corresponding level of uncertainty in a coastal urban area using EPA PMF 5.0 enhanced diagnostics. Sci. Total Environ. 574, 155–164. doi: 10.1016/j.scitotenv.2016.09.047
Mateos, A. C., Amarillo, A. C., Carreras, H. A., and González, C. M. (2018). Land use and air quality in urban environments : Human health risk assessment due to inhalation of airborne particles. Environ. Res. 161, 370–380. doi: 10.1016/j.envres.2017.11.035
Megido, L., Suárez-peña, B., Negral, L., and Castrillón, L. (2017). Suburban air quality: human health hazard assessment of potentially toxic elements in PM10. Chemosphere 177, 284–291. doi: 10.1016/j.chemosphere.2017.03.009
Morakinyo, O. M., Adebowale, A. S., Mokgobu, M. I., and Mukhola, M. S. (2017). Health risk of inhalation exposure to sub-10 μm particulate matter and gaseous pollutants in an urban-industrial area in South Africa: an ecological study. BMJ Open 7, 1–9. doi: 10.1136/bmjopen-2016-013941
Morakinyo, O. M., Mukhola, M. S., and Mokgobu, M. I. (2021). Health risk analysis of elemental components of an industrially emitted respirable particulate matter in an urban area. Int. J. Environ. Res. Public Health 18:3653. doi: 10.3390/ijerph18073653
Mundackal, A., and Ngole-Jeme, M. V. (2020). Evaluation of indoor and outdoor air quality in university academic buildings and associated health risk. Int. J. Environ. Health Res. (2020). doi: 10.1080/09603123.2020.1828304. [Epub ahead of print].
Nayebare, S. R., Aburizaiza, O. S., Siddique, A., Carpenter, D. O., Hussain, M., Zeb, J., et al. (2018). Ambient air quality in the holy city of Makkah: a source apportionment with elemental enrichment factors (EFs) and factor analysis (PMF). Environ. Pollut. 243, 1791–1801. doi: 10.1016/j.envpol.2018.09.086
OECD (2012). OECD Environmental Outlook to 2050. Available online at: http://www.oecd-ilibrary.org/environment/oecd-environmental-outlook-to-2050_9789264122246-en (accessed March 15).
Ommi, A., Emami, F., Zíková, N., Hopke, P. K., and Begum, B. A. (2017). Trajectory-based models and remote sensing for biomass burning assessment in Bangladesh. Aerosol. Air Qual. Res. 17, 465–475. doi: 10.4209/aaqr.2016.07.0304
Paatero, P., and Tapper, U. (1994). Positive matrix factorization: a non-negative factor model with optimal utilization of error estimates of data values. Environmetrics 5, 111–126. doi: 10.1002/env.3170050203
Padoan, S., Zappi, A., Adam, T., Melucci, D., Gambaro, A., Formenton, G., et al. (2020). Organic molecular markers and source contributions in a polluted municipality of north-east Italy: extended PCA-PMF statistical approach. Environ. Res. 186:109587. doi: 10.1016/j.envres.2020.109587
Piersanti, A., Adani, M., Briganti, G., Cappelletti, A., Ciancarella, L., Cremona, G., et al. (2018). Science of the Total Environment Air quality modeling and inhalation health risk assessment for a new generation coal- fi red power plant in Central Italy. Sci. Total Environ. 644, 884–898. doi: 10.1016/j.scitotenv.2018.06.393
Rahman, M. M., Begum, B. A., Hopke, P. K., Nahar, K., and Thurston, G. D. (2020). Assessing the PM2.5 impact of biomass combustion in megacity Dhaka, Bangladesh. Environ. Pollut. 264, 1–11. doi: 10.1016/j.envpol.2020.114798
Rahman, M. M., Mahamud, S., and Thurston, G. D. (2019). Recent spatial gradients and time trends in Dhaka, Bangladesh, air pollution and their human health implications. J. Air Waste Manag. Assoc. 69, 478–501. doi: 10.1080/10962247.2018.1548388
Rahman, M. S., Khan, M. D. H., Jolly, Y. N., Kabir, J., Akter, S., and Salam, A. (2019). Assessing risk to human health for heavy metal contamination through street dust in the Southeast Asian Megacity: Dhaka, Bangladesh. Sci. Total Environ. 660, 1610–1622. doi: 10.1016/j.scitotenv.2018.12.425
Rahman, M. S., Kumar, S., and Saha, N. (2021). Deciphering the origin of Cu, Pb, and Zn contamination in school dust and soil of Dhaka, a megacity in Bangladesh. Environ. Sci. Pollut. Res. doi: 10.1007/s11356-021-13565-7. [Epub ahead of print].
Rai, R., Zhang, Y., Paudel, B., Li, S., and Khanal, N. R. (2017). A synthesis of studies on land use and land cover dynamics during 1930–2015 in bangladesh. Sustainability 9, 1–20. doi: 10.3390/su9101866
Rana, M. M., Sulaiman, N., Sivertsen, B., Khan, M. F., and Nasreen, S. (2016). Trends in atmospheric particulate matter in Dhaka, Bangladesh, and the vicinity. Environ. Sci. Pollut. Res. 23, 17393–17403. doi: 10.1007/s11356-016-6950-4
Ryou, H., gon Heo, J., and Kim, S. Y. (2018). Source apportionment of PM10 and PM2.5 air pollution, and possible impacts of study characteristics in South Korea. Environ. Pollut. 240, 963–972. doi: 10.1016/j.envpol.2018.03.066
Salam, A., Hossain, T., Siddique, M. N. A., and Shafiqul Alam, A. M. (2008). Characteristics of atmospheric trace gases, particulate matter, and heavy metal pollution in Dhaka, Bangladesh. Air Qual. Atmos. Heal. 1, 101–109. doi: 10.1007/s11869-008-0017-8
Salam, A., Ullah, B., and Islam, S. (2013). Carbonaceous species in total suspended particulate matters at different urban and suburban locations in the Greater Dhaka region, Bangladesh. Air Qual. Atmos. Heal. 11, 925–935. doi: 10.1007/s11869-011-0166-z
Schmale, J., Shindell, D., Von Schneidemesser, E., Chabay, I., and Lawrence, M. (2014). Air pollution: clean up our skies. Nature 515, 335–337. doi: 10.1038/515335a
Sharma, A., and Kumar, P. (2020). Quantification of air pollution exposure to in-pram babies and mitigation strategies. Environ. Int. 139:105671. doi: 10.1016/j.envint.2020.105671
Sharma, S. K., Mandal, T. K., Jain, S., Saraswati Sharma, A., and Saxena, M. (2016a). Source apportionment of PM2.5 in Delhi, India using PMF model. Bull. Environ. Contam. Toxicol. 97, 286–293. doi: 10.1007/s00128-016-1836-1
Sharma, S. K., Mandal, T. K., Srivastava, M. K., Chatterjee, A., Jain, S., Saxena, M., et al. (2016b). Spatio-temporal variation in chemical characteristics of PM10 over Indo Gangetic Plain of India. Environ. Sci. Pollut. Res. 23, 18809–18822. doi: 10.1007/s11356-016-7025-2
Shourav, M. S. A., Shahid, S., Singh, B., Mohsenipour, M., Chung, E. S., and Wang, X. J. (2018). Potential impact of climate change on residential energy consumption in Dhaka City. Environ. Model. Assess. 23, 131–140. doi: 10.1007/s10666-017-9571-5
Silva, R. A., West, J. J., Zhang, Y., Anenberg, S. C., Lamarque, J. F., Shindell, D. T., et al. (2013). Global premature mortality due to anthropogenic outdoor air pollution and the contribution of past climate change. Environ. Res. Lett. 8:034005. doi: 10.1088/1748-9326/8/3/034005
Stocker, T. F., Qin, D., Plattner, G. K., Tignor, M. M. B., Allen, S. K., Boschung, J., et al. (2013). Climate Change 2013 the Physical Science Basis: Working Group I Contribution to the Fifth Assessment Report of the Intergovernmental Panel on Climate Change. Cambridge, New York, NY: Cambridge University Press, 1–1535.
Sun, W., and Sun, J. (2017). Daily PM2.5 concentration prediction based on principal component analysis and LSSVM optimized by cuckoo search algorithm. J. Environ. Manage. 188, 144–152. doi: 10.1016/j.jenvman.2016.12.011
USEPA (1989). Risk Assessment Guidance for Superfund. Volume I Human Health Evaluation Manual (Part A). I 289. Washington, DC: USEPA.
USEPA (2016). Criteria air pollutants. Encycl. Immunotoxicol. 218–218. doi: 10.1007/978-3-642-54596-2_200326
Wadud, Z., and Khan, T. (2013). Air quality and climate impacts due to CNG conversion of motor vehicles in Dhaka, Bangladesh. Environ. Sci. Technol. 47, 13907–13916. doi: 10.1021/es402338b
Weagle, C. L., Snider, G., Li, C., Van Donkelaar, A., Philip, S., Bissonnette, P., et al. (2018). Global sources of fine particulate matter: interpretation of PM2.5 chemical composition observed by SPARTAN using a global chemical transport model. Environ. Sci. Technol. 52, 11670–11681. doi: 10.1021/acs.est.8b01658
WHO (1999). Environmental health criteria 210 principles for the assessment of risks to human health from exposure to chemicals. Geneva: WHO, 76–87.
Williams, M. (2012). Tackling climate change: what is the impact on air pollution? Carbon Manag. 3, 511–519. doi: 10.4155/cmt.12.49
World Health Organization W. (2005). WHO Air Quality Guidelines for Particulate Matter, Ozone, Nitrogen Dioxide and Sulfur Dioxide: Global Update 2005. Geneva: World Health Organization, 1–21.
Keywords: air quality, climate variables, positive matrix factorization, hazard quotient, Kendall and Spearman's correlations, Pearson correlations, principal component analysis
Citation: Pavel MRS, Zaman SU, Jeba F, Islam MS and Salam A (2021) Long-Term (2003–2019) Air Quality, Climate Variables, and Human Health Consequences in Dhaka, Bangladesh. Front. Sustain. Cities 3:681759. doi: 10.3389/frsc.2021.681759
Received: 17 March 2021; Accepted: 26 May 2021;
Published: 19 July 2021.
Edited by:
Jai Prakash, Washington University in St. Louis, United StatesReviewed by:
Sarkawt Hama, University of Surrey, United KingdomAshraf Dewan, Curtin University, Australia
Copyright © 2021 Pavel, Zaman, Jeba, Islam and Salam. This is an open-access article distributed under the terms of the Creative Commons Attribution License (CC BY). The use, distribution or reproduction in other forums is permitted, provided the original author(s) and the copyright owner(s) are credited and that the original publication in this journal is cited, in accordance with accepted academic practice. No use, distribution or reproduction is permitted which does not comply with these terms.
*Correspondence: Abdus Salam, asalam@gmail.com; asalam@du.ac.bd
†These authors have contributed equally to this work and share first authorship