Coping With Crisis: Green Space Use in Helsinki Before and During the COVID-19 Pandemic
 Silviya Korpilo1,2*
  Anna Kajosaari3
  Tiina Rinne3
  Kamyar Hasanzadeh3
  Christopher M. Raymond1,2,4
  Marketta Kyttä3
- 1Ecosystems and Environment Research Program, Faculty of Biological and Environmental Sciences, University of Helsinki, Helsinki, Finland
- 2Helsinki Institute for Sustainability Science (HELSUS), University of Helsinki, Helsinki, Finland
- 3Department of Built Environment, Aalto University, Espoo, Finland
- 4Department of Economics and Management, Faculty of Agriculture and Forestry, University of Helsinki, Helsinki, Finland
The COVID-19 pandemic has encouraged a deeper exploration about how people deal with crisis. This paper presents one of the first pre- and during-pandemic assessments of urban green infrastructure (UGI) use across the same individuals with the aim of better understanding how people's use of different types of urban green and blue spaces changed during the pandemic. A baseline Public Participation GIS survey (N = 1,583 respondents) conducted in August 2018 was followed up in May 2020 (N = 418 identical respondents) during the COVID-19 pandemic in Helsinki, Finland. We found that residents were more likely to visit UGI closer to their home during the pandemic compared with before the pandemic. Patterns of use of UGI were associated with the quality of residential green areas, for example, people sought out forests nearby one's domicile and tended to avoid parks and recreation areas in order to escape the pressures of lockdown, socially distance and avoid overcrowding. However, spatial cluster analyses also revealed that the places mapped by intensive users of natural recreational areas and more outdoor oriented users became more dispersed during the pandemic, suggesting their active search for new types of UGI, including use of agricultural land and residential areas with high tree density cover. Our results further highlighted that some types of UGI such as more distant natural and semi-natural areas and blue spaces serve as critical infrastructure both before and during the pandemic. Natural and semi-natural areas experienced very little change in use. The presented results have implications for how planners design and manage green spaces to enable residents to cope with crises like pandemics into the future.
Introduction
Interaction with both people and nature is essential to humans. Urban green infrastructure (UGI) supports everyday individual and group recreation, physical exercise and mental health (see reviews by Konijnendijk et al., 2013; Kabisch et al., 2015; Collins et al., 2020), including opportunities to cope with urban life through stress reduction (Hartig et al., 2003; Jiang et al., 2014; Ibes et al., 2018) and improved mood (Huynh and Torquati, 2019; Nisbet et al., 2019). The benefits people enjoy from nature may have been even more vital during the COVID-19 pandemic and associated lockdown and social restrictions. Various studies from cities around the world have indicated that physical exercise, spending time outdoors and restoration from increased mental stress, anxiety and feeling of isolation during lockdown, were essential for citizens in order to cope with the crisis (Grima et al., 2020; Lopez et al., 2020; Venter et al., 2020). For example, in a global survey, Pouso et al. (2020) found that while the pandemic detrimentally affected mental health, contact with nature helped people to cope, particularly those subject to extreme lockdown. Urban green spaces also have the potential to mitigate some of the negative health effects of COVID-19 restrictions on mobility and social interaction when combined with social distancing (Kluge et al., 2020), and enhance resilience of urban populations during the pandemic (Samuelsson et al., 2020).
Despite these benefits, there is a lack of clear signals concerning the changes in the importance of green spaces during the pandemic and how this translates into changes in the recreational use of UGI. The most evident and frequently reported change relates to the general increase in green space use (e.g., Derks et al., 2020; Rice et al., 2020). Notably, studies have also identified mixed results in visitation patterns in terms of frequency, activity types, temporal distribution of visits and distances travelled to recreate. A global analysis of urban park visitation highlighted that overall visits increased during the pandemic compared with a baseline before the outbreak, and areas that restricted social contacts were most strongly associated with increased park visitation (Geng et al., 2021). However, some cities faced no restrictions but continued to see marked increases in green space usage. For example, Oslo, Norway, has seen a 291% increase in outdoor recreation activity during the pandemic relative to a three year rolling average for the same days, particularly for pedestrians (walking, running, hiking) and cyclists (Venter et al., 2020). While increases tend to be most marked on remote trails, urban green spaces also increased in pedestrian activity (Venter et al., 2020). Initial Google COVID-19 Community Mobility Reports revealed that while urban park visitation has changed, the nature of change varies across cities (Ritchie et al., 2020). In Bonn, Germany, Derks et al. (2020) found changing patterns in visitation in urban forests with emergence of novel visitors, usage peaks in the afternoons and less clear distinction between weekdays and weekends. Other cities in the US, Israel, Italy, Slovenia and Spain experienced reduced usage of urban green spaces measured as decrease in frequency, duration and distance travelled to recreate (Rice et al., 2020; Ugolini et al., 2020). In the United States, a preliminary survey of access and usage of outdoor spaces during the pandemic showed that respondents significantly reduced their time spent recreating and tended to recreate closer to home, often in a 2 mile radius (Rice et al., 2020). The desire to socially distance was cited as the main reason for changing usage patterns. At the same time, in some large urban areas, residents were willing to travel long distances to access urban natural areas (Derks et al., 2020; Ugolini et al., 2020). Behavior changes were also observed in terms of outdoor activities undertaken with relative increase in some activities (e.g., physical exercise, relaxing and walking) and decrease in others considered risky or non-essential activities (e.g., meeting people or observing nature) (Morse et al., 2020; Ugolini et al., 2020).
In addition to being dependent on the user and activity type, outdoor recreation can be affected by urban density structure (e.g., Baró et al., 2015; Liu, W., et al., 2017) and realized through different spatial patterns situated in and influenced by a specific time and place (Andkjær and Arvidsen, 2015; Korpilo et al., 2018). However, few studies exist that examine changes in outdoor recreation during the COVID-19 pandemic in relation to different green space types. For example, Ugolini et al. (2020) found that some citizens in Spain, Israel and Croatia started using more tree-lined streets and urban gardens as potential refuge during the pandemic. In addition, there is still a lack of understanding of the variations and complexity in use among different user groups. Results from a study in Vermont, the U.S. indicated that although nature plays an important role in coping with crisis, engagement with nature through different activities and perceived importance of these interactions differed among populations (Morse et al., 2020). Activity preferences and values were significantly affected by geographical area, gender, income and employment status. Further, closures of urban parks during the pandemic tended to affect vulnerable groups more than others. Another report from the U.S. showed that stay-at-home orders have affected vulnerable groups who live in highly dense areas more than less vulnerable groups who have access to urban nature close to their homes (Slater et al., 2020). People who live in lower socio-economic areas tend to be more sedentary and face greater issues with access to green spaces (see Spencer et al., 2020 for a review). Also, vulnerable populations tend to contract COVID-19 at higher rates than less vulnerable people (Slater et al., 2020) and are disproportionately dying from the disease (Centers Disease Control Prevention., 2020; Yancy, 2020). In Finland, young adults were more concerned about the effects of the COVID-19 pandemic on their mental well-being, career/studies and economic situation than older people, and females were more concerned about their mental well-being than males (Ranta et al., 2020).
Variation in green space use during the COVID-19 pandemic could be also the result of individual behavior change or it can be influenced by variations in environmental quality. Thus, there is a critical need for research that assesses visitation behavior across the same individuals before and during the pandemic, and its association with urban green space type or quality. In this article, we aim to contribute to the growing amount of empirical studies that examine urban green space use for understanding how residents have coped with the COVID-19 crisis under particular governmental restrictions and socio-ecological contexts. The focus is on UGI because of the diverse social benefits of nature exposure. We present an empirical longitudinal study from Helsinki, Finland, in order to help fill in this important gap. We examine changes in citizens' outdoor recreational behavior before and during the COVID-19 pandemic and how these changes are affected by green space type, socio-demographics and perceived health. We question not only if citizens use different types of green spaces more or less, but also if they use green spaces in new ways. Understanding such emerging behavior can help gain better insight into the complexity of human engagement with nature during pandemics or other abrupt events. This knowledge is also becoming crucial in order to co-design more resilient green spaces and societies in the face of future pandemics. For example, it has recently been argued that the COVID-19 pandemic is changing our relationship with public space and it is projected to initiate changes in temporal and spatial patterns of daily use, potentially leading to new designs, uses and practices in green spaces (Honey-Rosés et al., 2020).
Materials and Methods
Study Area and COVID-19 Pandemic Restrictions During Data Collection
The Helsinki Metropolitan Area (HMA) consists of four independent municipalities, Espoo, Helsinki, Kauniainen and Vantaa (Figure 1). Helsinki is the capital of Finland and forms with its surrounding three cities the capital region with a population of 1.2 million inhabitants (Statistics Finland, 2021).
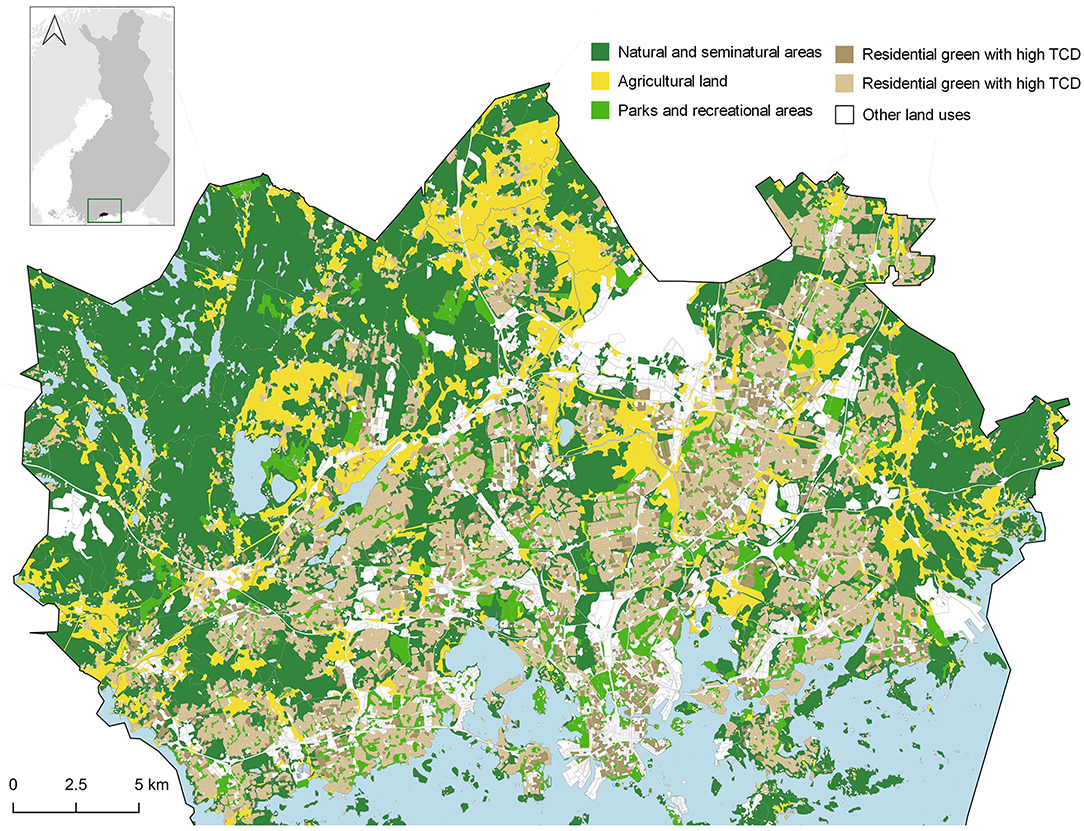
Figure 1. Map of the study area (Helsinki Metropolitan Area) and green infrastructure types used in the analysis.
During spring 2020, the Finnish government started applying recommendations and restrictions based on a special Act in order to delay the spreading of COVID-19. Finnish residents were urged to restrain from social contacts and travel only within Finland for essential reasons, maintain over a 1.5-meter safe distance to other people, wash hands, stay home if sick, follow distant working and avoid using public transport. Finnish government declared emergency powers legislation and public places, such as libraries, swimming halls and other sport places were closed from March 17, 2020 onwards. All public gatherings were limited to 10 persons and the majority of the sport clubs were also shut down. Schools moved to distance education, excluding pre-school education. All 70 and above year old residents were advised to self-quarantine. The borders of the Uusimaa region, which HMA is part of, were closed to restrict travelling between Uusimaa and the rest of the country. Restrictive measures started to deregulate in stages from 14 May 2020 onwards.
Sampling and Survey Design
Data used in this study were collected in two consecutive Public Participation GIS (PPGIS) surveys. The first phase (baseline survey, before the COVID-19 pandemic) took place in August 2018. Participants were recruited using a random sampling technique by sending postal invitations and a postcard reminder to 10,000 adults aged 18–65 years and living permanently in the HMA (data provided by Finnish Population Register Centre). Altogether 1,583 respondents participated in the survey resulting in a response rate of 16%.
Respondents of the baseline survey were then invited to participate in a follow-up survey in May 2020 during the COVID-19 pandemic. Respondents in both the baseline and the follow-up study were requested to map places that they frequently visit in their leisure-time, their primary residential location, questions related to socio-demographics, perceived health and well-being, and the financial and mobility influences of the COVID-19 pandemic (see Supplementary Material; Table 1 for list of all items). Respondents were also asked three open questions regarding the effect of COVID-19 pandemic on their outdoor recreation and active transportation. Overall, 490 respondents completed both the baseline and the follow-up surveys. In this study, respondents who had not mapped their home location and respondents who had relocated between the two surveys were excluded, resulting in a final sample of 418 respondents. These respondents were 57% female compared to 50% of the same age group in the HMA (Statistics Finland, 2021). In addition, respondents with tertiary education were over-represented, comprising 66% of the study respondents compared to 46% in the HMA (Statistics Finland, 2021).
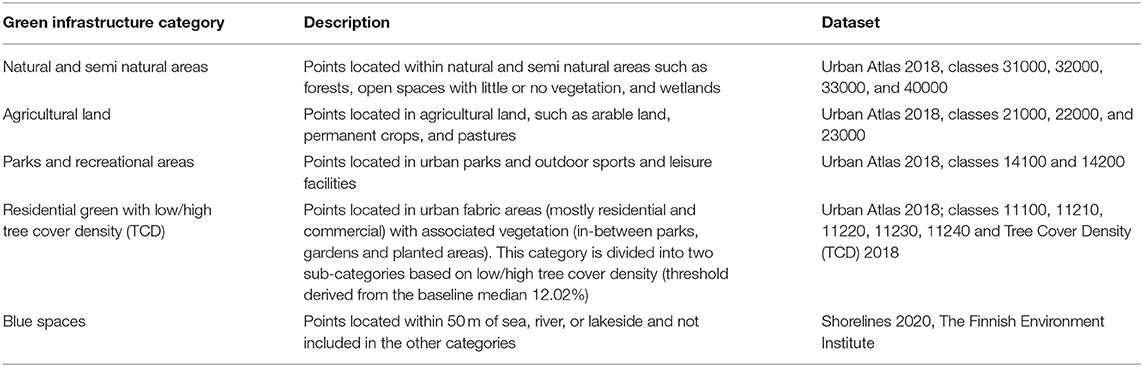
Table 1. Green infrastructure classification used in the analysis.
Analysis
Initial data cleaning of the mapped points was conducted in ArcGIS Pro 2.5. Respondents mapped altogether 2,386 and 1,849 outdoor locations in the baseline (before the COVID-19 pandemic) and follow-up (during the COVID-19 pandemic) survey respectively. Points located outside HMA were excluded from the analysis (150 at baseline or 6.3% and 146 at follow-up = 7.8%). Then, data analysis was performed in three steps: overall spatial trends in changes in outdoor behavior, group-specific trends in changes in outdoor behavior and analysis of the qualitative data.
Analysis of Overall Spatial Trends
First, we examined changes in recreational behavior of all respondents (before and during the pandemic) including:
1) Change in use of green/blue spaces by examining the distribution of outdoor recreational points on different types of UGI
2) Change in network distance of recreational points to one's home in relation to UGI type.
To analyses change in green/blue space use, we classified the point data according to the urban green infrastructure type they are located in. The UGI classification included several categories adapted from Pauleit et al. (2019): Natural and semi-natural areas, Agricultural land, Parks and recreational areas, Residential green with low/high tree cover density (TCD), and Blue spaces (see Figure 1; Table 1). All categories were based on ready-made available datasets from Urban Atlas 2018 (EEA, 2021) and the Finnish Environmental Institute (2020) except the Residential green with low/high tree cover density (TCD), which was created to investigate in more detail the role of different types of residential green spaces during the COVID-19 pandemic. This category was derived using the Urban Atlas land use and Tree Cover Density data. From the Urban Atlas land use data, we extracted the “Urban Fabric” land use category, which includes polygons of urban areas with dominant residential use or inner-city areas with central business district and residential use. Furthermore, we used the TCD data, which is a raster product providing information on the proportional tree crown coverage per 10 * 10 m raster. We chose all the tree cover raster cells with value higher than zero and finally calculated the share of these raster cells within each Urban Fabric polygon. This category was then divided into two sub-categories of Residential green with low/high tree cover density (TCD) based on the 12.01% median value. Visual inspection of the data confirmed this threshold to be appropriate for the analysis since it was able to differentiate between residential green spaces with low vegetation and tree cover (e.g., street trees, urban gardens, grass lawns and other low vegetation spaces between and around residential areas) and larger nearby forests around apartment building-dominant residential areas (in Finnish “metsälähiö”), which are typical for Helsinki's peri-urban structure.
We further calculated frequencies of mapped points per UGI type and mean distances of mapped points to one's home using Network Distance Analysis in ArcGIS Pro. Euclidean distance from each point to the nearest road network (using the ArcGIS online HERE map as network data) was calculated and added to the measured network distances as a snap distance correction. Then, non-parametric Mann-Whitney U test in SPSS was used to compare frequencies of mapped points in UGI type and the network distances of mapped points to home between the baseline and follow-up surveys.
Analysis of Group-Specific Trends
As a next step, we explored if respondents can be grouped according to the above changes in recreational behavior using a K-means clustering analysis on the standardized values of change variables (see Supplementary Material; Table 2). The initial number of clusters (k = 2) was visually determined using a plot of WSS-vs.-k (Within-Cluster-Sum of Squared Errors (WSS) for different values of k). Other values of k were also tried in the clustering analysis and the k = 2 was verified as an appropriate number of clusters (i.e., groups of respondents). Following the identification of the two clusters (hereafter named as “groups”), we used Mann-Witney U tests to analyses differences in the mapping activity (i.e., number of mapped points) between the two groups and Wilcoxon signed-rank tests to analyses how this mapping activity changed before and during the COVID-19 pandemic. We also tested for differences between the two groups according to changes in the number of mapped points in the different types of green/blue spaces and the distance of these points to one's home using One-way ANOVA.
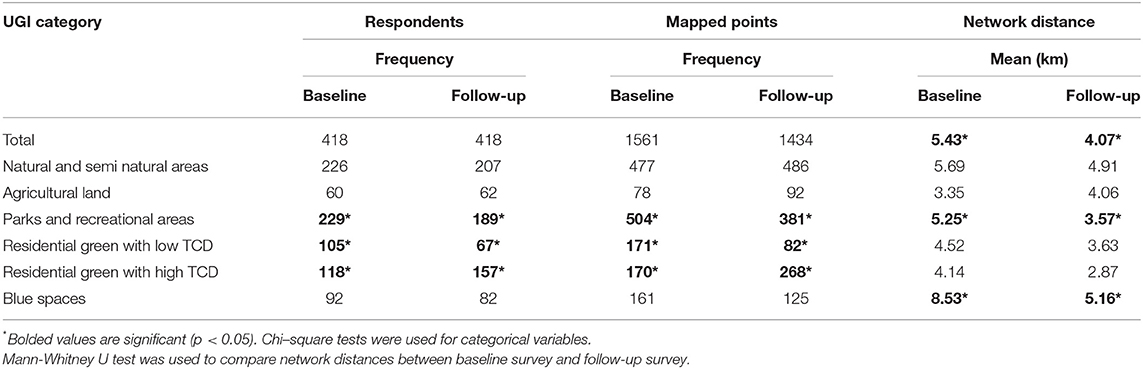
Table 2. Changes in distribution of mapped outdoor points and distances of mapped points to ones' home between baseline survey (before the COVID-19 pandemic) and follow-up survey (during the COVID-19 pandemic).
We then used a N-1 Chi-squared test (Campbell, 2007) to examine how the two groups differ in terms of a variety of individual variables gathered in the PPGIS survey. These included a number of socio-demographic variables: age, gender, income, occupation, education, household type, car ownership and a number of situational variables: personal finances affected by COVID-19, being in quarantine, distance working, stated physical activity and perceived mental and physical health. We also tested if there are significant differences between the urban zone types at place of residence for respondents in the two clusters. The urban zone layer was derived from the classification provided by Finnish Environment Institute (YKR). This dataset includes a 250 × 250 m grid based classification that divides urban regions into zones according to their location in the urban form (e.g., in relation to the center), and travel-relevant variables, population characteristics, public transportation supply, building stock, and jobs (Söderström et al., 2015). Classes include: car zone, public transport zone, intensive public transport zone, fringe of central pedestrian zone, pedestrian zone, and center or sub center. Mann-Whitney U tests were used to assess median differences in perceived health outcomes between the two groups at baseline (before the COVID-19 pandemic) and follow-up (during the COVID-19 pandemic) and Wilcoxon signed rank tests—to identify median changes in health outcomes between baseline and follow-up for each group.
As a last step, we implemented a density-based clustering method in ArcGIS Pro to analyses and visualize differences in the spatial distribution of mapped places for outdoor recreation between the two groups of respondents. This method spatially locates areas where respondents had mapped the highest density of places (i.e., clusters), while showing trends in dispersion of all other points that do not fall within these clusters (Muñoz et al., 2019). To identify the clusters, a defined distance (DBSCAN) algorithm provided by ArcGIS Pro was used, which found clusters of points that are in close proximity based on a search distance of 500 m and a minimum number of 10 points per cluster. The search radius was selected based on the mean Euclidean distance between all points and a heuristic approach of testing different distances that provide the optimal visual representation.
Qualitative Data Analysis
To gain further insight into the reasons why some changes in outdoor recreation have occurred during the pandemic, we further analyzed the three open questions included in the survey: “Has the COVID-19 pandemic affected your leisure-time physical activity? If so, how, and why?,” “Has the COVID-19 pandemic affected your use of active transportation? If so, how, and why? and “Has the COVID-19 pandemic affected the way you perceived or use you near-by-green and nature areas? If so, how, and why?”. The majority of respondents, 308 out of 490 (62.9%) answered the two open questions by giving some information how their use of green spaces had changed during the COVID-19 pandemic. Using thematic analysis (Corbin and Strauss, 2008), we analyzed and classified the responses to these three open questions into the following categories:
1) Changed frequency of use: (Increased use/Use stayed the same level/Decreased use)
2) Changed relationships with other users (Avoid other people in green spaces/Meet people in green spaces)
3) Changed ways of use (Explore new types of green spaces/New recreational experiences).
We further compared the two identified groups from the K-means cluster analysis (see Analysis of group-specific trends) according to responses in these three categories (changed frequency of use, changed relationships with others and changed ways of use) and then tested for significant differences using a Chi-squared test.
Results
Overall Changes in Outdoor Behavior Before and During the COVID-19 Pandemic
Several general trends in changes of recreational behavior during the COVID-19 pandemic could be observed among all survey respondents (Table 2). First, there was a significant decrease in distance of recreational points to one's home from 5.43 to 4.07 km (p < 0.001). Decrease in distances were found for all UGI categories suggesting that respondents were recreating in areas closer to home during the pandemic. In addition, use of Parks and recreational areas significantly decreased both in terms of number of mapped points (p = 0.001) and distances travelled (p < 0.001). The travelling distances to Blue spaces also decreased significantly (p < 0.001). Strong preferences for residential green areas with high TCD (i.e., nearby forests) were indicated by a significant increase of mapped points during the pandemic (p < 0.001). To the contrary, respondents mapped a significantly lower number of points in residential green areas with low TCD (p < 0.001).
Group-Specific Changes in Outdoor Behavior
The K-means clustering analysis (based on the place variables as in Table 2 in the Supplementary Material) identified two distinct clusters of respondents (hereafter referred as Group 1 and Group 2). Respondents in Group 1 (N = 98) mapped on average 6.45 (SD 4.46) places at baseline and 4.46 (SD 3.93) at follow-up, while Group 2 (N = 332) respondents - on average 2.91 (SD 2.56) at baseline and 3.12 (SD 2.62) at follow-up. Respondents in Group 1 mapped significantly more places than Group 2 both at baseline (U = 7890.50, p < 0.001) and at follow-up (U = 12784.50, p = 0.007). Respondents in Group 1 also mapped significantly fewer places for outdoor recreation at follow-up than at baseline (z = −3.92, p < 0.001), while there was no significant change in the mapping activity of respondents in Group 2 (z = 1.59, p = 0.111).
Group 1 showed high variation and an average decrease in green/blue space use (−0.200 of standardized score), except for Agricultural land and Residential green areas with high TCD. On the contrary, Group 2, which the majority of the respondents fell into, showed low variation and an average increase in green/blue space use (0.061), except for Agricultural land and Residential green areas with high TCD, similar to Group 1 (Figure 2). Results from the One-way ANOVA showed that these changes in recreational behavior between the two groups were significant for all green infrastructure categories, with the exception of residential areas with high TCD (both for number of mapped points and distances travelled) (see Supplementary Material; Table 2). The distance of mapped places in Parks and recreational areas category from respondents' home also did not differ significantly between the two groups (Supplementary Material; Table 2).
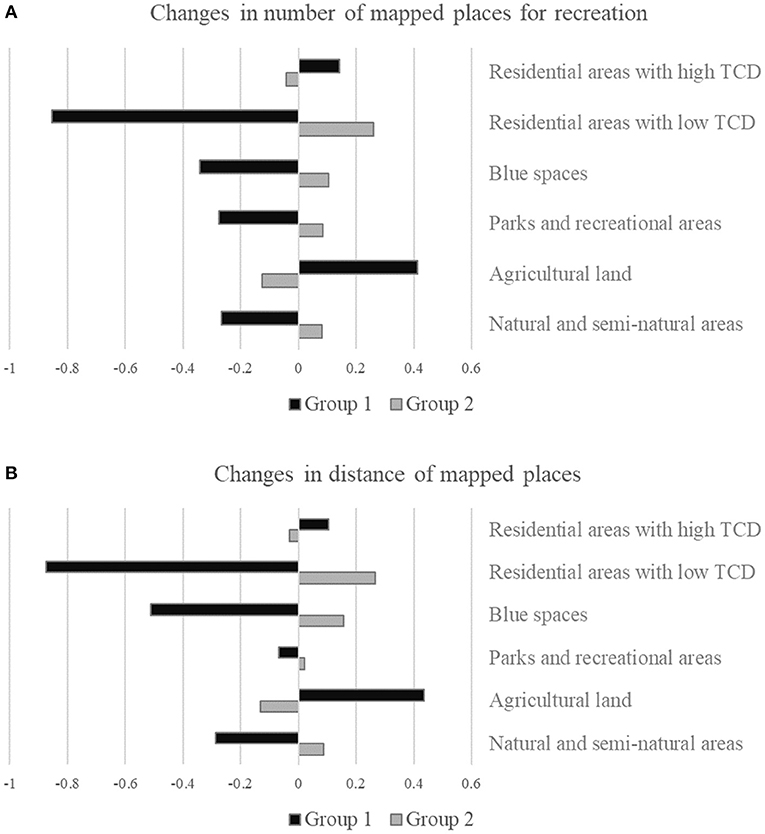
Figure 2. (A) Changes in number of mapped places for outdoor recreation and (B) Changes in mean distances (in meters) of mapped places to one's home per group. X-axis refers to standardized scores of changes, where values <0 show decrease and >0 increase in numbers/distances during the COVID-19 pandemic.
In terms of socio-demographics, significant differences were found between the two groups in relation to several variables: age (30–39 years old = 3.967, p = 0.040; 50–59 years old = 9.463, p = 0.002; 60–66 years old = 4.917, p = 0.026), having children (6.97, p = 0.008), employment (3.811, p = 0.050), physical activity (Baseline) (4.63, p = 0.031), perceived health compared to the other in the same age group (follow-up) and overall physical health (baseline) (see Table 2; Supplementary Material; Table 3 for results for all variables). No statistically significant differences were observed for other socio-demographic variables or the urban zone type around one's domicile (Supplementary Material; Table 3).
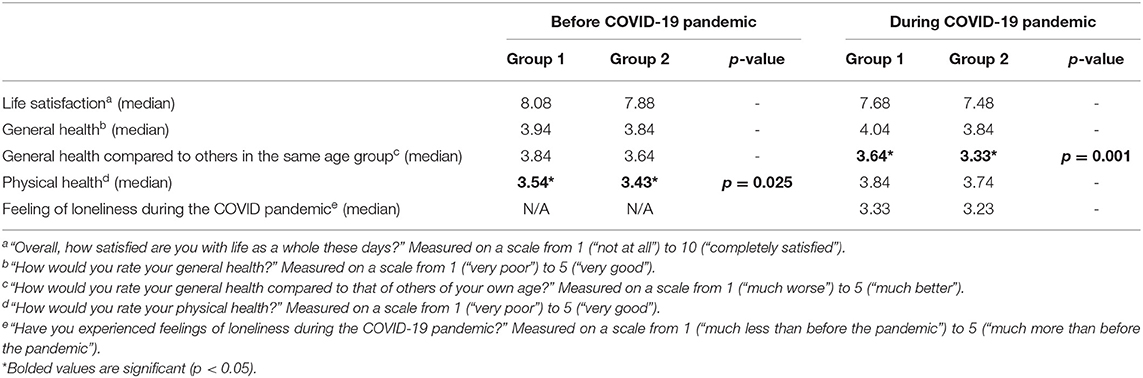
Table 3. Differences in changes of self-reported health variables between the two respondent groups.
Respondents in Group 1 were generally older than those in Group 2 (>50 years old = 51.5%, and 45.6% respectively), had higher proportion of employed individuals (69.4% compared to 58.4% for Group 2), and more often reported to live together with a partner and child/children (37.8 % for Group 1 and 24.4% for Group 2). In addition, respondents in Group 1 had higher median scores in all self-reported health variables both before and during the COVID-19 pandemic (Table 3). Significant differences were observed between self-rated physical health at baseline (U = 10588.50, p = 0.025) and self-rated general health compared to others of the same age at follow-up (U = 10028.00, p = 0.001). For both groups, life satisfaction decreased significantly between baseline and follow-up (Group 1: Z = −2.21, p = 0.027; Group 2: Z = −3.87, p < 0.001). Self-rated physical health decreased significantly for Group 2 (Z = 2.08, p = 0.037).
The density-based spatial clustering illustrated further the differences between the two groups of respondents. Overall, the spatial distribution of mapped recreational places for Group 1 was very dispersed both before and during the pandemic. For Group 1, eight clusters including one middle size cluster (N = 192 points) and seven small size clusters (N = 10–15) were identified based on the spatial data before the pandemic, while the total number of sparse, not clustered points contributed to 66.4% of all data (N = 552). During the pandemic, clustering decreased even further and only two small clusters (N = 11–12 points) were identified, while the number of not clustered points increased to 95.6% of all points (N = 502).
A higher number of density-based clusters were located for Group 2 compared to Group 1. In total 20 clusters of mapped places were identified before the COVID-19 pandemic including one large size (N = 461) and 19 small clusters (N = 10–28), while the number of points not in clusters contributed to 45.8% of all data (N = 643). Similar to Group 1, the spatial data during the pandemic showed higher number of sparse points N = 708 (60.1% of all points), while the number of clusters decreased to 15 including one medium size (N = 210) and 14 small clusters (N = 10–33).
Figure 3 below visualizes the result of the density-based clustering analysis with a close-up view of the central part of Helsinki. Mapped recreational places of Group 1 mostly clustered in the city centre before the COVID-19 pandemic, yet mapping and spatial clustering of places in the city centre decreased during the pandemic. A similar trend can be observed for Group 2 however, the spatial patterns are different. For example, during the COVID-19 pandemic there was more clustering of mapped points in Parks and recreational areas like in Helsinki's Central park (Figure 3). Such increase in use of Parks and recreational areas for respondents in Group 2 was also indicated from the results of the K-means clustering analysis (see Figure 2).
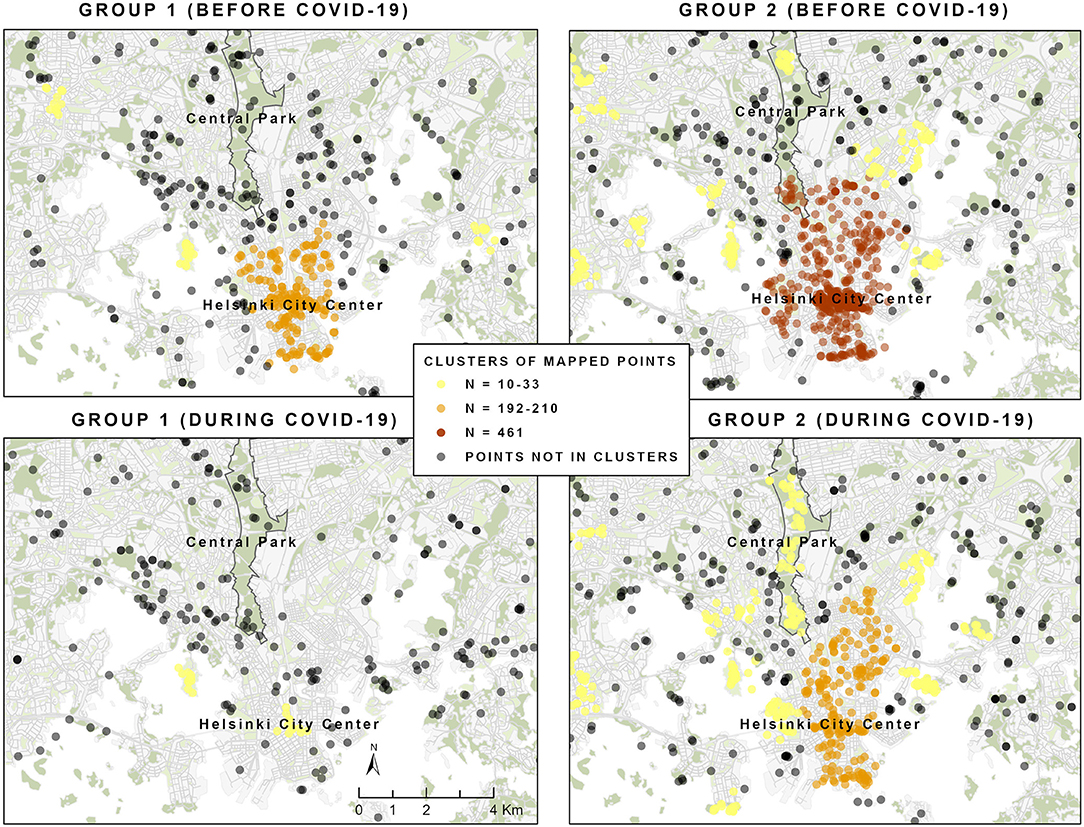
Figure 3. A close up map of Helsinki's city centre showing the density-based clusters of mapped recreational places identified for the two groups of respondents. Different clusters and their sizes are represented by different colours. Points not in clusters refers to the number of sparse points, not part of any clusters.
Stated Reasons for Changes in Outdoor Behavior During the COVID-19 Pandemic
Table 4 summarizes the proportional differences among respondents in Groups 1 and 2 who reported changing use patterns during the pandemic related to the three identified categories (changed frequency of use, changed relationship with other users, changed ways of use). Significant difference was found only for changed ways of use of green spaces. Group 1 was more likely to search for new types of green spaces given that 18.8% of respondents reported this kind of behavior change. This further complements the results of the spatial and cluster analysis that indicated more variation in the types of green space used by Group 1 compared to Group 2 during the pandemic. On the other hand, respondents from Group 2 reported more often (11.0%) to have found new experiences in natural settings during the pandemic.
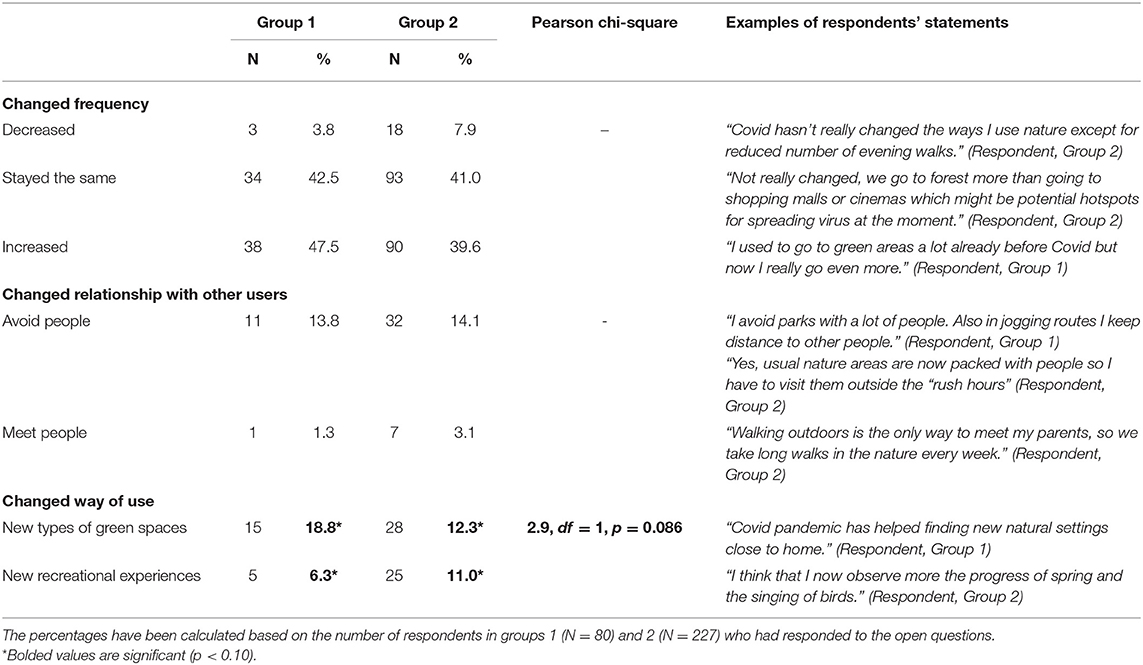
Table 4. Reported changes in green space use among respondents in Group 1 and Group 2.
In addition, the increased importance of nature and especially nearby forests was often mentioned by respondents in both groups. For example, respondents stated:
“Covid pandemic has helped find new natural settings close to home. The importance of nature has also grown, because in addition to home, it is pretty much the only place where you can spend your free time.” (Respondent, Group 1)
“Nearby nature has become more familiar to me and enriched my life.”(Respondent, Group 1)
“Nearby nature gives a lot of strength and it is so calming to walk in nature. I have found many new paths” (Respondent, Group 1)
“I use and follow more intensively the nearby natural environment. I enjoy views from windows and birds singing more than normally.” (Respondent, Group 2)
“I visit almost daily the nearby forest” (Respondent, Group 2)
Discussion
The overarching aim of this paper was to examine how, under particular governmental restrictions and socio-ecological context, residents in the Helsinki Metropolitan Area have coped with the COVID-19 crisis by using different urban green and blue spaces in terms of both distance from domicile and quality of space. The results suggest that residents were more likely to visit UGI closer to their home during the pandemic compared to before the pandemic, complementing previous research (e.g., Rice et al., 2020; Ugolini et al., 2020). However, unlike previous work, we found that patterns of use of UGI were associated with the quality of residential green areas (here measured by tree cover density [TCD]). Residents were more likely to visit residential areas nearby their home with high TCD during the pandemic compared to before the pandemic, highlighting the importance of forests nearby one's domicile to coping behavior. It supports recent wider studies were old-grown, tree-rich parks are used more frequently for experiencing nature while less tree-rich parks are used more for socializing and having barbeques (Kabisch et al., 2021). The qualitative results further suggest that nearby forests become focal points for recovery and escape during pandemics. People also tended to avoid parks and recreation areas in order to escape the pressures of lockdown, ensure social distance and avoid overcrowding that was reported by Finnish media during the pandemic, while also stated by many respondents in our PPGIS survey (Table 4). These findings expand prospect refuge theory which posits that people derive feelings of safety and pleasure from inhabiting environments that offer both views and a sense of enclosure (Appleton, 1984; Millward and Appleton, 1988; Ellard, 2015). This theory has been used in preference studies to justify why nearby nature is commonly found to be more preferred than primary or within refuge nature. In other words, edges are preferred (Ruddell and Hammitt, 1987). In our case, nearby nature, not necessarily edges of forests, are preferred in times of the pandemic.
Our results further highlighted that some types of UGI such as more distant natural/semi-natural areas and blue spaces serve as critical infrastructure both before and during the pandemic. Natural and semi-natural areas experienced very little change in use. This suggests their fundamental role for human well-being both in everyday life (Andkjær and Arvidsen, 2015) and under exceptional circumstances such as the global COVID-19 pandemic (Derks et al., 2020). Similarly, we found no significant difference between the number of mapped places for recreation in or near blue spaces before and during the pandemic. Both before and during the pandemic, the average distance travelled to recreate in/near blue areas was highest among all UGI types (8.55 and 5.16 km respectively), which is in line with previous research by Laatikainen et al. (2015), who found average road network distance (home to mapped places near water) of 6.29 km mapped by 2,151 Helsinki Metropolitan Area citizens. Both of these result highlight the importance of large public blue infrastructure like recreational coastal areas and the willingness of residents to travel to such areas, especially when owning a car (Laatikainen et al., 2015).
A significant strength of this study is the use of a longitudinal dataset capturing changes in UGI use across the same individuals. To analyses individual behavior changes, we developed a unique clustering approach to assess COVID-19 coping behavior and response to crisis, which considers the varying ways of use of UGI, socio-demographic factors, urban zone type and well-being indicators. The identified two groups were associated with a spectrum of differences in coping behavior and socio-demographics. The majority of respondents belonged to Group 2. These green space users showed no significant change in mapping recreational places before and during the COVID-19 pandemic, but started to find new ways to use UGI. Their recreational use was concentrated in popular places in Helsinki (such as the City Centre or Helsinki's Central park), although during the pandemic they also searched for green areas outside of them. The self-rated health of this group decreased during the pandemic.
Group 1 members were older, more likely to be employed and having a partner and children than members of the other group. Respondents in Group 1 mapped clearly more green places both before and after the COVID-19 pandemic. Their perceived health was also higher and it did not decrease during the pandemic. The members of this group were probably more intensive users of natural recreational areas and more outdoor oriented users. It was therefore somewhat surprising to see the number of mapped places of this group decline during the pandemic. The decrease in use might be due to social distancing and search for solitude nature experiences being more important for this group. Although both groups expressed concerns toward other users of UGI, Group 2 also used green areas for socialization. Whether the groups differ in terms of risk tolerance during the pandemic (see Landry et al., 2020) and crowding tolerance (Arnberger and Haider, 2005) would warrant further research.
The mapped recreational places of Group 1 were very spatially dispersed already before the pandemic and this tendency strengthened during the pandemic. This trend together with their active search for new types of green areas suggests a higher flexibility and variation in terms of using different types of UGI e.g., agricultural land and residential green areas with high TCD. Several potential factors may be associated with the higher “coping flexibility” of Group 1. Being generally in better mental and physical health could mean higher resilience to crisis, as supported by wider scholarship on social resilience. Social resilience is used as a way to measure the ability of groups or communities to cope with external stresses and disturbances as a result of social, political and environmental change (see Adger, 2000). Being resilient and having the ability to adapt contributes to positive life choices during the COVID-19 pandemic (Dorado Barbé et al., 2021). When faced with threats, stressors or adversity, resilient people can improve their adaptation and well-being strategies (Luthar et al., 2015).
Limitations and Future Research
Our study has several important limitations. First, in this article, the use of green space is analyzed only through the number of mapped recreational points and the distance of these points to one's home. However, we did not have data on actual time spent, the frequency of visits or the actual use of these places in terms of activity, all of which can contribute to deeper understanding of changes in individual and user group behavior. The lack of such data could also explain some discrepancies in findings between our quantitative and qualitative results. For example, most respondents in Group 1 stated that their frequency of recreational visits stayed the same or increased, while results of the UGI spatial analysis indicated that these respondents mapped significantly less recreational points. A possible explanation could be that people belonging to this group visited less places during the pandemic, but used them more frequently and more intensively.
Although we found no significant difference between the two user groups in terms of the urban zone type they live in, another important factor that is worth further investigation is green space accessibility and its role as a moderator of recreational use during the pandemic especially across different socio-demographic groups (see e.g., Kabisch and Haase, 2014; Kabisch et al., 2016; Kronenberg et al., 2020; Suárez et al., 2020). Future research also needs more longitudinal studies like the one we have presented here, possibly expanding beyond several years after the COVID-19 pandemic in order to examine whether changes in recreational behavior actually sustain, a key point for our own further work in this field.
Implications for UGI Management
The study suggests UGI's role as critical urban infrastructure during the COVID-19 pandemic providing opportunities of recreation, restoration and escape during the pandemic. UGI planning and management should take a nuanced and adaptive approach that caters for the diverse needs, activities and preferences of users that, similar to the two groups in our study, can be identified even in small geographies and among relatively homogenous populations (Morse et al., 2020). This would allow UGI to be better utilized to promote psychological restoration and a level of remoteness or solitude that could remain key priorities in future pandemics, but also to provide opportunities for social interaction and group activities as part of everyday life. Restoration and escape are often associated with spaciousness i.e., the feeling of being and moving in nature without feeling boundaries (e.g., Kaplan and Kaplan, 1989; Van Herzele and Wiedeman, 2003). Spaciousness could be sought for in large open spaces such as agricultural land for some users (Group 1 in this study) and water areas for others (Group 2). Similarly, Kajosaari and Pasanen (2021) found that in the Helsinki Metropolitan Area, restorative experiences took place most often near blue areas and in large (>30 ha) recreational forests. In the light of restrictions on everyday movement, the mental construction of forests as the recovery of agency and control plays an important role in high visitation of forests (Weinbrenner et al., 2021), and these factors may also play a role in higher rates of visitation to areas of high tree cover density.
Spaciousness could be also cognitive i.e., experienced as being away from everyday life (Kaplan and Kaplan, 1989) and forgetting about spatial and temporal limits even in large-treed forests (Grahn, 1991). However, urban fragmentation interrupts the perception of space as a whole and built infrastructure such as tall or large buildings can disrupt continuity in visual perception and the sense of place as a whole (Van Herzele and Wiedeman, 2003). It is therefore crucial from a planning and management perspective to maintain current or establish new corridors to enable both habitat and social connectivity between different types of UGI and blue spaces which are accessible by different user groups.
Accessibility and use of areas with different types of TCD may be influenced by other factors beyond the scope of this study including employment status, basic value orientations, childhood experience in nature, environmental conditions and socialization processes. Therefore, future work would benefit from the development of multi-level models for explaining green area visitation during times of shock, taking account of individual and collective processes that influence behavioral intentions and actual behavior. One option would be to further explore the role of multi-level values on green space visitation (building on van Riper et al., 2019). Another option would be to integrate individual, organizational, and interpersonal/relational factors in models of green space visitation in addition to environmental factors such as proximity of leisure facilities, road connectivity, population density, seasonal changes, altitude and traffic speed (see (Liu H. et al., 2017) for overview; Rice and Pan, 2021). Also, it would be worthwhile repeating this same study by exploring a range of different leisure activities, recognizing that park visitation is influenced by leisure motivation (Kabisch et al., 2021).
Our study also exemplifies the need to monitor the spatial-temporal aspects of recreational use to reconcile conservation of natural resources and high demand for recreation (Korpilo et al., 2018) also in exceptional circumstances such as future pandemics. For example, during the COVID-19 pandemic Helsinki's residents started to use nearby urban forests more than before the pandemic, but they were often perceived as overcrowded. This coupled with the fact that small urban forests generally experience heavy pressure from fragmentation and intense everyday recreational use (Lehvävirta et al., 2014; Korpilo et al., 2017) can exacerbate negative ecological and social impacts such as trampling, creation and spatial dispersion of informal paths, and overcrowding and conflicts among different users (Arnberger and Haider, 2005; Lehvävirta et al., 2014; Santos et al., 2016; Korpilo et al., 2017). Here, a connectivity approach that considers the quantity, quality and spatial organization of UGI and nature access can also play a role in relieving intense use from some areas under specific conditions, while also increasing overall social and ecological resilience in future pandemics (Lopez et al., 2020; Samuelsson et al., 2020).
Data Availability Statement
The original contributions presented in the study are included in the article/Supplementary Material, further inquiries can be directed to the corresponding author.
Ethics Statement
Ethical review and approval was not required for the study on human participants in accordance with the local legislation and institutional requirements. The patients/participants provided their written informed consent to participate in this study.
Author Contributions
SK: conceptualization, formal analysis, methodology, writing—original draft preparation, review, and editing. AK, TR, and MK: data curation, formal analysis, methodology, writing—original draft preparation, and review. CR: conceptualization, writing—original draft preparation, and review. All authors have read and agreed to the published version of the manuscript.
Funding
The datasets used in this study were collected under a Plan-H project funded by Academy of Finland grant number 13297753.
Conflict of Interest
The authors declare that the research was conducted in the absence of any commercial or financial relationships that could be construed as a potential conflict of interest.
Publisher's Note
All claims expressed in this article are solely those of the authors and do not necessarily represent those of their affiliated organizations, or those of the publisher, the editors and the reviewers. Any product that may be evaluated in this article, or claim that may be made by its manufacturer, is not guaranteed or endorsed by the publisher.
Supplementary Material
The Supplementary Material for this article can be found online at: https://www.frontiersin.org/articles/10.3389/frsc.2021.713977/full#supplementary-material
References
Adger, W. N. (2000). Social and ecological resilience: are they related? Prog. Hum. Geogr. 24, 347–364. doi: 10.1191/030913200701540465
Andkjær, S., and Arvidsen, J. (2015). Places for active outdoor recreation - A scoping review. J. Outdoor Recreation Tourism 12, 25–46. doi: 10.1016/j.jort.2015.10.001
Arnberger, A., and Haider, W. (2005). Social effects on crowding preferences of urban forest visitors. Urban For. Urban Green. 3, 125–136. doi: 10.1016/j.ufug.2005.04.002
Baró, F., Haase, D., Gómez-Baggethun, E., and Frantzeskaki, N. (2015). Mismatches between ecosystem services supply and demand in urban areas: a quantitative assessment in five European cities. Ecol. Indic. 55, 146–158. doi: 10.1016/j.ecolind.2015.03.013
Campbell, I. (2007). Chi-squared and Fisher-Irwin tests of two-by-two tables with small sample recommendations. Stat. Med. 26, 3661–3675. doi: 10.1002/sim.2832
Centers Disease Control Prevention. (2020). National Center for Immunization and Respiratory Diseases, Division of Viral Diseases. COVID-19 in Racial and Ethnic Minority Groups. Available online at: https://www.cdc.gov/coronavirus/2019-ncov/need-extra-precautions/racial-ethnic-minorities.html?deliveryName=USCDC_277-DM26455 (accessed June 15, 2020).
Collins, R. M., Spake, R., Brown, K. A., Ogutu, B. O., Smith, D., and Eigenbrod, F. (2020). A systematic map of research exploring the effect of greenspace on mental health. Landsc. Urban Plan. 201:103823. doi: 10.1016/j.landurbplan.2020.103823
Corbin, J., and Strauss, A. (2008). Basics of Qualitative Research, 3rd Edn. Techniques and Procedures for Developing Grounded Theory. Los Angeles: Sage.
Derks, J., Giessen, L., and Winkel, G. (2020). COVID-19-induced visitor boom reveals the importance of forests as critical infrastructure. For. Policy Econ. 118:102253. doi: 10.1016/j.forpol.2020.102253
Dorado Barbé, A., Pérez Viejo, J. M., Rodríguez-Brioso, M., del, M., and Gallardo-Peralta, L. P. (2021). Emotional well-being and resilience during the COVID-19 pandemic: guidelines for social work practice. Int. Soc. Work 64, 279–284. doi: 10.1177/0020872820970622
Ellard, C. (2015). Places of the Heart: Places of the heart: The psychogeography of everyday life. New York, NY: Bellevue Literary Press.
European Environment Agency (EEA) (2021). Urban Atlas LCLU 2018. Available online at: https://land.copernicus.eu/local/urban-atlas/urban-atlas-2018 (accessed February 09, 2021).
Finnish Environmental Institute (SYKE) (2020). Ranta10 - rantaviiva 1:10 000 (Shorelines). Available online at: https://ckan.ymparisto.fi/dataset/%7BC40D8B4A-DC66-4822-AF27-7B382D89C8ED%7D (accessed March 08, 2021).
Geng, D., Christina Innes, J., Wu, W., and Wang, G. (2021). Impacts of COVID-19 pandemic on urban park visitation: a global analysis. J. For. Res. 32, 553–567. doi: 10.1007/s11676-020-01249-w
Grahn, P. (1991). Landscapes in our minds: people's choice of recreative places in towns. Landsc. Res. 16, 11–19. doi: 10.1080/01426399108706326
Grima, N., Corcoran, W., Hill-James, C., Langton, B., Sommer, H., and Fisher, B. (2020). The importance of urban natural areas and urban ecosystem services during the COVID- 19 pandemic. PLoS ONE 15:e0243344. doi: 10.1371/journal.pone.0243344
Hartig, T., Evans, G. W., Jamner, L. D., Davis, D. S., and Gärling, T. (2003). Tracking restoration in natural and urban field settings. J. Environ. Psychol. 23, 109–123. doi: 10.1016/S0272-4944(02)00109-3
Honey-Rosés, J., Anguelovski, I., Chireh, V. K., Daher, C., Konijnendijk van den Bosch, C., Litt, J. S., et al. (2020). The impact of COVID-19 on public space: an early review of the emerging questions – design, perceptions and inequities. Cities Health 1–17. doi: 10.1080/23748834.2020.1780074
Huynh, T., and Torquati, J. C. (2019). Examining connection to nature and mindfulness at promoting psychological well-being. J. Environ. Psychol. 66:101370. doi: 10.1016/j.jenvp.2019.101370
Ibes, D., Hirama, I., and Schuyler, C. (2018). Greenspace ecotherapy interventions: the stress-reduction potential of green micro-breaks integrating nature connection and mind-body skills. Ecopsychology 10, 137–150. doi: 10.1089/eco.2018.0024
Jiang, B., Chang, C. Y., and Sullivan, W. C. (2014). A dose of nature: tree cover, stress reduction, and gender differences. Landsc. Urban Plan. 132, 26–36. doi: 10.1016/j.landurbplan.2014.08.005
Kabisch, N., and Haase, D. (2014). Green justice or just green? Provision of urban green spaces in Berlin, Germany. Landsc. Urban Plan. 122, 129–139. doi: 10.1016/j.landurbplan.2013.11.016
Kabisch, N., Kraemer, R., Masztalerz, O., Hemmerling, J., Püffel, C., and Haase, D. (2021). Impact of summer heat on urban park visitation, perceived health and ecosystem service appreciation. Urban For. Urban Green. 60:127058. doi: 10.1016/j.ufug.2021.127058
Kabisch, N., Qureshi, S., and Haase, D. (2015). Human-environment interactions in urban green spaces - a systematic review of contemporary issues and prospects for future research. Environ. Impact Assess. Rev. 50, 25–34. doi: 10.1016/j.eiar.2014.08.007
Kabisch, N., Strohbach, M., Haase, D., and Kronenberg, J. (2016). Urban green space availability in European cities. Ecol. Indic. 70, 586–596. doi: 10.1016/j.ecolind.2016.02.029
Kajosaari, A., and Pasanen, T. P. (2021). Restorative benefits of everyday green exercise: a spatial approach. Landsc. Urban Plan. 206:103978. doi: 10.1016/j.landurbplan.2020.103978
Kaplan, R., and Kaplan, S. (1989). The Experience of Nature. A Psychological Perspective. Cambridge: Cambridge University Press.
Kluge, H. H. P., Wickramasinghe, K., Rippin, H. L., Mendes, R., Peters, D. H., Kontsevaya, A., et al. (2020). Prevention and control of non-communicable diseases in the COVID-19 response. Lancet 395:10238. doi: 10.1016/S0140-6736(20)31067-9
Konijnendijk, C., Annerstedt, M., Nielsen, A. B., and Maruthaveeran, S. (2013). Benefits of Urban Parks. A Systematic Review: A Report for IFPRA. Copenhagen & Alnarp: IFPRA.
Korpilo, S., Virtanen, T., and Lehvävirta, S. (2017). Smartphone GPS tracking: inexpensive and efficient data collection on recreational movement. Landsc. Urban Plan. 157, 608–617. doi: 10.1016/j.landurbplan.2016.08.005
Korpilo, S., Virtanen, T., Saukkonen, T., and Lehvävirta, S. (2018). More than A to B: Understanding and managing visitor spatial behaviour in urban forests using public participation GIS. J. Environ. Manage. 207, 124–133. doi: 10.1016/j.jenvman.2017.11.020
Kronenberg, J., Haase, A., Łaszkiewicz, E., Antal, A., Baravikova, A., Biernacka, M., et al. (2020). Environmental justice in the context of urban green space availability, accessibility, and attractiveness in postsocialist cities. Cities 106:102862. doi: 10.1016/j.cities.2020.102862
Laatikainen, T., Tenkanen, H., Kyttä, M., and Toivonen, T. (2015). Comparing conventional and PPGIS approaches in measuring equality of access to urban aquatic environments. Landsc. Urban Plan. 144, 22–33. doi: 10.1016/j.landurbplan.2015.08.004
Landry, C. E., Bergstrom, J., Salazar, J., and Turner, D. (2020). How has the COVID-19 pandemic affected outdoor recreation in the U.S.? A revealed preference approach. Applied Economic Perspectives and Policy. 43, 1–15. doi: 10.1002/aepp.13119
Lehvävirta, S., Vilisics, F., Hamberg, L., Malmivaara-lämsä, M., and Kotze, D. J. (2014). Fragmentation and recreational use affect tree regeneration in urban forests. Urban For. Urban Green. 13, 869–877. doi: 10.1016/j.ufug.2014.10.003
Liu, H., Li, F., Xu, L., and Han, B. (2017). The impact of socio-demographic, environmental, and individual factors on urban park visitation in Beijing, China. J. Cleaner Prod. 163, S181–S188. doi: 10.1016/j.jclepro.2015.09.012
Liu, W., Chen, W., and Dong, C. (2017). Spatial decay of recreational services of urban parks: characteristics and influencing factors. Urban For. Urban Green. 25, 130–138. doi: 10.1016/j.ufug.2017.05.004
Lopez, B., Kennedy, C., and Mcphearson, T. (2020). Parks are critical urban infrastructure : perception and use of urban green spaces in NYC during COVID-19. Preprints 2020:2020080620. doi: 10.20944/preprints202008.0620.v2
Luthar, S. S., Crossman, E. J., and Small, P. J. (2015). “Resilience and Adversity,” in Handbook of Child Psychology and Developmental Science, eds R. M. Lerner et al. Hoboken, NJ: John Wiley & Sons, Inc. doi: 10.1002/9781118963418.childpsy307
Millward, R., and Appleton, J. (1988). The experience of landscape. Geogr. J. 154:124. doi: 10.2307/633509
Morse, J. W., Gladkikh, T. M., Hackenburg, D. M., and Gould, R. K. (2020). COVID-19 and human-nature relationships: vermonters' activities in nature and associated nonmaterial values during the pandemic. PLoS ONE 15:e0243697. doi: 10.1371/journal.pone.0243697
Muñoz, L., Hausner, V., Brown, G., Runge, C., and Fauchald, P. (2019). Identifying spatial overlap in the values of locals, domestic- and international tourists to protected areas. Tourism Manage. 71, 259–271. doi: 10.1016/j.tourman.2018.07.015
Nisbet, E. K., Zelenski, J. M., and Grandpierre, Z. (2019). Mindfulness in nature enhances connectedness and mood. Ecopsychology 11, 81–91. doi: 10.1089/eco.2018.0061
Pauleit, S., Ambrose-Oji, B., Andersson, E., Anton, B., Buijs, A., Haase, D., et al. (2019). Advancing urban green infrastructure in Europe: outcomes and reflections from the GREEN SURGE project. Urban For. Urban Green. 40, 4–16. doi: 10.1016/j.ufug.2018.10.006
Pouso, S., Borja, Á., Fleming, L. E., Gómez-Baggethun, E., White, M. P., and Uyarra, M. C. (2020). Contact with blue-green spaces during the COVID-19 pandemic lockdown beneficial for mental health. Sci. Total Environ. 756:143984. doi: 10.1016/j.scitotenv.2020.143984
Ranta, M., Silinskas, G., and Wilska, T. A. (2020). Young adults' personal concerns during the COVID-19 pandemic in Finland: an issue for social concern. Int. J. Sociol. Soc. Policy 40, 1201–1219. doi: 10.1108/IJSSP-07-2020-0267
Rice, W. L., Meyer, C., Lawhon, B., Taff, B. D., Mateer, T., Reigner, N., et al. (2020). The COVID-19 Pandemic is Changing the Way People Recreate Outdoors: Preliminary Report on a National Survey of Outdoor Enthusiasts Amid the COVID-19 Pandemic. SocArXiv. doi: 10.31235/osf.io/prnz9
Rice, W. L., and Pan, B. (2021). Understanding changes in park visitation during the COVID-19 pandemic: A spatial application of big data. Wellbeing Space Society 2:100037. doi: 10.1016/j.wss.2021.100037
Ritchie, H., Ortiz-Ospina, E., Beltekian, D., Mathieu, E., Hasell, J., Macdonald, B., et al. (2020). Parks and outdoor spaces: how did the number of visitors change since the beginning of the pandemic? Available online at: https://ourworldindata.org/grapher/change-visitors-parks-covid (accessed May 17, 2021).
Ruddell, E. J., and Hammitt, W. E. (1987). Prospect refuge theory: a psychological orientation for edge effect in recreation environments. J. Leis. Res. 19, 249–260. doi: 10.1080/00222216.1987.11969696
Samuelsson, K., Barthel, S., Colding, J., Macassa, G., and Giusti, M. (2020). Urban Nature as a Source of Resilience During Social Distancing Amidst the Coronavirus Pandemic. Charlottesville, VA: Center for Open Science. doi: 10.31219/osf.io/3wx5a
Santos, T., Nogueira Mendes, R., and Vasco, A. (2016). Recreational activities in urban parks: Spatial interactions among users. J. Outdoor Recreation Tourism 15, 1–9. doi: 10.1016/j.jort.2016.06.001
Slater, S. J., Christiana, R. W., and Gustat, J. (2020). Recommendations for keeping parks and green space accessible for mental and physical health during COVID-19 and other pandemics. Prevent. Chronic Dis. 17, 1–5. doi: 10.5888/pcd17.200204
Söderström, P., Schulman, H., and Ristimäki, M. (2015). Urban form in the Helsinki and Stockholm city regions - Development of pedestrian, public transport and car zones, Reports of the Finnish Environment Institute 16/2015. Helsinki: Finnish Environment Institute. http://hdl.handle.net/10138/155224 (accessed March 15, 2021).
Spencer, L. H., Lynch, M., Lawrence, C. L., and Edwards, R. T. (2020). A scoping review of how income affects accessing local green space to engage in outdoor physical activity to improve well-being: Implications for post-COVID-19. Int. J. Environ. Res. Public Health 17:9313. doi: 10.3390/ijerph17249313
Statistics Finland (2021). Population Structure. Helsinki: Statistics Finland. http://www.stat.fi/til/vaerak/meta_en.html (accessed April 14, 2021).
Suárez, M., Barton, D. N., Cimburova, Z., Rusch, G. M., Gómez-Baggethun, E., and Onaindia, M. (2020). Environmental justice and outdoor recreation opportunities: A spatially explicit assessment in Oslo metropolitan area, Norway. Environ. Sci. Policy 108, 133–143. doi: 10.1016/j.envsci.2020.03.014
Ugolini, F., Massetti, L., Calaza-Martínez, P., Cariñanos, P., Dobbs, C., Ostoic, S. K., et al. (2020). Effects of the COVID-19 pandemic on the use and perceptions of urban green space: an international exploratory study. Urban For. Urban Green. 56:126888. doi: 10.1016/j.ufug.2020.126888
Van Herzele, A., and Wiedeman, T. (2003). A monitoring tool for the provision for accessible and attractive green spaces. Landsc. Urban Plan. 63, 109–126. doi: 10.1016/S0169-2046(02)00192-5
van Riper, C., Winkler-Schor, S., Foelske, L., Keller, R., Braito, M., Raymond, C., et al. (2019). Integrating multi-level values and pro-environmental behavior in a U.S. protected area. Sustain. Sci. 14, 1395–1408. doi: 10.1007/s11625-019-00677-w
Venter, Z. S., Barton, D., Gundersen, V., Figari, H., and Nowell, M. (2020). Urban nature in a time of crisis: recreational use of green space increases during the COVID-19 outbreak in Oslo, Norway. Environ. Res. Lett. 15:104075. doi: 10.1088/1748-9326/abb396
Weinbrenner, H., Breithut, J., Hebermehl, W., Kaufmann, A., Klinger, T., Palm, T., et al. (2021). “The forest has become our new living room” – the critical importance of urban forests during the COVID-19 pandemic. Front. For. Global Change 4:672909. doi: 10.3389/ffgc.2021.672909
Keywords: urban green spaces (UGS), recreational use, outdoor behavior, COVID-19, Public Participation GIS (PPGIS), coping behavior
Citation: Korpilo S, Kajosaari A, Rinne T, Hasanzadeh K, Raymond CM and Kyttä M (2021) Coping With Crisis: Green Space Use in Helsinki Before and During the COVID-19 Pandemic. Front. Sustain. Cities 3:713977. doi: 10.3389/frsc.2021.713977
Received: 24 May 2021; Accepted: 26 August 2021;
Published: 27 September 2021.
Edited by:
Lindsay Kathleen Campbell, United States Forest Service (USDA), United StatesReviewed by:
Walter Alberto Pengue, National University of General Sarmiento, ArgentinaMałgorzata Kaczyńska, Warsaw University of Life Sciences, Poland
Copyright © 2021 Korpilo, Kajosaari, Rinne, Hasanzadeh, Raymond and Kyttä. This is an open-access article distributed under the terms of the Creative Commons Attribution License (CC BY). The use, distribution or reproduction in other forums is permitted, provided the original author(s) and the copyright owner(s) are credited and that the original publication in this journal is cited, in accordance with accepted academic practice. No use, distribution or reproduction is permitted which does not comply with these terms.
*Correspondence: Silviya Korpilo, silviya.korpilo@helsinki.fi