The climate and ocean risk vulnerability index: Measuring coastal city resilience to inform action
 Tracy Rouleau1*†
  Jack Stuart2†
  Maia Call2 Sally Yozell2
  Nagisa Yoshioka3
  Miko Maekawa3
  Natalie Fiertz2
- 1TBD Economics LLC, Gaithersburg, MD, United States
- 2Environmental Security Program, The Stimson Center, Washington, DC, United States
- 3Ocean Policy Research Institute, Sasakawa Peace Foundation, Tokyo, Japan
Today, coastal cities worldwide are struggling with the complex interaction of environmental threats, economic development, and societal inequity. The acceleration of global climate change, which will impact ocean health, sea level, rainfall patterns, and temperatures, will only further exacerbate the ongoing challenges faced by coastal cities. Coastal cities face interconnected risks that necessitate the use of a data collection and an assessment approach that can assess these impacts through a holistic lens. Risk is the interaction of hazards, exposure, and vulnerability, and while data on hazards and exposure is becoming more widely available, data on the vulnerability of urban coastal populations remains limited. These data gaps are particularly acute for the Global South, where climate change is expected to have the greatest near-term impacts. Policymakers need city-specific data to best understand their levels of risk and engage in effective adaptation planning. This paper introduces the Climate and Ocean Risk Vulnerability Index (CORVI), its conceptual framework, methodology, and protocol. The article also demonstrates the application of CORVI through two pilot projects in Castries, Saint Lucia and Kingston, Jamaica. It concludes with a reflection of lessons learned from the pilot projects, and an assessment of the utility of the structured expert judgement (SEJ) for collecting data and measuring risk in data sparse environments. This paper makes two primary contributions. First it introduces CORVI, a decision support tool that assesses climate risk and resilience in a coastal city. The tool uses the SEJ methodology to display risk scores across 10 risk categories and 94 indicators addressing ecological, financial, and political risk. Second, it demonstrates the use of the SEJ methodology in data sparse environments.
Introduction
Located on the interface between land and sea, coastal cities are at the nexus of climate change impacts and climate adaptation efforts. An estimated 40 percent of the global population lives within 100 km of the coast (McGranahan et al., 2007) and cities are disproportionately located along rivers and coastlines (Grimm et al., 2008). Coastal cities are also vulnerable to current and future climate change impacts (Climate Change, 2014; IPCC, 2014). Sea-level rise (Nicholls et al., 2021), extreme heat (McCarthy et al., 2010), and climate-related disasters (Torabi et al., 2018) pose a direct threat to coastal cities. Moreover, coastal cities face contributing risks that originate outside the city limits, including drought-impacted migration patterns and food prices, as well as the impact of ocean and climate risks on the blue economy, ecosystems, and fisheries. They are also shaped by high degrees of socioeconomic inequality and political marginalization. In this context, it is important to understand how climate change impacts economic, social, and environmental risk (Torabi et al., 2021).
Against this background, various international agreements have named urban climate adaptation as a global priority (Chan and Amling, 2019). For example, adaptation and associated financial targets have been included in the Paris Climate Agreement, the Sustainable Development Goals, and the UN Ocean Decade of Science. Despite this, climate adaptation finance remains limited (Climate Policy Initiative, 2018). This is partly explained by a lack of comparable data and tools which illuminate complex climate change impacts in coastal cities (Le, 2020). Moreover, there is a lack of evidence that national adaptation planning (NAP) is being sufficiently downscaled into subnational planning to address growing climate change risks (United Nations Environment Programme, 2021). While urban climate resilience has become a priority in global fora, the global policy process is driven by national interests, reducing the critical role of “subnational political interests and agendas in demarcating specific sectors and scales of adaptation” (Kythreotis et al., 2020a). Placement of urban climate adaptation planning at the national level effectively limits scientific rigor and policy clarity in the urban context (Sethi et al., 2021), while lack of engagement with local public, private and non-governmental stakeholders can reduce the effectiveness of adaptation actions (Kythreotis et al., 2020a). Finally, there is a disconnect between theory and practice, with urban resilience planning mainly utilized to address specific sectoral issues, rather than to formulate holistic strategies and goals (Tanner et al., 2017).
In this context, this paper seeks to address the question: how can the vulnerability of coastal cities to the impact of climate change be measured? This paper builds on the extensive literature surrounding the vulnerability of coastal cities to climate change and demonstrates how this vulnerability can be systematically measured using the Climate and Ocean Risk Vulnerability Index (CORVI). CORVI is a decision support tool that compares a diverse range of ecological, financial, and political risks connected to climate change, to produce a coastal city risk profile. Overall, this paper makes two contributions. First it introduces CORVI as a method to assess coastal cities' risk and resilience to climate change impacts through City Risk Profiles. Second, it expands the use of structured expert judgment (SEJ) as a method for quantifying risk in data sparse environments.
The paper begins by reviewing the current and future state of coastal cities in the context of climate change and introduces the challenge of measuring climate risk in data sparse environments. It then introduces the CORVI wheel, which displays ecological, financial, and political risk across 10 categories. The categories are, in turn, comprised of 94 indicators.
The second half of the article outlines the research protocol for applying the CORVI tool and demonstrates its application through two coastal cities: Castries, Saint Lucia and Kingston, Jamaica. The findings shed light on defining and categorizing coastal urban risk as the complex interaction of ecological, financial, and political risks, and implications for policy design and formulation. It ends by assessing responses to the application of the CORVI, lessons learned from the pilots, and restates the contribution of CORVI to measuring climate and ocean risk in coastal cities.
Toward a framework to measure climate and ocean risks in coastal cities
Brief overview of current social, environmental, and economic trends in urban coastal areas worldwide
While every coastal city has its own social and political history, demographic conditions, geography, economy, and environmental factors, rapidly urbanizing areas face numerous crosscutting challenges. Over half of the world's population currently lives in an urban area. These areas are where most economic activity and the majority of assets reside (Cohen, 2006; Beall and Fox, 2009). In addition, over 40 percent of the global population lives within 100 km of the coast (Martínez et al., 2007). The rapidity at which coastal cities are urbanizing and the vastness of modern cities is unprecedented in human history (Davis, 2004). So, too, are the scope and magnitude of many of the problems this urban transformation is yielding. Coastal cities today are struggling with the complex and understudied interaction of social inequity, environmental stressors, and the challenges of economic development (Fan et al., 2019).
High rates of urban population growth have led to the expansion of informal settlements in low-lying, flood-prone areas on the outskirts of urban centers (Douglas et al., 2008). The stark contrast between the lifestyles of these urban poor and their affluent counterparts is reflected in the growing global trend of inequity. Access to healthcare, educational opportunities, and similar resources is often limited for these low-income urban residents (Davis, 2004). Beyond that, access to basic amenities like clean water, sanitation, and waste management, is often lacking in these areas (Satterthwaite, 1997).
The social effects of urbanization have a direct impact on the environment (Chen et al., 2016). Improper waste disposal, for example, harms water quality and aquatic systems in and around cities (Gray, 1997) and generally promotes environmental degradation. Further, expansion of the city can result in overharvesting of surrounding forests (Ahrends et al., 2010; Kissinger et al., 2012) and reduction of shared environmental resources (El Banna and Frihy, 2009). The conversion of permeable surfaces into impervious developed areas also worsens the social and economic impact of flooding and climatic extremes (Sherbinin et al., 2007; Chen et al., 2016).
The environmental and social conditions in urban coastal areas are influenced by, and have an influence on, economic development and industry. Nearshore fishing, a common industry and source of food in many urban coastal areas, is harmed by aquatic system degradation (Barbier et al., 2011) causing declines in coastal fish populations and marine biodiversity (Vargas-Fonseca et al., 2016; Todd et al., 2019). Likewise, the coastal tourism industry, a major economic force for many coastal cities, relies upon clean beaches and unpolluted water (Meyer, 2006) and healthy ecosystems.
Projected climate change impacts for coastal cities
The challenges currently faced by coastal cities will only be exacerbated by climate change. For coastal cities, sea level rise is one of the most direct hazards of climate change, though it is certainly not the only hazard. The IPCC estimates that global mean sea levels will rise between 0.29 and 1.1 meters by 2,100 (IPCC, 2019). Sea level rise has the potential to drive coastal erosion, increase flooding from storm surges, and harm people, property, infrastructure, commerce, livelihoods, and coastal ecosystems (Nicholls, 2004; Dossou and Glehouenou-Dossou, 2007; Zanchettin et al., 2007; Pavri, 2009; Carbognin et al., 2010; Hanson et al., 2011). These risks are the greatest for cities with highly developed shorelines. In these cities, a half meter rise in sea level by 2,100 may lead to three times as many people and ten times as many economic assets (e.g., buildings, transport infrastructure, utility infrastructure) being at direct risk from sea level rise (Hanson et al., 2011; Hallegatte et al., 2013).
Along with sea level rise, climate change will have a direct impact on temperatures, precipitation patterns, and extreme weather events. The IPCC recently concluded that it is very likely that global temperatures will rise by 2–5°C by 2100, and that as a consequence of the heat island effect, regional air temperatures may be further elevated in cities (IPCC, 2021). Water scarcity is also projected to increase drastically. Between urban population growth and increased drought, estimates suggest that more than six times as many people are likely to live in cities with perennial potable water shortages by 2050 than do today (McDonald et al., 2011). Furthermore, although it's likely that the global frequency of tropical cyclones will decrease or remain constant in the twentyfirst century, the wind speed and rainfall intensity of these storms will likely increase (IPCC, 2021).
In addition to these direct effects, coastal cities will also face indirect risks from climate change. These indirect risks can be divided into risks from and to the ocean (e.g., fisheries, ecosystems) and risks from inland (e.g., rural to urban migration, food security). Considering ocean risks, the nearshore and offshore fishing industries, often major industries in coastal cities, will be adversely impacted by shifts in both fish stock distribution and abundance driven by ocean warming and acidification (Lam et al., 2016). Such changes adversely affect the income, livelihoods, and food security of marine resource-dependent communities (IPCC, 2019). Many coastal cities also rely on a healthy tourism industry, which is likely to suffer due to climate change implications including loss of waterfront property to sea level rise, increased intensity of coastal storms (Scott et al., 2019) and loss of corals, mangroves, and seagrasses.
Climate events that impair crop health, such as droughts, floods, and extreme heat and cold events, and those that degrade soil quality, such as desertification and soil erosion, are all projected to become more frequent and intense by 2050. These climate impacts are likely to increase instances of global food insecurity by reducing agricultural productivity. Though the socio-political effects are likely highly heterogeneous, evidence suggests that volatility in food prices may cause instability in the developing world (Hendrix and Haggard, 2015). Additionally, the impact to agricultural livelihoods from the implications of climate change including drought and heat stress has the potential to influence rural to urban migration trends, though the relationship between climate stress and migration remains challenging to untangle (Black et al., 2011a,b).
The challenge of measuring climate risks in data-sparse urban environments
As articulated above, it is wellknown that urban coastal areas on aggregate are likely to experience the earliest onset and potentially most severe impacts from climate change. The risks associated with climate change for specific coastal cities, however, are much more difficult to untangle. It is critical that coastal cities understand their multidimensional climate risk to efficiently allocate resources and enact effective adaptation strategies (Ruth, 2010).
Though measuring climate risk would be relatively straightforward if data were available for all relevant factors at a fine spatial scale, this is rarely the case for the risks associated with climate change (Hunt and Paul, 2011). Data on the risks of climate change is rarely available at the city level, and when it does exist, it is often poorly managed and stored in silos that make it difficult to access and use, even for city government officials (Hardoy and Pandiella, 2009). While this is certainly true for environmental and economic data, it is particularly the case for social data. Understanding risk requires understanding vulnerability, and social conditions are a major driver of vulnerability in urban coastal cities. Without data at the appropriate geographic scale, decision-makers are often left with the choice of either waiting for greater data availability, or attempting to downscale national level data, neither of which are ideal solutions for effective climate change adaptation.
In addition to data not being available at sufficiently fine spatial scales, it can be difficult for decision-makers to develop a holistic understanding of climate risk for their city when they are drawing their data and insights from many disparate sources (Bhave et al., 2016). Though this is always a challenge, it is particularly challenging in coastal cities, where the ocean intersects with the land in the urban context. Decision-makers in coastal cities need a methodology that enables them to consider the climate risks of all three of these dimensions to develop a cohesive portrait of climate risk for their city.
Structured expert judgement (SEJ) is a technique used to quantify risk in data sparse environments. Through structured interviews and surveys, as well as a series of weighting procedures to ensure data is representative, the SEJ methodology allows researchers to quantify topics that might otherwise be impossible to study in a systematic fashion (Hemming et al., 2018). As SEJ is often applied to specialized fields where existing datasets are scarce, it is a useful method for analyzing small sample sizes. For example, SEJ has been used to assess the link between climate change and conflict (Mach et al., 2019), the contribution of sea ice to sea level rise (Bamber et al., 2019), and the impact of invasive species on ecosystem services (Schwoerer et al., 2019). However, reviews from Burgman (2004) and Krueger et al. (2012) highlight that informal implementation of SEJ continues to hamper efforts to review and replicate results. Moreover, other weaknesses include the costs and logistics of conducting face-to-face elicitation (Knol et al., 2010), challenges for experts in translating their knowledge into quantiles or Likert scales (Garthwaite et al., 2005), and poorly worded or unclear questions. To address these shortcoming, SEJ protocols should be a repeatable and transparent, with clear phases and steps for implementation (Aspinall, 2010).
Introducing the climate and ocean risk vulnerability index
Given the cross-cutting nature of climate change risk in coastal cities, there is an urgent need to develop an integrated risk assessment through the collection of vulnerability data. By assessing the broad impacts of climate and ocean risks alongside city-level data on vulnerabilities connected to social and environmental systems, CORVI integrates risks that are often viewed in isolation. CORVI is made up of 10 risk categories, grouped under three types of risk: (1) ecological risk, (2) financial risk, and (3) political risk. These 10 categories are comprised of 94 indicators. The categories and indicators were selected through extensive research by the research team, which consists of experts in climate, demography, economics, security, and environmental fields, in consultation with academic and policy experts in climate and ocean risk. A condensed version of the process is presented below.
Indicator development
The research team began the process by identifying a central research question: How do climate-related ocean risks impact changes in stability and security? To answer this question, the research team conducted an extensive literature review and developed a causal flow diagram, based on a pressure-state-response framework, which links climate-related ocean risks to decreases in stability and security, with these parameters forming the opposite ends of the causal diagram. The research team started by identifying three key biophysical climate-ocean parameters directly related to climate-related ocean risk (see Figure 1). It also reviewed other indices including the Lloyds City Risk Index, Environmental Performance Index, and Ocean Health Index, to assess indicator development in similar projects. The research team then began to develop causal pathways linking those parameters to decreases in stability and security. Research indicates that the unidirectional approach offered by causal chains is not conducive to a better understanding of the complex processes that impact climate risk and resilience (Niemeijer and Groot, 2008), and that vulnerability assessments are a “key aspect” of anchoring climate change impacts to development planning (Downing et al., 2005). However, causal frameworks remain a useful framework for identifying climate-related indicators (Hambling et al., 2011), and the causal-flow diagram was used as the basis for indicator development.
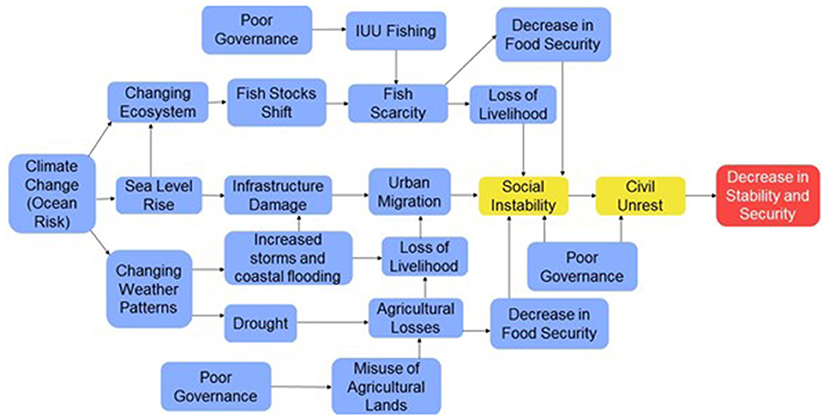
Figure 1. Climate-ocean risk causal flow diagram.
The CORVI definition of climate-related ocean risk adopts the one used by the IPCC AR6 Impacts, Adaptation, and Vulnerability Report. “The risk of climate change impacts can be usefully understood as resulting from dynamic interactions among climate-related hazards, the exposure and vulnerability of affected human and ecological systems, and also responses” (IPCC, 2021). Summarized, risk is a function of hazard, exposure, and vulnerability as expressed below:
The focus of CORVI on the vulnerability aspects of climate and ocean-related risk reflects the relative strength of knowledge on the physical parameters of climate hazards, and the dearth of knowledge on vulnerability of coastal communities to climate change (Ellis, 2014; Di Ruocco et al., 2015; Garschagen and Romero-Lankao, 2015). CORVI intends to reduce the uncertainties surrounding climate and ocean risk and vulnerability and provide potential solutions for local decision makers by combining qualitative and quantitative methods to assess not only the biophysical climate risks but also social, economic, and political vulnerabilities. International development funding organizations and scholars indicate that vulnerability assessments are a key gap in driving effective climate change adaptation and that cross-sectoral assessments should be conceptualized around vulnerable conditions, analytical tools, and stakeholders (Downing et al., 2005; Ziervogel et al., 2014; Ludeña et al., 2015).
Recognizing the interconnectedness of climate-related ocean risks across different spatial and temporal scales, CORVI indicators are focused on assessing vulnerability in coastal cities. They are intended to connect national, or macro-level approaches to on the ground actions by focusing on mid-level vulnerability path of cascading disasters similarly to that described by Pescaroli and Alexander (2016) (see Figure 2, yellow shading). Pescaroli and Alexander (2016) recommended shifting the approach from “risk scenarios based on hazard to vulnerability scenarios based on potential escalation points.” City-level vulnerability information is generally lacking (Ziervogel et al., 2014), and CORVI supports links between national level information, and national and international development efforts, to recommendations for on the ground action. The research team took a broader approach than Pescaroli and Alexander, who focused on socio-technological systems, to also include environmental change and vulnerabilities into the feedback loop to elucidate the linkages between changes in the natural environment and the resulting changes in vulnerability of the communities that depend on it (Adger et al., 2012).
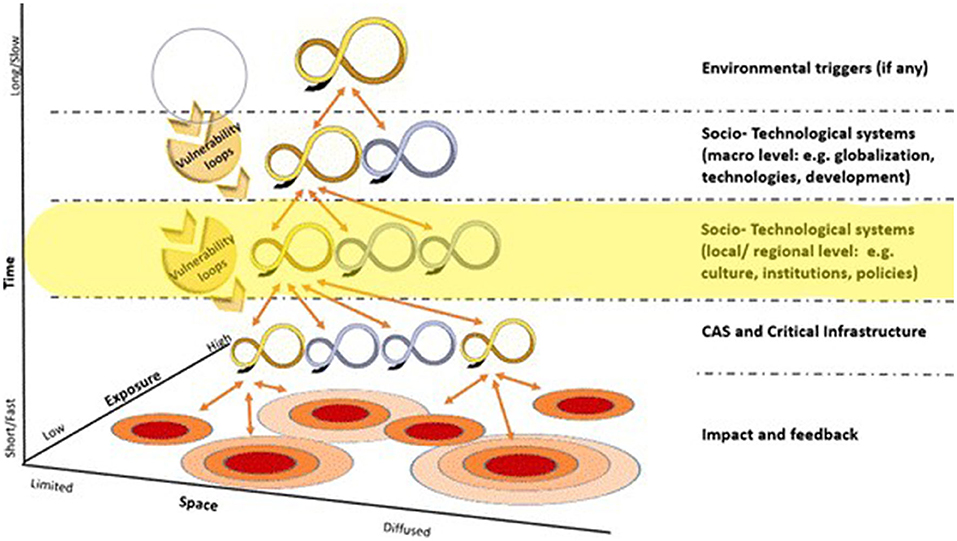
Figure 2. Different scales, feedbacks, and vulnerability paths in cascading disasters. From Pescaroli and Alexander (2016).
To better align with existing data collection efforts, CORVI Indicators were generally drawn from existing pools of indicators used by the United Nations Development Programme (UNDP), the World Bank, the Ocean Health Index, the Environmental Performance Index, the World Travel and Tourism Council, and other international data sets. Indicator selection and categorization was supplemented and vetted with detailed feedback from the project's Climate Advisory Panel. The categories and indicators used in CORVI are presented in Table 1.
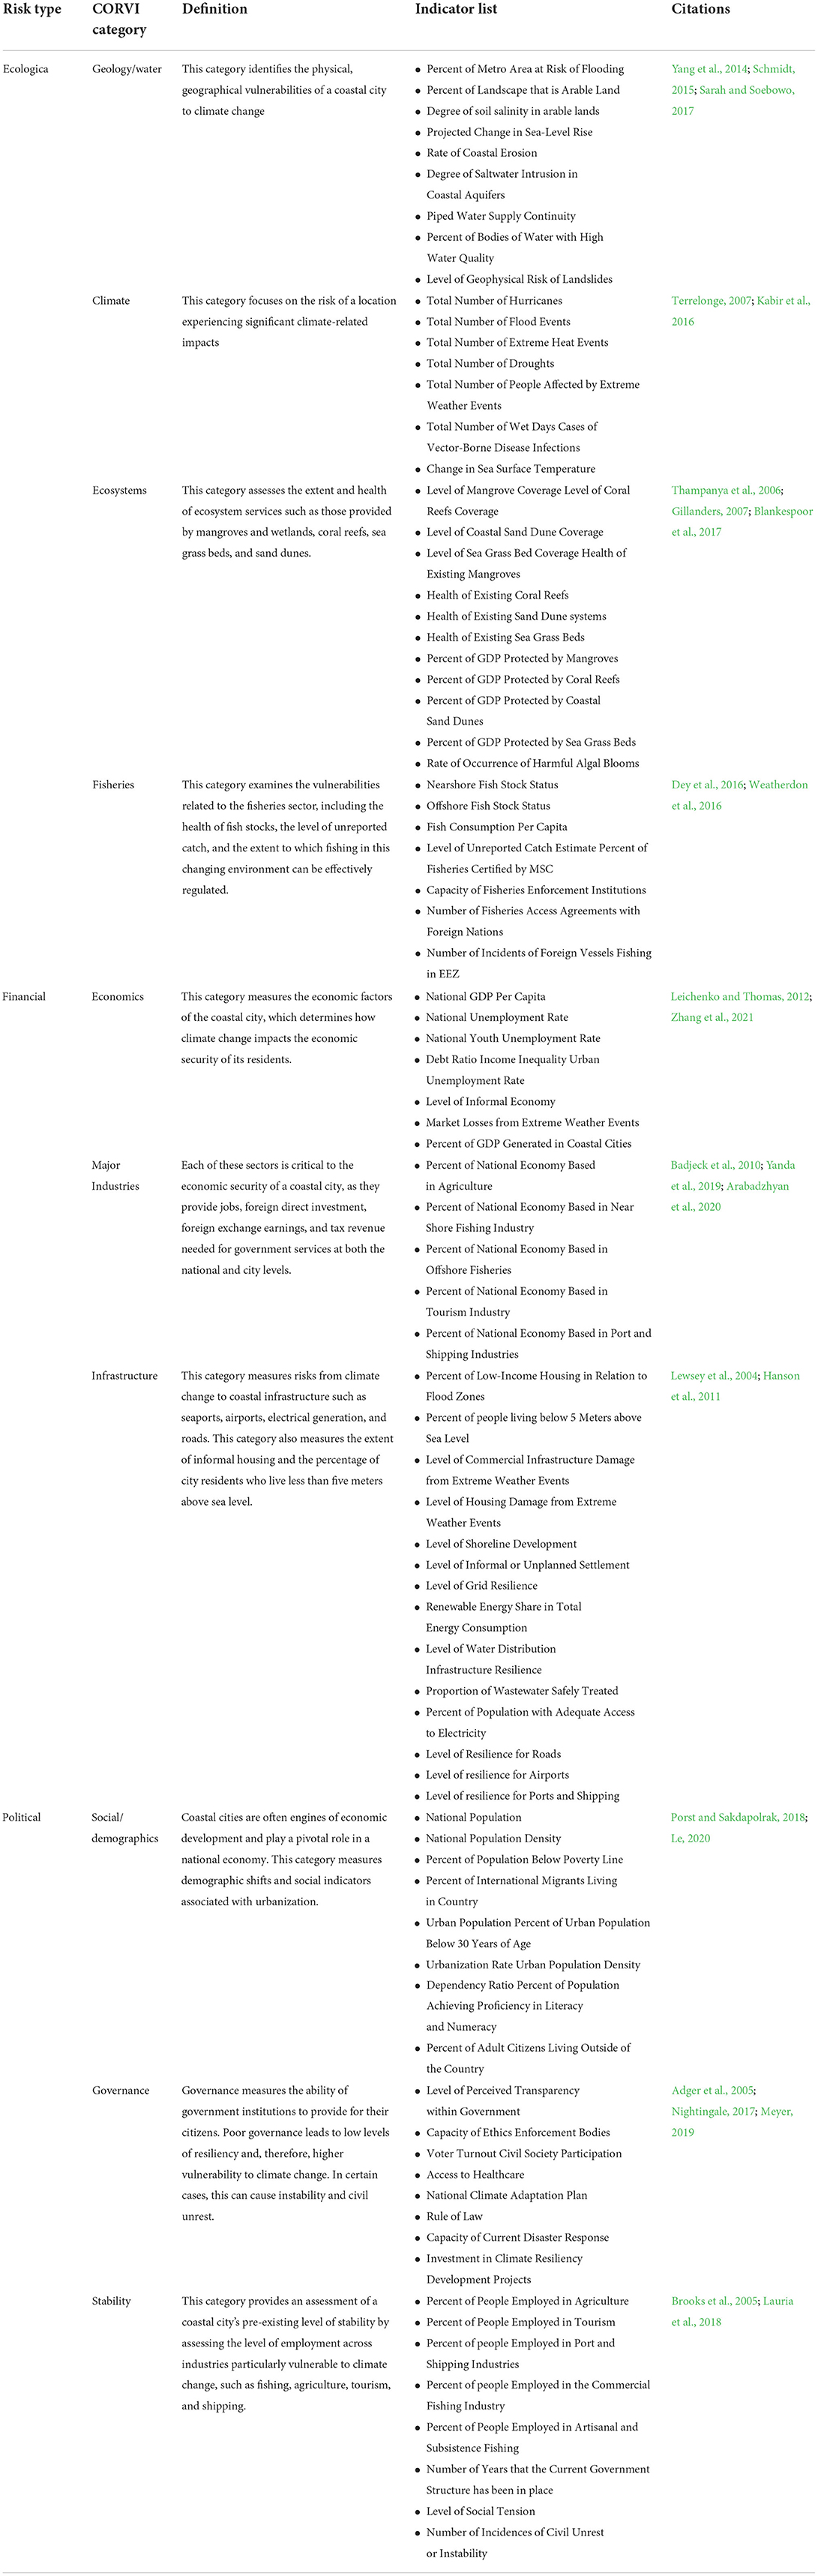
Table 1. Dimensions of climate-ocean risk and vulnerability.
The CORVI wheel, indicators, and factor matrix
Decision making for climate change adaptation requires an integrated and cross-sectoral approach to adequately capture the complexity of interconnected systems (Olazabel et al., 2018). To provide a holistic assessment of current and future climate impacts for a coastal city, CORVI assessments compare a diverse set of threats to produce a risk profile. These risks are displayed across 10 categories, grouped under ecological, financial, and political risk in the CORVI Wheel (see Figure 3). The categories are in turn made up of 94 indicators (described in Table 1), covering a range of issues such as the vulnerability of infrastructure at airports and housing, the health of marine ecosystems, and urbanization dynamics.
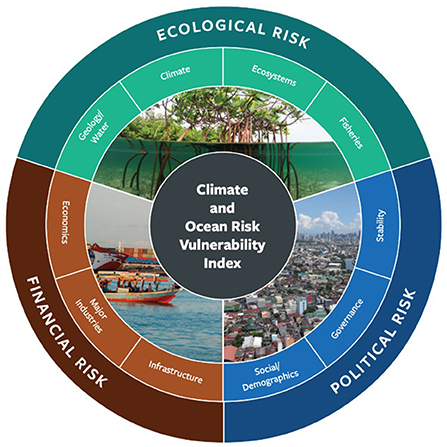
Figure 3. CORVI risk type and categories.
Finally, to ensure that the indicator scores provide a holistic risk rating, each indicator score is made up of five factors: current, past, and expected trends, along with the rate of change in the risk, and finally the impact of this risk on the coastal city. CORVI surveys ask respondents to rate the level of risk in the study area on a 1 to 10 scale, with 1 representing the lowest level of risk and 10 representing the highest level of risk, for the following five factors for each of the 94 indicators (see Figure 4).
1. The BASELINE measures the current level of risk for each indicator relative to other coastal cities in the region. Baseline data for economic and social indicators is derived from the most recent year of complete data. Climate indicators use a longer time period of 15 years.
2. PAST TREND assesses the trend of risk for the past 10 years, measured from the baseline year. The only exception to the 10-year trend measure are the climate indicators, which use a 15-year trend horizon to account for slow onset changes.
3. EXPECTED TREND assesses the anticipated trend of risk in the next 10 years, measured from the baseline year. The only exception to the 10-year trend measure are the climate indicators, which use a 15-year trend horizon to account for slow onset changes.
4. MAGNITUDE assesses the degree of expected future trend change, relative to other cities in the region. Change that happens quicker than expected is assumed to increase risk when compared to changes that take place over a longer time scale. This assumes that longer time periods of change contribute to less risk, as decision makers have more time to adapt and build resilience.
5. Finally, IMPACT assesses the importance of change for each indicator in describing future risk in the coastal city.
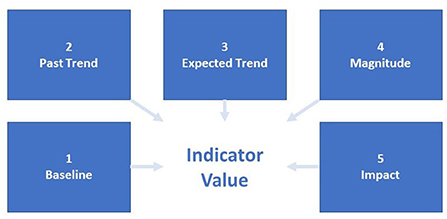
Figure 4. CORVI indicator factors.
There are 10 surveys, each corresponding with one of the 10 categories (see Figure 3) and containing the corresponding set of indicators (see Table 1). Subject matter experts are asked to self-select survey categories. Most experts complete 2–3 surveys.
Time horizons were selected using the optimum climate normals (OCN) method 30-year time horizons are traditionally used to calculate the seasonal cycle and other long-term averages of climate variables. However, as the climate changes, current conditions are more dissimilar to those from 30 years ago than they are from 10 years ago. In this environment, the OCN method can be used to calculate the minimum number of years required to accurately produce the climatological average for climate variables. The National Oceanic and Atmospheric Administration suggests that a 10-year time series for temperature and a 15-year time series for precipitation are acceptable minimum limits to produce an accurate climatology within a non-stationary period. CORVI follows the same limits that NOAA uses in their experimental seasonal forecast product by using a similar 15-year time horizon to measure climate indicators (Wilks, 2013).
Method: Protocol for applying CORVI methodology
CORVI is a comparative assessment. To illustrate relative risk dynamics, data are collected on a comparative set of coastal cities and countries in the region so that levels of risk can be compared across cities. This approach helps the decision maker to understand a city's risk scores in the context of other coastal cities within a region. This dataset is then used to establish the baseline for the structured expert judgement process (Stuart et al., 2020).
This section highlights five steps to apply the CORVI protocol in a new region: (1) research preparation and stakeholder outreach, (2) setting the CORVI region, (3) target city data collection, (4) generating CORVI risk scores, and (5) interpreting findings and write risk profile. Step 2 is only necessary if a CORVI city assessment is being conducted in a new region.
The CORVI methodology includes surveys and interviews with human subjects, however it is exempt from ethical review under 45 CFR 46.104(d)(2)(i) as all participants were adult volunteers and no personally identifiable information was gathered which could link the respondents to their responses.
Research preparation and stakeholder outreach
To begin, researchers need to clearly understand the needs and intended users of the CORVI project. In this process, identifying high-level local champions in government, the private sector and civil society is important for gaining buy-in for the CORVI project. Identifying a local project partner organization and/or sponsor who is recognized and well respected by the community will assist with the local work on the ground, particularly through facilitating buy-in throughout the project, identifying and engaging with key stakeholders and subject matter experts for surveys (section Survey distribution and collection) and semi-structured interviews (SECTION Fieldwork and expert interviews), and implementing the final recommendations.
Set CORVI region
If the CORVI coastal city assessment in taking place in a new region, researchers need to set the region to establish the comparative baseline for the SEJ process. This is done in three stages: define region, adjust indicators, and data collection from national and international datasets.
Define region
Defining the region not only impacts the current target coastal city assessment, but also any future CORVI city assessment in the region. As such, it is important the countries in the CORVI region are broadly accepted as a region, have sufficient data sources associated with them to construct indicators, and that the coastal cities included in the region are vulnerable to the impacts of climate change.
A CORVI region consists of between 10 and 20 coastal cities. This limit seeks to balance rigor and practical considerations, allowing for meaningful comparison while ensuring that regional data requirements for assessment in a new CORVI region are not prohibitive. The following four steps were undertaken to establish a CORVI region of a maximum of 20 coastal cities. In practice, each step will reduce the number of coastal cities in a region through an assessment of climate vulnerability and data availability. Once the region falls below 21 coastal cities, the selection process should end, even if more steps remain.
First, determine the UN Statistics Division sub-region in which the target coastal city sits. In limited circumstances, small adjustments to the region can be made if a widely used alternative region exists. For example, if the UN sub regions categories have been superseded by more recent delineations such as regional intergovernmental organizations. For CORVI assessments in Mombasa, Kenya and Dar es Salaam, Tanzania, the African Union's (AU) definition for the East Africa subregion was used. This decision was made because the AU's definition more closely matches the delineation of subregional bodies. In addition, the AU's subregions include a similar number of coastal nations, ensuring that future CORVI assessments in neighboring regions can be conducted using this process.
Using the World Population Review (2022) dataset, list all coastal cities in the region. This dataset should be crosschecked with national city definitions to ensure that all coastal cities are included. Generally, cities with population under 50,000 are excluded1. Coastal cities under active conflict conditions are also excluded as researchers would be unable to conduct necessary fieldwork. If a subregion has more than 80 coastal cities at this stage, the region may need to be further segmented. When this occurs, coastal cities in the region should be divided into large metropolitan areas, metropolitan areas, medium-sized urban areas, and small urban areas (OECD, 2021) (see Table 2). This division ensures that the region is broken into manageable sizes and strengthens the comparative nature of the index as the target city will be compared against cities which are of a similar size. End region selection process if fewer than 21 coastal cities remain.

Table 2. OCED urban size designation.
Second, to determine coastal city vulnerability to climate hazards, calculate the number of extreme storms that pass within 100 nautical miles of a coastal city over the last 15 years. These spatial and temporal parameters were selected to capture events that may have been impacted or worsened by climate change, as well as events near enough to still be impacting the location2. Coastal cities that did not experience an extreme storm in the past 15 years are excluded from the CORVI city selection. End region selection process if <21 coastal cities remain.
Third, as noted above, data collection from national and international datasets is used in the CORVI assessment to establish a baseline for SEJ. As such, data availability for a subset of indicators at the national level is critical for establishing this baseline. Data availability is tested through the collection of a sample of demographic, economic, fisheries, climate, and ocean data. Data must be available for at least one of the three proceeding years in which the study is or will be conducted. For indicators that assess long-term trends, a 15-year time horizon is used. Sample indicators were selected due to their use in other internationally accepted measures of ecological, financial, and political risk. Data availability indicators are enclosed in the appendix. Coastal cities are excluded if they have less than eight of the 10 data points. End region selection process if fewer than 21 coastal cities remain.
Fourth, If the region still contains over 20 coastal cities, then the region must be further divided by splitting the UN subregion into subsections. This decision is made in consultation with regional coastal city experts and the Stimson CORVI Project Team and considers specific ecological, financial, and political characteristics for each region.
Adjust indicator to fit regional context
As detailed in section Method: protocol for applying CORVI methodology, the 10 risk categories and 94 indicators were developed through a rigorous selection process by the Stimson CORVI project team and an Expert Advisory Panel. While climate and oceans risks impact coastal cities in every region of the world, some impacts are specific to a climatic zone. As such, while the 10 risk categories are consistent across CORVI assessments in different regions, a maximum of 10 indicators can be adjusted to fit the CORVI method to a specific regional context. In addition to replacing indicators which do not fit the regional context, the level which an indicator assesses should also be interrogated. Though certain indicators are consistent across a country, others vary greatly. Where possible, indicators that are likely to have a lot of national heterogeneity should be measured at the city level.
Using the following four questions, researchers can systematically interrogate CORVI indicators in relation to the new CORVI region. Final adjustments should be verified by regional experts.
• Which indicators do not fit the regional context?
• Which indicators are critical for understanding the regional context and should be added?
• Which indicators should be adjusted from the city-level to the national-level?
• Which indicators should be adjusted from the national-level to the city-level?
Collect regional baseline and past trend data
To build a comparative risk dataset on climate and ocean risks impacting the region, data is collected from national and international datasets on coastal cities/countries in the established CORVI region. Regional data is gathered for factors (1) baseline and (2) past trend and is used to construct a comparative risk score for the coastal cities/countries in the region. Data is collected either at the city or national level depending on the indicator in question.
For non-climate indicators, data is collected on the target year and the preceding 10 years. However, given that climate change takes place over a longer time horizon, indicators which measure climate change use a 15-year average to account for slow-onset changes. It is crucial to ensure that data collected on a particular indicator is consistent (same year) to ensure data validity. However, if this is not possible, data from the preceding 2 years can be substituted.
This data is then used to construct baseline data risk score for each indicator. Low and high values for each indicator are used to create an upper and lower bound on a 1–10 risk score, with the score averaged between these relative bounds3.
Geographic scope and target city data collection
As noted in section Projected climate change impacts for coastal cities, while datasets on the impacts of climate and ocean risks have greatly improved, data gaps remain. Accessing comparative city-level data remains a challenge. Despite this, decision makers need tools which reduce uncertainty to pursue integrated resilience planning in an effective manner. To overcome this challenge, CORVI uses SEJ, a social science technique which seeks to quantify risk when pre-existing datasets are inadequate (Colson and Cooke, 2018). By combining pre-existing and expert survey data, the CORVI assessment collects data in areas that would otherwise be unavailable to researchers.
Determine geographic scope
Climate risks do not necessarily recognize geopolitical boundaries. As a result, the geographic scope of a CORVI assessment may expand beyond official city boundaries to include a broader metropolitan area. It also includes the land to sea interface. This boundary is determined with input from the local experts and the CORVI Project Team. Factors that could lead to the geographic scope of an assessment being expanded include nearby communities which house a large proportion of the target city's workforce, adjacent transportation hubs, and coastal ecosystems that provide resilience, commerce, or sustenance benefits.
Conduct literature review
Researchers conduct an academic and gray literature review on the nature and extent of climate risks impacting the target coastal cities, as well as an assessment on resilience programming already underway. This review can include, but is not limited to, government documents, reports from international organizations, and existing data that is available for the target city, but which is not included in the regional baseline and past trend data (see section Collect regional baseline and past trend data).
Survey distribution and collection
Researchers identify subject matter experts through research, personal networks, and extensive outreach to stakeholders in the target coastal cities. These experts often refer other experts and stakeholders with appropriate expertise to project researchers using snowball sampling4. Experts included representatives from academia, government, civil society, and the private sector.
Survey data is collected on all indicators in the CORVI assessment. Survey questions for each indicator are standardized and collect data on five indicator factors: (1) baseline, (2) past trend, (3) expected trend, (4) magnitude, and (5) impact. Experts fill out surveys on the categories which correspond to their expertise. For example, a climate scientist might fill out surveys for “Climate” and “Ecosystems” categories, but not the “Governance” category. Surveys are anonymized to allow experts to speak freely.
Fieldwork and expert interviews
In additional to collecting pre-existing and survey data, the project team conducts semi-structured interviews with experts in the target costal city (Gilchrist, 1992). Effective climate vulnerability assessments and adaptation efforts should engage with a broad range of local stakeholders (Kythreotis et al., 2020b; McMillan et al., 2022) which can aid in ensuring scientific rigor and policy clarity during implementation (Sethi et al., 2021). The CORVI methodology requires inclusion of experts who can speak to the different categories of risk included in CORVI and a representative sampling from government, academia, the private sector, and civil society. This information complements the survey data gathered throughout the structured expert judgement process and the desktop research and contributes to the development of the CORVI risk profile (See Section Generating risk profile) which includes a indicator scores, a risk and vulnerability narrative, and final recommendations.
Generate CORVI risk scores
To guard against confirmation bias, survey answers are compared to pre-existing data to weight the expert responses by utilizing a coherence check (Cooke, 1991). For each indicator, the experts' answers are weighted by comparing their responses to factor 1 (baseline value) to pre-existing data using a percentage variance5. Expert survey answers are then assigned a quartile per indicator.
Calculating indicator risk scores
To calculate each indicator score, the following procedure is used to combine pre-existing secondary data with survey data. First it calculates the difference between the baseline data risk score (see section Collect regional baseline and past trend data) and the survey response for factor (1) baseline. For factors (1) baseline and (2) past trend, survey responses are only included if this difference is smaller than 25 percent of the risk scale (1–10). This is done to ensure survey data is not weighted more heavily than pre-existing data. For factors (3) expected trend, (4) magnitude, and (5) impact, survey responses are weighted as 2 if the difference is smaller than 25 percent of the risk scale, are weighted as 1 if the difference is between 25 and 75 percent of the risk scale and excluded if the difference is >75 percent of the risk scale. The factors are then combined into an indicator score. For indicators with pre-existing data derived from national or international datasets but which lack survey data, the baseline risk scale is used for the final indicator score.
Calculating category risk scores
The final risk score for each category depends on how much each indicator contributes to the overall risk score. To calculate the relative weight of each indicator in a category, a weighting procedure is used which incorporates three elements: a minimum data threshold, data confidence, and indicator importance.
First, indicators must reach a minimum data threshold to be included in the final risk category score. To meet the criteria an indicator must have at least one of the following: pre-existing data source or at least 3 expert surveys. If an indicator does not meet this minimum criterion, it is excluded from the final risk score calculation. However, it is important to note that these data gaps are still noted in the final report and expert interviews are used to describe risks where CORVI scores are not available.
Second, indicators that contain more robust data are weighted more heavily. Robust data is measured by the availability of pre-existing data and by the number of expert surveys. A score out of 2.5 is derived from three criteria. If the indicator is supported by pre-existing data, it is awarded 1 point in the weighting scheme. If the indicator has data provided by survey respondents through the SEJ process it is awarded 0.5 point in the weighting scheme. If the indicator has data provided by 6 or more surveys it also is awarded 1 point in the weighting scheme.
Third, the relative importance of each indicator within a risk category is determined using expert surveys. Survey respondents are asked to identify the two most important and the two least important indicators for understanding risk in the coastal city. This information is used to calculate a ratio for each indicator between 0 and 2, where:
• 1 if an equal number of survey respondents mark the indicator as most as mark it least important.
• 0 if all survey respondents mark the indicator as least important.
• 2 if all survey respondents mark the indicators as most important.
Final scores from data confidence and expert importance weighting are combined to give a final weighting score out of 4.5. All indicators which passed the minimum data threshold are then combined using a weighted average to produce the final indicator score.
Generating risk profile
The final step is to interpret the final CORVI risk scores, augment this data with the other sources of information, and translate this information into a risk narrative that communicates climate-related risks in the coastal city. The CORVI risk scores are quantitative, and, as described above, calculated using the SEJ process. These scores are then combined with the qualitative information from the semi-structured expert interviews and the academic and gray literature assessment in a three-step process. The first step is to review the highest scoring risk indicators and to identify areas of convergence and divergence between these scores, the literature assessment, and the expert interviews. This process helps researchers to determine if CORVI is capturing additional risks and if this is due to data availability bias. Second, key risks and themes under each risk type are connected to a narrative that is driven by the highest and lowest risk scores and supported by information on local conditions and adaptive capacity gleaned from experts during the semi-structured interview process. The focus on the lowest risk scores in the analysis helps to identify areas where the city or metropolitan study area is already doing well in terms or increasing climate resilience and reducing vulnerability. The focus on the highest risk scores in the analysis helps to identify key areas for action. The risk profile narrative identifies and discusses both areas of proficiency and areas of deficiency in terms of climate risk and vulnerability. Third, actionable recommendations are derived from the first two steps, and are based on both the quantitative analysis of risks and the qualitative insights gathered from local experts.
Communication and implementation
While communication with the public and other key stakeholders should occur throughout the CORVI process, its saliency rises once the risk scores are calculated and the risk profile is generated. CORVI is designed to drive action to reduce vulnerability and increase resilience in coastal cities and communicating the findings of a CORVI assessment are key to this process. Communication should target a range of stakeholders in local and national governments, the private sector, civil society, and the broader public, with messaging tailored to the specific priorities of the audience. The risk scores and risk profile should help prioritize actions, develop innovative policy solutions, attract funding, and improve investment and programmatic decision making.
Results from pilot studies
Two pilot projects in the coastal cities of Castries, Saint Lucia and Kingston, Jamaica demonstrate the utility of CORVI. Coastal cities in the Caribbean are of critical importance to the economic and political welfare of its countries, due to the size of these island nations (Berg et al., 2015). However, Caribbean coastal cities face a growing number of climate risks that have an impact on social equity (Dulal et al., 2009), vulnerable economic sectors (Scott et al., 2012), infrastructure (Cashman and Nagdee, 2017), and ecosystems (Mercer et al., 2021).
Throughout, the research team systemically implemented the CORVI protocol described above. Along with the two target cities, the research team selected 12 additional coastal cities in the region to provide a comparative baseline. The research team-based city selection on the perceived vulnerability of coastal cities in the region to climate risks and data availability. The CORVI Caribbean region consists of the following coastal cities: Basseterre (Saint Kitts and Nevis), Bridgetown (Barbados), Castries (Saint Lucia), Havana (Cuba), Kingston (Jamaica), Kingstown (Saint Vincent and the Grenadines), Nassau (Bahamas), Port of Spain (Trinidad and Tobago), Port-au-Prince (Haiti), Roseau (Dominica), Saint George's (Grenada), Saint John's (Antigua and Barbuda), Santo Domingo (Dominican Republic), and Willemstad (Netherlands Antilles) (see Figure 5).
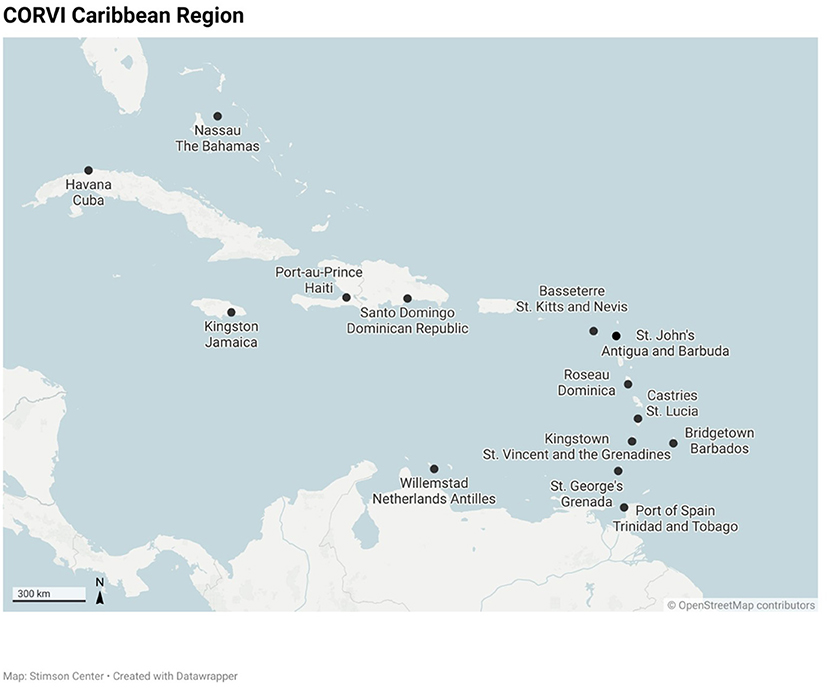
Figure 5. Map of CORVI Caribbean region.
After discussions with experts, two indicators—Diversity of Lodging Types and Incidences of High Sargassum—were added to tailor CORVI indicators to the Caribbean region. Through a systematic review, comparable pre-existing data was collected on 56 out of 96 CORVI indicators. This data was collected at the national and city level, depending on the indicator in question.
Additional data was then collected by surveying subject matter experts. Forty expert surveys from 15 individuals/organizations were collected for Castries, Saint Lucia. Twenty-two expert surveys from 12 individuals/organizations were collected for Kingston, Jamaica. This information was supplemented by 16 key informant interviews in Castries and 13 in Kingston. This information was combined with an assessment of academic and gray literature on climate impacts.
Pre-existing regional data and target city expert survey data were combined using SEJ. Due to insufficient data, 8 indicators in Castries and 15 indicators in Kingston were excluded. The CORVI protocol was applied to the other indicators and risk scores were produced for each. This data was then interpreted in the context of each location and combined with semi-structured expert interviews and available academic and gray literature to produce the final city risk profiles (See Section Generating risk profile). Conclusions and recommendations were presented and communicated to a variety of stakeholders and decision makers, including city and national governments, intergovernmental organizations, financial institutions, and the non-profit community.
Castries, Saint Lucia
Built on reclaimed land and located on the west coast, Castries is the capital of Saint Lucia and its largest city. While the city population has remained relatively consistent, the urban area around Castries has expanded, extending from Grand Cul de Sac Bay in the South to Gros Islet in the north. Given the urban expansion, the geographic area of this risk profile was broadened to combine Gros Islet district and the city of Castries. The Castries-Gros Islet Corridor is home to nearly 50 percent of the nation's population (75,000 people).
In Castries, the CORVI risk profile scores were greatest under the ecological and financial risk types, specifically in the economics, ecosystems, and climate categories (see Table 3). These category scores were driven by high indicator scores related to unemployment, loss of coral reef coverage, and extreme heat events. Lower risk scores under the political risk type were driven by low scores in the rule of law and civil society engagement indicators (Stuart et al., 2020).
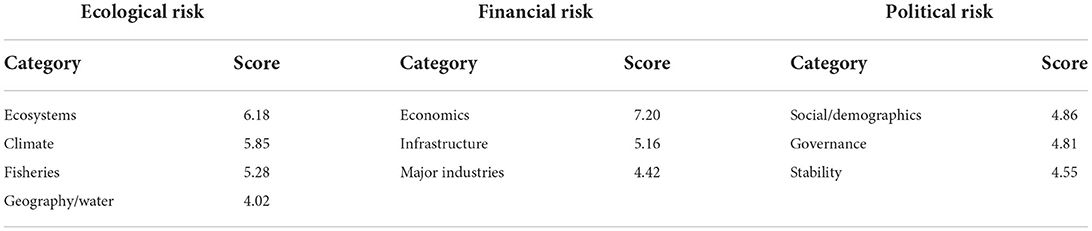
Table 3. Castries risk profile summary.
Other key findings included vulnerability of the tourist sector, ecosystem degradation, and key infrastructure to the physical impacts of storms and sea level rise. Furthermore, and partly as a consequence of its rapid urbanization, the study area continues to face issues relating to fresh and marine water quality. Finally, while tourism is a vital part of the economy, it has unforeseen negative consequences. CORVI indicators and long-form interviews highlighted unregulated tourist settlement construction and pollution from a lack of effective waste management has had secondary impacts on coastal ecosystems, such as coral reefs, and mangroves, and sea grass beds.
Key recommendations included the need to empower the city-level government to design and implement climate resilience plans, improve resilience in the tourist industry, and improve urban infrastructure resilience. Since the findings were released in June 2020, CORVI researchers have been a resource in efforts to unlock additional climate investment in Saint Lucia. Organization by the World Economic Forum and the Organization for Economic Cooperation and Development in collaboration with the government of Saint Lucia, the Country Financing Roadmap initiative has integrated some CORVI findings into their own work on climate impacts, including the need for economic diversification, renewable energy promotion and the importance of ecosystem health.
Kingston, Jamaica
Located in a one of the world's deepest natural harbors and backed by the Blue Mountains, Kingston is the focal point for Jamaica's commercial, industrial, and service sectors. To fully capture climate and ocean risks in Kingston, in consultation with local stakeholders, the study area was expanded to encompass the broader urban area, including the neighboring town of Portmore. This study area comprises 26 percent of the national population of Jamaica (765,000 people).
The CORVI risk profile summary shows that risks were relatively even and spread across multiple categories (see Table 4). However, by viewing indicator risk scores, researchers were able to interpret and identify key risk themes.

Table 4. Kingston risk profile summary.
Under the Ecosystems category, indicators which measured marine ecosystem services provided by coral reefs, sea grass beds, and mangroves all scored high. In expert interviews, it was noted that this risk is concentrated around Kingston's international airport, where mangrove removal has heightened the risk of flooding resulting from sea level rise, affecting both the airport and the road which connects the city. While recent mangrove replanting projects mitigated it, the risk remains.
Under financial risk, Kingston's diverse economy lowered its vulnerability to extreme weather events, as it is not as dependent on one industry for its economic security. However, urban unemployment, public debt, and informal housing scored higher than average. In interviews, experts noted that unregulated construction and poor construction practices in key watershed areas had increased flood risk in Kingston.
Finally, under political risk, the Governance category score was higher than average driven by a lack of confidence in the rule of law and government transparency. Both indicators measure perceptions of individual safety. Conversely, lower risk scores were recorded in civil society engagement and national climate adaptation planning. These indicators measure the perception of how well the Jamaican Government is doing to enact effective climate adaptation policies. This kind of leadership can be seen in the government's Vision 2030 Report, which identifies hazard risk reduction and adaptation to climate change as critical areas for action (PIOJ, 2019).
Key recommendations from the risk profile included the need to build resilience in marine ecosystems and city watersheds, improve urban planning, and further integrate social issues into disaster response. Since the completion of the CORVI assessment, government entities focusing on climate change, including the Ministry of Finance and Public Service and the Planning Institute of Jamaica have reviewed the report findings. Subsequently, the government has established a new Ministry of Housing, Urban Renewal, Environment, and Climate Change. Similar to CORVI findings, this new ministry integrates climate risks, urban planning, and ecosystem considerations.
Lessons learned from protocol implementation
During the implementation of CORVI protocol in Castries, Saint Lucia and Kingston, Jamaica, the research team learned several important lessons that can benefit future implementation efforts.
First, both pilots highlighted the importance of project buy-in from government and local stakeholders. Stakeholder engagement at the start of a project has been found to increase success and sustainability of climate adaptation projects (Mabon and Shih, 2017). In the pilot studies, while informal project buy-in from government ministries and key civil society organizations and universities was achieved, the research team found that formalizing this support could have improved the legitimacy of these assessments. Engaging a respected and recognized local project partner at the onset of the project, such as government, civil society, or finance, facilitates arranging stakeholder interviews, surveys, and overall project buy-in, including project recommendations and their future implementation.
Second, several experts noted they did not have the necessary expertise to compare the coastal city in which the CORVI assessment was taking place, to other coastal cities in the region. In several cases the coherence check excluded all expert surveys for an indicator, suggesting that experts either did not understand the comparative aspect of CORVI, or they lacked the expertise to make an informed judgement. Moreover, unfamiliarity with the SEJ methodology process was a barrier to engaging expert participation across all stakeholder groups. In meetings with stakeholders throughout the pilot studies, the research team learned to emphasize the following three benefits of the method. First, SEJ helps researchers to fill data gaps. Second, SEJ is an opportunity for the assessment to reflect the cumulative opinion of experts who live in, or have direct knowledge, of their city. Finally, SEJ is an efficient, cost-effective, and standardized approach to developing a holistic understanding of climate risk.
Third, throughout the pilot studies, the research team received extensive feedback on CORVI score interpretation. Interviewees often articulated that they were unwilling, or dissatisfied, by the comparison of their coastal city to other cities in a region. Several interviewees expressed concerns that if their city scored as resilient, their city would struggle to access climate finance from international partners. However, if a city scored as high risk, then the CORVI assessment could reduce future private sector investment. In response to this feedback, the project team decided not to aggregate the 10 risk category scores by risk type or into one score for a coastal city. Using this approach, the project team hopes to ensure that disaggregated results from CORVI are examined as a whole, and detail is not lost or misinterpreted (Gupta et al., 2010), but used to pinpoint areas for action.
Discussion
This article advances the literature on coastal city climate risk by introducing a standardized method for collecting data and measuring climate change impacts on the risk of environmental, economic, political systems. Based on the literature, interviews, and field research, this paper introduces the 10 risk categories in the CORVI wheel, to assess how climate change contributes to ecological, financial, and political risk in a coastal city. It also contributes to the literature on SEJ, by demonstrating how expert opinion it can be applied to measure coastal city risk in data sparse environments.
The CORVI methodology improves upon similar tools in three distinct ways. First, unlike many other indices which tend to focus on the national level, CORVI is city based, providing sub-national level detail on the nature and impact of climate and ocean risks. This focus is based on extensive interviews with potential users of the CORVI tool, who noted the difficulty of down-scaling national level risk and vulnerability data to inform policy action to build climate resilience in specific communities. It also aligns with current literature on vulnerability indices and effective climate adaptation which indicates that effective climate adaptation requires a strong understanding of local science and policy issues (Jones, 2018; Sethi et al., 2021). Vulnerability assessments and adaptation actions should be driven by a bottom-up participatory approach that crosses sectoral boundaries and engages stakeholders from public, private, and non-governmental organizations, particularly in developing countries (Kythreotis, 2019; Sethi et al., 2021; Zebisch et al., 2021; McMillan et al., 2022).
Second, CORVI looks across a broad set of ecological, financial, and political risk factors connected to climate change impacts which influence vulnerability of coastal cities and their residents. The Stimson team selected indicators primarily based on the ability to capture and explain climate change risks in coastal cities, rather than the availability of existing data. This approach promotes a holistic understanding of climate change impacts to coastal cities. While comprehensive, feedback from stakeholders indicates that the list of CORVI indicators may be too large. Further work is planned to assess the indicator set and ensure that CORVI strikes the right balance between adequate and accurate information to determine risk in coastal cities and unnecessary burden on the survey respondents.
Third, by utilizing SEJ, CORVI is suited to producing actionable insights in data sparse environments. It contributes to the existing body of literature where SEJ has been used to assess the link between climate change and conflict (Mach et al., 2019), the contribution of sea ice to sea level rise (Bamber et al., 2019), and the impact of invasive species on ecosystem services (Schwoerer et al., 2019), adding the topic of climate risk and vulnerability for least developed countries (LDCs) and small island developing states (SIDS). By combining pre-existing and survey data across a wide range of indicators, CORVI is building a more holistic body of knowledge surrounding climate risks to coastal cities. While the use of SEJ allows CORVI to assess a diverse range of risks, it should not be regarded as a substitute for additional data collection by subnational and national government entities. Rather, SEJ is best viewed as a complementary research technique specialized to analyzing topics with significant data gaps (Werner et al., 2017). The benefits are this approach was demonstrated in the pilot studies, where CORVI filled data gaps to produce holistic climate risk assessments.
Since the release the CORVI method and pilot studies in 2020, additional projects have been completed in the cities of Dar es Salaam, Tanzania, Mombasa, Kenya, and Suva, Fiji. Additional assessments are also underway in Basseterre, St. Kitts and Nevis, Chattogram, Bangladesh, and Dagupan, Philippines. Utilizing a training model, the original project team at the Stimson Center has expanded to include researchers at the Ocean Policy Research Institute at the Sasakawa Peace Foundation. Both organizations are now working with a variety of partners—academic institutions, nonprofit organizations, and government entities—in the coastal cities to produce additional assessments. Finally, the city risk scores are presented in a data portal,6 adding additional CORVI cities risk profiles as they are finalized. This enables a comparative body of city-level data which will provide greater insights into the risks these cities face.
Despite its initial success, certain limitations of the CORVI method and its implementation (also included in section Lessons learned from protocol implementation) are further noted below. First, the pilots demonstrated that a lack of pre-existing data did reduce the ability of SEJ to perform the coherence check. Second, securing high-level government buy-in to the CORVI process has been essential; where such support is lacking, achieving expected survey response rates has proven challenging. Third, while buy-in and support from government and a strong local partner is important and achieved in the pilots, follow-on work remains to translate CORVI risk scores into meaningful action.
Subsequent research will assess and revise the implementation of SEJ method, as well as improve the process of identifying experts. This will be accompanied by efforts to further align risk information with the needs of end users, including the development of an analytical data platform to display CORVI city results and further work to tailor technical results to the needs of decision-makers. Finally, future research will also interrogate how the CORVI SEJ method could be adapted to measure climate-related risks in new geographic locations or specific sectors like tourism or fisheries.
As the impacts of climate change continue to increase, resilience planning in coastal cities must consider integrated systems thinking. There is a welldocumented need for city-level climate vulnerability assessments, particularly in LDCs and SIDS. These assessments are most effective when they view vulnerabilities through social, economic, and political lenses in addition to considering the impacts of biophysical hazards, using a process that engages a broad range of stakeholders at the subnational level. CORVI combines a quantitative assessment of risk and vulnerability with qualitative insights gathered from local stakeholders resulting in a tool which can aid in the design of effective and integrated policy solutions. Beyond the specific contribution of the CORVI assessments and city risk profiles in measuring climate resilience in coastal cities, the expanded use of SEJ is a key contribution to measuring climate impacts in data sparse environments.
Data availability statement
The original contributions presented in the study are included in the article/supplementary materials, further inquiries can be directed to the corresponding author.
Ethics statement
Ethical review and approval was not required for the study on human participants in accordance with the local legislation and institutional requirements. Written informed consent for participation was not required for this study in accordance with the national legislation and the institutional requirements.
Author contributions
TR, JS, MC, and SY contributed to the conception and design of the CORVI protocol. TR, JS, SY, NY, MM, and NF have been involved in the field implementation of the protocol. TR and JS wrote the first draft of the manuscript. SY and NF wrote sections of the manuscript. All authors contributed to manuscript revision, read, and approved the submitted version.
Funding
The authors would like to thank the Sasakawa Peace Foundation and the Nippon Foundation for their funding and the support for this study.
Conflict of interest
Author TR was employed by TBD Economics, LLC.
The remaining authors declare that the research was conducted in the absence of any commercial or financial relationships that could be construed as a potential conflict of interest.
Publisher's note
All claims expressed in this article are solely those of the authors and do not necessarily represent those of their affiliated organizations, or those of the publisher, the editors and the reviewers. Any product that may be evaluated in this article, or claim that may be made by its manufacturer, is not guaranteed or endorsed by the publisher.
Footnotes
1. ^The minimum population threshold can be relaxed in the following circumstances. First, the population threshold can be relaxed for one city in a CORVI region if that coastal city is a capital city. Second, the minimum population threshold can be adjusted/removed for the entire region if a region contains many countries and coastal cities with small than average populations (for example in the Caribbean and Pacific regions).
2. ^An extreme storm is defined as a tropical cyclone of sustained winds of at least 74 mph category 1–5 on the Saffir-Simpson Hurricane Wind Scale. To access storm data through the online portal and filtering information by location, storm category 1-5, 100-mile buffer, and time horizon. https://coast.noaa.gov/hurricanes/#map=4/32/-80.
3. ^Baseline data scales are only constructed if pre-existing data is available for ≥ 75 of coastal cities in the region.
4. ^Snowball sampling or chain-referral sampling is a non-probability sampling technique used when samples have traits that are difficult to find. In this sampling technique, existing subjects provide referrals to recruit additional subjects required for a research study. See Biernacki and Waldorf (1981) for further instruction.
5. ^For indicators with no pre-existing data but survey data, an average is taken from survey answers to factor 1 to construct the baseline value, which is then used to weight experts utilizing cumulative opinion.
6. ^The CORVI Data Portal can be accessed at https://www.stimson.org/project/corvi/coastal-cities-index/data-portal/.
References
Adger, W. N., Barnett, J., Brown, K., Marshall, N., and O'Brien, K. (2012). Cultural dimensions of climate change impacts and adaptation. Nat. Clim. Change 3, 112–117. doi: 10.1038/nclimate1666
Adger, W. N., Hughes, T. P., Folke, C., Carpenter, S. R., and Rockström, J. (2005). Social-Ecological resilience to coastal disasters. Science 309, 1036–1039. doi: 10.1126/science.1112122
Ahrends, A., Burgess, N. D., Milledge, S. A. H., Bulling, M. T., Fisher, B., and Smart, J. C. R. (2010). Predictable waves of sequential forest degradation and biodiversity loss spreading from an African city. Proceed. Nat. Acad. Sci. 107, 14556–14561. doi: 10.1073/pnas.0914471107
Arabadzhyan, A., Figini, P., García, C., González, M. M., Lam-González, Y. E., León, C. J., et al. (2020). Climate change, coastal tourism, and impact chains—a literature review. Curr. Issues Tour. 1, 1–36. doi: 10.1080/13683500.2020.1825351
Aspinall, W. P. (2010). A route to more tractable expert advice. Nature 463, 294–295. doi: 10.1038/463294a
Badjeck, M., Allison, E. H., Halls, A. S., and Dulvy, N. K. (2010). Impacts of climate variability and change on fishery-based livelihoods. Marine Policy 34, 375–383. doi: 10.1016/j.marpol.2009.08.007
Bamber, J. L., Oppenheimer, M., Kopp, R. E., Aspinall, W. P., and Cooke, R. M. (2019). Ice sheet contributions to future sea-level rise from structured expert judgment. PNAS 116, 3. doi: 10.1073/pnas.1817205116
Barbier, E. B., Hacker, S. D., Kennedy, C., Koch, E. W., Stier, A. C., Silliman, B. R., et al. (2011). The value of estuarine and coastal ecosystem services. Ecol. Monographs 81, 169–193. doi: 10.1890/10-1510.1
Berg, J., Maxwell, J.-.A, Dietrich, K., Fee, L., Baloi, O., et al. (2015). Urbanization and Climate Change in Small Island Developing States. UN Habitat.
Bhave, A. G., Conway, D., and Dessai, S. (2016). Barriers and opportunities for robust decision making approaches to support climate change adaptation in the developing world. Clim. Risk Manag. 14, 1–10. doi: 10.1016/j.crm.2016.09.004
Biernacki, P., and Waldorf, D. (1981). Snowball sampling: problems and techniques of chain referral sampling. Sociol. Methods Res. 10, 141–163. doi: 10.1177/004912418101000205
Black, R., Adger, W. N., Arnell, N. W., Dercon, S., Geddes, A., Thomas, D., et al. (2011a). The effect of environmental change on human migration. Global Environ. Change 21, S3–S11. doi: 10.1016/j.gloenvcha.2011.10.001
Black, R., Dominic, K., and Kerstin, S. V. (2011b). Migration and climate change: towards an integrated assessment of sensitivity. Environ. Plann. A 43, 431–450. doi: 10.1068/a43154
Blankespoor, B., Dasgupta, S., and Lange, G.-. M. (2017). Mangroves as a protection from storm surges in a changing climate. Ambio 46, 478–491. doi: 10.1007/s13280-016-0838-x
Brooks, N., Adger, W. N., and Kelly, P. M. (2005). The determinants of vulnerability and adaptive capacity at the national level and the implications for adaptation. Glob. Environ. Change Adapt. Clim. Change Perspect. Across Scal. 15, 151–163. doi: 10.1016/j.gloenvcha.2004.12.006
Burgman, M. A. (2004). “Expert frailties in conservation risk assessment and listing decisions,” in Threatened species legislation: Is it just an Act?, eds Hutchings, P., Lunney, D., and Dickman, C. (Mosman, NSW: Royal Zoological Society), 20–29.
Carbognin, L., Pietro, T., Alberto, T., and Luigi, T. (2010). Global change and relative sea level rise at Venice: what impact in term of flooding. Clim. Dynam. 35, 1039–1047. doi: 10.1007/s00382-009-0617-5
Cashman, A., and Nagdee, M. R. (2017). Impacts of climate change on settlements and infrastructure in the coastal and marine environments of caribbean small island developing states (SIDS). Sci. Rev. 17, 155–173. Available online at: https://assets.publishing.service.gov.uk/government/uploads/system/uploads/attachment_data/file/605066/11._Settlements_and_Infrastructure_combined.docx.pdf (accessed March 20, 2021).
Chan, S., and Amling, W. (2019). Does orchestration in the Global Climate Action Agenda effectively prioritize and mobilize transnational climate adaptation action? Int. Environ. Agreements. 19, 429–446. doi: 10.1007/s10784-019-09444-9
Chen, J., Zhu, L., Fan, P., Tian, L., and Lafortezza, R. (2016). Do green spaces affect the spatiotemporal changes of PM 2.5 in Nanjing?. Ecolo. Processes 5, 1–13. doi: 10.1186/s13717-016-0052-6
Climate Change. (2014). Impacts, Adaptation, and Vulnerability. Part A: Global and Sectoral Aspects. Contribution of Working Group II to the Fifth Assessment Report of the Intergovernmental Panel on Climate Change.
Climate Policy Initiative. (2018). Understanding and Increasing Finance for Climate Adaptation in Developing Countries. A CPI Report. Cologne: Climate Policy Initiative.
Cohen, B. (2006). Urbanization in developing countries: current trends, future projections, and key challenges for sustainability. Technol. Soc. 28, 63–80. doi: 10.1016/j.techsoc.2005.10.005
Colson, A., and Cooke, R. (2018). Expert elicitation: using the classical model to validate experts' judgements. Rev. Environ. Econ. Policy 12, 113–132. doi: 10.1093/reep/rex022
Cooke, R. M. (1991). Experts in Uncertainty: Opinion and Subjective Probability in Science. New York, NY: Oxford University Press.
Davis, M. (2004). The urbanization of empire: megacities and the laws of chaos. Soc. Text 22, 9–15. doi: 10.1215/01642472-22-4_81-9
Dey, M. M., Gosh, K., Valmonte-Santos, R., Rosegrant, M. W., and Chen, O. L. (2016). Economic impact of climate change and climate change adaptation strategies for fisheries sector in solomon islands: implication for food security. Marine Policy 67, 171–178. doi: 10.1016/j.marpol.2016.01.004
Di Ruocco, A., Gasparini, P., and Weets, G. (2015). “Urbanisation and climate change in africa: setting the scene,” in Urban Vulnerability and Climate Change in Africa, eds Pauleit S. et al. (Future City: Springer), 4.
Dossou, K. M. R., and Glehouenou-Dossou, B. (2007). The vulnerability to climate change of Cotonou (Benin) the rise in sea level. Environ. Urbanizat. 19, 65–79. doi: 10.1177/0956247807077149
Douglas, I., Kurshid, A., Maryanne, M., Yasmin, M., Louise, M., Jack, C., et al. (2008). Unjust waters: climate change, flooding and the urban poor in Africa. Environ. Urbanizat. 20, 187–205. doi: 10.1177/0956247808089156
Downing, T. E., Patwardhan, A., Klein, R. J. T., Mukhala, E., Stephen, L., Winograd, M., et al. (2005). Assessing vulnerability for climate adaptation. Adaptat. Policy Frameworks Climate Change Develop. Strateg. Policies Measures 5, 67–89. Available online at: https://cgspace.cgiar.org/bitstream/handle/10568/55536/apf%20technical%20paper03.pdf?sequence=1 (accessed March 15, 2021).
Dulal, H. B., Shah, K. U., and Ahmad, N. (2009). Social equity considerations in the implementation of caribbean climate change adaptation policies. Sustainability. 1, 363–383. doi: 10.3390/su1030363
El Banna, M. M., and Frihy, O. E. (2009). Natural and anthropogenic influences in the northeastern coast of the Nile delta, Egypt. Environ. Geol. 57, 1593–1602. doi: 10.1007/s00254-008-1434-6
Ellis, J. (2014). Climate Resilience Indicator Literature Review. British Columbia: Columbia Basin Trust, Golden.
Fan, P., Zutao, O., Nguyen, D. D., Nguyen, T. T. H., Park, H., Chen, J., et al. (2019). Urbanization, economic development, environmental and social changes in transitional economies: Vietnam after Doimoi. Landscape Urban Plann. 187, 145–155. doi: 10.1016/j.landurbplan.2018.10.014
Garschagen, M., and Romero-Lankao, P. (2015). Exploring the relationships between urbanization trends and climate change vulnerability. Clim. Change 133, 37–52. doi: 10.1007/s10584-013-0812-6
Garthwaite, P. H., Kadane, J. B., and O'Hagan, A. (2005). Statistical methods for eliciting probability distributions. J. Am. Statistic. Assoc. 100, 680–701. doi: 10.1198/016214505000000105
Gilchrist, V. J. (1992). “Key informant interviews,” in Research Methods for Primary Care Doing Qualitative Research, eds Crabtree, B. F. and Miller, W. L. (London: Sage Publications, Inc,), 70–89.
Gillanders, B. M. (2007). Seagrasses, fish, and fisheries. Seagrasses Biol. Ecol. Conserv. 7, 503–505. doi: 10.1007/978-1-4020-2983-7_21
Gray, J. S. (1997). Marine biodiversity: patterns, threats and conservation needs. Biodiv. Conserv. 6, 153–175. doi: 10.1023/A:1018335901847
Grimm, N. B., Faeth, S. H., Golubiewski, N. E., Redman, C. L., Wu, J., Bai, X., et al. (2008). Global change and the ecology of cities. Science [Internet]. 319, 756–760. doi: 10.1126/science.1150195
Gupta, J., Termeer, C., Klostermann, J., Meijerink, S., Van den Brink, M., Jong, P., et al. (2010). The adaptive capacity wheel: a method to assess the inherent characteristics of institutions to enable the adaptive capacity of society. Environ. Sci. Policy 13, 459–471. doi: 10.1016/j.envsci.2010.05.006
Hallegatte, S., Green, C., Nicholls, R. J., and Corfee-Morlot, J. (2013). Future flood losses in major coastal cities. Nat. Clim. Change 3, 802–806. doi: 10.1038/nclimate1979
Hambling, T., Weinstein, P., and Slaney, D. (2011). A review of frameworks for developing environmental health indicators for climate change and health. Int. J. Environ. Res. Public Health 8, 2854–2875. doi: 10.3390/ijerph8072854
Hanson, S., Nicholls, R., Ranger, N., Hallegatte, S., Corfee-Morlot, J., Herweijer, C., et al. (2011). A global ranking of port cities with high exposure to climate extremes. Climatic Change 104, 89–111. doi: 10.1007/s10584-010-9977-4
Hardoy, J., and Pandiella, G. (2009). Urban poverty and vulnerability to climate change in Latin America. Environ. Urbaniz. 21, 203–224. doi: 10.1177/0956247809103019
Hemming, V., Burgman, M. A., Hanea, A. M., McBride, M. F., and Wintle, B. C. (2018). A practical guide to structured expert elicitation using the IDEA protocol. Methods Ecol. Evol. 9, 169–180. doi: 10.1111/2041-210X.12857
Hendrix, C. S., and Haggard, S. (2015). Global food prices, regime type, and urban unrest in the developing world. J. Peace Res. 52, 143–157. doi: 10.1177/0022343314561599
Hunt, A., and Paul, W. (2011). Climate change impacts and adaptation in cities: a review of the literature. Clim. Change 104, 13–49. doi: 10.1007/s10584-010-9975-6
IPCC (2014). Climate Change 2014: Impacts, Adaptation, and Vulnerability. Part A: Global and Sectoral Aspects. Contribution of Working Group II to the Fifth Assessment Report of the Intergovernmental Panel on Climate Change. [Field, C.B., V.R. Barros, D.J. Dokken, K.J. Mach, M.D].
IPCC (2019). Summary for Policymakers: IPCC Special Report on the Ocean and Cryosphere in a Changing Climate. [Pörtner, H.-O., Roberts, D. C., Masson-Delmotte, V., Zhai, P., Tignor, M., Poloczanska, E., Mintenbeck, K., Alegría, A., Nicolai, M., Okem, A., Petzold, J., Rama, B., Weyer, N. M. (eds.)].
IPCC (2021). “Summary for policymakers,” in Climate Change 2021: The Physical Science Basis. Contribution of Working Group I to the Sixth Assessment Report of the Intergovernmental Panel on Climate Change [Masson-Delmotte, V., Zhai, P., Pirani, A., Connors, S. L., Péan, C., Berger, S., Caud, N., Chen, Y., Goldfarb, L., Gomis, M. I., Huang, M., Leitzell, K., Lonnoy, E., Matthews, J. B. R., Maycock, T. K., Waterfield, T., Yelekçi, O., Yu, R., and Zhou, B. (eds.)]. Cambridge: Cambridge University Press. In Press.
Jones, S. (2018). City governments measuring their response to climate change. Reg. Stud. 8, 1–10. doi: 10.1080/00343404.2018.1463517
Kabir, R., Khan, H. T. A., Ball, E., and Caldwell, K. (2016). Climate change impact: the experience of the coastal areas of Bangladesh Affected by Cyclones Sidr and Aila. J. Environ. Public Health. 16, 753. doi: 10.1155/2016/9654753
Kissinger, G. M., Herold, M., and Sy, d. e. V. (2012). Drivers of Deforestation and Forest Degradation: A Synthesis Report for REDD+ Policymakers. Vancouver: Lexeme Consulting.
Knol, A. B., Slottje, P., and van der Sluijs, J. P. (2010). The use of expert elicitation in environmental health impact assessment: a seven step procedure. Environ. Health 9, 1. doi: 10.1186/1476-069X-9-19
Krueger, T., Page, T., Hubacek, K., Smith, L., and Hiscock, K. (2012). The role of expert opinion in environmental modelling. Environ. Model. Softw. 36, 4–18. doi: 10.1016/j.envsoft.2012.01.011
Kythreotis, A. P., Jonas, A. E. G., and Howarth, C. (2020a). Locating climate adaptation in urban and regional studies. Reg. Stud. 54, 576–588. doi: 10.1080/00343404.2019.1678744
Kythreotis, A. P., Jonas, A. E. G., Mercer, T. G., and Marsden, T. K. (2020b). Rethinking urban adaptation as a scalar geopolitics of climate governance: climate policy in the devolved territories of the UK. Territ. Politics, Gove. 1–21. doi: 10.1080/21622671.2020.1837220
Lam, V. W. Y., Cheung, W. W. L., and Rashid Sumaila, U. (2016). Marine capture fisheries in the Arctic: winners or losers under climate change and ocean acidification?. Fish Fisher. 17, 335–357. doi: 10.1111/faf.12106
Lauria, V., Das, I., Hazra, S., Cazcarro, I., Arto, I., Kay, S., et al. (2018). Importance of fisheries for food security across three climate change vulnerable deltas. Sci. Total Environ. 640, 1566–1577. doi: 10.1016/j.scitotenv.2018.06.011
Le, T. D. N. (2020). Climate change adaptation in coastal cities of developing countries: characterizing types of vulnerability and adaptation options. Mitig. Adapt. Strateg. Glob. Change 25, 739–761. doi: 10.1007/s11027-019-09888-z
Leichenko, R. L., and Thomas, A. (2012). Coastal cities and regions in a changing climate: economic impacts, risks and vulnerabilities. Geograph. Compass 6, 327–339. doi: 10.1111/j.1749-8198.2012.00495.x
Lewsey, C., Cid, G., and Kruse, E. (2004). Assessing climate change impacts on coastal infrastructure in the Eastern Caribbean. Marine Policy 28, 393–409. doi: 10.1016/j.marpol.2003.10.016
Ludeña, C. E., Yoon, S. W., Sánchez-Aragón, L., Miller, S. J., and Yu, B. K. (2015). “Vulnerability indicators of adaptation to climate change and policy implications for investment projects,” in Inter-American Development Bank, Technical Note No. 858, Washington DC.
Mabon, L., and Shih, W. Y. (2017). Getting buy-in for climate change adaptation through urban planning: climate change communication as a multi-way process. Handbook Clim. Change Commun. 1, 61–75. doi: 10.1007/978-3-319-69838-0_4
Mach, K. J., Kraan, C. M., and Adger, W. N. (2019). Climate as a risk factor for armed conflict. Nature 571, 193–197. doi: 10.1038/s41586-019-1300-6
Martínez, M. L., Intralawan, A., Vázquez, G., Pérez-Maqueo, O., Sutton, P., Landgrave, R., et al. (2007). The coasts of our world: ecological, economic and social importance. Ecolo. Econ. 63, 254–272. doi: 10.1016/j.ecolecon.2006.10.022
McCarthy, M. P., Best, M. J., and Betts, R. A. (2010). Climate change in cities due to global warming and urban effects. Geophysic. Res. Lett. 37, 2845. doi: 10.1029/2010GL042845
McDonald, R. I., Green, P., Balk, D., Fekete, B. M., Revenga, C., Todd, M., et al. (2011). Urban growth, climate change, and freshwater availability. Proceed. Nat. Acad. Sci. 108, 6312–6317. doi: 10.1073/pnas.1011615108
McGranahan, G., Balk, D., and Anderson, B. (2007). The rising tide: assessing the risks of climate change and human settlements in low elevation coastal zones. Environ. Urban [Internet]. 19, 17–37. doi: 10.1177/0956247807076960
McMillan, J. M., Birkmann, J., Tangwanichagapong, S., and Jamshed, A. (2022). Spatial planning and systems thinking tools for climate risk reduction: a case study of the Andaman Coast, Thailand. Sustainability 14, 8022. doi: 10.3390/su14138022
Mercer, J., Kelman, I., Alfthan, B., and Kurvits, T. (2021). Ecosystem-based adaptation to climate change in Caribbean small island developing states: Integrating local and external knowledge. Sustainability 4, 1908–1932. doi: 10.3390/su4081908
Meyer, A. (2019). Good Urban Governance and city resilience: an afrocentric approach to sustainable development. Sustainability 11, 5514. doi: 10.3390/su11195514
Meyer, D. (2006). Caribbean Tourism, Local Sourcing and Enterprise Development: Review of The Literature.
Nicholls, R. J. (2004). Coastal flooding and wetland loss in the 21st century: changes under the SRES climate and socio-economic scenarios. Glob. Environ. Change 14, 69–86. doi: 10.1016/j.gloenvcha.2003.10.007
Nicholls, R. J., Lincke, D., Hinkel, J., Brown, S., Vafeidis, A. T., Meyssignac, B., et al. (2021). A global analysis of subsidence, relative sea-level change and coastal flood exposure. Nat. Clim. Chang. 21, 93. doi: 10.1038/s41558-021-00993-z
Niemeijer, D., and Groot, R. (2008). Framing environmental indicators: moving from causal chains to causal networks. Environ. Develop. Sustain. 10, 89–106. doi: 10.1007/s10668-006-9040-9
Nightingale, A. J. (2017). Power and politics in climate change adaptation efforts: struggles over authority and recognition in the context of political instability. Geoforum 84, 11–20. doi: 10.1016/j.geoforum.2017.05.011
Olazabel, M., Chiabai, A., Foudi, S., and Neumann, M. B. (2018). Emergence of new knowledge for climate change adaptation. Environ. Sci. Policy 83, 46–53. doi: 10.1016/j.envsci.2018.01.017
Pavri, F. (2009). “Urban expansion and sea-Level rise related flood vulnerability for Mumbai (Bombay), India using remotely sensed data,” in Geospatial Techniques in Urban Hazard and Disaster Analysis, (Dordrecht: Springer) 31–49.
Pescaroli, G., and Alexander, D. (2016). Critical infrastructure, panarchies and the vulnerability paths of cascading disasters. Nat. Hazards 82, 175–192. doi: 10.1007/s11069-016-2186-3
Porst, L., and Sakdapolrak, P. (2018). Advancing adaptation or producing precarity? the role of rural-urban migration and translocal embeddedness in navigating household resilience in Thailand. Geoforum 97, 35–45. doi: 10.1016/j.geoforum.2018.10.011
Ruth, M. (2010). Economic and social benefits of climate information: assessing the cost of inaction. Procedia Environ. Sci. 1, 387–394. doi: 10.1016/j.proenv.2010.09.026
Sarah, D., and Soebowo, E. (2017). “Land subsidence threats and its management in the North Coast of Java,” in IOP Conference Series: Earth and Environmental Science, 118.
Satterthwaite, D. (1997). Sustainable cities or cities that contribute to sustainable development?. Urban studies 34, 1667–1691. doi: 10.1080/0042098975394
Schmidt, C. W. (2015). Delta subsidence: an imminent threat to coastal populations. Environ. Health Perspect. 123, A204. doi: 10.1289/ehp.123-A204
Schwoerer, T., Little, J., and Adkison, M. (2019). Aquatic invasive species change ecosystem services from the world's largest wild sockeye salmon fisheries in Alaska. J. Ocean Coast. Econ. 6, 1. doi: 10.15351/2373-8456.1094
Scott, D., Simpson, M., and Sim, R. (2012). The vulnerability of caribbean coastal tourism to scenarios of climate change related sea level rise. J. Sustain. Tour. 20, 883–898. doi: 10.1080/09669582.2012.699063
Scott, D. C., Hall, M., and Gössling, S. (2019). Global tourism vulnerability to climate change. Annal. Tour. Res. 77, 49–61. doi: 10.1016/j.annals.2019.05.007
Sethi, M., Sharma, R., Mohapatra, S., and Mittal, S. (2021). How to tackle complexity in urban climate resilience? negotiating climate science, adaptation and multi-level governance in India. PLoS ONE 16, 1–21. doi: 10.1371/journal.pone.0253904
Sherbinin, D., Schiller, A. A., and Pulsipher, A. (2007). The vulnerability of global cities to climate hazards in Latin America. Environ. Urbaniz. 19, 39–64. doi: 10.1177/0956247807076725
Stuart, J., Yozell, S., and Rouleau, T. (2020). The Climate and Ocean Risk Vulnerability Index: Prioritizing Areas of Action for Coastal Cities. Washington, DC: Stimson Center.
Tanner, T., Bahadur, A., and Moench, M. (2017). Challenges for Resilience Policy and Practice. Washington, DC: Overseas Development Institute.
Terrelonge, S. C. (2007). Sustainable Development and Climate Change in the Caribbean Department of Economics. Jamaica: The University of the West Indies (2007).
Thampanya, U., Vermaat, T., Sinsakul, S., and Panapitukkul, N. (2006). Coastal erosion and mangrove progradation of Southern Thailand. Estuarine, Coast. Shelf Sci. 68, 75–85. doi: 10.1016/j.ecss.2006.01.011
Todd, P. A., Heery, E. C., Loke, L. H. L., Thurstan, R. H., Kotze, D. J., Swan, C., et al. (2019). Towards an urban marine ecology: characterizing the drivers, patterns and processes of marine ecosystems in coastal cities. Oikos 128, 1242. doi: 10.1111/oik.05946
Torabi, E., Dedekorkut-Howes, A., and Howes, M. (2018). Adapting or maladapting: building resilience to climate-related disasters in coastal cities. Cities 72, 295–309. doi: 10.1016/j.cities.2017.09.008
Torabi, E., Dedekorkut-Howes, A., and Howes, M. A. (2021). Framework for using the concept of urban resilience in responding to climate-related disasters. Urban Res. Pract. 21, 71. doi: 10.1080/17535069.2020.1846771
Vargas-Fonseca, E., Olds, A. D., Gilby, B. L., Connolly, R. M., Schoeman, D. S., Huijbers, C. M., et al. (2016). Combined effects of urbanization and connectivity on iconic coastal fishes. Div. Distribut. 22, 1328–1341. doi: 10.1111/ddi.12495
Weatherdon, L. V., Magnan, A. K., Rogers, A. D., Sumaila, U. R., and Cheung, W. W. L. (2016). Observed and projected impacts of climate change on marine fisheries, aquaculture, coastal tourism, and human health: an update. Front. Marine Sci. 16, 48. doi: 10.3389/fmars.2016.00048
Werner, C., Bedford, T., Cooke, R. M., Hanea, A. M., and Morales-Napoles, O. (2017). Expert judgement for dependence in probabilistic modelling: a systematic literature review and future research directions. Euro. J. Operat. Res. 258, 801–819. doi: 10.1016/j.ejor.2016.10.018
Wilks, D. S. (2013). Projecting normals in a nonstationary climate. J. Appl. Meteorol. Climatol. 13, 289–302 doi: 10.1175/JAMC-D-11-0267.1
World Population Review. (2022). Country Dataset. Available online at: https://worldpopulationreview.com/countries/ (accessed September 22, 2020).
Yanda, P. Z., Mabhuye, E., Johnson, N., and Mwajombe, A. (2019). Nexus between coastal resources and community livelihoods in a changing climate. J. Coast. Conserv. 23, 173–183. doi: 10.1007/s11852-018-0650-9
Yang, Z., Wang, T., Leung, R., Hibbard, K., Janetos, T., Kraucunas, I., et al. (2014). Modeling study of coastal inundation induced by storm surge, sea-level rise, and subsidence in the Gulf of Mexico. Nat. Hazards 3, 1771–1794. doi: 10.1007/s11069-013-0974-6
Zanchettin, D., Traverso, P., and Tomasino, M. (2007). Observations on future sea level changes in the Venice lagoon. Hydrobiologia 577, 41–53. doi: 10.1007/s10750-006-0416-5
Zebisch, M., Schneiderbauer, S., Fritzsche, K., Bubeck, P., Kienberger, S., Kahlenborn, W., et al. (2021). The vulnerability sourcebook and climate impact chains–a standardised framework for a climate vulnerability and risk assessment. Int. J. Clim. Change Strateg. Manag. 13, 35–59. doi: 10.1108/IJCCSM-07-2019-0042
Zhang, Y., Wu, T., Arkema, K. K., Han, B., Lu, F., Ruckelshaus, M., et al. (2021). Coastal vulnerability to climate change in China's bohai economic rim. Environ. Int. 147, 21. doi: 10.1016/j.envint.2020.106359
Keywords: climate change, coastal cities, adaptation, urban resilience, structured expert judgement, expert elicitation, vulnerability assessment
Citation: Rouleau T, Stuart J, Call M, Yozell S, Yoshioka N, Maekawa M and Fiertz N (2022) The climate and ocean risk vulnerability index: Measuring coastal city resilience to inform action. Front. Sustain. Cities 4:884212. doi: 10.3389/frsc.2022.884212
Received: 25 February 2022; Accepted: 02 August 2022;
Published: 09 September 2022.
Edited by:
Abdus Salam, University of Dhaka, BangladeshReviewed by:
Mona Webber, University of the West Indies, JamaicaAndrew Paul Kythreotis, University of Lincoln, United Kingdom
Copyright © 2022 Rouleau, Stuart, Call, Yozell, Yoshioka, Maekawa and Fiertz. This is an open-access article distributed under the terms of the Creative Commons Attribution License (CC BY). The use, distribution or reproduction in other forums is permitted, provided the original author(s) and the copyright owner(s) are credited and that the original publication in this journal is cited, in accordance with accepted academic practice. No use, distribution or reproduction is permitted which does not comply with these terms.
*Correspondence: Tracy Rouleau, tracy@tbdeconomics.com
†These authors have contributed equally to this work and share first authorship