Pollinator cultivar choice: An assessment of season-long pollinator visitation among coreopsis, aster, and salvia cultivars
- 1Department of Entomology, College of Agricultural and Environmental Sciences, University of Georgia, Griffin, GA, United States
- 2Department of Horticulture, College of Agricultural and Environmental Sciences, University of Georgia, Griffin, GA, United States
Documented pollinator declines have encouraged the installation of pollinator plantings in residential, commercial and agricultural settings. Pollinator visitation among cultivars of coreopsis, salvia and asters was compared on 40 dates in a 2-year study resulting in 6,911 pollinator observations across all plant taxa with bees, butterflies and syrphids well-represented. Diversity of insect visitors was represented differently within the broad plant taxa salvia, coreopsis and asters. The most frequent visitors to coreopsis were the small bees with over 77% of visitors falling into this category. Salvia was most frequently visited by honey bees (36.4%) and carpenter bees (24%), although all the groups were represented. Syrphids were the group most commonly observed on asters (58.5%) with nearly 40% of the visitors being bee species. Nectar analysis was performed on salvia cultivars. However, differential attraction of pollinators to salvia cultivars could not be explained by volume of nectar produced per plant. Results from our cultivar comparisons provide data-based information to assist consumers in plant choice and present opportunities for future plant-specific pollinator census initiatives across a broader geographic range.
Introduction
Attracting beneficial arthropods to garden and landscape areas can increase insect biodiversity, promote arthropod-mediated ecosystem services, and overall ecological health (Häussler et al., 2017). Documented pollinator declines have encouraged the installation of pollinator plantings in residential, commercial and agricultural settings. An analysis of wild bee population dynamics over time (Turley et al., 2022) found that about one third of bee species showed at least some evidence of decline in a 6-year span. Prendergast et al. (2022) conducted a comprehensive review of native bee assemblages in urban landscapes, reviewing 215 studies. Recommendations from their review included having plant managers (gardeners, homeowners, nurseries and landscape managers) focus on flowers that have been demonstrated to be visited by wild bees in the region, especially native species.
Regionally appropriate plant lists of trees, shrubs and flowers that attract and support pollinators are good resources to consult for landscape design or renovation (e.g., Harris et al., 2016; Braman et al., 2017; Braman and Quick, 2018; Mach and Potter, 2018; Smitley et al., 2019). Non-native, non-Apis bees were determined to be significantly more abundant visitors to non-native vs. native plants, especially Osmia taurus Smith and Megachile sculpturalis (Smith) (Potter and Mach, 2022). Those offers suggested that planting of favored non-native hosts could have the unintended consequence of facilitating the spread of non-native, non-Apis bees in urban areas. As improved propagation methods facilitate breeding and production (Lewis et al., 2020) and our understanding of the influence of cultivars vs. species increases (Poythress and Affolter, 2018), more native plant species and cultivars will become available in the ornamental plant trade that have been bred specifically to attract and support pollinators. Currently there are a great many ornamental plant cultivars available on the market, yet there is little empirical information available to guide consumer choice regarding attractiveness to pollinators (Garbuzov and Ratnieks, 2014; Rollings and Goulson, 2019). Here we present data on the attractiveness of 19 cultivars of salvia, coreopsis and asters.
Materials and methods
Plants and trial plots
This study was conducted at the University of Georgia Research and Education Garden on the UGA Griffin Campus (Spalding Co.; 33°24'67”N, 84°26'40”W). Cultivar trial plots were established during fall 2016. Salvia, coreopsis, and aster cultivars were each established in their own separate plots within the 24.3-hectare Research Garden. Plants were chosen to reflect new series and standards in the horticulture industry and commercial availability. Salvia cultivars included in this study were Salvia greggii “Radio Red”, Salvia guaranitica “Black and Blue”, Salvia microphylla x greggii “Heat Wave Blast”, “Heat Wave Blaze”, “Heat Wave Glitter”, “Heat Wave Sparkle” and Salvia nemorosa “Steel Blue”. Coreopsis cultivars were Coreopsis lanceolata hybrid “Desert Coral”, a hybrid cross of Coreopsis auriculata “Zamfir” (female parent) and Coreopsis lanceolata “Early Sunrise” (male parent) “Jethro Tull”, Coreopsis verticillata Sizzle and Spice? series “Hot Paprika”, Coreopsis Solanna? “Golden Sphere” and Coreopsis verticillata “Sylvester”. Aster cultivars were Ampelaster carolinianus “Climbing Aster”, Symphyotrichum grandiflorum “Wild Blue”, Symphyotrichum ericoides “Heath Aster”, Aster oblongifolius “Jane Bath”, Aster oblongifolius “Rachel Jackson”, Aster tataricus “Jindai” and Symphyotrichum novae-angliae “English Countryside”. Plants were provided by regional plant nurseries as trade-gallon size transplants and were planted on 0.9 m centers. There were three plants per replication and six to eight replications per cultivar (six asters, seven coreopsis and eight salvia replications × three plants per replication) planted in a randomized complete block design. Blocks were 4.6 m apart. Plots= blocks were mulched with pine bark and drip irrigated with water being applied at first sign of wilt.
Insect observations
Insect observations began at first flowering and were made weekly during the flowering period for 2 years. Observations were made between 1,000 and 1,400 h unless rain or high wind impeded observations. While some pollinators are active before and after this window, it is a standard period for assessment when flower visitation is most frequent. All plants that had reached anthesis were observed on the same day. Number of insect visitors during a 1-min time span per replication was recorded in six categories: honey bees (Apis mellifera), bumble bees (Bombus spp.), carpenter bees (Xylocopa sp.), small (all other) bees (Hymenoptera), hoverflies (Diptera: Syrphidae) and butterflies (Lepidoptera). Visual observations were recorded on 14 dates for asters in September and October over 2 years, 25 dates for coreopsis from May-August, and 40 dates for salvia from April-October spanning 2 year's growing seasons. Additional hand netting approximately monthly allowed finer taxonomic resolution of some bees visiting the plants. Bees were mounted and identified to the lowest possible taxonomic resolution (Table 1) using a combination of print and online keys (Mitchell, 1960; Bouseman and LaBerge, 1978; http://www.discoverlife.org; Ascher, 2017).
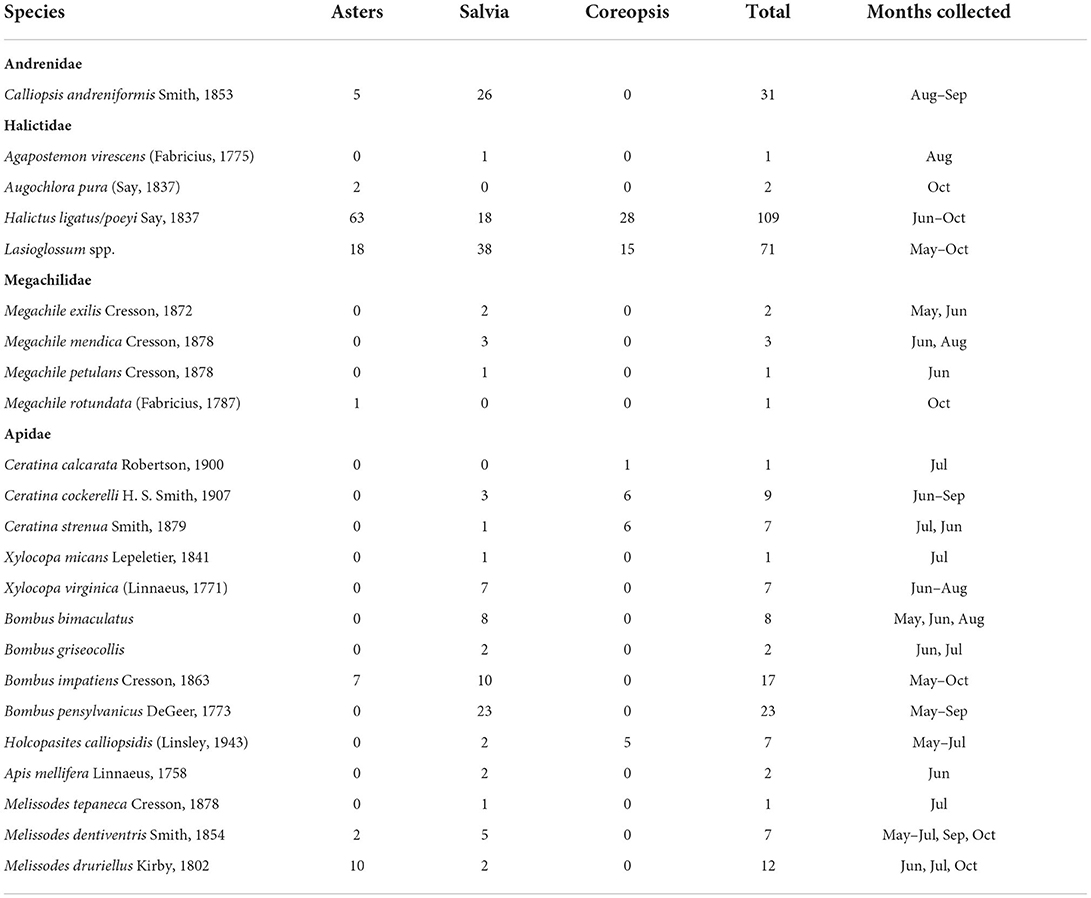
Table 1. Bee species collected in 2017 and 2018, from ornamental cultivar trials in the University of Georgia Research and Education Garden (Spalding Co., GA; 33°24'67”N, 84°26'40”W).
Salvia nectar analysis
In mid-June 2017, five of the salvias were subjected to nectar sampling. Salvia nemorosa “Steel Blue” was excluded because by that time, it had passed peak anthesis. For comparison purpose, an additional cultivar, Salvia microphylla x greggii “Hot Lips” in nearby demonstration gardens was also included in the analysis. Nectar was allowed to accumulate for 24 h in flowers from which insects were excluded by means of fine netting (organza bags placed over five flower spikes per plant). A hand-held refractometer was used to measure sugar content as degrees Brix (°Bx, grams of sugar in 100 g solution). Following methodology by Hicks et al. (2016) microcapillary tubes (5 μL) were used to remove nectar, with individual flowers yielding 2–3 μL of fluid. The refractometer was rinsed with deionized water and dried after each sample. The number of open flowers was counted and recorded for each plant and total sugar content per plant calculated as a product of sugar and number of flowers.
Data analysis
Visual observations of insect visitors to the cultivars were analyzed for each main plant taxon. The data were analyzed using a generalized linear mixed model (PROC GLIMMIX, SAS Institute Inc., 2013). Differences in least square means were determined by pairwise t-tests (alpha = 0.05) as the multiple comparisons post-hoc test to determine significant differences between levels of all factors. Data from coreopsis, salvia and asters were analyzed separately, and no direct comparison among these main taxa was attempted. Data analysis on salvia flower nectar and number of flowers was performed using ANOVA with mean separation through Tukey's Honestly Significant Difference Test.
Results
Insect observations
Data collected during this two-year study comprised 6,911 pollinator observations across all plant taxa with bees, butterflies and syrphids well-represented (Figures 1–3). Relative abundance of insect taxa across all plant taxa and both years (Figure 4) revealed 62% bees, 4.2 % butterflies, and 33.8% hover flies. Among the bees, 21.7% were honey bees, 7.6% were bumble bees, 9.3% carpenter bees and 23.5% other or small bees. This diversity of insect visitors was represented differently within the broad plant taxa salvia, coreopsis and asters (Figure 4). The most frequent visitors to coreopsis were the small bees with over 77% of visitors falling into this category. Salvia was most frequently visited by honey bees (36.4%) and carpenter bees (24%), although all the groups were represented. Syrphids were the group most commonly observed on asters (58.5%) with nearly 40% of the visitors being bee species.
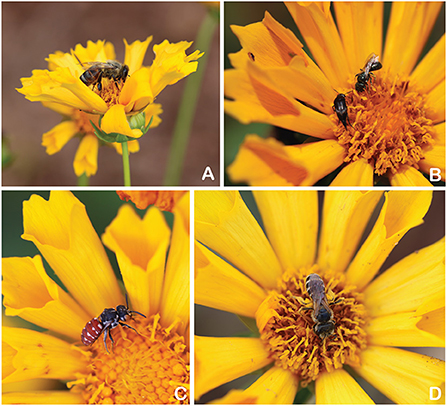
Figure 1. Flower visitors observed on coreopsis: (A) Apis mellifera, (B) Ceratina sp., (C) Holcopasites sp., and (D) Halictus sp.
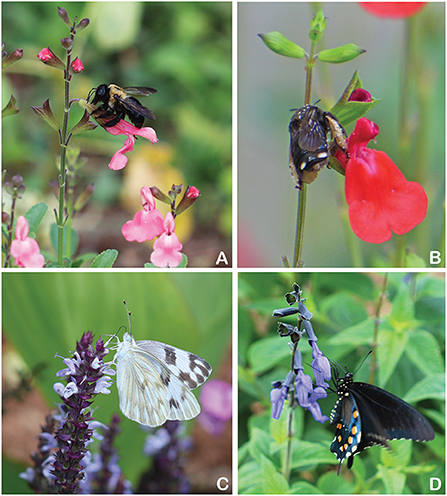
Figure 2. Flower visitors observed on salvia: (A) Xylocopa sp., (B) Melissodes sp., (C) Pieridae, and (D) Papilionidae.
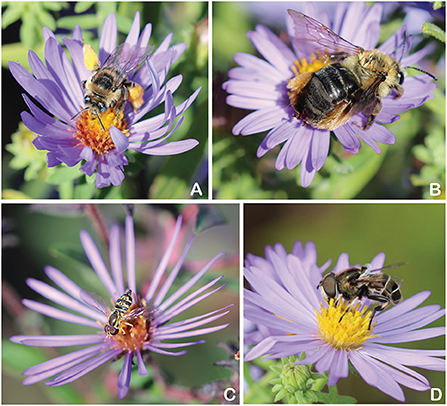
Figure 3. Flower visitors observed on aster: (A) Melissodes sp., (B) Svastra sp., and (C) Syrphidae, (D) Syrphidae.
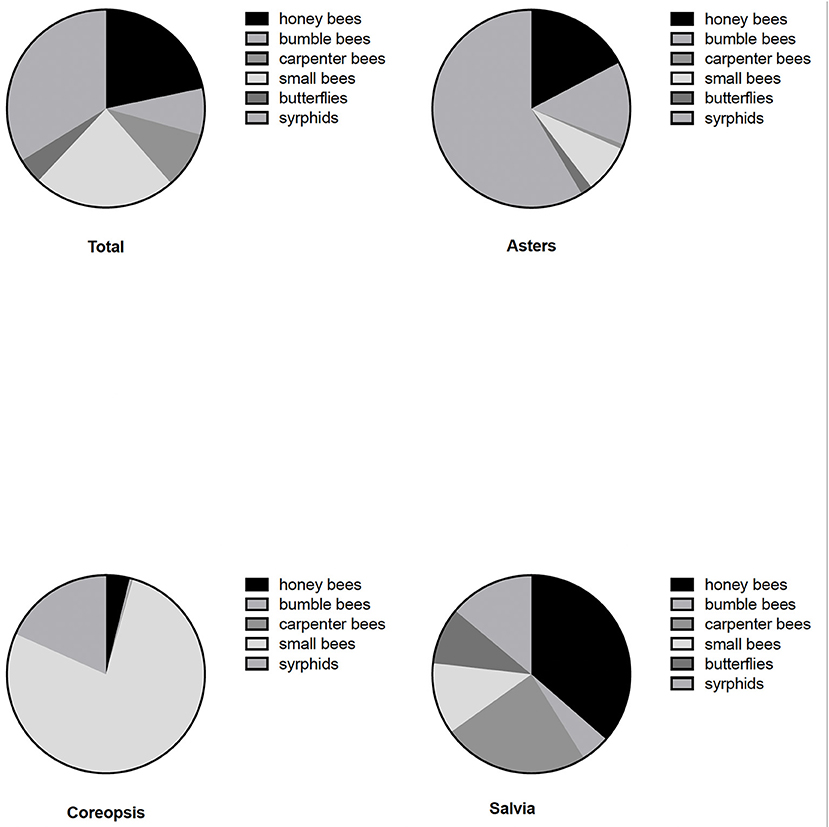
Figure 4. Relative abundance of insects in six main groups (legend moves clockwise in each figure) recorded over 2 years at the University of Georgia Research and Education Garden on asters, salvia and coreopsis. More detailed taxonomic breakdowns of bee species are given in Table 1.
Of the 325 individual bees collected for greater taxonomic resolution, 23 bee species representing four families and 12 genera were collected between February and October from the aster, salvia, and coreopsis flower cultivars and plots (Table 1). Six species were collected from coreopsis cultivars, 20 species from salvia cultivars and eight species from asters. Additional species collected during preliminary sampling in the plot area prior to regular sampling included Svastra obliqua (Say) on asters, Lasioglossum (Dialictus) imitatum (Smith) on asters and coreopsis, Lasioglossum (Dialictus) mitchelli Gibbs on Coreopsis and Colletes americanus Cresson on asters.
Relative abundance of the six insect groups evaluated varied significantly among cultivars within plant taxa (Figures 5–7). “Hot Paprika” coreopsis was the most frequently visited cultivar by bees and by total flower visitors (P < 0.0001; Figure 5) although all cultivars were visited by the insects of interest. Total bees and total flower visitors were most often and equally observed on “Jane Bath” and “Rachel Jackson” asters among the cultivars evaluated (P < 0.0001; Figure 6). Total bees and total flower visitors were most frequently observed on the Heat Wave series cultivar “Blaze” salvia (P < 0.0001; Figure 7), with “Glitter” being visited least often by total flower visitors.
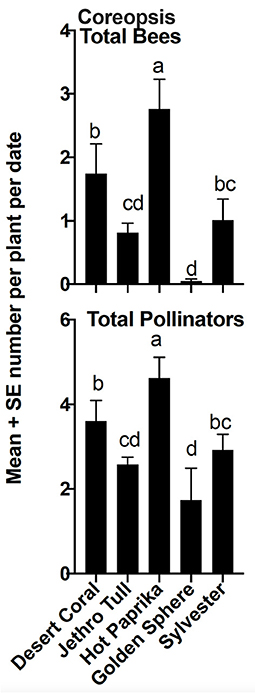
Figure 5. Mean ± se total bees and total flower visitors (pollinators) comparison among coreopsis cultivars in a 2-year study in central Georgia, USA. The superscript alphabets means with the same letters are not significantly different, p > 0.05.
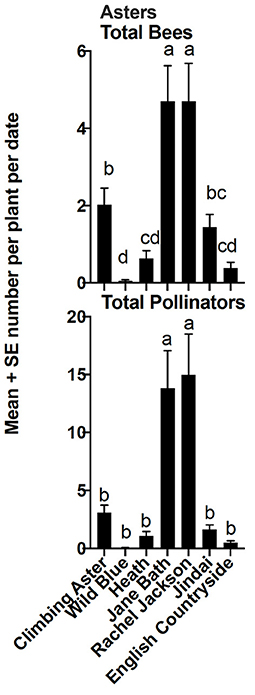
Figure 6. Mean ± se total bees and total flower visitors (pollinators) comparison among aster cultivars in a 2-year study in central Georgia, USA. The superscript alphabets means with the same letters are not significantly different, p > 0.05.
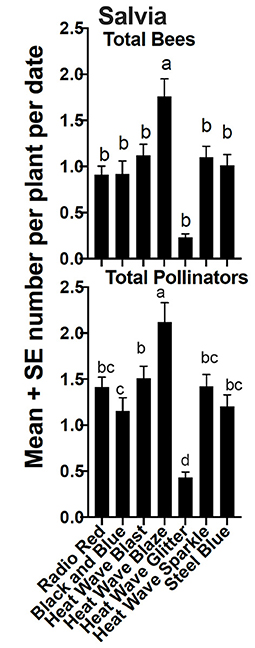
Figure 7. Mean ± se total bees and total flower visitors (pollinators) comparison among salvia cultivars in a 2-year study in central Georgia, USA. The superscript alphabets means with the same letters are not significantly different, p > 0.05.
While the above-mentioned cultivars were the most or least- frequently visited across the trial period, expected seasonal variation did occur. All salvia cultivars, for example, were visited by pollinators during the course of the 2-year study, with frequency of visitation by cultivar not surprisingly also varying by date (P < 0.0001; Figure 8). Cultivar “Steel Blue”, for example, was often most frequently visited earlier in the season, corresponding with bloom. “Blaze”, the overall most frequently visited cultivar, was more often visited as the season progressed compared to early visitation observed on “Steel Blue”.
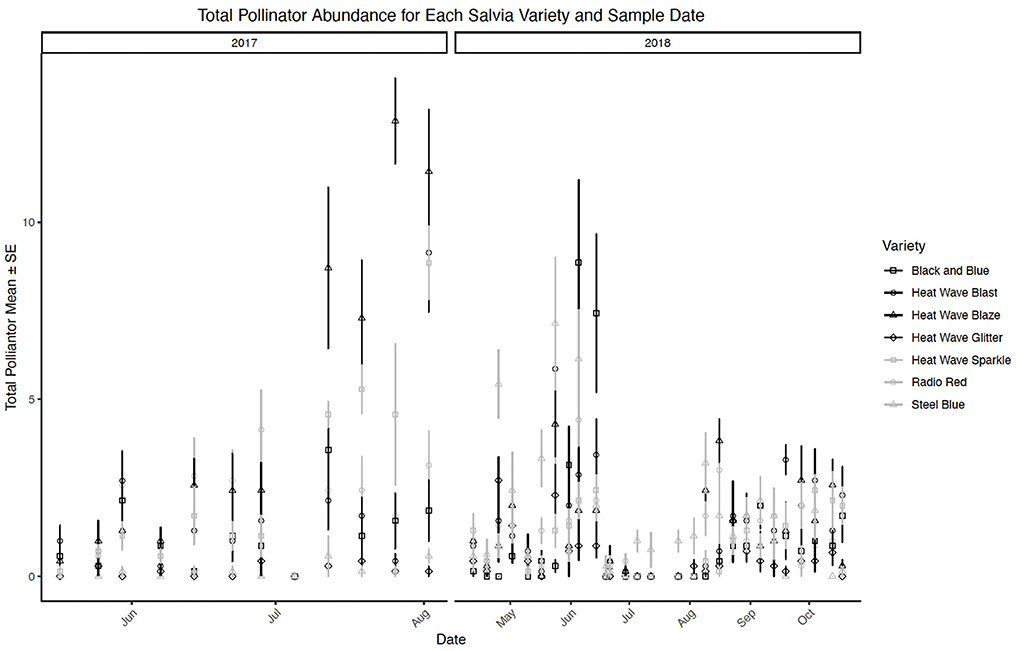
Figure 8. Mean ± se total flower visitors (pollinators) comparison among salvia cultivars by date in a 2-year study in central Georgia, USA.
Salvia nectar analysis
Nectar sugar content in salvias ranged from 22.9 to 30.4°Bx, and did not differ statistically among the six cultivars (P > 0.05; Figure 9). Number of open flowers ranged from 10 to 39, and was highest in S. “Radio Red”, and lowest in S. “Hot Lips”. When total amount of nectar (product of number of flowers and Bx) was calculated, S. “Hot Lips” had the lowest value, while S. “Radio Red” had the highest (data not shown). Yet, S. “Blaze,” which had the highest number of flower visitors, did not differ significantly from either cultivar with respect to total amount of nectar. Therefore, the higher attraction of pollinators to S. “Blaze” could not be explained by volume of nectar produced per plant. Flower tube length has been shown to be important in impacting the type of pollinators; nectaries at the bottom of longer corolla typically can be accessed by insects with longer tongues (e.g., long-tongued bees and lepidopterans). The corolla width is also important as wider corollas allow access of smaller bees which crawl inside to reach the nectaries. In our study, flower number did vary significantly among salvia cultivars, with “Radio Red” having the highest number, and “Hot Lips” the lowest number. While “Blaze” had the highest number of visitors, it did not differ significantly from either of these cultivars in terms of total nectar volume it produced. The number of flowers were not significantly different between “Blaze” and “Radio Red”. Based on our findings, flower number could not explain the different number of pollinators observed on the salvia cultivars.
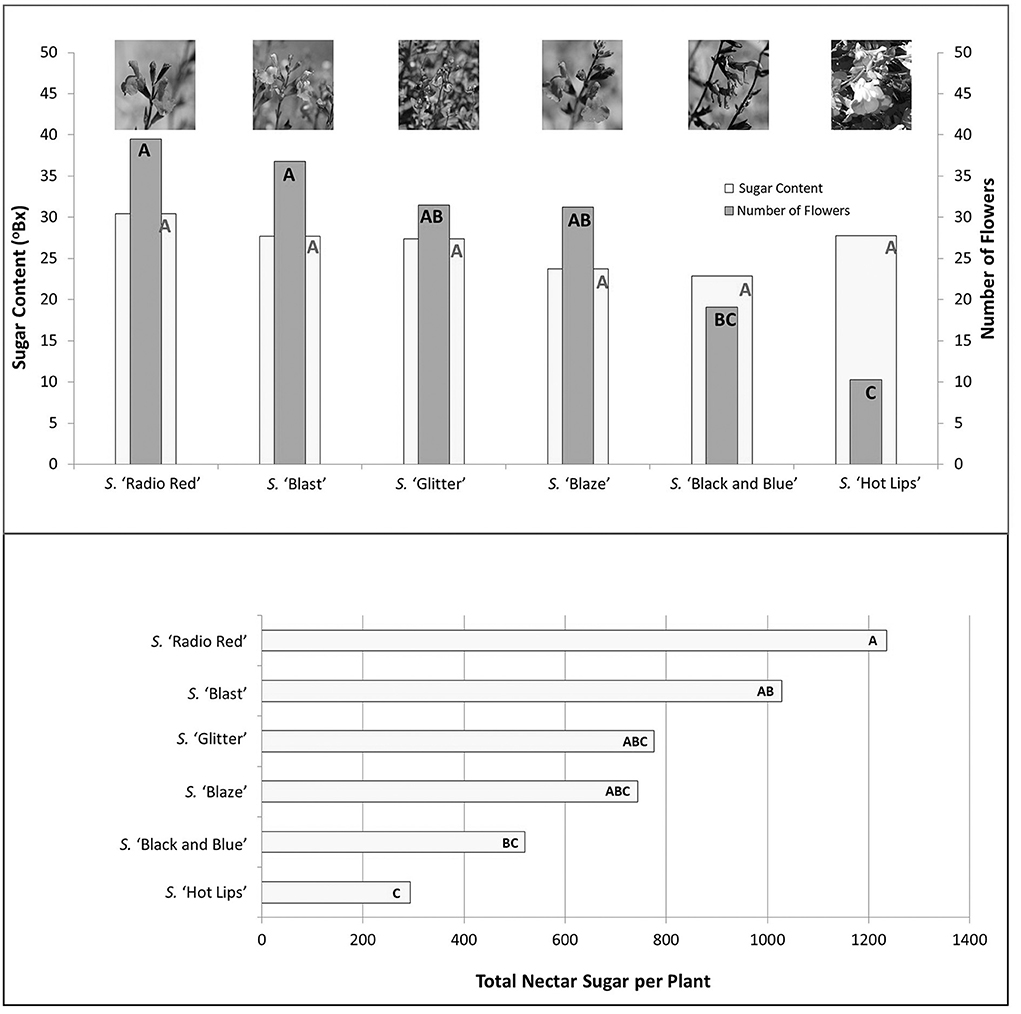
Figure 9. Salvia nectar sugar content, number of flowers and total nectar per plant for six salvia cultivars measured in mid-June 2017. Bars that share the same letters are not significantly different at P < 0.05 level.
Discussion
These data show that there is a wide variety of options among cultivars of salvia, coreopsis, and asters for garden design that will attract a diverse community of pollinators and meet the goal of making pollinator-friendly spaces. The plant taxa selected, while representing a small faction available to consumers (limited by our space and funding), are known to attract pollinators. Yet, there was considerable variation in the visitation rates by pollinators among the cultivars. This variation could be attributed to a variety of sources. Previous studies have demonstrated that floral abundance and nectar quality positively affect insect visitation (e.g., Fowler et al., 2016). However, these results do not support this relationship as the higher attraction of pollinators to S. “Blaze” could not be explained by the volume of nectar produced per plant. Other site-specific variables could account for this variation.
Other sources of variation we observed over the 2 years is believed to be (at least in part) due to natural seasonal or annual variation in insect populations. Insects, especially bees and hoverflies can be attracted in large numbers with a demonstrated season-long difference in distribution among the plant taxa studied here. While it is common to consider how variation in location, soil type, or other microclimatic conditions could affect localized response of pollinator plant choice, previous related studies (e.g., Garbuzov and Ratnieks, 2014) show that results can apply generally to a wider area and are not necessarily year- or location-specific. Most insect species or groups we recorded are commonly observed, so they would be present in almost any area, but not necessarily in the same proportions. This further supports the generalizability of our findings.
In other pollinator-related studies, data collection methods are commonly considered for how they affect external application of the results (Packer and Darla-West, 2021). Methods for recording visual observations of pollinator visitation used in this study lend themselves well and have been used in citizen science initiatives to promote awareness, increase pollinator spaces, and gather useful data via “the Great Georgia Pollinator Census,” now in its fourth year (Griffin and Braman, 2018, 2021; Griffin et al., 2021, 2022). Observation and recording of broad taxonomic categories loses taxonomic resolution, but provides opportunity for citizen engagement by large numbers of samplers/observers who can be trained to recognize the broader taxonomic categories. One important goal of the census is to promote the creation of sustainable pollinator habitat. The maps shown on the Pollinator Census website https://ggapc.org/census-data-2/ show the 1,861 gardens across Georgia created as a result of the project by year. Clearly, there is increasing interest in planting for pollinators (Braman and Griffin, 2022). A recent study (Janvier et al., 2022) reported results from pan trap sampling 50 residential sites in and around Athens, Clarke Co., GA and documented 110 species of bees occurring in these urban and peri urban habitats. Twenty-two of the bee species collected directly from flowers reported in the present study were also represented in Janvier et al., thus further demonstrating the similarity and reliability of our collection methods.
Conclusion
Results from our cultivar comparisons in the present project provide additional data-based information to assist consumers in plant choice. While specific recommendations are limited, as these results are not the result of exhaustive comparisons, we can identify some target cultivars to consider for future study. Furthermore, our findings support more detailed assessment of floral characteristics that may determine pollinator preference to floral cultivars and species. As pollinator communities continue to suffer declines, and the need for providing floral resources increases across many urban areas, we advocate for future plant-specific pollinator census initiatives across a broader geographic range.
Data availability statement
The raw data supporting the conclusions of this article will be made available by the authors, without undue reservation.
Author contributions
All authors listed have made a substantial, direct, and intellectual contribution to the work and approved it for publication.
Funding
This project is based on research that was partially supported by the Georgia Agricultural Experiment Station with funding from the Hatch Act (Accession Number 224057) through the USDA National Institute of Food and Agriculture.
Acknowledgments
We thank Ben Gochnour, Saxan Adams, and Martha Sikora for technical assistance provided for the duration of this study and Jerry Davis for statistical assistance. We thank Carol Robacker and David Buntin for their comments on an earlier draft that have improved the manuscript. Plants were provided by Thunderwood Farms, Woodbury, GA and Goodness Grows Nursery, Lexington, GA.
Conflict of interest
The authors declare that the research was conducted in the absence of any commercial or financial relationships that could be construed as a potential conflict of interest.
Publisher's note
All claims expressed in this article are solely those of the authors and do not necessarily represent those of their affiliated organizations, or those of the publisher, the editors and the reviewers. Any product that may be evaluated in this article, or claim that may be made by its manufacturer, is not guaranteed or endorsed by the publisher.
References
Ascher, J. S. (2017). Discover Life Species Guides. Available online at: http://www.discoverlife.org/ (accessed May 12, 2007).
Bouseman, J. K., and LaBerge, W. E. (1978). A revision of the bees in the genus Andrena of the western hemisphere. Part IX. Subgenus Melandrena. Transact. Am. Entomol. Soc. 104, 275–389.
Braman, S. K., and Griffin, B. (2022). Opportunities for and impediments to pollinator conservation in urban settings: a review. J. Integr. Pest Manag. 13, 1–15 doi: 10.1093/jipm/pmac004
Braman, S. K., Pennisi, S., Benton, E., and Toal, K. (2017). Selecting Trees and Shrubs as Resources for Pollinators. University of Georgia, CAES Extension Bulletin 1483. Available online at: http://extension.uga.edu/publications/detail.html?number=B1483PDF (accessed June 13, 2022).
Braman, S. K., and Quick, J. C. (2018). Differential bee attraction among crape myrtle cultivars (Lagerstroemia spp.: Myrtales: Lythraceae). Environ. Entomol. 47, 1203–1208. doi: 10.1093/ee/nvy117
Fowler, R. E., Rotheray, E. L., and Goulson, D. (2016). Floral abundance and resource quality influence pollinator choice. Insect Conserv. Divers. 9, 481–494. doi: 10.1111/icad.12197
Garbuzov, M, and Ratnieks, F. L. W. (2014). Quantifying variation among garden plants in attractiveness to bees and other flower-visiting insects. Funct. Ecol. 28, 364–374. doi: 10.1111/1365-2435.12178
Griffin, B., and Braman, K. (2018). Expanding pollinator habitats through a statewide initiative. J. Extens. 56, 16. Available online at: https://tigerprints.clemson.edu/joe/vol56/iss2/16
Griffin, B., Braman, R., Yaza, S., and Griffin, M. (2021). The strategic use of multimedia in the Great Georgia Pollinator Census citizen science project. Citizen Sci. 6, 1–13. doi: 10.5334/cstp.334
Griffin, B., and Braman, S.K. (2021). School and community garden pollinator census: a Pilot Project in Georgia. J. Entomol. Sci. 56, 287–304. doi: 10.18474/JES20-38
Griffin, B., LaTora, A. G., Bhattarai, U., and Braman, S. K. (2022). Knowledge gleaned from the first great Georgia pollinator census. J. Entomol. Sci. 57, 39–63. doi: 10.18474/JES21-05
Harris, B. A., Braman, S.K., and Pennisi, S.V. (2016). Influence of plant taxa on pollinator, butterfly, and beneficial insect visitation. HortScience 51, 1016–1019. doi: 10.21273/HORTSCI.51.8.1016
Häussler, J., Sahlin, U., Baey, C., Smith, H.G., and Clough, Y. (2017). Pollinator population size and pollination ecosystem service responses to enhancing floral and nesting resources. Ecol. Evol. 7, 1898–1908. doi: 10.1002/ece3.2765
Hicks, D. M., Ouvrard, P., Baldock, K. C., Baude, M., Goddard, M. A., Kunin, W. E., et al. (2016). Food for pollinators: quantifying the nectar and pollen resources of urban flower meadows. PLoS ONE 11, e0158117. doi: 10.1371/journal.pone.0158117
Janvier, A. J., Ulyshen, M.D., Braman, C. A., Traylor, C., Edelkind-Vealey, M., and Braman, S. K. (2022). Scale-dependent effects of landscape context on urban bee diversity. J. Insect Conserv. 26, 697–709. doi: 10.1007/s10841-022-00402-6
Lewis, M., Chappell, M., Thomas, P., Zhang, D., and Greyvenstein, O. (2020). Development of a vegetative propagation protocol for Asclepias tuberosa. Native Plants J. 21, 27–34. doi: 10.3368/npj.21.1.27
Mach, B. M., and Potter, D. A. (2018). Quantifying bee assemblages and attractiveness of flowering woody landscape plants for urban pollinator conservation. PLoS ONE 13, e0208428. doi: 10.1371/journal.pone.0208428
Mitchell, T. B. (1960). Bees of the Eastern United States. Raleigh, NC: North Carolina Agricultural Experiment Station.
Packer, L., and Darla-West, G. (2021). “Bees: how and why to sample them,” in Measuring Arthropod Biodiversity, eds J. C. Santos, and G. W. Fernandes (Cham: Springer).
Potter, D. A., and Mach, B. M. (2022). Non-native non-Apis bees are more abundant on non-native versus native flowering woody landscape plants. Insects 13, 238. doi: 10.3390/insects13030238
Poythress, J. C., and Affolter, J. M. (2018). Ecological value of native plant cultivars versus wild-type native plants for promoting Hemipteran diversity in suburban areas. Environ. Entomol. 47, 890–901. doi: 10.1093/ee/nvy057
Prendergast, K. S., Dixon, K. W., and Bateman, P. W. (2022). A global review of determinants of native bee assemblages in urbanized landscapes. Insect Conserv. Divers. 15, 385–405. doi: 10.1111/icad.12569
Rollings, R., and Goulson, D. (2019). Quantifying the attractiveness of garden flowers for pollinators. J. Insect Conserv. 23, 803–817. doi: 10.1007/s10841-019-00177-3
Smitley, D., Brown, D., Elsner, E., Landis, J. N., Shrewsbury, P. M., Herms, D. A., et al. (2019). Protecting and enhancing pollinators in urban landscapes for the US north central region. MSU Extens. Bull. E3314, 1–30.
Keywords: biodiversity conservation, ecosystem services, bees, perennials, cultivar choice, ornamentals, pollinators
Citation: Braman SK, Pennisi SV, Fair CG and Quick JC (2022) Pollinator cultivar choice: An assessment of season-long pollinator visitation among coreopsis, aster, and salvia cultivars. Front. Sustain. Cities 4:988966. doi: 10.3389/frsc.2022.988966
Received: 07 July 2022; Accepted: 07 September 2022;
Published: 26 September 2022.
Edited by:
Guaraci Duran Cordeiro, Universidade Federal de Goiás, BrazilReviewed by:
David Inouye, Rocky Mountain Biological Laboratory, United StatesChun-Feng Yang, The Chinese Academy of Sciences (CAS), China
Copyright © 2022 Braman, Pennisi, Fair and Quick. This is an open-access article distributed under the terms of the Creative Commons Attribution License (CC BY). The use, distribution or reproduction in other forums is permitted, provided the original author(s) and the copyright owner(s) are credited and that the original publication in this journal is cited, in accordance with accepted academic practice. No use, distribution or reproduction is permitted which does not comply with these terms.
*Correspondence: S. K. Braman, kbraman@uga.edu
†These authors have contributed equally to this work and share first authorship
 S. K. Braman1*†
  S. V. Pennisi
 C. G. Fair