Solving the mysteries of Lahore smog: the fifth season in the country
 Rabia Majeed1
  Muhammad Shehzaib Anjum2
  Muhammad Imad-ud-din1†
  Suhaib Malik3 Muhammad Naveed Anwar4,5 Bilal Anwar6
  Muhammad Fahim Khokhar1*
- 1Institute of Environmental Sciences and Engineering, National University of Sciences and Technology, Islamabad, Pakistan
- 2Department of Marine, Earth, and Atmospheric Sciences, North Carolina State University, Raleigh, NC, United States
- 3Gilgit Baltistan Environmental Protection Agency, Gilgit, Pakistan
- 4Air Quality Research Center, University of California, Davis, Davis, CA, United States
- 5Sustainable Development Study Center, Government College University, Lahore, Pakistan
- 6National Disaster Risk Management Fund, Islamabad, Pakistan
South Asian smog is an annually recurring air pollution event that is characterized by high concentrations of air pollutants, low visibility, and severe socio-economic disruptions. It is most frequently observed across the north-western parts of the Indo-Gangetic Plains (IGP). Since 2016, it has become so frequent and pervasive that they are colloquially referred to as “the fifth season” in the region. During this season populations residing in this area including cities such as Lahore, Amritsar, Faisalabad, Multan, Delhi etc. are exposed to hazardous levels of air pollution. This study attempts to understand the reasons for the recent increase in the intensity and frequency of intense air pollution episodes by utilizing ground-based and satellite observations. Time-series analysis, seasonal and annual variations in PM2.5 and AOD were carried out. Satellite data of UVAAI, CO, and fire count were used to determine the fire incidences and aerosol characterization. The results indicate that during the last decade, there has been an increase in air pollution sources while crop residue burning, and motor vehicles have greatly contributed to the increased frequency and intensity of such events. The meteorological and topographical data analysis revealed that the IGP provides ample cloud-condensation nuclei and optimum conditions for the accumulations of pollutants, especially in the post-monsoon and winter periods. The Mann-Kendall test was performed to confirm the annual and seasonal trends of PM2.5. The major cities of South Asia such as Lahore, Delhi, Kathmandu, and Dhaka have recently shown a decreasing trend with respect to annual AOD. However, an increase has been observed for the period of post-monsoon especially for cities of Lahore and Delhi. To distinguish potential sources of air pollutants during extreme smog episodes in the region, Analytical Hierarchy Process (AHP) was conducted to estimate the most contributing factors to the annual smog episodes. According to the data, the transboundary pollution resulting from open-field agriculture fires has been assigned moderate importance over vehicular emissions. A HYSPLIT trajectory model coupled with ground observations and satellite data shows that the agricultural fires do have a profound impact on the air quality of the region. It highlights the importance of transboundary pollution and cooperation among cities, regions, and countries across the shared airshed of the Indo-Gangetic Plains.
1 Introduction
South Asia is one of the most polluted, densely packed, and least integrated regions in the world. Its population of 1.8 billion has endured some of the most unprecedented crises in human history and now they are confronted with the challenges of air pollution in both the socio-economic and environmental context. The extensive human activities and stable meteorological conditions trigger a remarkable increase in aerosol loads that have been observed over this region. South Asia has officially outpaced China as the world's most polluted region. According to recent studies, an increase in aerosol loads over South Asia is witnessed, contrary to the observed decrease over East Asia (China) (Ramachandran et al., 2020; Ratnam et al., 2021). South Asian cities are regularly reported among the world's most polluted cities (Khokhar et al., 2021, 2023). In 2021, 43 of the world's 50 most polluted cities were located in India, Pakistan and Bangladesh (IQAir, 2021).
The meteorological and topographic features of the study region also support the accumulation and retention of air pollutants. The highly irrigated region of the Indo-Gangetic Plain (IGP) provides abundant cloud condensation nuclei (loose alluvial sediments and high anthropogenic activities), plenty of moisture for the accumulation of air pollutants (Mishra et al., 2020; Ojha et al., 2020; Verma et al., 2022). This is further strengthened by the stable meteorology and the “valley effect” created by the topographical features (Hindukush-Karakoram-Himalaya Mountain ranges) and is most prominent during the post-monsoon and winter seasons (Resmi et al., 2019).
Since the past few years, the recurring air pollution episodes have devastated the lives of citizens across South Asia and due to frequent occurrences have been labeled as “the fifth season” in the region. The “fifth season” is a new addition to the region's climatology and has been observed most prominently during the post-monsoon season (October to November). During this period across the IGP, the extreme air pollution episodes manifest most commonly as conditions of low visibility, driven by increased concentration of atmospheric pollutants (Khokhar et al., 2017; Morawska et al., 2021). The winter fog and smog episodes depend largely on regional and local meteorological conditions such as relative humidity, wind patterns, and dew point temperature. At the time of crop residue burning, prevailing winds support air pollution dispersion as compared to stable atmospheric conditions in the foggy winter season (Bilal et al., 2022). The hygroscopic growth of aerosol is favored by high relative humidity (RH) which increases the concentration of aerosols in the environment. High RH is also conducive to the formation of new aerosol particles through the secondary reaction of gases increases pollution levels by PM mass concentration and reduces visibility (Tao et al., 2015). Literature highlights that approximately 88% of RH has been observed during the morning hours and is responsible for increased aerosol concentration by photochemical reactions and secondary particulate matter formation (Zhang et al., 2023). In Pakistan and India, the haze and fog conditions are higher in areas where the rate of anthropogenic emissions is high due to urban-industrial activities, which increases the loads of aerosol pollution. The emission of smoke from vehicular and agricultural burning activities during wintertime gives rise to the formation of fog near the ground due to temperature inversion and weather conditions, as observed in a study conducted in Punjab and Haryana of India that resulted in intense smog in Lahore (Bilal et al., 2022). In Pakistan, the reduced visibility incidences cause socio-economic disruptions along the plains of Punjab province, most prominently in major cities like Lahore, Faisalabad, Gujranwala, and Multan. The onset of the fifth season is followed by large-scale socio-economic disruptions, the closure of schools and businesses, traffic accidents, and poor health conditions. An estimated 128,000 deaths in Pakistan and around 1.2 million deaths in India have been linked to exposure to the worst air pollution annually (Fuller et al., 2019).
The unprecedented increase in anthropogenic activities has resulted in high levels of aerosol particles such as PM2.5 and its precursors in the atmosphere which can greatly influence the air quality, ozone layer, and climate (precipitation and radiation) on local to regional and global scales (Savee et al., 1979; Zhang et al., 2014). The organic carbon (OC) and elemental carbon (EC)/black carbon fraction of PM2.5 play a great role in climate forcing through their scattering and absorbing characteristics (Bollasina et al., 1979; Hansen et al., 2005; Sjogren et al., 2007; Bond et al., 2013). The global warming effect of EC and the cooling effect of OC make the carbonaceous aerosols with a lower OC/EC ratio have a greater warming effect (Zhu et al., 2014). However, the sulfate and nitrate constituents of PM2.5 have a cooling influence on climate due to their chemical and optical properties (Ali et al., 2019). Also, some toxic heavy metal elements are often attached to particulate matter (including Cd, Pb, As, and Sb), which even in low quantities can cause adverse human health effects (Onat and Stakeeva, 2013). Among all water-soluble inorganic ions in PM2.5, the three secondary ions (sulfate–nitrate–ammonium) are the most abundant one (Tao et al., 2013; Yin et al., 2014). During colder months, the hygroscopic constituents of PM2.5 may facilitate the development of fog, haze, or smog under favorable meteorological conditions. Literature indicated that fog of different densities has been observed in the Delhi region for the months of post-monsoon and winter which extends over the whole IGP region (Ali et al., 2019; Khokhar et al., 2023). This has resulted in socioeconomic disruption due to low visibility that affects transportation and aviation on a large scale. According to the data made available by the air quality monitoring stations by US Consulate Offices in Lahore and Delhi, periods of low visibility are linked with high concentrations of atmospheric pollutants such as PM2.5 and other reactive gases. This is most prominent during the post-monsoon season when the high-intensity agricultural residue burning in the Indo-Gangetic plains acts as the main driver of air pollutant loads. According to the data presented in Figure 1, the peak intensity of the agricultural burning activities has been recorded during the period of late October to mid-November (i.e., from 25 October to 14 November). Most of the fires are in the Indian plains of Punjab and Haryana as a result of the annual rice paddy clearing. This is most likely due to the high levels of mechanized agriculture practices in these regions which result in the production of ample amounts of stubble around 15 cm in height which is too labor and cost-intensive to remove without burning. According to estimates made by Gupta (2012) around 90% of the area harvested through combined harvesters in (Indian) Punjab is burned, which results in severe degradation of regional air quality. Additionally, as depicted in Figure 1, there is an offset of 2 weeks between Pakistan and Indian fires in October-November most likely because of the difference in rice cultivars, their maturity phase, and meteorological parameters at time of clearing. A time series of daily averages of PM2.5 concentration from US embassy stations of Lahore, Delhi, Dhaka, and Kathmandu show the values of PM2.5 far exceeding the permissible limit of WHO (which was 25 μg/m3 before 2021 and 15 μg/m3 since 2021 onwards for 24-h average), presented in Figure 2.
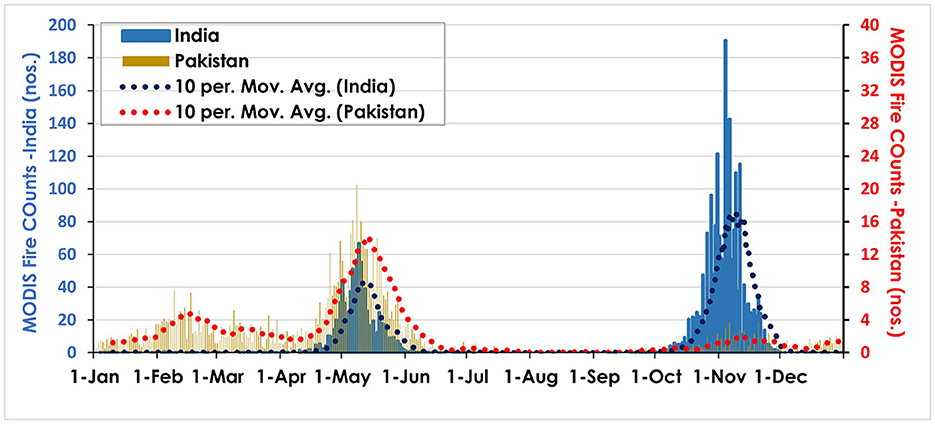
Figure 1. Daily long-term average MODIS fire counts detected over Indian region (Punjab & Haryana) and Pakistani region (Punjab and Sindh) from 2015 to 2020. Only fire counts were selected with more than 80% confidence interval over both regions. While dotted lines are representing the 10 days moving averages for respective region. Based on occurrence of fire the fifth season can be attributed to period of 25 October to 14 November period.
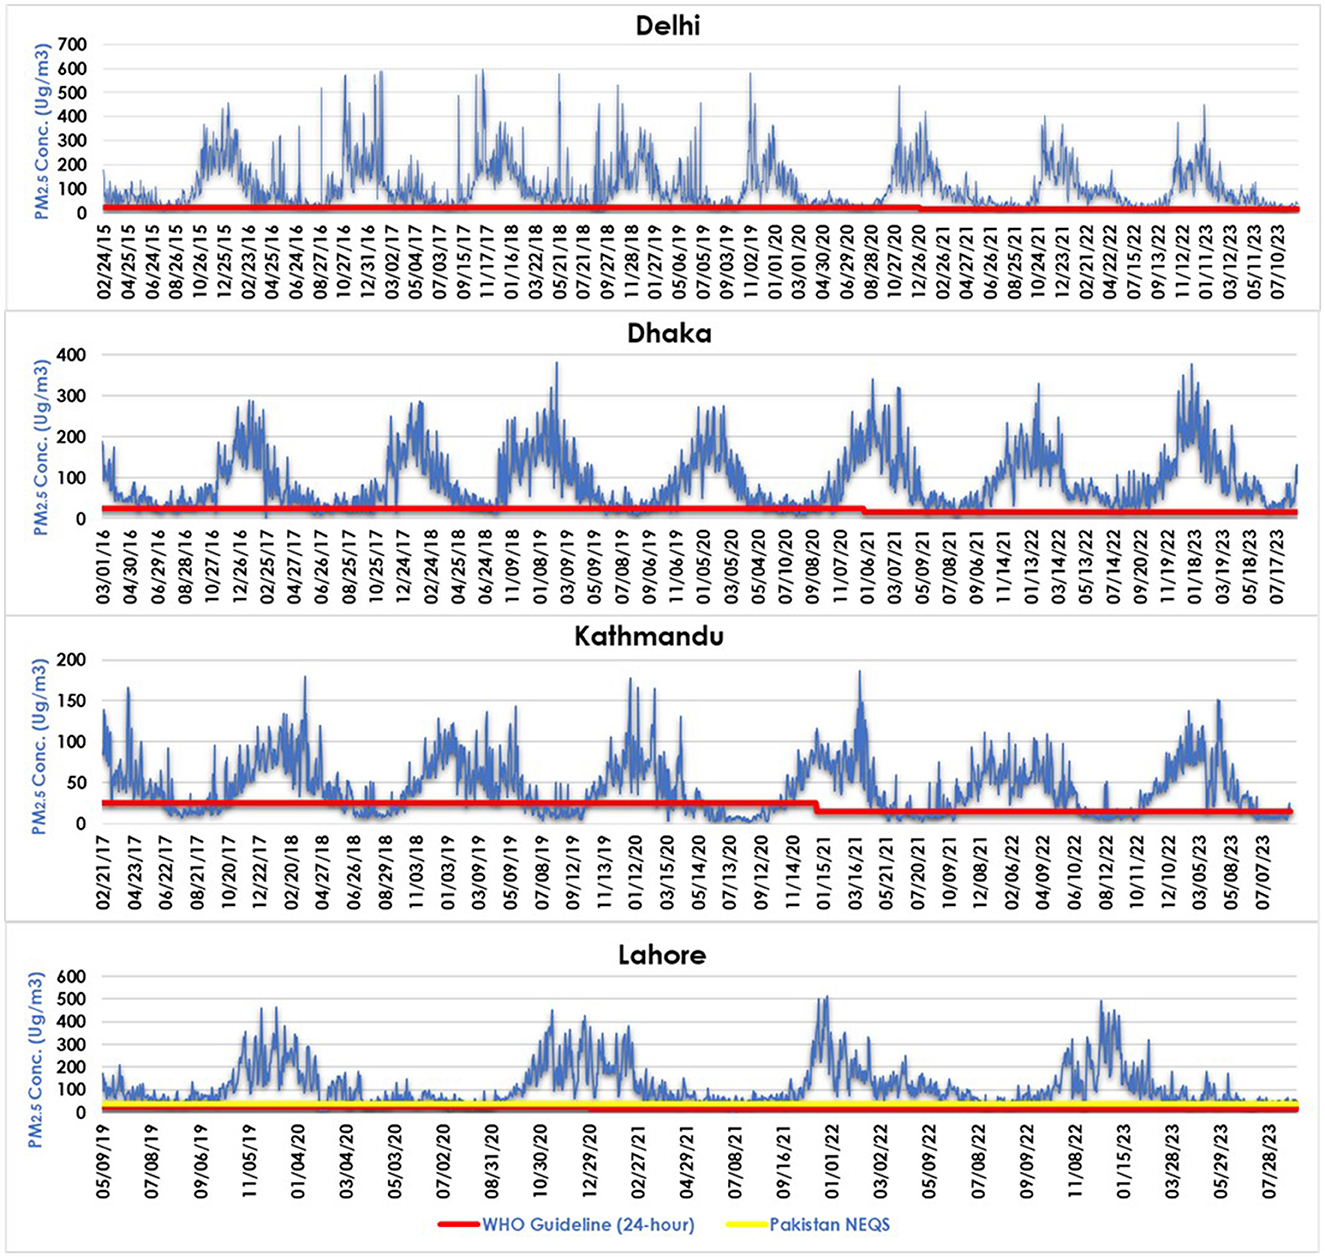
Figure 2. Time series graph showing daily average of PM2.5 concentration observed by US Embassy station in various South Asian cities.
During this period of intense fire activities, the air quality of the region significantly deteriorates as depicted in Figure 3, where the air quality of the cities closest to the high-intensity agriculture residue burning (i.e., Delhi, Lahore and Kathmandu) show a noticeable decline in overall air quality except during post-monsoon, whereas Dhaka a city far away from these agricultural emissions does not show any noticeable difference compared to the rest of the year. Another interesting aspect highlighted by Figure 3, is that during the rest of seasons the air quality of the selected cities of South Asia also remained very poor having < 1% good days (PM2.5 < 25 μg/m3, WHO limits). For Lahore and Delhi, the air quality levels were ranked as “hazardous” and “very unhealthy” for the post-monsoon season.
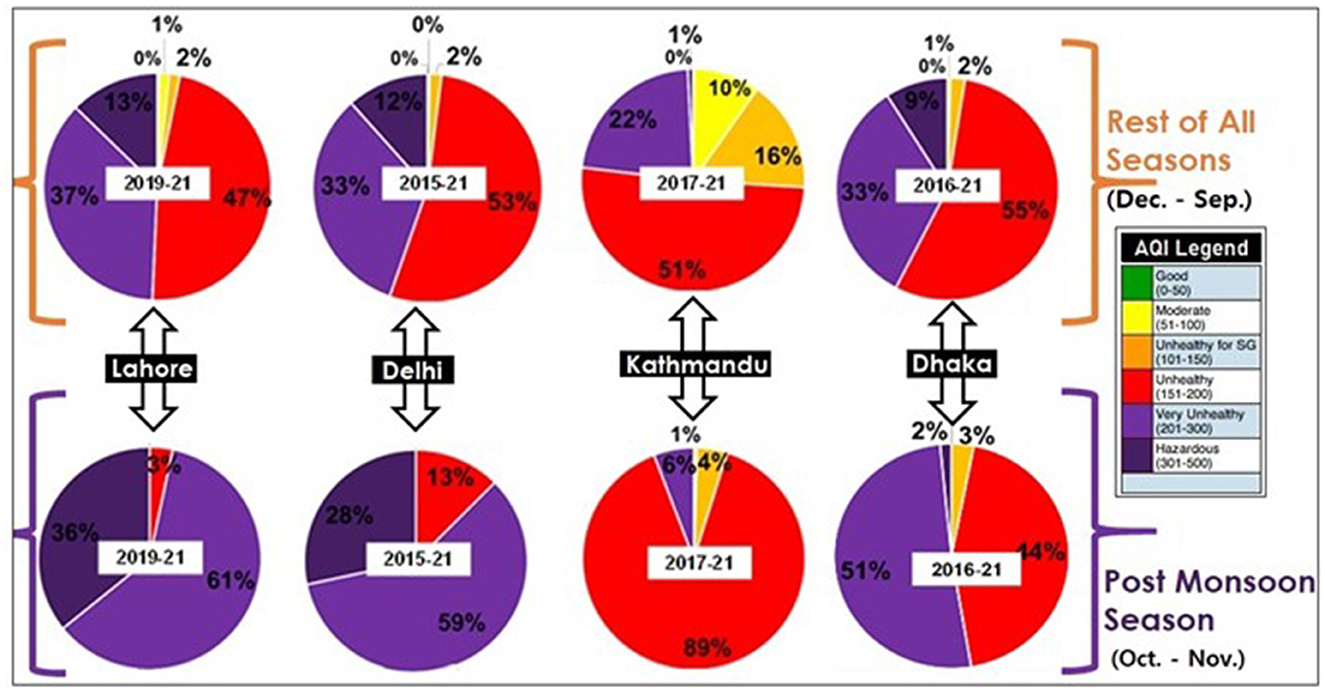
Figure 3. AQI of various South Asian cities in post-monsoon season and the rest of the year.
Because of the repeated manifestation of poor air quality events the Governments of Pakistan and India have shown an interest toward dealing with the issue of poor air quality, which until this period has been largely ignored by the politicians, policymakers, and even the public. However, after the swift resurgence of the issue following the devastating smog episodes of 2016 and 2017, it became difficult to overlook the impact of this emerging regional challenge. The monitoring of air quality in Pakistan is quite challenging due to limited ground monitoring stations. Although satellite-based atmospheric pollutant monitoring techniques can be used to assess the level of air pollution to certain extent but it cannot be the an alternative to ground-based air quality monitoring networks. Further, very few studies are available on air pollution over smog-affected regions of India-Pakistan that can assist in solving the mysteries behind these intense air pollution events (Jabeen and Khokhar, 2019; Javed et al., 2019; Ali et al., 2021; Anjum et al., 2021; Anwar et al., 2021; Razi et al., 2022; Khan et al., 2023). Literature indicates that agricultural residue-burning activities are the prime reason for the Delhi-2016 smog event (Sawlani et al., 2019). However, studies also found that the dispersion or retention of smoke between India and Pakistan can be due to the prevailing meteorological conditions such as wind patterns and air stagnation (Kanawade et al., 2020; Bilal et al., 2022). Most of the studies utilized satellite data to identify the causes of smog events. This study intends to use the data available from monitoring stations and satellites to identify the potential sources of air pollution, transboundary effect, and role of meteorology in repetitive intense air pollution events referred as fifth season in the region. This research also highlights the existing knowledge gaps through analysis of the currently available data and resolves the mysteries of the recurring post-monsoon smog episodes.
2 Materials and methods
2.1 Data collection
A detailed method flow diagram is presented in Figure 4. Air quality data for particulate matter (PM2.5) was obtained from US Air Now air quality monitoring sensors (Beta ray Attenuation Mass Monitor by Met One Instruments, Inc. USA) installed at US embassies/consulates in the cities of Lahore, Delhi, Dhaka, and Kathmandu (https://www.airnow.gov/international/us-embassies-and-consulates/).
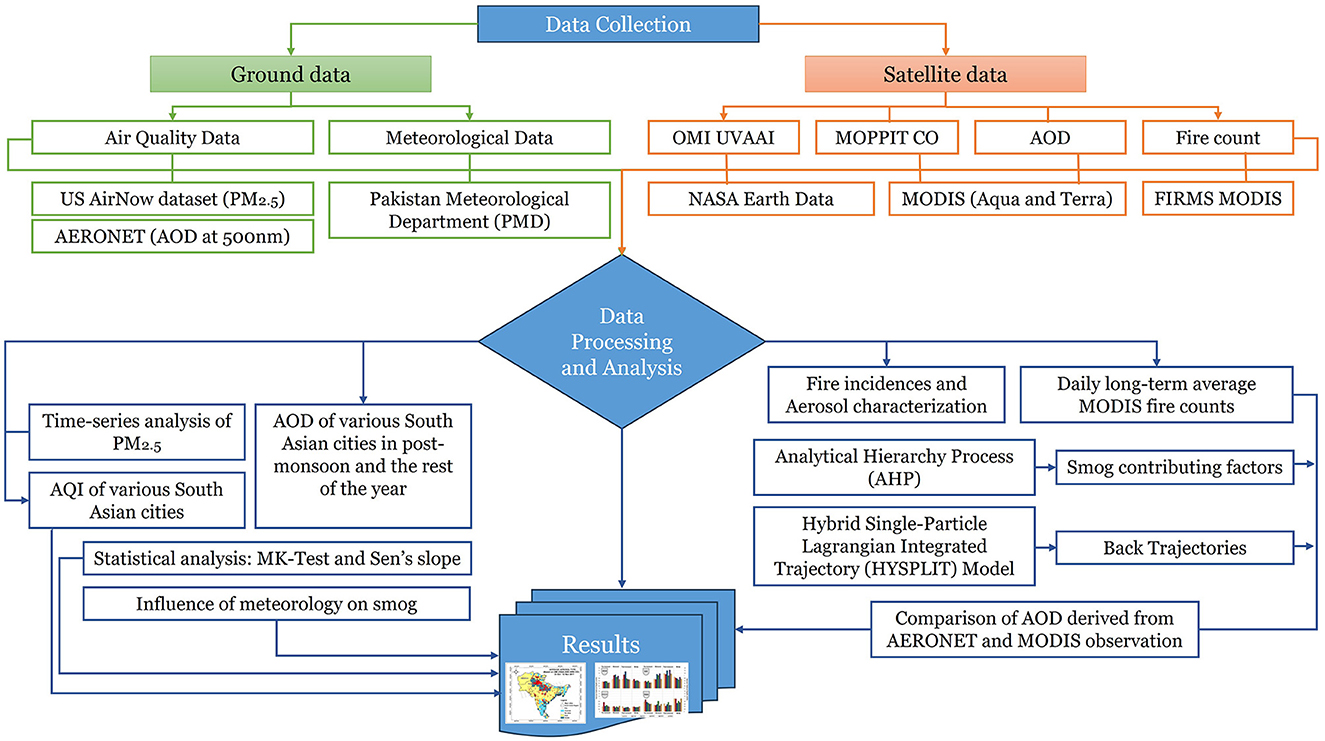
Figure 4. Methodological work-flow of the present study.
Meteorological data, including temperature, humidity, wind speed, and wind direction were obtained from the Lahore Meteorological station located at Allama Iqbal International Airport by the Pakistan Meteorological Department.
Aerosol absorbance product UVAAI (ultraviolet aerosol absorbing index) retrieved from OMI (Levelt et al., 2006). UVAAI product was obtained from the NASA Earthdata tool Giovanni (https://giovanni.gsfc.nasa.gov/giovanni/#servicewhile the MOPITT CO daily product was obtained from: https://subset.larc.nasa.gov/mopitt/.
The MODIS Aerosol Optical Depth (AOD) (Aqua and Terra combined product MCD19A) was extracted using Google Earth Engine, and the MODIS fire counts were obtained using FIRMS (Fires Information for Resource Management system) (https://firms.modaps.eosdis.nasa.gov/) fire product MCD14ML.
AERONET (AErosol RObotic NETwork) program is a federation of ground-based remote sensing aerosol networks established by NASA and PHOTONS (PHOtométrie pour le Traitement Opérationnel de Normalization Satellitaire; Univ. of Lille 1, CNES, and CNRS-INSU) and is greatly expanded by networks (e.g., RIMA, AeroSpan, AEROCAN, NEON, and CARSNET) and collaborators from national agencies, institutes, universities, individual scientists, and partners (Holben et al., 1998). It provides globally distributed observations of spectral aerosol optical depth (AOD), inversion products, and precipitable water in diverse aerosol regimes. AERONET AOD inversion product at 550 nm version 3 Level 2.0 (quality-assured) product was used in this study.
2.2 Data processing and analysis
Time-series analysis, seasonal and annual variations in PM2.5 and AOD were carried out at MS-EXCEL from 2015 to 2023 for Lahore, Delhi, Dhaka and Kathmandu. Satellite data of UVAAI, CO, and fire count was processed using ArcMap 10.7 to determine fire incidence and aerosol characterization.
The Hybrid Single-Particle Lagrangian Integrated Trajectory (HYSPLIT) Model version 4 was used to generate back trajectories. Back trajectories were calculated mainly at 50, 100, and 200 meters above the ground level for the first 7 days of November from 2016–2020 at Lahore Site. The first 7 days of November were chosen because they represent the highest period of agriculture burning and correspond with very high AOD values as shown in Figure 6.
To estimate the most contributing factors to the annual smog episodes, an Analytical Hierarchy Process (AHP) was conducted. It is a multi-dimensional decision-making method for investigating compound problems involving several criteria (Saaty, 1987). This multi-criterion decision-making method is well-proven and reliable, widely used in various studies (Hacioglu et al., 2016; Banerjee et al., 2018; Sahin et al., 2020; Saini et al., 2023). The process was carried out using the AHP online software tool, AHP-OS (https://www.ahp-os.com/). The pairwise comparisons were made for the factors contributing to smog episodes using a nine-point scale from 1 (equally important) to 9 (extremely important). The consistency ratio for the study was calculated to ensure good consistency in the matrix. The resulting weights were then used to calculate the overall weight of each factor contributing to smog episodes. The AHP process allowed for discrimination among potential sources of air pollutants during extreme smog episodes in the region, and the results are presented in Supplementary Tables S1–S3. While satellite observations are helpful, they are no substitute for ground-based observations. Therefore, to complement satellite data, ground-based monitoring stations should be established across the region for more accurate and comprehensive data.
2.3 Statistical analysis
To determine whether PM2.5 has a monotonic upward or downward trend in the selected South Asian cities, the Mann–Kendall test has been used in this study. It is a well-proven used by various researchers (e.g., Mann, 1945; Barzeghar et al., 2020; De Jesus et al., 2020; Yun et al., 2022). Mann–Kendall test uses the following equation for a time series units xi,.., xn:
Where xj and xi are values in j and i days, however, i is less than j respectively.
The data points numbers are denoted by n here.
sgn (xj – xi) calculated as:
The increasing and decreasing trend is identified by the S value either + or -. For more than 10 data values, S-Statitics show normally distributed. Then, the test is achieved with normal distribution.
The mean and variation are calculated by:
where Se is the square root of Var(S)
Sen's slope estimation is a non-parametric test to analyze the magnitude of trend either increasing or decreasing in a time-series data.
Q = Q[(n+1)/2], if N is odd
Q = 1/2 (Q[(n)/2]+ Q[((n+2)/2)]), if N is even
Qi (+)= increasing trend
Qi (−)= decreasing trend.
3 Results
3.1 Role of meteorological factors in smog formation
Winter fog is a natural meteorological phenomenon constituted by water vapors and is a common occurrence during winter months throughout this region and the world. However, since the year 2016, consistent periods of dense haze have been observed during the last week of October toward the mid of November, with the subsistence of this trend it is being established as a new phenomenon labeled “the fifth season”. This new phenomenon has been linked to frequent disruptions of road, air, and railway traffic, leading to accidents. The dense and persistent fog also leads to winter crop loss and accompanying cold waves, resulting in various illnesses and deaths.
According to Donald Ahrens and Henson (2015), the essential parameters for fog formation are;
1. Visibility should be < 1000 m
2. Availability of aerosols (AOD should be >0.4 a proxy indicator)
3. Humidity should be >75%
4. Dew point temperature difference (ambient - dew point temperature) should be ≤ 10°F.
According to the Pakistan Meteorological Department (PMD), fog is further characterized into the following categories based on visibility conditions (see Yasmeen et al., 2012):
- Very dense Fog: visibility < 50 meters
- Dense Fog: visibility < 200 meters
- Moderate Fog: visibility < 500 meters
- Shallow Fog: visibility < 1000 meters
- Haze and Mist: visibility > 1000 meters
The meteorological parameters have been compiled for the first 7 days of November from Lahore station (2015–2020) and are represented in Table 1. It is readily apparent that there is no constant role of meteorological parameters in driving these reduced visibility incidences during post-monsoon. In some of the most intense periods of reduced visibility, most prominently in the year 2016, the meteorological parameters did not support the formation of fog (at least not during the day). There has been no consistent behavior in the fog incidences observed in Lahore during the selected period as seen in Figure 5. However, there have been very few radiation fog incidences seen during the months of October and November which can be attributed to factors other than radiation fog events such as fire smoke. The frequency of fog incidents escalates with a decrease in temperature and results in reduced visibility in the study area. In Lahore, the month of December shows high values of moderate to dense fog for the years 2016 and 2019 while minor values during the rest of the years. November has shown high numbers during 2017. The month of January displays a consecutive high value in 2017, 2018, and 2020, with a relatively visible large number in 2016 as well (Figure 5). Similarly, the relationship of meteorological parameters i.e., temperature, windspeed, and humidity with visibility incidences for the period of 4 months are shown in the Supplementary Figure S1. In the case of Lahore (see Supplementary Figure S1) during 2015 being the normal year, the reduced visibility started during the first week of November, however over the years, the number of reduced visibility incidences started moving toward the last week of October. There is one-week earlier initiation of the occurrence of reduced visibility incidences. However, the number of fog/smog incidences has been inconsistent over the years as there is no exact pattern. Most of smog incidences occurred during the month of December in each year, which is further supported by meteorological conditions and reduced boundary layer height. In the years 2016 and 2017, the first seven days of November showed transboundary smoke and haze conditions whereas no such smog events were reported in 2018 (Supplementary Figures S2, S3). Based on visibility data, the studied period (25 October−12 November 2017) was divided into three pollution episodes (Figure 6), in which late October 2017 (Episode 1) was observed to have haze and smoke due to transboundary pollution. It can be attributed to the primary smoke of rice paddy fires in India and Pakistan, which have hampered the visibility on either side of the border. Smoke/smog incidences were observed in the second and third episodes in which shallow to dense fog was also reflected at the end of the first week of November. With a closer look into this data for all 4 criteria, it can be concluded that during the months of October and November, the reduced visibility is not due to radiation fog (the usual phenomenon in winter), as the humidity was quite low, with warm temperature, wind speed, and relatively normal BLH condition. To validate this hypothesis, the smoke product was estimated for the period of 2017 (a period with the large number of reduced visibility incidences), highlighted in Figure 7. It can be clearly observed during the period of 23 October to 12 November 2017, a layer of dense smoke is visible over the IGP region. It is further supported by the satellite-based (MODIS Fire Count product) observation of fire incidences (red circles in Figure 7) concentrated over the western and central parts of IGP during the period of intense agricultural burning and resulting smoke episodes across the region.
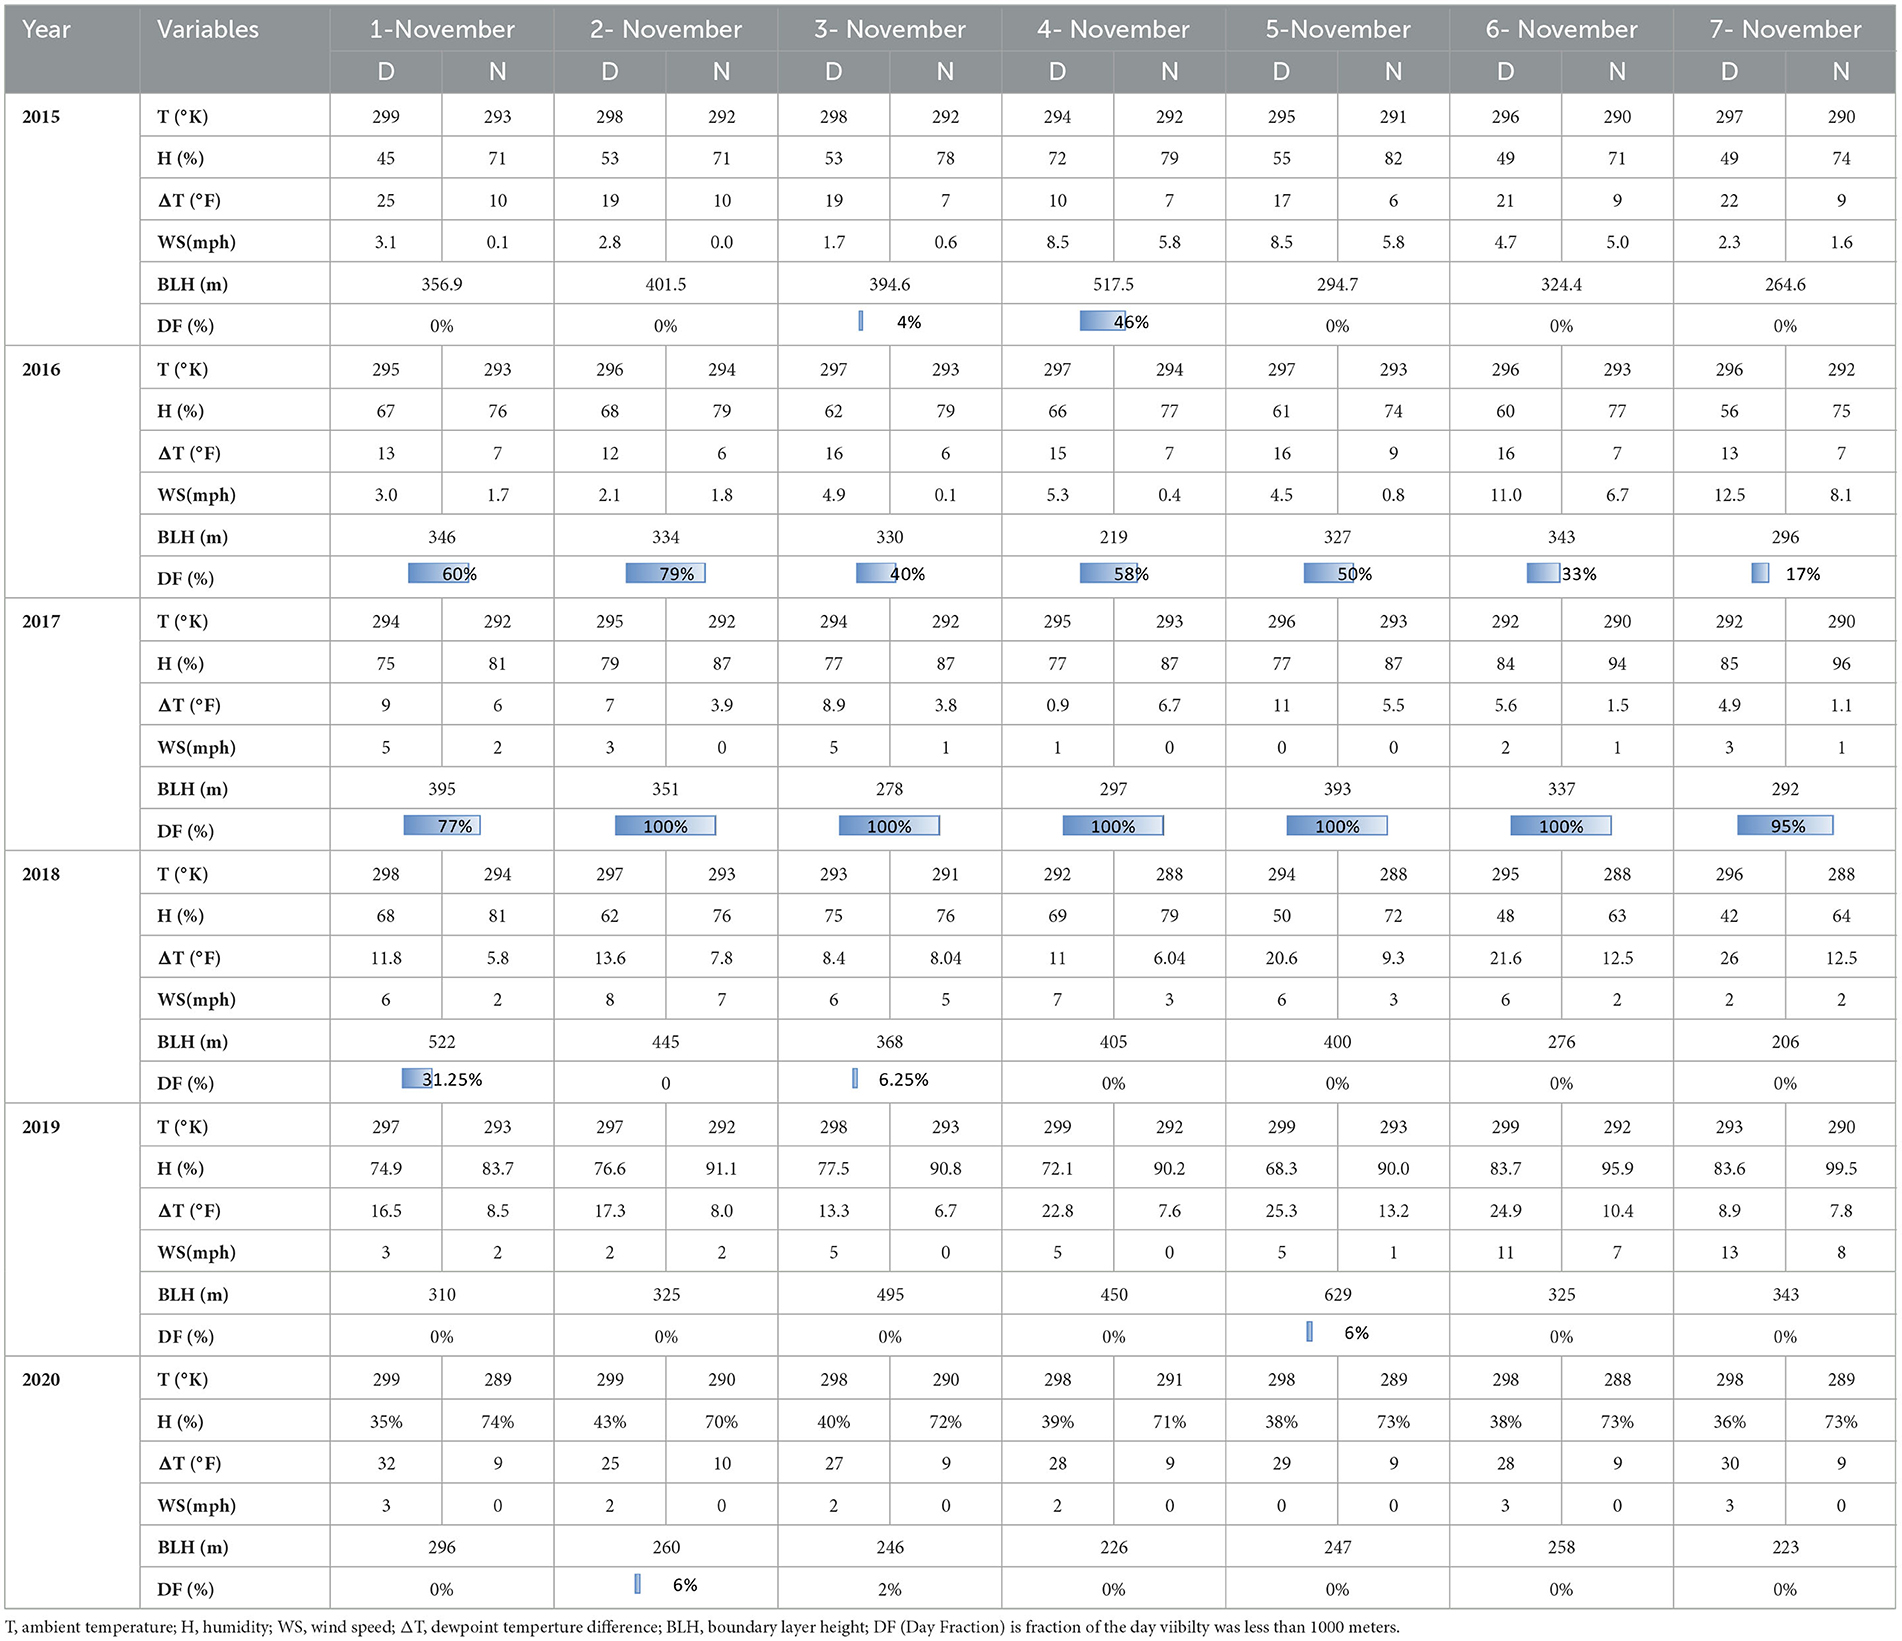
Table 1. Meteorological parameters for the first seven days of November during the time period of 2015–2020.
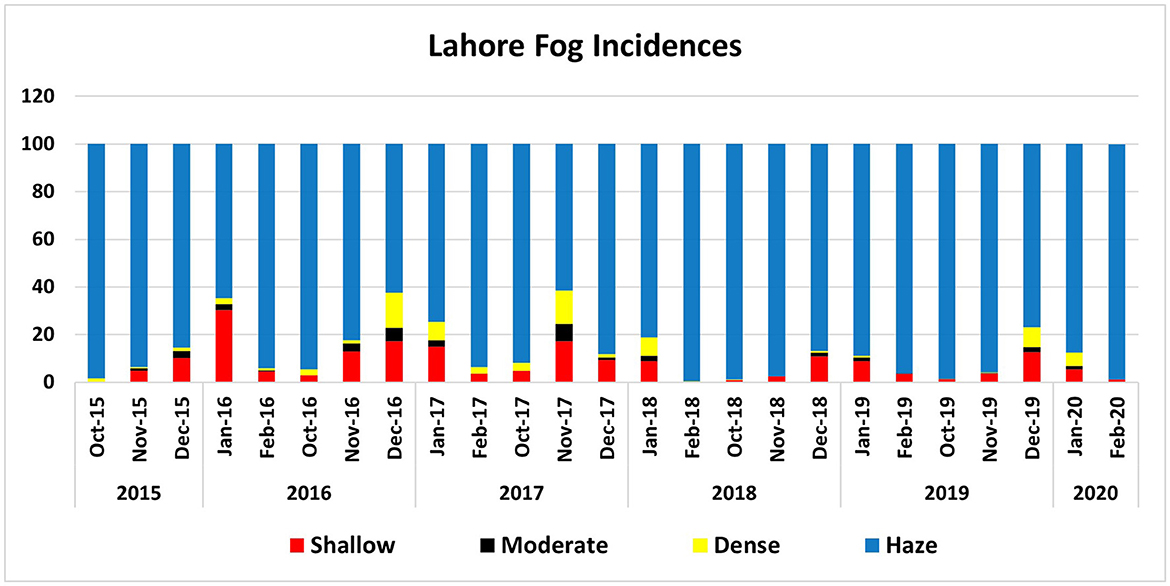
Figure 5. Monthly averages of Haze, Shallow fog, Moderate fog, and Dense fog over Lahore for 6 years based on visibility conditions only.
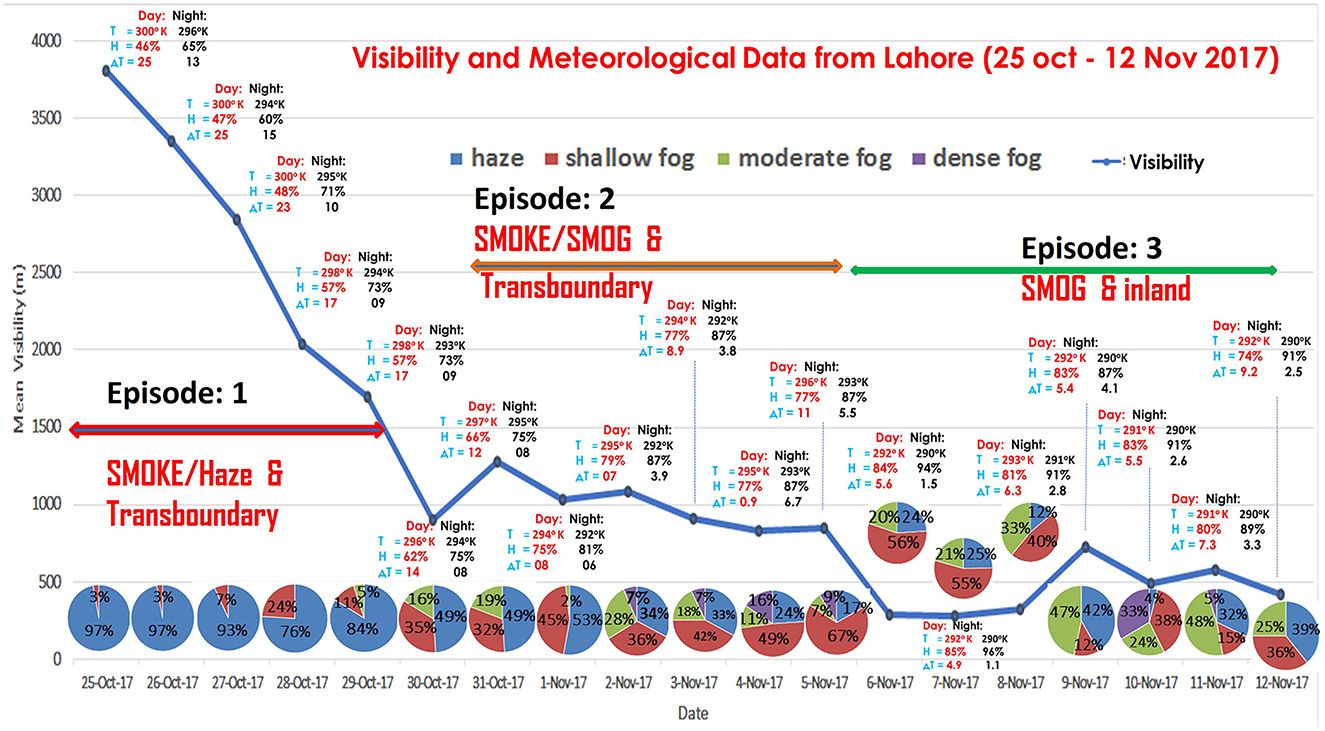
Figure 6. Visibility and meteorological data from Lahore during severe smog/smoke episode (October 25–November 12, 2017).
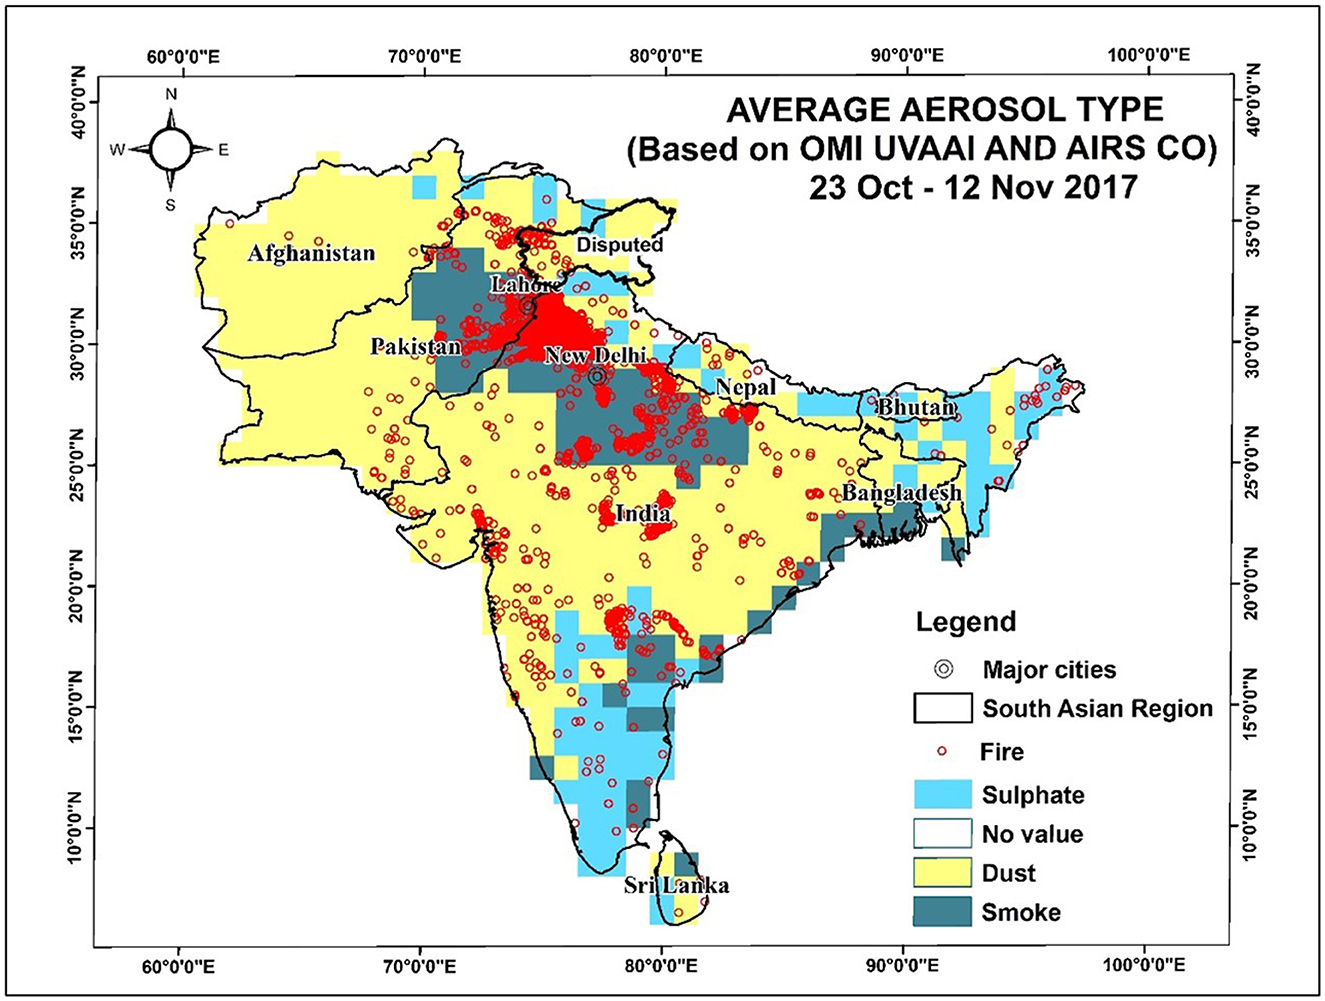
Figure 7. Fire incidences and Aerosol characterization (types and spatial distribution) over South Asia.
3.2 Analysis of aerosol load of various South Asian cities
In Lahore and other cities, the air quality remains poor throughout the year and aerosol loads continue to rise. Meteorological parameters such as boundary layer dynamics have a definite role in driving the change in aerosol loads over any region. However, the role of anthropogenic emissions, especially vehicular emissions and other activities can be linked to the rising aerosol loads in South Asia. In Pakistan, the number of registered vehicles in the country has shown more than a 400% increase from 2006 to 2020. The industrial emissions in the country have also rapidly increased with a 1000% increase in CO2 emissions from 1970 and a 20% increase in NOx from 2005 (Zeb et al., 2019; EDGAR, 2022). The increase in background concentration of pollution throughout the years is indicated by the increase in the frequency of pollution sources (vehicles, fuels, etc.) and can be represented through the increase in AOD and PM2.5 as highlighted in Figures 8, 9, respectively.
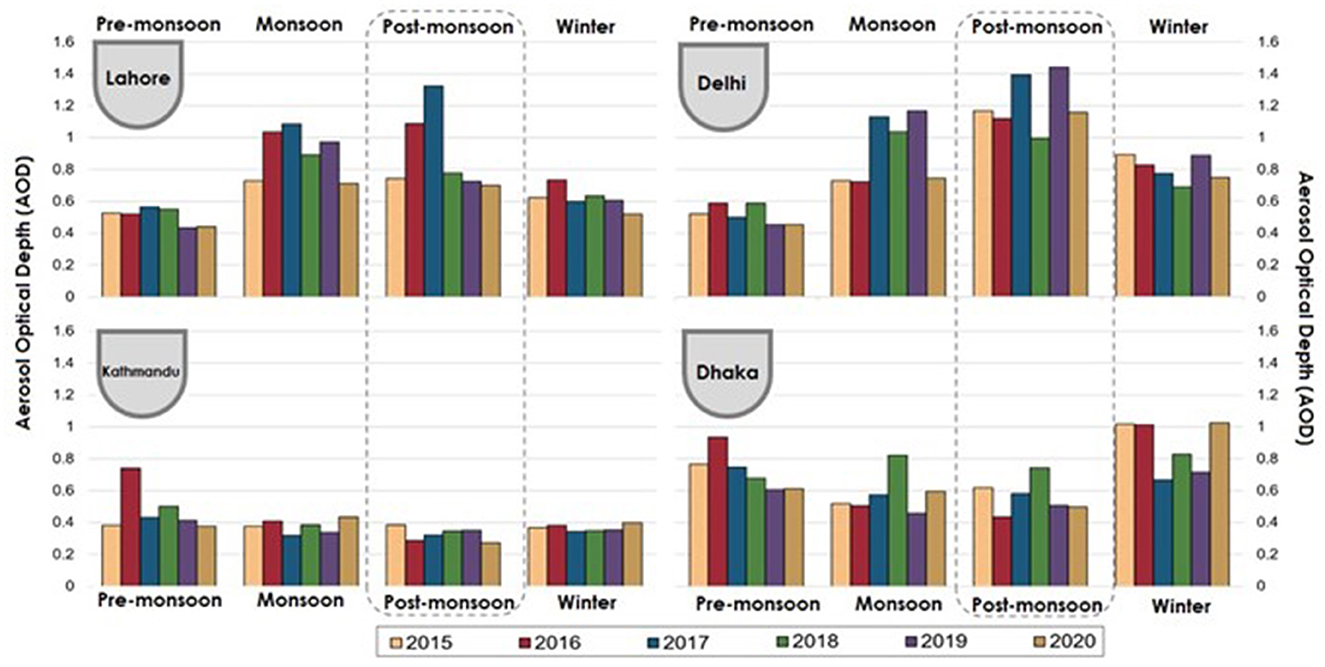
Figure 8. AOD of various South Asian cities in post-monsoon and the rest of the year.
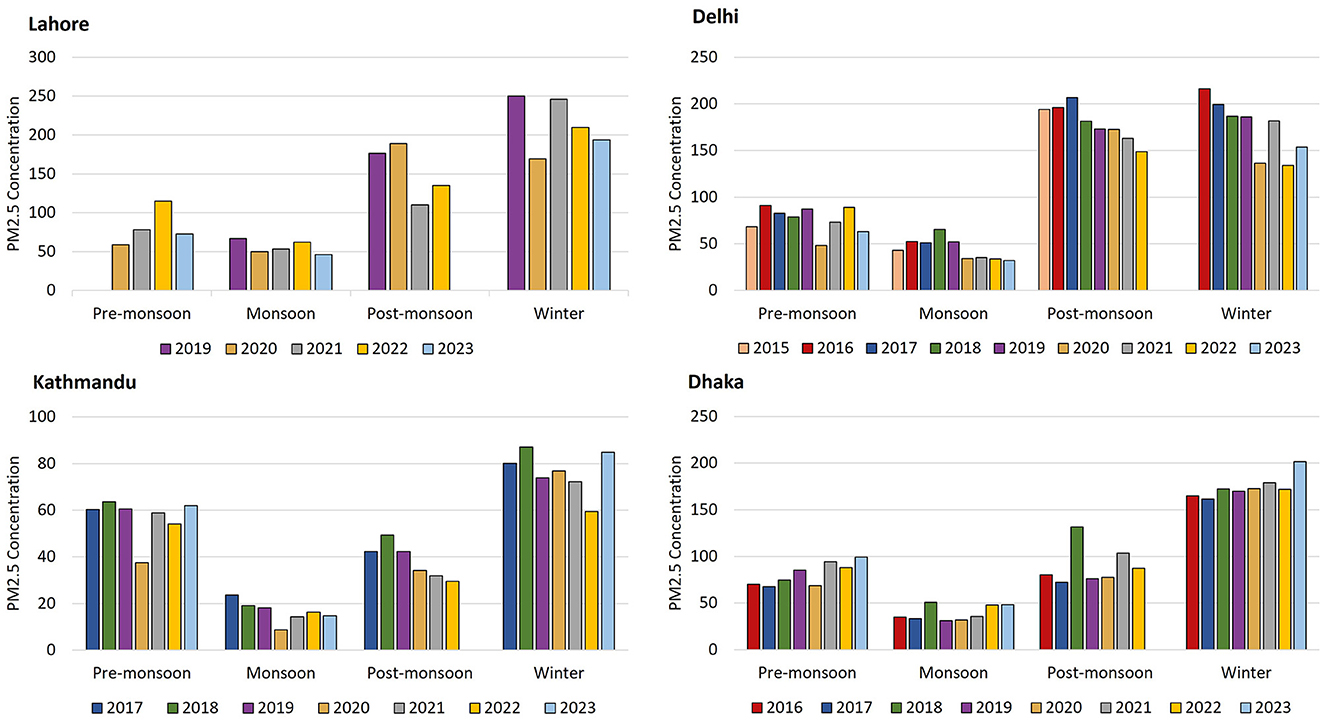
Figure 9. Seasonal variation of PM2.5 of various South Asian cities.
The major cities of South Asia such as Lahore, Delhi, Kathmandu, and Dhaka have recently shown a decreasing trend with respect to annual AOD. The selected cities follow similar seasons that are used in this study i.e., Pre-monsoon (March-May), Monsoon (June-Sept), Post-monsoon (Oct-Nov), and Winter (Dec-Feb). Both AOD and PM2.5 show similar trends for all the selected cities irrespective of AOD is columnar data and PM2.5 is the surface measurement (Figures 8, 9). An increase in aerosol loads has been observed during the period of post-monsoon especially for the cities of Lahore and Delhi. This is most likely because of the role of agricultural emissions which have a major role in defining the air quality of the region. This is most prominent in the western part of the IGP, where cities like Lahore and Delhi show a significant increase in air pollutants, also discussed by Anjum et al. (2021). While in the city of Kathmandu, there is an increase in unhealthy days during the pre-monsoon season mainly due to transport of surface aerosol above boundary layer because of strong convective storms that occur in pre-monsoon. However, it is less influenced by the rice paddy fire cycle in the IGP region as the aerosol loads remain low and there is most likely a local pattern in aerosol loads consistent for the whole year. Becker et al. (2021) also noticed the similar AOD and PM2.5 trends over Kathmandu in which pre-monsoon AOD was observed to be higher than other seasons whereas, PM2.5 levels were observed to be elevated in winters (due to strong nighttime temperature inversion). Similarly, in the case of Dhaka City, the air quality is not affected by the agriculture fires in the western parts of IGP but rather mostly influenced by the local sources and partially from transboundary sources. Similar outcome has been reported by a study conducted in Dhaka by Ali et al. (2022). Further, enhanced AOD and PM2.5 during winter months in the all selected cities is primarily due to stable meteorological conditions, and consequently local emissions are accumulated. As during the winter period, the phenomenon of temperature inversion occurs, and the large concentration of pollutants observed in the atmosphere leads to more hazardous levels of air quality and consequent health and socio-economic disturbances (Li et al., 2017).
The Mann-Kendall test was performed on the available dataset that further confirmed the annual and seasonal trends of PM2.5. The results are presented in Table 2 that shows significant upward or downward trends and the magnitude of change. Based on Sen's Slope estimation, an annual decline in PM2.5 levels was obtained for Delhi (72 μg m−3/year), Lahore (49.5 μg m−3/year), Kathmandu (67 μg m−3/year) and Dhaka (92 μg m−3/year). All four cities show a significant upward trend in post-monsoon whereas, a significant monotonic decline in PM2.5 concentration can be seen in winter (p < 0.05). No trend exists in monsoon and winter for Dhaka, monsoon and pre-monsoon in Lahore and winter in Kathmandu. However, it can be concluded that the policies and regulations are not strictly enforced in these regions as compared to Delhi where declining trends in all seasons can be seen due to stringent laws during the past few years. Another reason for lack of significant upward/downward trend is the inter-annual variability of PM2.5 due to change in meteorological conditions and local emission patterns.
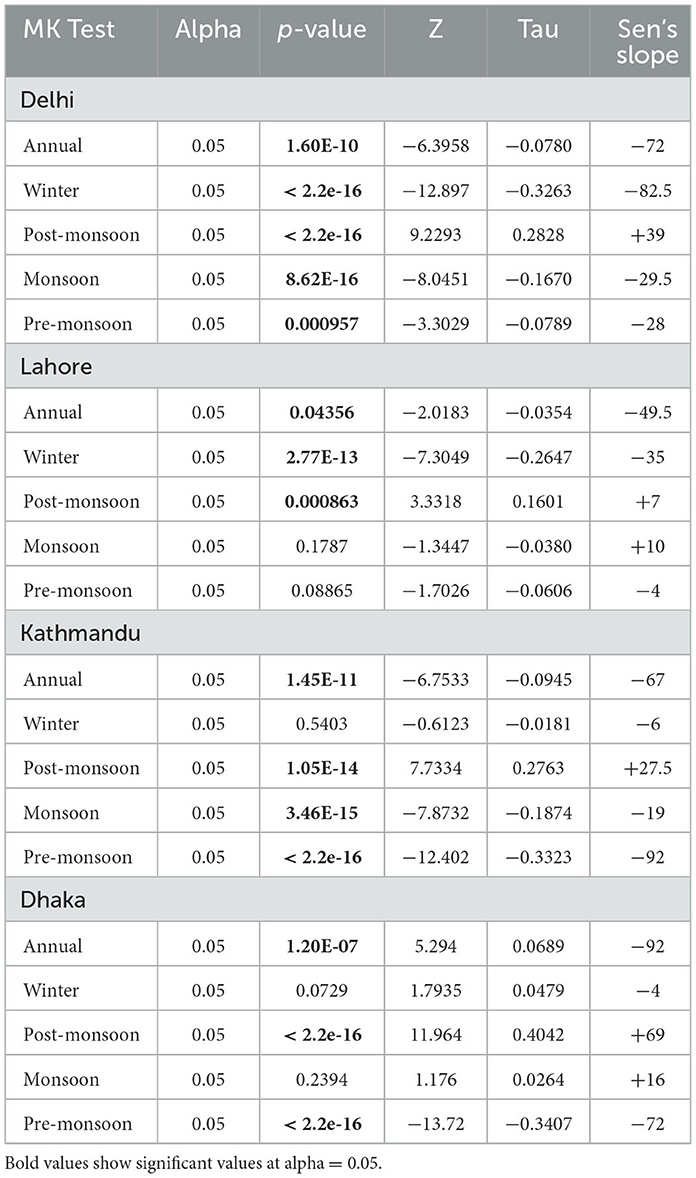
Table 2. Mann-Kendall Test for the significance of trends of PM2.5 in various South Asian cities.
3.3 Source attribution of air pollutants during intense air pollution episodes
The lack of substantial ground-based monitoring across the region and the limitations of long-term satellite data, the role of seasonality and type of sources cannot be adequately explored. To discriminate among potential sources of air pollutants during extreme air pollution episodes in the region, an Analytical Hierarchy Process (AHP) was conducted to estimate the most contributing factors to the annual smog episodes. AHP is a multi-dimensional decision-making method for investigating compound problems involving several criteria. It is used to make the best decision via multiple criteria by assessing the relative importance of factors to the event mathematically (Sahin et al., 2020). Using the multi-criteria evaluation procedure, it uses pairwise comparison and expert judgment. Pairwise contrast of factors allows one to weigh the significance of a contributing factor compared with other factors, and it determines the values for each of these factors mathematically. A pairwise comparison matrix is generated by assigning a value of 1 to 9 to each pairwise comparison. A value of 1 in the pairwise comparison matrix means both factors are equally important, 3 means moderate importance, 5 means strong importance, 7 means very strong importance over the other, and 9 means one of the factors is extremely important compared with the other. Values of 2, 4, 6, and 8 express intermediate importance values on a scale of 1–9. It is possible to evaluate the consistency of the decision/judgments by computing the consistency ratio (CR) based on the eigenvalues of the factors' matrix. The consistency ratio < 0.1, in general, is acceptable. If the value of the consistency ratio is >0.1, then serious inconsistencies prevail and the AHP may not give meaningful judgments. According to the data, the transboundary pollution resulting from open field burning activities in Indian Punjab has been assigned moderate importance over vehicular emissions, while strong and very strong importance over thermal power generation sources and brick kilns. The results of the AHP process are presented in Supplementary Tables S1–S3, where the greatest weightage is assigned to transboundary open burning, followed by vehicular emissions, followed by thermal or industrial emissions, and then brick kilns. The consistency ratio for the study was significantly below 0.1 showing good consistency in the matrix. According to the results presented in Supplementary Tables S1–S3, it can be concluded that a large portion of the smog episodes is a result of transboundary air pollution followed by vehicular and thermal power generation sectors.
3.4 Role of transboundary emissions in air pollution episodes
Transboundary emissions can take place throughout the year over the region of the IGP. Because of the topography of the area, the monsoon, and westerly winds, the movement of pollutants can take place easily and pollutants are locked within this region. As regional fire activities are a major source of air pollution their transboundary impacts might also occur. In order to explore these transboundary impacts, the backward HYSPLIT Trajectory model was used to assess the direction of wind vectors reaching the city of Lahore in addition to MODIS and AERONET-based retrieved AOD to assess the pollution loads according to Figure 10.
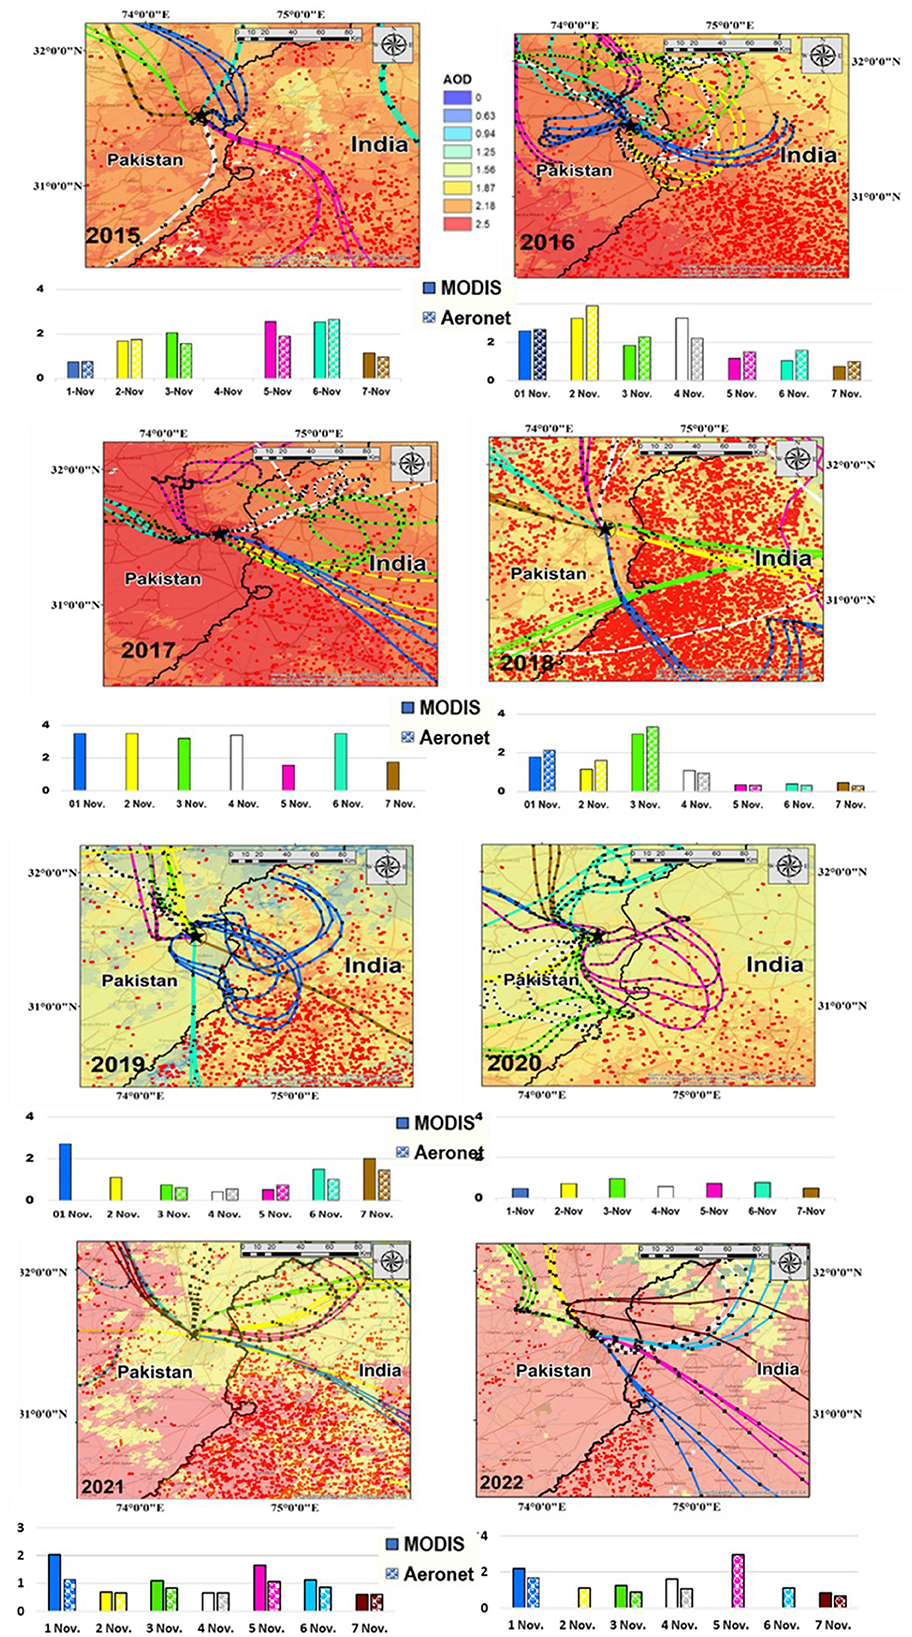
Figure 10. HYSPLIT Back Trajectories calculated over the region and ending up in the City of Lahore (encircled Black Star), Pakistan for the year 2015 to 2022. Graphs in each panel of figure show the comparison of AOD derived from AERONET and MODIS observation on respective days. While background colors in maps are MODIS derived AOD over the study region averaged over first 7 days of November for the respective year.
Since the year 2016, there have been severe episodes of smog during the first 2 weeks of November in both India and Pakistan. The extension of smog has been observed for hundreds of kilometers over the Punjab region on either side of the international border. Here, we have discussed the smog observed during the first week of November from the year 2016 to 2020 in the city of Lahore. Satellite observations of AOD have also indicated a substantial increase in aerosol loads over the study region during these smog episodes. To explore the reason behind such high levels of AOD, the aerosol transportation over 96 h was studied using back trajectories produced via Hybrid Single-Particle Lagrangian Integrated Trajectory (HYSPLIT) Model version 4. Back trajectories from HYSPLIT were generated for the first seven days of November for the years 2016 to 2020 at the Lahore Site (AERONET station site in Lahore was chosen, as shown by the black star in Figure 10). Back trajectories were calculated mainly at 50, 100, and 200 meters above the ground level. For 2016, the results show that the highest values of AOD were recorded in an order of 2nd, 4th, 1st, and 3rd November, respectively on which the back trajectories were coincidently coming from India passing over the agriculture fires (red dots). Thus, these high AOD values could be a result of the emissions from agriculture fires combined with industrial activities and vehicular emissions winds carrying them across the border. The remaining trajectories that reached the study site through inland areas exhibited significantly lower AOD columns as compared to cross-border trajectories. This trend is consistent throughout the first seven days of November from 2015 to 2020 with slight variations.
Again, higher AOD values were observed in Lahore during the first week of November 2017. Maximum AOD values were observed in an order of dates i.e., 6th, 2nd, 1st, 4th, and 3rd November. Trajectories for these days originated from India and coincided with intense agricultural fires observed during this period. During the following year 2018 and 2019, a similar trend of higher AOD was observed consistent with back trajectories passing over the fire region on the eastern side of the international border and exhibiting relatively lower AOD values when the trajectory was passing our inland areas of Pakistan.
During the year 2020, no significant contribution from transboundary emissions was identified as during the first 7 days of November, the trajectories passed over the countryside.
In the last 2 years i.e., 2021 and 2022, a notable change was observed in transboundary pollution as seen in Figure 8. In 2021, AOD levels were high in the studied period and high agricultural residue-burning was noticed in the Indian region whereas after the strict compliance and implementation of the National Clean Air Programme (NCAP) by India, a remarkable reduction in fire activities can be observed in 2022. AOD was found to be higher only on 5th of November and the rest of the studied period observed lower levels. In the past, transboundary volcanic SO2 has also been reported in the upper tropospheric region (Khattak et al., 2014). Overall, it can be speculated that smog episodes experienced in the city of Lahore over the years are primarily caused by the transboundary agriculture fire in India, and satellite observation in association with other analysis tools (HYSPLIT Model). It can help to a certain extent in discriminating the origin of air pollutants in a country like Pakistan without having a proper air quality monitoring infrastructure but demands a need of regular air quality monitoring network across the region supplemented by satellite observations.
4 Discussion
Recent economic growth and consequent development activities have given rise to episodic air pollution events in various South Asian cities. These air pollution events occur regularly, although with varying levels of severity. According to this study, the severity of these events is dependent upon the frequency and intensity of local, regional, and transboundary emissions and specific meteorological conditions. The high-intensity and large-scale fire activities taking place between late October and mid-November (termed the fifth season) in the Indo-Gangetic region, in particular, favor the formation, transportation, and accumulation of air pollution and can be one of the major contributing factors to the annual smoke/smog episodes observed in Lahore and Delhi (northwestern IGP region).
Recently, consistent occurrence and hazardous impacts of air pollution episodes have increased the political awareness and importance of air quality in the communities of Pakistan and India. However, several technical issues such as the lack of air quality monitoring setup (especially in Pakistan), lack of historical data, and accuracy of existing data have made it difficult to study the air quality issue in-depth and understand the mysteries in a holistic way. Based on the existing set of data sets (satellite and ground-based observations) air quality in the region is deteriorating at a faster rate. Very few available health surveys conducted in Pakistan, have observed a sizable increase in patients suffering from acute respiratory infections and cardiovascular diseases due to higher levels of AOD and particulate matter of size < 10 and 2.5 μm during periods of severe air pollution episodes, especially in post-monsoon and winter seasons (Ilyas et al., 2010; Gull et al., 2013; Khwaja et al., 2013; Mehmood et al., 2021).
As agriculture burning has a key role in determining the air quality of the region, appropriate awareness and use of environmentally friendly technologies should be disseminated among the farmers. In India and Pakistan, misconceptions about the beneficial role of agriculture fires and lack of appropriate technologies combined with maximum turnover policies through mechanized agriculture practice are responsible for the high intensity of agriculture burning each year.
The causes for the South Asian intense air pollution episodes include the favorable meteorological conditions (i.e., temperature inversion, trapping of stagnant air, etc.) leading to the formation and accumulation of secondary pollutants and a rapid increase in the intensity of pollution sources (in this case the increase in the intensity of fire activities, vehicular and developmental activities, etc.). Under certain circumstances the meteorological conditions do not support the formation of smog/fog, however, visibility is still affected because of the high pollution loads resulting in a layer of smoke covering most of the region and adversely affecting its denizens.
The data made available by the US AirNow program for the city of Lahore and Delhi has shown that the situation is in dire need of initiatives to abate air pollution (with < 1% of days being good or safe). This also raises the issue of air quality in other cities and the current lack of air quality monitoring infrastructure in Pakistan. Although satellite observations are helpful, they are no substitute for ground-based observations.
Although Pakistan has put significant efforts to the best of its capacity to address the issue of smog; the Government of Punjab officially launched its Policy on Controlling Smog in 2017 (last accessed on 20 July 2023, https://epd.punjab.gov.pk/system/files/Policy%20on%20Controlling%20Smog%20%28Final%29_0.pdf). To its credit, the country took various tangible actions to reduce the impact of air pollution through the introduction of low-sulfur fuels, better vehicular standards, adoption of pollution reduction technologies, traffic management strategies, and severe restrictions on agricultural residue and solid waste burning (Environment Protection Department, 2017). Figure 11 highlights the important steps taken under the umbrella of smog policy.
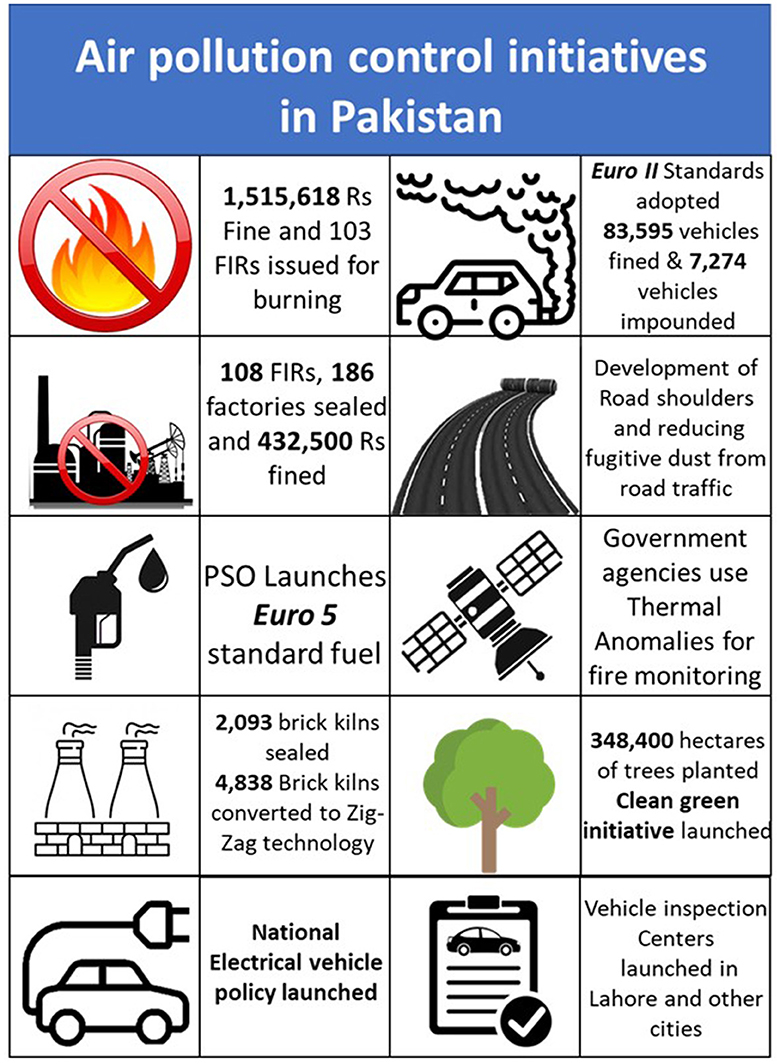
Figure 11. Steps taken by Pakistan to reduce air pollution. Figures obtained from provincial disaster management authority Punjab.
However, it is important to realize that despite the intense focus on smog reduction measures the efficiency of these steps in reducing pollution is difficult to prove because of the lack of monitoring infrastructure and source apportionment studies in the country. Furthermore, the lack of impact on the annual smog episodes primarily driven by agricultural residue burning along the Indian border would indicate that air pollution is a transboundary issue and Pakistan alone cannot resolve this issue without regional cooperation (Khokhar et al., 2021, 2023).
5 Conclusions
The “fifth season” is a new addition to the climatology of IGP and has been witnessed during the post-monsoon season (October to November). During this period, the region experiences extreme episodes of air pollution such as low visibility, due to increased concentrations of atmospheric pollutants. Although yearly AOD in the major cities of South Asia such as Lahore, Delhi, Kathmandu, and Dhaka have shown a decreasing trend, however, an increase has been observed for the period of post-monsoon especially for cities of Lahore and Delhi, mainly due to agricultural burning emissions which have a major role in defining the air quality of the region. The study of meteorological data indicates that during the months of October and November, the reduced visibility is not due to fog (which occurs during winter), as the humidity was quite low, with high temperature, wind speed, and relatively normal BLH conditions. Rather, it can be attributed to the primary smoke of rice paddy fires in India and Pakistan, which have hampered the visibility on either side of the border.
The topography and pollution sources of South Asia play an immense role in the seasonal air quality of the IGP region, and it is apparent that air quality in South Asia is a regional issue. HYSPLIT trajectory model coupled with ground and satellite data shows that the agricultural fires do have a profound impact on the air quality of the IGP region and highlight the importance of transboundary air pollution. Therefore, it requires strong regional cooperation among all countries to collectively address this issue and benefit from each other's expertise and knowledge (beyond the geo-political differences) to overcome this emerging challenge. Otherwise, wellbeing of billions of South Asian people will remain at stake.
Data availability statement
The original contributions presented in the study are included in the article/Supplementary material, further inquiries can be directed to the corresponding author.
Author contributions
RM: Investigation, Visualization, Writing – original draft, Writing – review & editing. MSA: Conceptualization, Visualization, Writing – original draft. MI-u-d: Methodology, Software, Visualization, Writing – original draft. SM: Investigation, Methodology, Visualization, Writing – original draft. MNA: Visualization, Writing – original draft. BA: Investigation, Visualization, Writing – review & editing. MK: Conceptualization, Funding acquisition, Supervision, Visualization, Writing – review & editing.
Funding
The author(s) declare financial support was received for the research, authorship, and/or publication of this article. The authors are grateful to Higher Education Commission, Pakistan (Scholar PIN: 315-14941-2PS3-111) for providing them financial support under the BPAIRB grant (ref.no.:21/Federal/PBAIRP/R&D/HEC/2017) and NUST post-graduate R&D fund.
Acknowledgments
Acknowledgment to NASA (MODIS), NOAA, and AERONET for providing free data.
Conflict of interest
The authors declare that the research was conducted in the absence of any commercial or financial relationships that could be construed as a potential conflict of interest.
Publisher's note
All claims expressed in this article are solely those of the authors and do not necessarily represent those of their affiliated organizations, or those of the publisher, the editors and the reviewers. Any product that may be evaluated in this article, or claim that may be made by its manufacturer, is not guaranteed or endorsed by the publisher.
Supplementary material
The Supplementary Material for this article can be found online at: https://www.frontiersin.org/articles/10.3389/frsc.2023.1314426/full#supplementary-material
References
Ali, K., Acharja, P., Trivedi, D. K., Kulkarni, R., Pithani, P., Safai, P. D., et al. (2019). Characterization and source identification of PM2.5 and its chemical and carbonaceous constituents during winter fog experiment 2015–16 at Indira Gandhi International Airport, Delhi. Sci. Total Environ. 662, 687–696. doi: 10.1016/j.scitotenv.2019.01.285
Ali, M. A., Bilal, M., Wang, Y., Qiu, Z., Nichol, J. E., Mhawish, A., et al. (2022). Spatiotemporal changes in aerosols over Bangladesh using 18 years of MODIS and reanalysis data. J. Environ. Manage. 315, 115097. doi: 10.1016/j.jenvman.2022.115097
Ali, S. M., Malik, F., Anjum, M. S., Siddiqui, G. F., Anwar, M. N., Lam, S. S., et al. (2021). Exploring the linkage between PM2,5 levels and COVID-19 spread and its implications for socio-economic circles. Environ. Res. 193, 110421. doi: 10.1016/j.envres.2020.110421
Anjum, M. S., Ali, S. M., Subhani, M. A., Anwar, M. N., Nizami, A. S., Ashraf, U., et al. (2021). An emerged challenge of air pollution and ever-increasing particulate matter in Pakistan; a critical review. J. Hazard. Mater. 402, 123943. doi: 10.1016/j.jhazmat.2020.123943
Anwar, M. N., Shabbir, M., Tahir, E., Iftikhar, M., Saif, H., Tahir, A., et al. (2021). Emerging challenges of air pollution and particulate matter in China, India, and Pakistan and mitigating solutions. J. Hazard Mater 416, 125851. doi: 10.1016/j.jhazmat.2021.125851
Banerjee, P., Ghose, M. K., and Pradhan, R. (2018). AHP-based spatial air quality impact assessment model of vehicular traffic change due to highway broadening in Sikkim Himalaya. Annals GIS 24, 287–302. doi: 10.1080/19475683.2018.1534889
Barzeghar, V., Sarbakhsh, P., Hassanvand, M. S., Faridi, S., and Gholampour, A. (2020). Long-term trend of ambient air PM10, M2. 5, and O3 and their health effects in Tabriz city, Iran, during 2006–2017. Sust. Cities Soc. 54, 101988. doi: 10.1016/j.scs.2019.101988
Becker, S., Sapkota, R. P., Pokharel, B., Adhikari, L., Pokhrel, R. P., Khanal, S., et al. (2021). Particulate matter variability in Kathmandu based on in-situ measurements, remote sensing, and reanalysis data. Atm. Res. 258, 105623. doi: 10.1016/j.atmosres.2021.105623
Bilal, M., Hassan, M., Tahir, D. B. T., Iqbal, M. S., and Shahid, I. (2022). Understanding the role of atmospheric circulations and dispersion of air pollution associated with extreme smog events over South Asian megacity. Environ. Monit. Assess 194, 1–17. doi: 10.1007/s10661-021-09674-y
Bollasina, M. A., Ming, Y., and Ramaswamy, V. (1979). (2011). Anthropogenic aerosols and the weakening of the South Asian summer monsoon. Science 334, 502–505. doi: 10.1126/science.1204994
Bond, T. C., Doherty, S. J., Fahey, D. W., Forster, P. M., Berntsen, T., DeAngelo, B. J., et al. (2013). Bounding the role of black carbon in the climate system: a scientific assessment. J. Geophys. Res. Atmospheres 118, 5380–5552. doi: 10.1002/jgrd.50171
De Jesus, D., Thompson, A. L., Knibbs, H., Kowalski, L. D., Cyrys, M., Niemi, J., et al. (2020). Long-term trends in PM2, 5 mass and particle number concentrations in urban air: The impacts of mitigation measures and extreme events due to changing climates. Env. Poll. 263, 114500. doi: 10.1016/j.envpol.2020.114500
Donald Ahrens, C., and Henson, R. (2015). Meteorology Today: An introduction to weather, climate and the environment.
EDGAR (2022). Global Emissions of All World Countries JRC/IEA/PBL 2022 Report. EDGAR. doi: 10.2760/730164
Environment Protection Department (2017). Policy on Controlling Smog. Environment Protection Department. Available online at: https://epd.punjab.gov.pk/system/files/Policy%20on%20Controlling%20Smog%20%28Final%29_0.pdf
Fuller, R., Sandilya, K., and Hanrahan, D. (2019). Pollution and Health Metrics: Global, Regional and Country Analysis. Global Alliance on Health and Pollution. Genève, Switzerland.
Gull, N., Nawaz, Y., Ali, M., Hussain, N., Nawaz, R., Mushtaq, S. K., et al. (2013). Industrial air pollution and its effects on human's respiratory system (a sociological study of Bhoun Shugar Mill District Jhang, Pakistan). Acad. J. Interdiscip. Stud. 2, 535. doi: 10.5901/ajis.2013.v2n3p535
Gupta, R. (2012). Causes of Emissions from Agricultural Residue Burning in North-West India?: Evaluation of a Technology Policy Response. Available online at: https://ideas.repec.org/s/snd/wpaper.html
Hacioglu, H., Ari, A., Özkan, A., Elbir, T., TUNCEL, S., Yay, O., and Gaga, E. (2016). A new approach for site selection of air quality monitoring stations: Multi-criteria decision-making. Aerosol Air Q. Re. 16, 273. doi: 10.4209/aaqr.2014.11.0273
Hansen, J., Sato, M. K. I., Ruedy, R., Nazarenko, L., Lacis, A., Schmidt, G. A., et al. (2005). Efficacy of climate forcings. J. Geophys. Res. 110, 1–10. doi: 10.1029/2005jd005776
Holben, B. N., Eck, T. F., Slutsker, I., Tanré, D., Buis, J. P., Setzer, A., et al. (1998). AERONET—A federated instrument network and data archive for aerosol characterization. Remote Sens. Environ. 66, 1–16. doi: 10.1016/S0034-4257(98)00031-5
Ilyas, S. Z., Khattak, A. I., Nasir, S. M., Qurashi, T., and Durrani, R. (2010). Air pollution assessment in urban areas and its impact on human health in the city of Quetta, Pakistan. Clean Technol. Environ. Policy 12, 291–299. doi: 10.1007/s10098-009-0209-4
IQAir (2021). World Air Quality Report 2021. Available online at: https://www.iqair.com/us/world-air-quality-report (accessed November 10, 2023).
Jabeen, Z., and Khokhar, M. F. (2019). Extended database of SO2 column densities over Pakistan by exploiting satellite observations. Atmos. Pollut. Res. 10, 997–1003. doi: 10.1016/j.apr.2019.01.009
Javed, Z., Liu, C., Khokhar, M. F., Xing, C., Tan, W., Subhani, M. A., et al. (2019). Investigating the impact of Glyoxal retrieval from MAX-DOAS observations during haze and non-haze conditions in Beijing. J. Environ. Sci. 80, 296–305. doi: 10.1016/j.jes.2019.01.008
Kanawade, V. P., Srivastava, A. K., Ram, K., Asmi, E., Vakkari, V., Soni, V. K., et al. (2020). What caused severe air pollution episode of November 2016 in New Delhi? Atmospheric Environ. 222, 117125. doi: 10.1016/j.atmosenv.2019.117125
Khan, W. A., Sharif, F., Khokhar, M. F., Shahzad, L., Ehsan, N., Jahanzaib, M., et al. (2023). Monitoring of ambient air quality patterns and assessment of air pollutants' correlation and effects on ambient air quality of Lahore, Pakistan. Atmosphere 14, 1257. doi: 10.3390/atmos14081257
Khattak, P., Khokhar, M. F., and Khan, S. A. (2014). Trans-boundary volcanic SO2 detected over Pakistan from satellite observations during the time period 2004-2012. Aerosol Air Q. Res. 14, 1543–1557. doi: 10.4209/aaqr.2013.12.0361
Khokhar, M. F., Anjum, M. S., Salam, A., Sinha, V., Naja, M., Ram, K., et al. (2023). Recurring South Asian smog episodes: call for regional cooperation and improved monitoring. Atmos. Environ. 295, 534. doi: 10.1016/j.atmosenv.2022.119534
Khokhar, M. F., Anjum, M. S., Salam, A., Sinha, V., Naja, M., Tanimoto, H., et al. (2021). Countries of the Indo-Gangetic Plain must unite against air pollution. Nature 598, 415. doi: 10.1038/d41586-021-02829-4
Khokhar, M. F., Nisar, M., Noreen, A., Khan, W. R., and Hakeem, K. R. (2017). Investigating the nitrogen dioxide concentrations in the boundary layer by using multi-axis spectroscopic measurements and comparison with satellite observations. Environ. Sci. Pollut. Res. 24, 2827–2839. doi: 10.1007/s11356-016-7907-3
Khwaja, H. A., Fatmi, Z., Malashock, D., Aminov, Z., Kazi, A., Siddique, A., et al. (2013). Effect of air pollution on daily morbidity in Karachi, Pakistan. J. Local Glob. Health Sci 2012, 3. doi: 10.5339/jlghs.2012.3
Levelt, P. F., Van Den Oord, G. H., Dobber, M. R., Malkki, A., Visser, H., De Vries, J., et al. (2006). The ozone monitoring instrument. IEEE Trans. Geosci. Remote Sens. 44, 1093–1101. doi: 10.1109/TGRS.2006.872333
Li, Z., Guo, J., Ding, A., Liao, H., Liu, J., Sun, Y., et al. (2017). Aerosol and boundary-layer interactions and impact on air quality. Natl. Sci. Rev. 4, 810–833. doi: 10.1093/nsr/nwx117
Mehmood, U., Azhar, A., Qayyum, F., Nawaz, H., Tariq, S., Haq, Z., et al. (2021). Air pollution and hospitalization in megacities: empirical evidence from Pakistan. Environ. Sci. Pollut. Res. 28, 51384–51390. doi: 10.1007/s11356-021-14158-0
Mishra, V., Ambika, A. K., Asoka, A., Aadhar, S., Buzan, J., Kumar, R., et al. (2020). Moist heat stress extremes in India enhanced by irrigation. Nat. Geosci. 13, 722–728. doi: 10.1038/s41561-020-00650-8
Morawska, L., Zhu, T., Liu, N., Torkmahalleh, M. A., Fatima Andrade, d. M., Barratt, B., et al. (2021). The state of science on severe air pollution episodes: quantitative and qualitative analysis. Environ. Int. 156, 106732. doi: 10.1016/j.envint.2021.106732
Ojha, N., Sharma, A., Kumar, M., Girach, I., Ansari, T. U., Sharma, S. K., et al. (2020). On the widespread enhancement in fine particulate matter across the Indo-Gangetic Plain towards winter. Sci. Rep. 10, 5862. doi: 10.1038/s41598-020-62710-8
Onat, B., and Stakeeva, B. (2013). Personal exposure of commuters in public transport to PM2, 5. and fine particle counts. Atmos Pollut Res. 4, 329–335. doi: 10.5094/APR.2013.037
Ramachandran, S., Rupakheti, M., and Lawrence, M. G. (2020). Black carbon dominates the aerosol absorption over the Indo-Gangetic Plain and the Himalayan foothills. Environ. Int. 142, 105814. doi: 10.1016/j.envint.2020.105814
Ratnam, M. V., Prasad, P., Raj, S. T. A., Raman, M. R., and Basha, G. (2021). Changing patterns in aerosol vertical distribution over South and East Asia. Sci. Rep. 11, 308. doi: 10.1038/s41598-020-79361-4
Razi, M., Dörner, S., Donner, S., Ahmad, N., Khokhar, F., Wagner, T., et al. (2022). Study of the interrelationships between NO2, SO2. HCHO and CHOCHO vertical column densities derived by car MAX-DOAS observations in and around the megacity of Lahore, Pakistan. EGU Gener. Assembly Conf. Abstract, EGU22, 10254. doi: 10.5194/egusphere-egu22-10254
Resmi, E. A., Murugavel, P., Dinesh, G., Balaji, B., Leena, P. P., Mercy, V., et al. (2019). Observed diurnal and intraseasonal variations in boundary layer winds over Ganges valley. J. Atmos. Sol. Terr. Phys. 188, 11–25. doi: 10.1016/j.jastp.2019.03.012
Saaty, R. W. (1987). The analytic hierarchy process—what it is and how it is used. Mathematic. Modell. 9, 161–176. doi: 10.1016/0270-0255(87)90473-8
Sahin, F., Kara, M. K., Koc, A., and Sahin, G. (2020). Multi-criteria decision-making using GIS-AHP for air pollution problem in Igdir Province/Turkey. Environ. Sci. Pollut. Res. 27, 36215–36230. doi: 10.1007/s11356-020-09710-3
Saini, V., Li, J., Yang, Y., and Li, J. (2023). Evaluating environmental quality in Rujigou coalfield, China, using analytic hierarchy process. Environ. Sci. Pollut. Res. 30, 1841–1853. doi: 10.1007/s11356-022-22340-1
Savee, J. D., Papajak, E., Rotavera, B., Huang, H., Eskola, A. J., Welz, O., et al. (1979). (2015). Direct observation and kinetics of a hydroperoxyalkyl radical (QOOH). Science 347, 643–646. doi: 10.1126/science.aaa1495
Sawlani, R., Agnihotri, R., Sharma, C., Patra, P. K., Dimri, A. P., Ram, K., et al. (2019). The severe Delhi SMOG of 2016: a case of delayed crop residue burning, coincident firecracker emissions, and atypical meteorology. Atmos. Pol. Res 10, 868–879. doi: 10.1016/j.apr.2018.12.015
Sjogren, S., Gysel, M., Weingartner, E., Baltensperger, U., Cubison, M. J., Coe, H., et al. (2007). Hygroscopic growth and water uptake kinetics of two-phase aerosol particles consisting of ammonium sulfate, adipic and humic acid mixtures. J. Aerosol. Sci. 38, 157–171. doi: 10.1016/j.jaerosci.2006.11.005
Tao, J., Cheng, T., Zhang, R., Cao, J., Zhu, L., Wang, Q., et al. (2013). Chemical composition of PM 2.5 at an urban site of Chengdu in southwestern China. Adv. Atmos. Sci. 30, 1070–1084. doi: 10.1007/s00376-012-2168-7
Tao, J., Zhang, L., Zhang, Z., Huang, R., Wu, Y., Zhang, R., et al. (2015). Control of PM2, 5. in Guangzhou during the 16th Asian Games period: implication for hazy weather prevention. Sci. Total Environ. 508, 57–66. doi: 10.1016/j.scitotenv.2014.11.074
Verma, S., Ramana, M. V., and Kumar, R. (2022). Atmospheric rivers fueling the intensification of fog and haze over Indo-Gangetic Plains. Sci. Rep. 12, 5139. doi: 10.1038/s41598-022-09206-9
Yasmeen, Z., Rasul, G., and Zahid, M. (2012). Impact of aerosols on winter fog of Pakistan. Pakistan J. Meteorol. 8, 16.
Yin, L., Niu, Z., Chen, X., Chen, J., Zhang, F., and Xu, L. (2014). Characteristics of water-soluble inorganic ions in PM 2.5 and PM 2.5-10 in the coastal urban agglomeration along the Western Taiwan Strait Region, China. Environ. Sci. Pollut. Res. 21, 5141–5156. doi: 10.1007/s11356-013-2134-7
Yun, G., Yang, C., and Ge, S. (2022). Understanding Anthropogenic PM2, 5. concentrations and their drivers in China during 1998–2016. Int. J. Environ. Res. Pub. Health 20, 695. doi: 10.3390/ijerph20010695
Zeb, N., Khokhar, M. F., Pozzer, A., and Khan, S. A. (2019). Exploring the temporal trends and seasonal behaviour of tropospheric trace gases over Pakistan by exploiting satellite observations. Atmos. Environ. 198, 279–290. doi: 10.1016/j.atmosenv.2018.10.053
Zhang, M., Chen, S., Zhang, X., Guo, S., Wang, Y., Zhao, F., et al. (2023). Characters of particulate matter and their relationship with meteorological factors during winter Nanyang 2021–2022. Atmosphere 14, 137. doi: 10.3390/atmos14010137
Zhang, N., Cao, J., Liu, S., Zhao, Z., Xu, H., Xiao, S., et al. (2014). Chemical composition and sources of PM2, 5. and TSP collected at Qinghai Lake during summertime. Atmos. Res. 138, 213–222. doi: 10.1016/j.atmosres.2013.11.016
Keywords: air pollution, Indo-Gangetic Plains, smog, transboundary, particulate matter, South Asia
Citation: Majeed R, Anjum MS, Imad-ud-din M, Malik S, Anwar MN, Anwar B and Khokhar MF (2024) Solving the mysteries of Lahore smog: the fifth season in the country. Front. Sustain. Cities 5:1314426. doi: 10.3389/frsc.2023.1314426
Received: 10 October 2023; Accepted: 29 November 2023;
Published: 05 January 2024.
Edited by:
Ahmet Cilek, Arizona State University, United StatesReviewed by:
Mustafa Ustuner, Artvin Çoruh University, TürkiyeTunahan Çinar, Duzce University, Türkiye
Copyright © 2024 Majeed, Anjum, Imad-ud-din, Malik, Anwar, Anwar and Khokhar. This is an open-access article distributed under the terms of the Creative Commons Attribution License (CC BY). The use, distribution or reproduction in other forums is permitted, provided the original author(s) and the copyright owner(s) are credited and that the original publication in this journal is cited, in accordance with accepted academic practice. No use, distribution or reproduction is permitted which does not comply with these terms.
*Correspondence: Muhammad Fahim Khokhar, fahim.khohkar@iese.nust.edu.pk
†Present address: Muhammad Imad-ud-din, Aga Khan Health Services, Karachi, Pakistan