Reducing the “digital divide” to reap the “digital dividend”: spatial differences and convergence of the digital economy in cities of China
 Jing Han
 Yang Song2
  Jisheng Chen
- 1School of Economics, Tianjin University of Finance and Economics, Tianjin, China
- 2Center for Macroeconomics Research, Paula and Gregory Chow Institute for Studies in Economics, Xiamen University, Xiamen, China
- 3School of Management and Economics, University of Electronic Science and Technology of China, ISCTE Lisbon University Institute, Xiamen Powerway Advanced Material Co., Ltd, Xiamen, China
Bridging the “digital divide” to benefit from the “digital dividend” reflects the inclusive development of the digital economy, which affects the sustainable development of the overall economy and society. Based on the different spatial perspectives of certain regions, city clusters, and cities, this study presents the “digital divide” and “digital dividend” for the development of China's digital economy. A combined entropy method was used to measure the development of the digital economy in cities of China from 2011 to 2019. The Dagum Gini coefficient and its decomposition were used to explore the spatial differences of the digital economy and their sources, while the coefficient of variation and the spatial panel model were used to examine the convergence of the digital economy. Our findings suggest that the development level of the digital economy in Chinese cities has continuously improved. Second, the spatial differences of the digital economy in the four regions and nine city clusters of China that were investigated are decreasing, indicating that the “digital divide” is narrowing and presenting a significant “digital dividend.” The total differences were mainly owing to those between the regions (among the city clusters). Third, the development of the digital economy in the four regions and nine city clusters demonstrated characteristics of σ, β, and club convergences. Finally, the evolution path of the spatial differentiation of the digital economy in cities of China is presented, and the “digital dividend” also demonstrates different stage characteristics. This study analyzed the spatial differences in the digital economy of cities in China and clarified the convergence and influence mechanisms of its development at different spatial scales. The findings provide a basis for the evolution of spatial and temporal patterns of the digital economy of cities in China and presents policy implications for promoting the regionally coordinated and sustainable development of the digital economy. Suggestions from the national and regional levels are more necessary to further narrow the “digital divide,” create a “digital dividend,” and digital drives sustainable economic development.
1 Introduction
The development of digital economy brings many opportunities and challenges (Allcott et al., 2022), and the technology gaps shapes global economic outcomes (Sampson, 2023). Sharing the dividends of the digital era is critical for promoting China's digital development; that is, bridging the “digital divide” to promote the “digital dividend” is key for achieving the national digital development strategy, which can further promote the inclusive development of the entire social system (Norris and Conceição, 2004). This would be beneficial for the sustainable development of all the countries and their population (Liu et al., 2023). Mankind is undergoing a new round of technological revolution based on the internet, and the global economy has entered a new stage of digital economic development, which has become the focus of national economic development strategies. With the development of information and communication technology (ICT), whether China's digital economic development will form a more insurmountable “digital divide” or share the “digital dividend” is under consideration. A “digital divide” indicates that in the process of informatization, there is a gap between the individuals in the economic development, application of information technology, popularization of the informational infrastructure, and ability to obtain and process information (Xu et al., 2013), which is mainly reflected in the gap between regions within a country (Hu and Zhou, 2002). However, if the convenience of digital technology for individuals with limited knowledge can effectively reduce the spatial difference of the digital economy, that is, reduce the “digital divide,” the “digital dividend” can be demonstrated. There is limited information regarding whether there is a significant spatial variation in the development of China's digital economy, whether the difference is increasing or decreasing, and the root causes. Considering that China's digital economy market is large and the socioeconomic, demographic, and infrastructure conditions among cities can be very diverse, the relevant research needs to be explored in depth to the submarkets in different regions, and the evolution characteristics of the spatial differences in digital economy development in different submarkets are different (Wang and Lee, 2022). Therefore, studying the spatial differences and dynamic evolutionary characteristics of China's digital economy is theoretically significant.
This study aims to analyze the spatial differences of China's digital economy in order to explore the problems of “digital divide” and “digital dividend.” The marginal contribution of the study are as follows. First, this study innovatively puts forward the differentiation of the evolution path of spatial differences of digital economy and makes up for the gaps in the theoretical and empirical analysis of China's “digital divide” and “digital dividend,” starting from the different spatial scales of a region, city cluster, and city. Second, in order to make the evaluation results objective and reasonable and overcome the problem of single evaluation, the combined weighting method is adopted to determine the weight after comprehensive consideration. Third, the spatial differences in the digital economy of Chinese cities were investigated and the characteristics of the current stage of the evolution path were empirically analyzed. Finally, using appropriate spatial econometric models, the σ, β, and club convergence effects of the digital economy of Chinese cities were comprehensively analyzed at different spatial scales, exploring the influencing factors and the policy path to promote the transformation from a “digital divide” to the “digital dividend” in China.
2 Literature review
2.1 Research on the concept of digital economy
The digital economy can be defined by being divided into broad and narrow attributions. Tapscott (1996) first proposed the “digital economy” concept in 1996, indicating that the digital economy is an economic system with the extensive use of ICT technology. Since then, the Organization for Economic Cooperation and Development (OECD), the U.S. Bureau of Economic Analysis (BEA), G20, and China Academy of Information and Communications Technology have continuously proposed and enriched the meaning of the digital economy. The “digital divide,” which was first proposed by the United States in 1995, and the concept of the “digital dividend,” which was formally proposed by the World Bank in 2016 (World Bank., 2016), have become critical for achieving the inclusive development of the digital economy, involving the digital differences between countries and regions.
2.2 Research on the measurement of digital economy
Studies have focused on the digital economic measurement. Scholars believe that the measurement methods of the digital economy can be divided into three categories: (1) A direct estimation method (Machlup, 1962; Porat, 1977), in which the measurement scope and method of value-addition of the digital economy are not unified, resulting in significant differences in the measurement results. The details of the measurement are controversial. (2) Construction of the digital economy satellite account (DESA), which remains in the continuous improvement stage and is immature. (3) The establishment of a multidimensional index system to evaluate the digital economy. Considering the measurement index system of the digital economy domestically and internationally, various international organizations, government agencies, and scholars have proposed different index systems defining the concept and scope of the digital economy, including the following: a digital infrastructure focusing on the informational infrastructure (Wang et al., 2021), digital industrialization as the foundation of the development of the digital economy, including the telecommunications industry, software, and information technology service industry (China Academy of Information and Communications Technology, 2020). Furthermore, industrial digitalization is the integration of digital technology and the real economy, mainly reflected in e-commerce (OECD, 2014), digital inclusive finance (Zhang et al., 2019; Zhao et al., 2020), and other aspects. Another study investigated the development environment of the digital economy (Wang et al., 2021).
2.3 Research on the spatial differences in the digital economy
Relevant studies mostly focus on the impact of digital economy, such as the impact of digital economy on employment (Jetha et al., 2023), the significant promotion of industrial intelligence to the green transformation of businesses (Xu et al., 2023), and the significant improvement effect of digital economy on ESG performance (Chen et al., 2022; Kwilinski et al., 2023). Studies exploring the spatial differences in the digital economy and the “digital divide” have been limited. Wang (2005) considered the internet as an example and proposed that there was an apparent “digital divide” between China's geographical regions, demonstrating large differences. The development of China's digital economy is characterized by regional heterogeneity and spatial imbalances (Liu et al., 2020; Han et al., 2021; Wang et al., 2021; Luo and Zhou, 2022). China's provincial digital economy has a high probability of upward transfer, and has great potential for development (Luo and Zhou, 2022). Kartiasih et al. (2023) revealed the spatial inequalities in the digital development of households and individuals at 460 districts/cities in Indonesia, with significant regional digital divide, however, narrowing from 2015 to 2019, indicating that Indonesian regions are becoming more digitally convergent. Lucendo-Monedero et al. (2019) proposed the spatial inequalities of households and individuals in digital development in Europe at the regional level, i.e., the digital divide. Nishida et al. (2014) pointed out that there is a geographic digital divide in Japan, and more needs to be done to bridge the internal digital divide for the substantial digital inequities. With regard to the factors influencing spatial differences in the digital economy and the “digital divide,” Myovella et al. (2021) analyzed the determinants for digital divide in Sub-Saharan Africa (SSA), including GDP per capita, gross capital formation, political stability, regulatory efficacy and electricity infrastructure. Through their present research on the digital divide in the U.S., Pick et al. (2015) argues that the major variable groups associated with higher ICT levels are social capital, societal openness and ethnicity. The spatial differentiation of China's provincial digital economy was caused by the interaction of multiple factors, led by economic conditions and R&D expenditure (Luo and Zhou, 2022).
Although existing studies on the digital economy have progressed, the research objects, content, and methods can be further explored. Most existing studies measure the development level of the digital economy at a national or provincial scale, whereas there are insufficient studies focusing on cities. There is a significant spatial relationship between technological innovation and economic development quality in city clusters (Liu et al., 2022). As a new source, studying the digital economy of city clusters is highly significant. Regarding the research methods and content, first, there is still a gap in the theoretical and empirical analysis of China's regional “digital divide” and “digital dividend.” Second, as for the measurement methods of digital economy, the determination methods of the index weight include subjective and objective weighting methods, and principal component analysis method (Zhao et al., 2020) and entropy method (Wang et al., 2021) are mostly used, which have the defect of a single method. Third, the studies on the spatial differences and evolution of the digital economy of cities remain limited. The commonly used decomposition measures of the Theil index present errors in the spatial differences (Dagum, 1997). To address the non-consideration of the overlapping parts among different regions using other indices, the Dagum Gini coefficient fully identifies the contribution of inter-regional disparities to the overall regional disparities by identifying the hypervariable density (Cheng, 2020). Finally, studies on the convergence effect of the digital economy of cities are lacking; this needs more focus. The spatial econometric model introduces spatial factors based on the conventional econometric model and considers the influence of the spatial correlation on the development of the digital economy. Thus, the model is closer to the objective facts.
3 Research methods and data
3.1 Measurement of the digital economy by city
3.1.1 Index selection
Based on the measurement index system of the domestic and international digital economy, as well as on the core content of the digital economy, this study refers to the research by Zhao et al. (2020), and Chen et al. (2022), and combines the availability of relevant data at the city level to measure the comprehensive development of the digital economy in two dimensions: the development of the internet and digital financial inclusion. First, the dimension of internet development includes the digital infrastructure and related industries. It adopts the following four indicators: mobile phone penetration rate, internet penetration rate, output of related industries, and employment of related industries, which indicate the number of mobile phone users per 100 individuals, number of internet broadband access users per 100 individuals, per capita telecom service income, and proportion of computer service and software employees in the city units, respectively. Second, the development dimension of digital finance reflects the integration of digital industries and adopts the China Digital Inclusive Finance Index.
3.1.2 Measurement method
A combined weighting method was adopted to determine the weight; specifically, the entropy method of the objective weighting method was used to weigh the specific evaluation indicators of each dimension. The weight was calculated using the entropy value, that is, the degree of variation of each indicator. The improved entropy weight method proposed by Yang and Sun (2015) was used to add the time variable. Subsequently, the two aforementioned dimensions (the internet development and digital finance) were equally weighted. The development level of the digital economy in Chinese cities from 2011 to 2019 was then measured and analyzed.
3.1.3 Data source and description
The original data were obtained from the China City Statistical Yearbook, Peking University Digital Inclusive Financial Index (Guo et al., 2020), statistical yearbooks and bulletins of certain prefecture-level cities, and the CEIC database. The research objects of this study included 281 prefecture-level and above cities. At the regional level, the research participants were from the eastern, central, western, and northeastern regions. Considering the city-cluster level, the following nine representative city clusters were selected: Beijing–Tianjin–Hebei, Yangtze River Delta, Pearl River Delta, middle reaches of the Yangtze River, Chengdu–Chongqing, Guanzhong Plain, Harbin–Changchun, Central Plain, and the Beibu Gulf. The study period ranged from 2011 to 2019. For the price index of the telecom business revenue, to eliminate the impact of inflation, this study deflated the GDP index of the prefecture-level cities using 2011 as the base period.
3.2 Gini coefficient and its decomposition
In this study, the Dagum Gini coefficient and its decomposition was used to analyze the spatial differences and sources in the digital economy of Chinese cities (Dagum, 1997). The Equation (1) for calculating the Dagum Gini coefficient is as follows:
where G denotes the overall Gini coefficient, n is the number of cities, k is the number of subgroups, nj(nh) is the number of cities in j(h), j(h) is the subscript of the city clusters, and i(r) is the subscript of the cities. yji(yhr) represents the digital economy measurement value of city i(r) in subgroup j(h) and represents the mean value of the digital economy of all the cities. A larger value of the Dagum Gini coefficient indicates a more unbalanced development of the digital economy.
The Dagum Gini coefficient can be decomposed into the sum of the contribution of the intra-regional differences, the net contribution of the inter-regional differences, and the contribution of the hypervariable density.
3.3 Convergence models
3.3.1 σ convergence
The σ convergence level reflects the process by which the dispersion of the development of the digital economy of different regions decreases overtime. The commonly used coefficient of variation reflects the relative differences. Therefore, this study used the coefficient of variation to test the σ convergence. The Equation (2) used is as follows:
Here, CV is the coefficient of variation and the remaining variables are the same as in Equation (1); namely, yji indicates the development level of the digital economy of the subgroup j and city i, is the mean value of the digital economy of subgroup j, and nj represents the number of cities in subgroup j.
3.3.2 β convergence
The β convergence is a necessary but insufficient condition for the σ convergence; β refers to the rate convergence, which includes the absolute and conditional β convergences. The absolute β convergence indicates that cities with low initial levels of digital economic development have higher growth rates than those with high levels of digital economic development. The conditional β convergence refers to the phenomenon between cities after controlling a series of other influencing factors. According to Barro and Sala-I-Martin (1991), the absolute convergence model can be set by obtaining the annual growth rate of a city's digital economy as the dependent variable, as shown in Equation (3):
Here, yi, t and yi, t+1 represent the development level of the digital economy for periods t and t+1, respectively, of subgroup i; μi, ηt, and εit indicate the fixed spatial effects, fixed time effects, and interference terms, respectively. β represents the convergence coefficient. If β < 0 statistically significant, it indicates a converging trend for the digital economy of Chinese cities; if β>0 statistically significant, it indicates a diverging trend. The speed of convergence (divergence) is indicated by s = −ln(1−|β|)/T during the investigating period T; the half-life cycle is approximately indicated by τ = ln(2)/s, and the unit is in years (Lv et al., 2020).
The development of digital economy is affected by geographical location, and spatial analysis is necessary (Pick and Nishida, 2015; Lucendo-Monedero et al., 2019; Setthasuravich and Kato, 2022). Owing to the increasing interaction effect between cities, it is necessary to introduce the spatial effect into the conventional convergence model to construct the β convergence. A non-spatial panel model was used to construct robust LM statistics for the spatial autocorrelation test. If a spatial correlation is evident, a spatial econometric analysis should be conducted and appropriate spatial econometric models should be selected; namely, the spatial lag model (SAR), spatial error model (SEM), and spatial Durbin model (SDM), as shown in Equations (4–6), respectively. Else, the conventional convergence model is selected and the least squares estimation method (OLS) is used for estimation.
where, wij represents the row i and column j elements of the spatial weight matrix W. In this study, a spatial weight matrix for the geographical distance was used, which decays as the distance increases. ρ is the spatial lag coefficient, λ is the spatial error coefficient, θ is the influence of the spatial lag value of the digital economy in the base period on the explained variable, and the other variables are the same as those indicated in Equation (3).
The conditional β convergence model introduces control variables based on the absolute β convergence model, as shown in Equation (7):
Three spatial econometric models were used to construct the conditional β convergence models, as shown in Equations (8–10).
where Xi, t is the vector of the control variables, γ is the influence of the spatial lag value of the control variables on the explained variables, and the other variables are the same as those indicated in Equations (4–6). In this study, the following four control variables, indicated by Xi, t, were selected based on Qin and Zhang (2009), Jiao and Sun (2021), and Myovella et al. (2021): (1) Industrial structure upgrading (IND), which is measured by the ratio of the output value of the tertiary and secondary industries. (2) Marketization level (MAR), which is represented by the ratio of the local fiscal expenditure to the GDP (negatively correlated with the level of marketization). (3) Human capital (SCH), which is expressed as the number of students enrolled in regular institutions of higher education per 10,000 individuals. (4) The economic development level (GDP), which is expressed as the per capita GDP, deflated by the GDP index of the prefecture-level cities, considering 2011 as the base period.
3.3.3 Club convergence
Club convergence refers to the convergence of the economic growth of a group of regions to the same steady-state; these regions are similar in terms of the initial conditions and structural characteristics considering economic growth (Barro and Sala-I-Martin, 1991). Regarding the structural and diversified characteristics of the cluster system of Chinese cities, we classify the market into three submarkets for further analysis, that is, the nine city clusters were divided into the following categories based on the study of Yu et al. (2021) to test the club convergence: the first tier consisted of the highest level of national city clusters, including the Yangtze River Delta, Pearl River Delta, and Beijing–Tianjin–Hebei city clusters. The second tier consisted of the higher-level regional city clusters, including the middle reaches of the Yangtze River and Chengdu–Chongqing city clusters. The third tier consisted of the regional city clusters at the general level, including the Central Plain, Harbin–Changchun, Guanzhong Plain, and the Beibu Gulf city clusters.
4 Spatial differences and decomposition of the digital economy in Chinese cities
The comprehensive scores of the development of the digital economy in Chinese cities from 2011 to 2019 has continuously improved. A sustainable development was achieved at a higher level, reflecting the high-quality development of the digital economy in Chinese cities. However, significant spatial differences were determined in the development level of the digital economy in the Chinese cities.
4.1 Four major regions
The specific calculation results for the Dagum Gini coefficient, which indicates the differences in the development level of the digital economy in China's four regions from 2011 to 2019, are presented in Table 1.
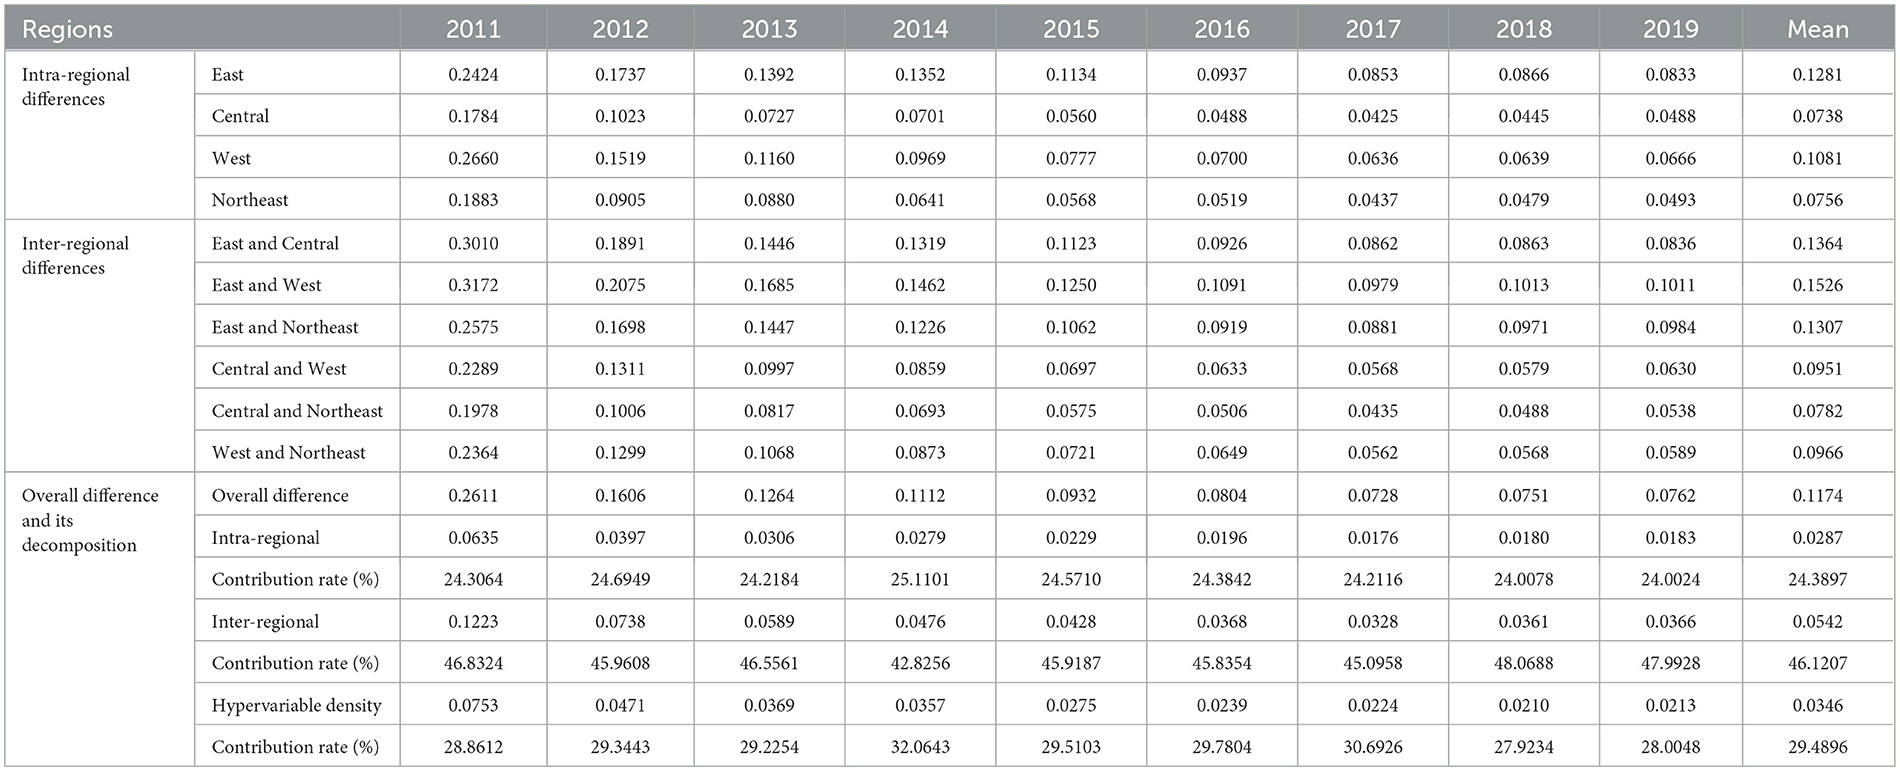
Table 1. Analysis of the differences in the development levels of the digital economy in four major regions of China from 2011 to 2019.
4.1.1 Intra-regional differences
Considering the mean values, the regional difference of the digital economy in the eastern region is the largest with a mean value of 0.13, indicating an unbalanced development and a large “digital divide,” which stems from the polarization of Shenzhen, Beijing, Guangzhou, and other cities in the eastern region. Next is the western and northeastern regions, with mean values of 0.11 and 0.08, respectively. The difference in the central region is the smallest with a mean value of 0.07, indicating that the development of the digital economy in this region is relatively balanced, and the “digital divide” is the smallest. Considering the changing trends, the differences within each region demonstrated a decreasing trend. Despite the differences within certain regions marginally increasing after 2017, the overall decreasing trend is not affected, reflecting a reduction in the “digital divide” within each region and demonstrating the significant “digital dividend.” The intra-regional disparity in the western region decreased the fastest, with an average annual rate of 15.90%. This was followed by the northeast and central regions. The decreasing speed of the intra-regional differences in the eastern region was relatively slower than that of the other regions.
4.1.2 Inter-regional differences
Considering the mean values, the difference in the digital economies of the eastern and western regions is the most significant with a mean value of 0.15, which indicates that the largest “digital divide” is between the eastern and western regions. This is followed by the difference between the eastern and central regions, and that between the eastern and northeast regions, with mean values of 0.14 and 0.13, respectively. The difference in the digital economy between the central and western regions and between the western and northeast regions is relatively small, with a mean of approximately 0.10. The difference in the digital economy between the central and northeast regions is the smallest, with a mean value of 0.08, indicating that the “digital divide” between the central and northeast regions is the smallest. The differences among all the regions demonstrate a decreasing trend. However, after 2017, the differences between certain regions marginally increased, which did not affect the overall decreasing trend, reflecting a reduction in the “digital divide” among all the regions and demonstrating the significant “digital dividend.” The gap between the western and northeastern regions decreased the fastest, with an average annual growth rate of 15.94%. The decreasing speed between the eastern and northeastern regions was slower than that between the other regions.
4.1.3 Overall difference and its decomposition
During the study period, the overall difference of the digital economy in Chinese cities demonstrated a decreasing trend from 0.26 in 2011 to 0.08 in 2019, with an average annual decrease of 14.27%. The effect was significant, reflecting a reduction of the overall “digital divide” in China and demonstrating the significant “digital dividend.” After 2017, the overall gap marginally increased but did not affect the overall decreasing trend. The annual average contribution rates of the intra-regional, inter-regional, and hypervariable density were 24.39%, 46.12%, and 29.49% during the study period, respectively. The contribution rate of the hypervariable density of the digital economy was higher than that of the intra-regional difference, and its contribution to the overall difference was greater. The coefficients of the intra-regional, inter-regional, and hypervariable densities demonstrated a downward trend. The contribution rates of the inter-regional differences fluctuated between 42.83 and 48.07%, and marginally increased at the end of the study compared to the beginning. The contribution rates of the intra-regional differences ranged from 24.00 to 25.11%, demonstrating a downward trend. The contribution rate of the hypervariable density fluctuated between 27.92 and 32.06% and decreased slightly at the end of the study compared to that at the beginning.
4.2 Nine major city clusters
For the analysis of the difference in the development level of the digital economy in China's nine city clusters from 2011 to 2019, the calculation results of the Dagum-Gini coefficient are shown in Table 2.
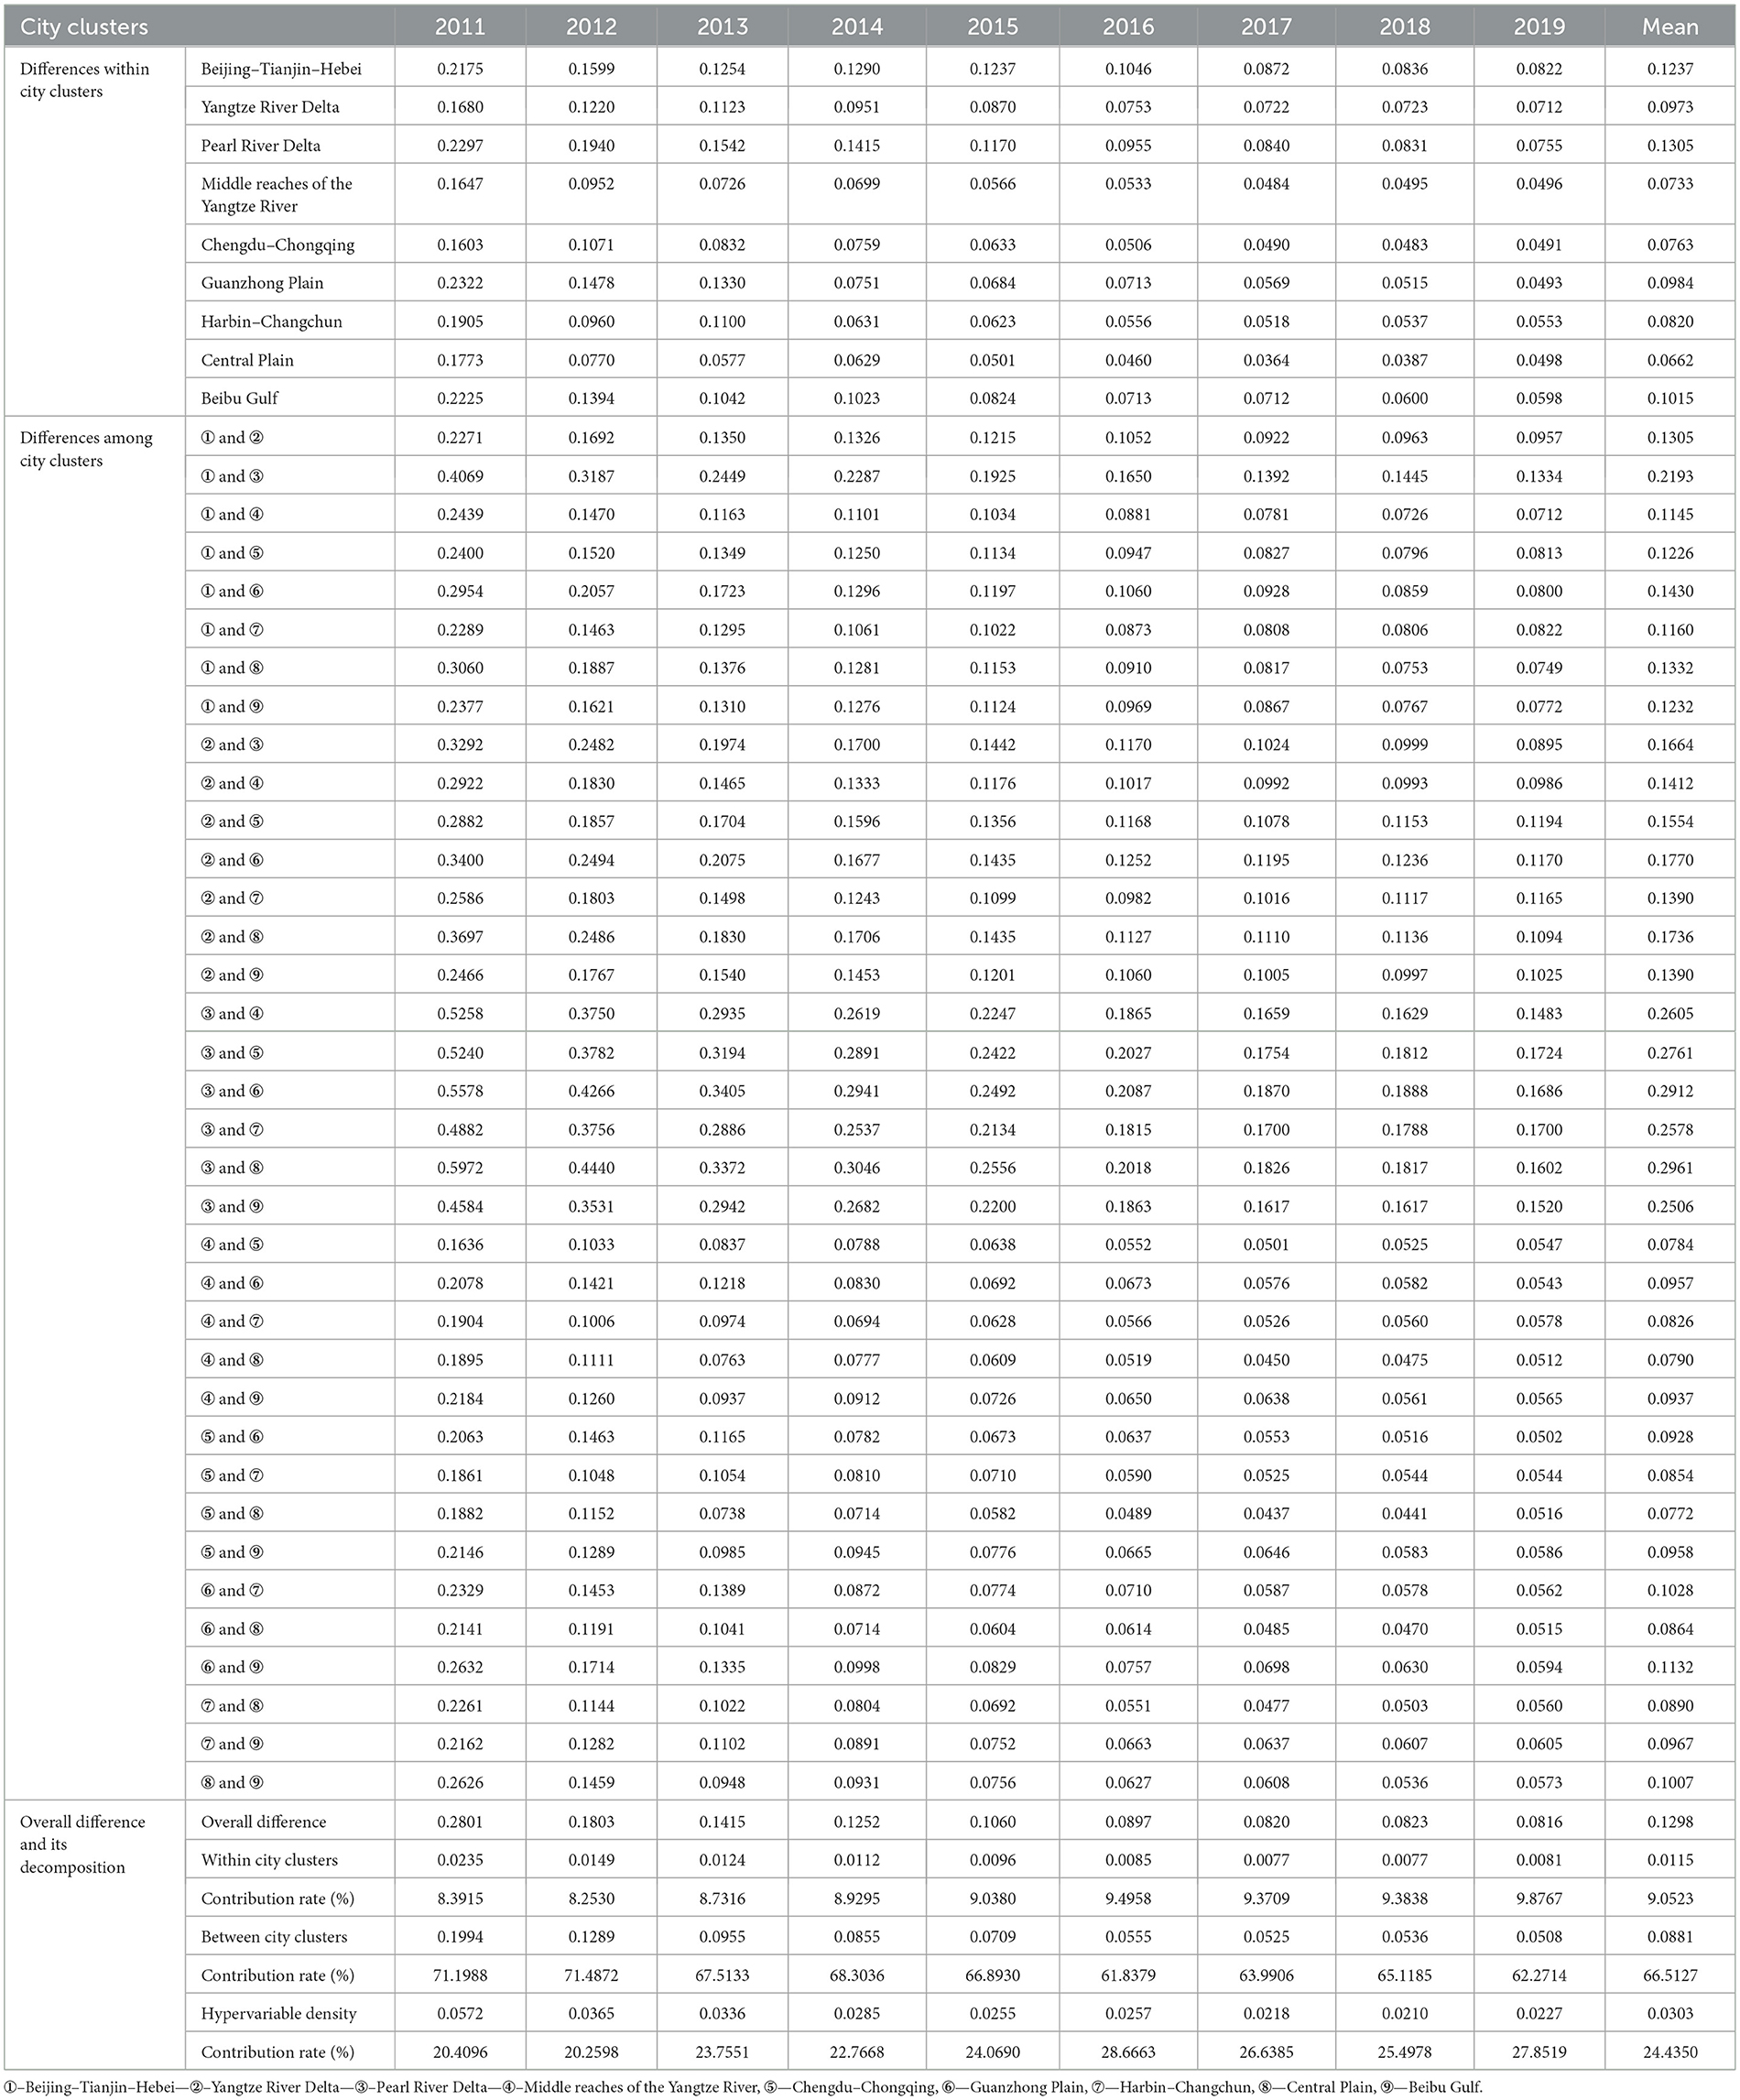
Table 2. Analysis of the differences in the development level of the digital economy in nine city clusters of China from 2011 to 2019.
4.2.1 Differences within city clusters
Based on the mean values, the Pearl River Delta and Beijing–Tianjin–Hebei city clusters demonstrated larger differences within the city clusters with mean values of 0.13 and 0.12, respectively, indicating that the digital economy is unbalanced and that there is a large “digital divide” owing to the polarized status of Shenzhen, Beijing, and other cities in the respective city clusters. The differences within the city clusters of the Central Plain, middle reaches of the Yangtze River, and Chengdu–Chongqing are relatively small, indicating a small “digital divide.” The internal difference within each city cluster exhibits a decreasing trend, reflecting the reduction of the “digital divide” in each city cluster, and demonstrating the significant “digital dividend.” The internal differences of the Harbin–Changchun and Central Plain city clusters have recently increased marginally, but this does not affect the overall decreasing trend. The within-city disparities in the Guanzhong Plain and Beibu Gulf decreased rapidly, with average annual rates of 17.61 and 15.15%, respectively. The decreasing speed of the disparities within the Yangtze River Delta city cluster is slower than that in other regions.
4.2.2 Differences among city clusters
Based on the mean values regarding the digital economy, the differences between the Pearl River Delta and Central Plain, Pearl River Delta and Guanzhong Plain, Pearl River Delta and Chengdu–Chongqing city clusters are larger, with mean values of 0.30, 0.29, and 0.28, respectively, reflecting significant differences between the Pearl River Delta, as a relatively mature city cluster, and other developing city clusters, indicating a large “digital divide” among these city clusters. There is a relatively small difference in the digital economy between Chengdu–Chongqing and the Central Plain, the middle reaches of the Yangtze River and Chengdu–Chongqing, and the middle reaches of the Yangtze River and the Central Plain, which indicates that the “digital divide” is small between these developing city clusters. The differences among the nine city clusters all present a decreasing trend, reflecting the reduction of the “digital divide” among the city clusters, demonstrating the significant “digital dividend.” Among these, the differences between the Yangtze River Delta and Chengdu–Chongqing, as well as the middle reaches of the Yangtze River and the Central Plain, have recently increased marginally, but have not affected the overall decreasing trend. The gap between the Central Plain and Beibu Gulf decreased the fastest, with an annual average of 17.33%. The decreasing speed between the Beijing–Tianjin–Hebei and Yangtze River Delta clusters and between the Yangtze River Delta and Harbin–Changchun city clusters is relatively slow.
4.2.3 Overall difference and its decomposition
During the study period, the overall difference of the digital economy in the city clusters demonstrated a decreasing trend from 0.28 in 2011 to 0.08 in 2019, with an average annual decrease of 14.29%, which indicated a significant effect reflecting the reduction of the overall “digital divide” in the city clusters and demonstrating the significant “digital dividend.” Regarding the sources of difference, the annual average contribution rates of the intra-urban agglomeration, inter-urban agglomeration, and hypervariable density during the study period were 9.05%, 66.51%, and 24.43%, respectively. The difference among city clusters was the main source of the overall difference in the digital economy. The contribution rate of the hypervariable density of the digital economy was higher than that of the difference within the city clusters, and its contribution to the overall difference was larger. The coefficients of intra-urban agglomeration, inter-urban agglomeration and hypervariable density demonstrate a downward trend; in particular, the coefficient between the city clusters decreases significantly. The contribution rates of the differences between the city clusters ranged from 61.84 to 71.49%, demonstrating a downward trend during the study period. The contribution rate of the differences within the city clusters ranged from 8.25 to 9.88%, demonstrating an upward trend. The contribution rate of the hypervariable density ranged from 20.26 to 28.67%, demonstrating an increasing trend and indicating a significant overlapping phenomenon in the city clusters.
5 Analysis of convergence effects of the digital economy in Chinese cities
5.1 σ convergence
The σ convergence calculation method indicates that the σ convergence of the development of the digital economy of Chinese cities from 2011 to 2019 is based on the coefficient of variation (CV), the results of which are shown in Table 3.
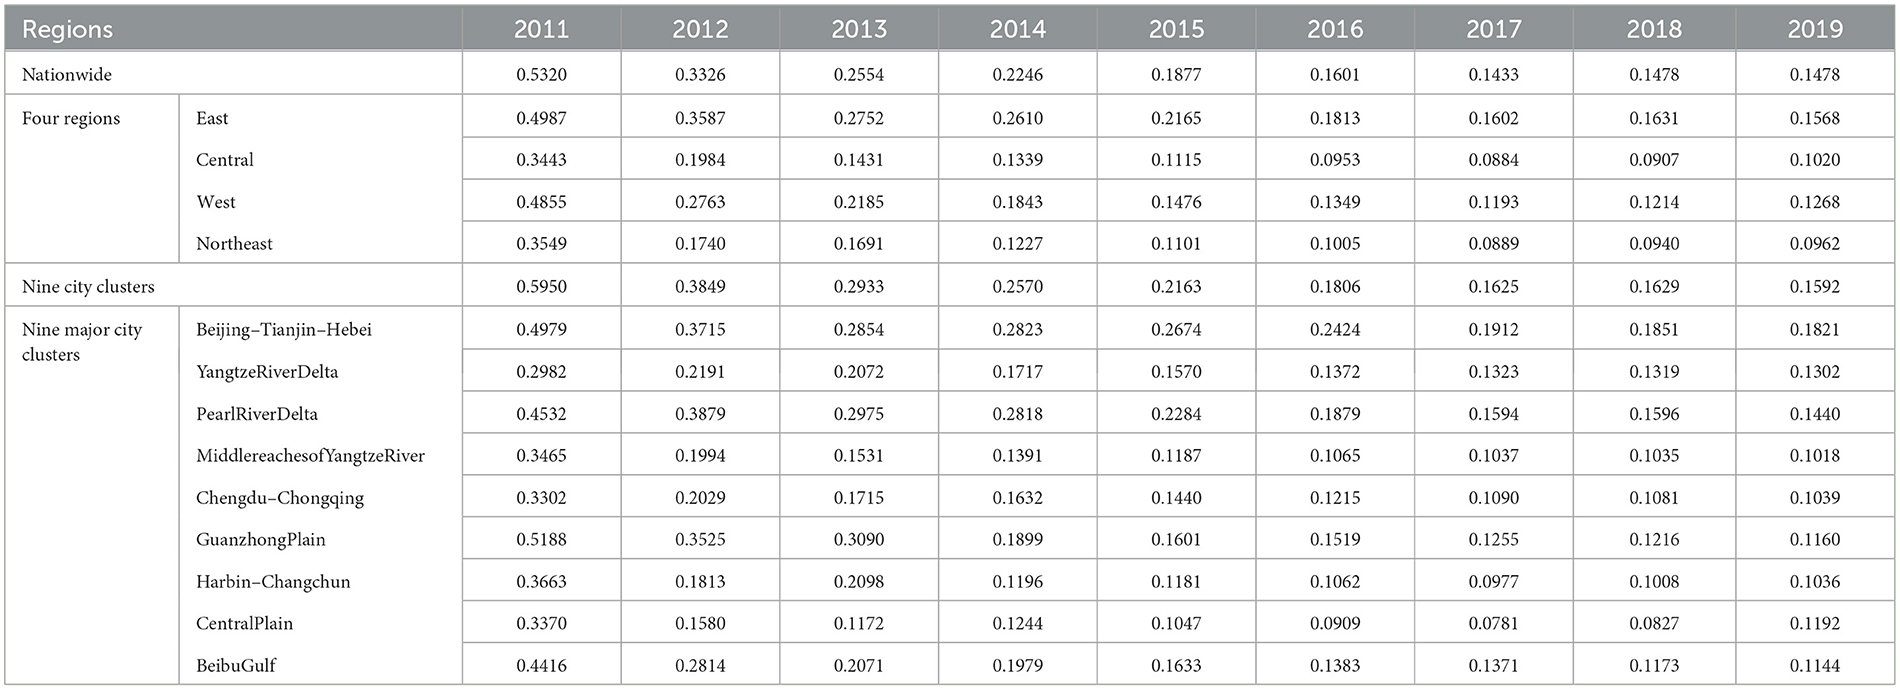
Table 3. σ coefficients of the digital economy in Chinese cities.
The σ convergence coefficients of the national and four major regions demonstrate a downward trend. Despite the σ convergence coefficients of certain regions increasing marginally after 2017, it does not affect the overall downward trend. The average annual decline rate of the overall σ convergence coefficient in China was 14.79%, and that of the western region was 15.45%, which indicates the fastest conversion. Compared to other regions, the σ convergence coefficient of the eastern region had the slowest annual decline rate. Meanwhile, the σ convergence coefficients of the overall city clusters and that of each city cluster demonstrated a downward trend, among which the σ convergence coefficients of the Harbin–Changchun and Central Plain city clusters increased marginally after 2017 but did not affect the overall downward trend. The average annual decline rate of the overall σ convergence coefficient of the city clusters was 15.19%, of which the average annual decline rate of the σ convergence coefficient of the Guanzhong Plain was the fastest at 17.07%. Compared to other regions, the Yangtze River Delta demonstrated the slowest annual decline rate of the σ convergence coefficient at only 9.84%. In summary, the overall digital economy of the four regions and nine city clusters presented a significant σ convergence from 2011 to 2019, reflecting a reduction of the “digital divide” within each region and city cluster and demonstrating the significant “digital dividend,” which is consistent with the conclusions of the Dagum-Gini coefficient spatial difference analysis in Section 4.
5.2 β convergence
Prior to the β convergence test, the Moran's I method was used to test the spatial autocorrelation of the development of the digital economy in cities of China. From 2011 to 2019, the Moran's I statistics method applied to the digital economy of Chinese cities were all positive and passed the significance test of a 1% spatial autocorrelation. This indicates that the development of the digital economy of cities in China demonstrates a significant positive spatial autocorrelation, that is, the high-value areas or low-value areas demonstrate characteristics of agglomeration.
5.2.1 Absolute β convergence
As shown in Table 4, a panel fixed-effect model was used in this study to test the absolute β convergence mechanism of the digital economy of the four regional cities. The spatial error coefficient (λ) of the national, eastern, and central regions is significantly positive at the 1% level, indicating a significant positive correlation between the national, eastern, and central regions of the digital economy and a strong interaction effect between cities in the region. The β convergence coefficients of the entire country and the four regions are significantly negative at the 1% level, indicating the presence of absolute β convergence characteristics, implying that the cities in the entire country and the four regions benefit from the “digital dividend.” Specifically, the overall β convergence rate of the country is 12.40%, and the corresponding half-life cycle is 5.59 years, which indicates that it requires approximately 5.59 years to reduce the half gap between the digital economy and the steady state level of the cities in China. There are significant differences in the convergence speed of the four regions. The convergence speed of the northeast region is the fastest, with a convergence speed and corresponding half-life cycle of 17.18% and 4.03 years, respectively, whereas the convergence speed of the eastern region is the slowest, with a convergence speed and corresponding half-life cycle of 7.73% and 8.96 years, respectively.
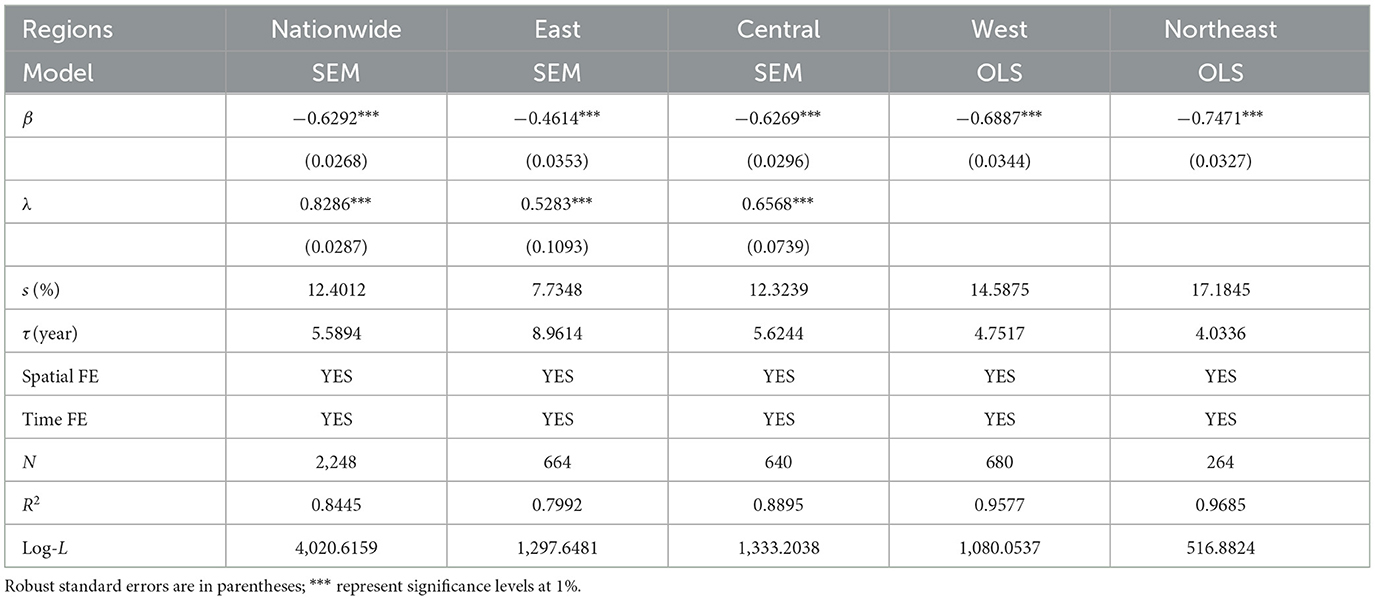
Table 4. Absolute β convergence test of the digital economy in the four regions.
As shown in Table 5, the panel fixed-effect model was also used to test the absolute β convergence mechanism of the digital economy of the nine city clusters. The β convergence coefficients of the overall city cluster and the nine city clusters are significantly negative at the 1% level, implying that the cities in each cluster are benefitting from the “digital dividend.” Specifically, the overall β convergence speed of the city clusters is 11.74%, and the corresponding half-life cycle is 5.90 years, which indicates that it requires approximately 5.90 years to reduce the gap between the overall digital economy of the city clusters and the steady state level. There were significant differences in the convergence speed of the nine city clusters; the order of convergence speed was: Chengdu–Chongqing > Harbin–Changchun > Central Plain > Middle reaches of the Yangtze River > Guanzhong Plain > Beibu Gulf > Yangtze River Delta > Beijing–Tianjin–Hebei > Pearl River Delta. The convergence rate of the Chengdu–Chongqing city cluster was the fastest, with a convergence rate and corresponding half-life cycle of 19.10% and 3.63 years, respectively, whereas the convergence rate and corresponding half-life cycle of the Pearl River Delta city cluster were the slowest, at 4.21% and 16.46 years, respectively. Based on the results of the overall spatial weighting coefficient of the city cluster, the development level of the digital economy in neighboring cities will have a positive spatial spillover effect on a city, thus promoting the growth of the digital economy in the city.
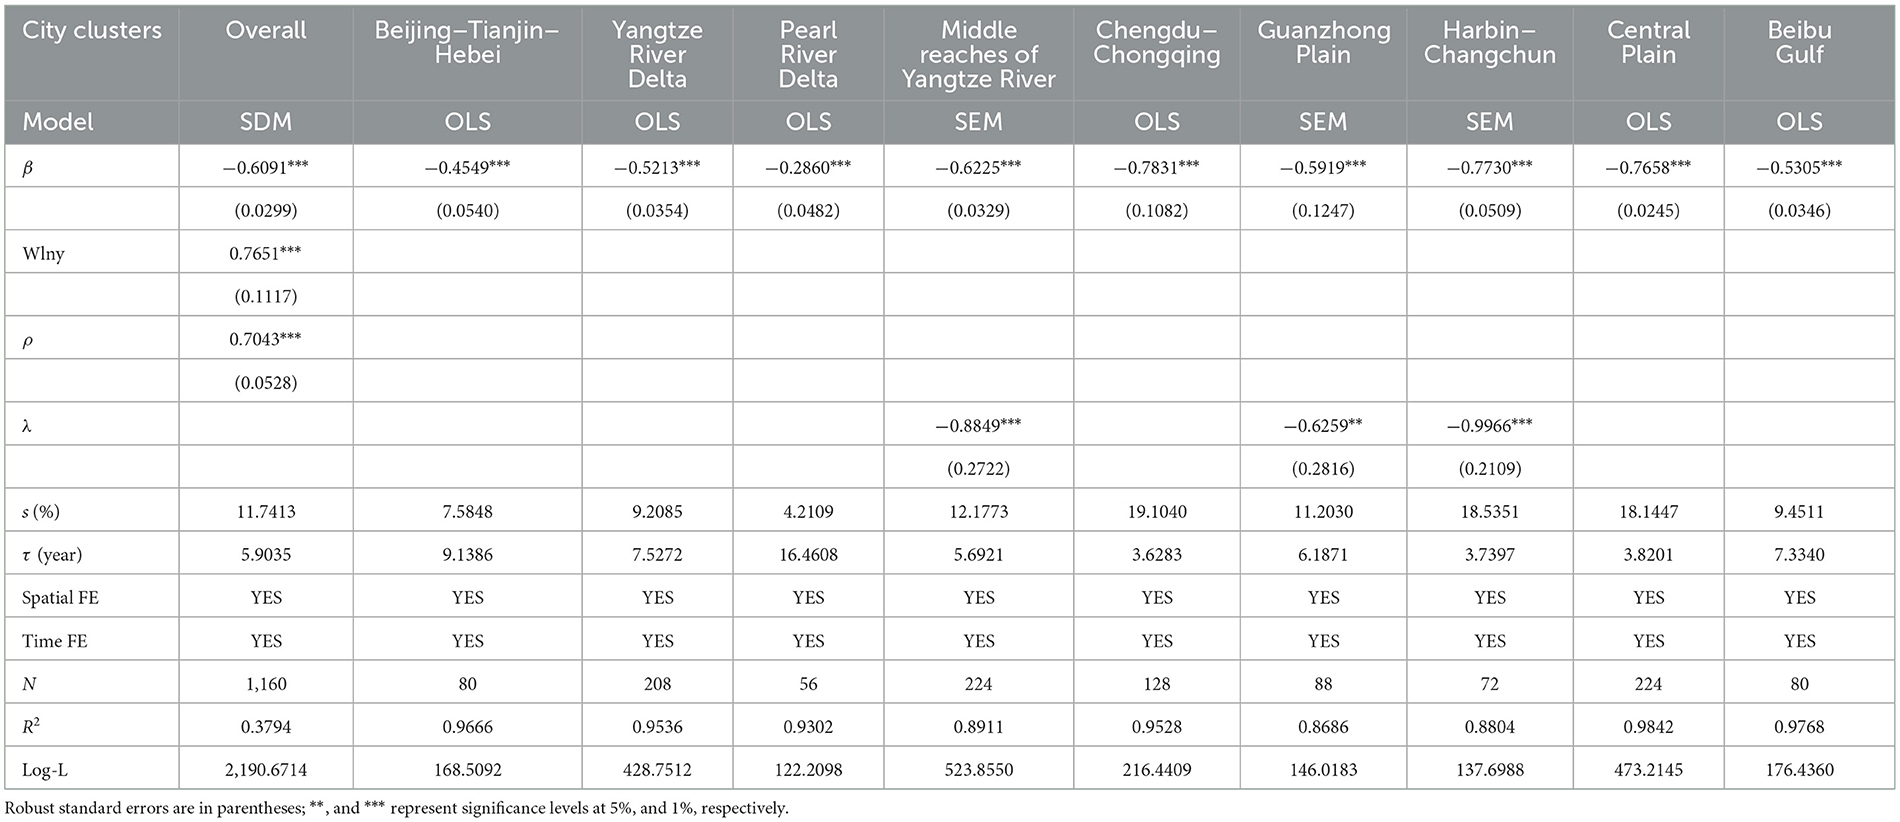
Table 5. Absolute β convergence test of the digital economy in nine city clusters.
5.2.2 Conditional β convergence
As shown in Table 6, the industrial structure, marketization level, human capital, and economic development levels were considered in this study, and the panel fixed-effect model was used to test the conditional β convergence mechanism of the digital economy of the four regional cities. First, the β convergence coefficients are significantly negative at the 1% level, which indicates that the conditional β convergence trend exists in the entire country and the four regions, implying that the cities in the entire country and the four regions benefit from the “digital dividend.” There are significant differences in the convergence speed of the four regions, and the order of the convergence speed is the same as that of the absolute β convergence: Northeast > West > Central > East. Second, regarding the control variables for the entire country, upgrading the industrial structure, human capital, and level of economic development will significantly promote the growth of the digital economy, whereas the influence of the marketization level factors is generally unclear. Regarding the different regions, the effects of upgrading the industrial structure, degree of marketization, human capital, and level of economic development on the growth of the digital economy of the cities are heterogeneous.
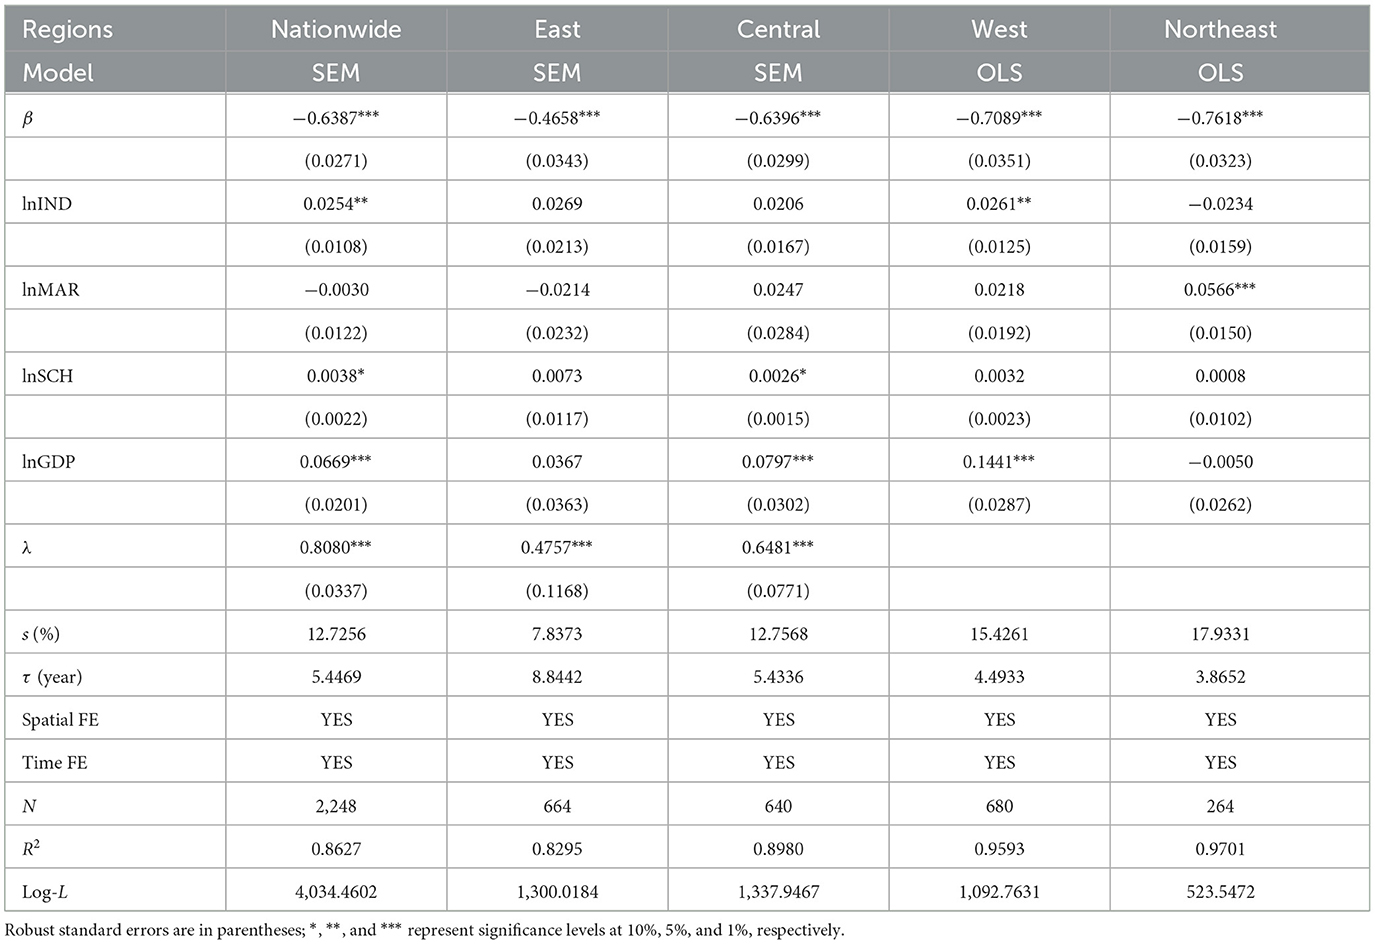
Table 6. Conditional β convergence test of the digital economy in four regions.
As shown in Table 7, the industrial structure, marketization level, human capital, and level of economic development were fully considered in this study, and the panel fixed effect model was used to test the conditional β convergence mechanism of the digital economy of the nine city clusters. First, the β convergence coefficients are significantly negative at the 1% level, implying that the cities in each city cluster benefit from the “digital dividend.” There are significant differences in the convergence speed of the nine city clusters, which are marginally different compared to the absolute β convergence: Chengdu–Chongqing > Harbin–Changchun > Central Plain > the middle reaches of the Yangtze River > Guanzhong Plain > Yangtze River Delta > Beibu Gulf > Beijing–Tianjin–Hebei > Pearl River Delta. Second, regarding the control variables, overall, the human capital and economic development levels will significantly promote the growth of the digital economy, whereas the impact of upgrading the industrial structure and marketization level is insignificant. Regarding the city clusters, the effects of upgrading the industrial structure, degree of marketization, human capital, and level of economic development on the growth of the digital economy of the cities are heterogeneous.
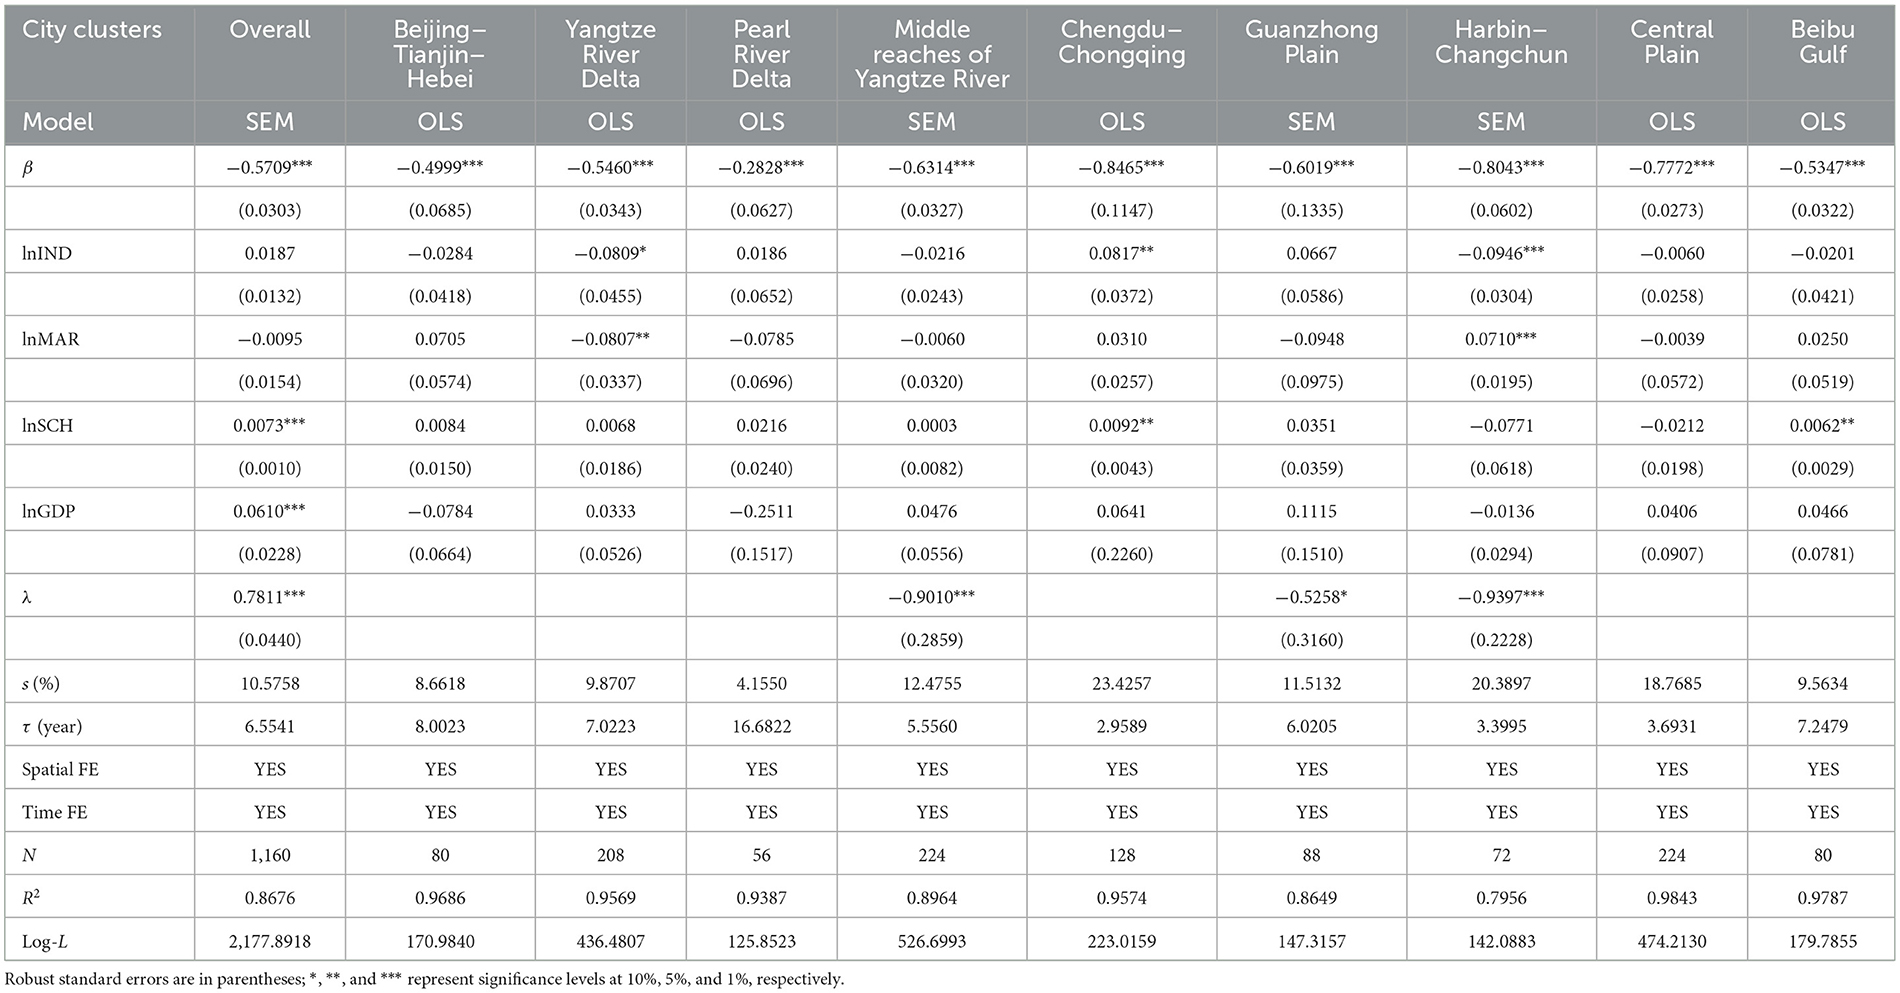
Table 7. Conditional β convergence test of the digital economy in nine city clusters.
5.3 Club convergence
As shown in Table 8, based on the three levels of the city clusters, a club convergence test was conducted on the development of the digital economy of Chinese cities. A comparative analysis of the clubs of the three levels of the city clusters was performed. First, significant absolute β convergence characteristics were observed in the three levels, implying that the cities in the three levels benefit from the “digital dividend.” There were significant differences in the convergence speeds among the three levels, which are ranked as follows: second tier > third tier > first tier. The convergence speed of the first tier is the slowest, which is a relatively mature city group with a convergence speed and corresponding half-life cycle of 6.76% and 10.26 years, respectively. This indicates that approximately 10.26 years are required to eliminate half of the gap between the digital economy of first-tier cities and the steady-state level. Second, after considering a series of control variables, there are significant conditional β convergence characteristics in the three levels, which also indicates that the cities in the three levels benefit from the “digital dividend.” Specifically, the convergence speed of the three levels was approximately the same as the absolute β convergence result; the convergence speed ranking was consistent.
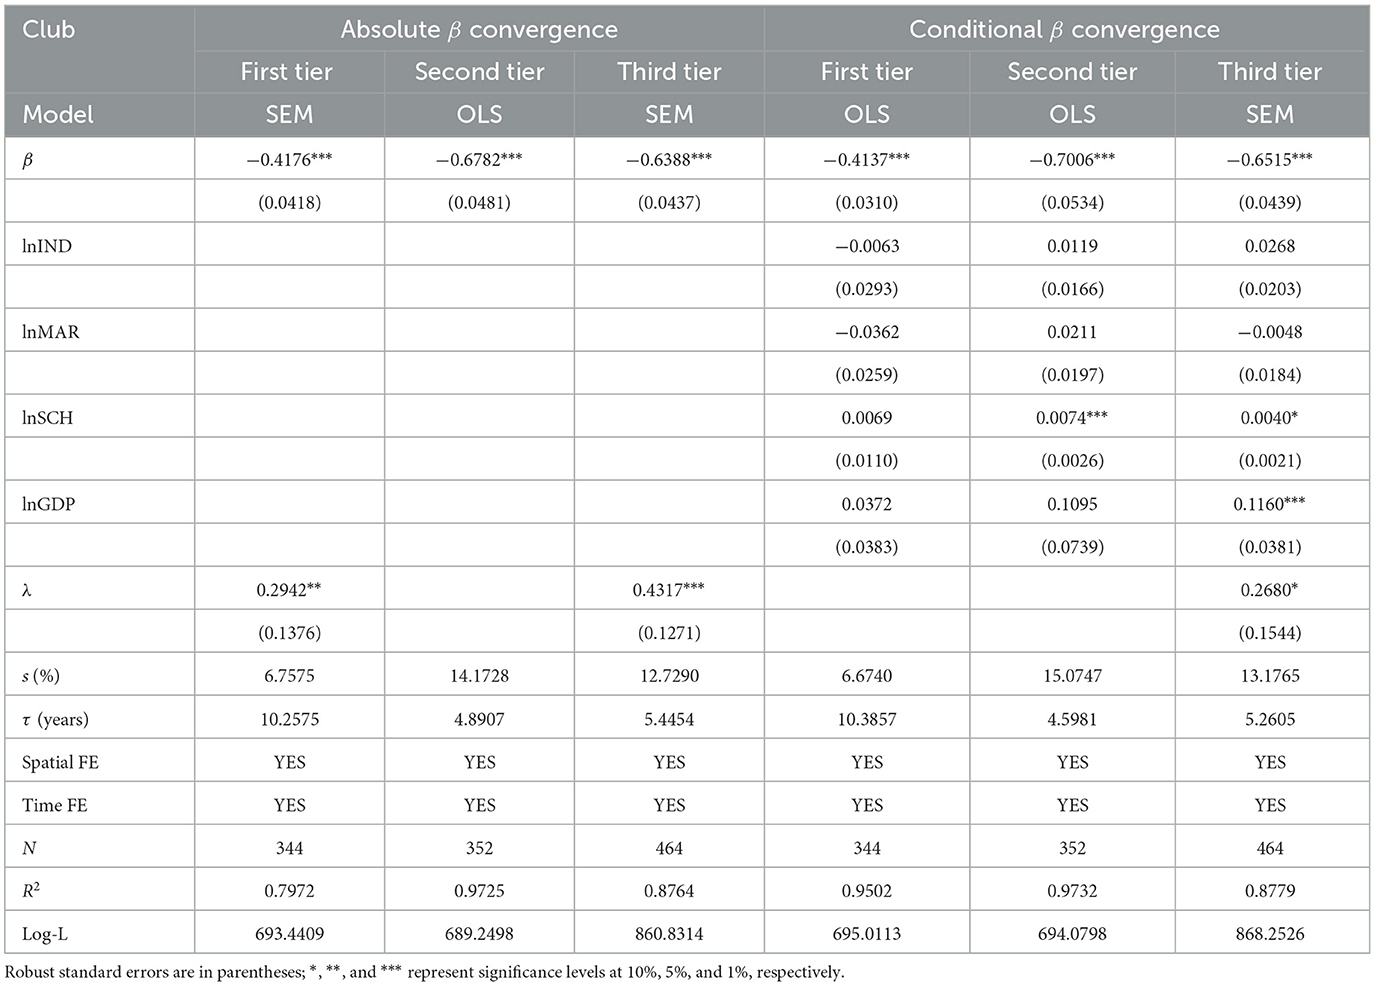
Table 8. Club convergence test of the digital economy development in Chinese cities.
6 Conclusions and policy implications
This study analyzed China's “digital divide” or “digital dividend” at various spatial scales of regions, city clusters, and cities, demonstrating differentiation characteristics in the evolution path of the spatial difference of the digital economy. First, the level of development of the digital economy of Chinese cities has continuously improved. Second, the spatial differences of the four regions and nine city clusters demonstrated an overall decreasing trend, reflecting the reduction of the “digital divide” and presenting the significant “digital dividend.” The primary source of the total differences between the four regions and nine city clusters was the same, that is, the differences between the regions (among city clusters). Third, regarding the convergence characteristics, σ convergence characteristics existed in the development of the digital economy of the four regions and nine city clusters. In addition, an absolute and conditional β convergence existed in the development of the digital economy of the four regions and nine city clusters, implying the benefit of the “digital dividend.” Regarding club convergence, an absolute and conditional β convergence exists in the three levels of the city groups, and the cities in the club demonstrate the “digital dividend.” Fourth, the spatial differences of China's digital economy generally show reducing the “digital divide” to reap the “digital dividend,” but the evolution path was differentiated with different submarkets demonstrating the “digital dividend” but presenting different stage characteristics. Regarding the four regions, apart from the eastern region, the “digital dividend” of the other regions was characterized by a low level of development, preliminarily exhibiting slight divergence characteristics. Regarding the nine city clusters, unlike the Beijing–Tianjin–Hebei, Yangtze River Delta, and Pearl River Delta city clusters, the “digital dividend” of the other city clusters was characterized by a low level of development, partially demonstrating slight divergence characteristics. This change may be due to the leading role of demonstration cities proposed in China's digital economy development strategy.
Based on these conclusions, the following recommendations are proposed for the government and enterprises. First, the development level of a city's digital economy should be further improved. We will develop new quality productivity. Second, the development gap of the digital economy in various regions and city clusters should be focused on, the positioning of their respective city functions should be clarified, and a reasonable division of labor in the cities should be achieved (Pick and Nishida, 2015). Third, economic links between the regions and city clusters should be strengthened. We should give full play to the leading role of the eastern region, especially the relatively mature city clusters in the Beijing-Tianjin-Hebei region, the Yangtze River Delta and the Pearl River Delta. The central, western and northeast regional city clusters should actively undertake the transfer of digital resources from developed regions, and utilize the advantages of resource endowment to achieve close cooperation between regions and city clusters. Fourth, it is necessary to promote the coordinated development of different regions in light of the characteristics of their development stages. The current stage is a critical period for the path transformation of the central, western, and northeast regions, as well as the developing city clusters, actively promoting China to converge to a lower steady-state level of spatial difference in the digital economy. Finally, we should truly bridge the “digital divide” to benefit from the “digital dividend.”
In the process of the development of digital economy, Europe, the United States, Japan and other developed economies have presented different degrees of “digital divide.” Among them, the spatial inequality of the development of digital economy in Europe has decreased, indicating that some regions are narrowing the “digital divide” to share the “digital dividend” (Nishida et al., 2014; Pick et al., 2015; Lucendo-Monedero et al., 2019). Similarly, the overall development of China's digital economy shows a trend of narrowing the “digital divide” to reap the “digital dividend.” However, the spatial differences of China's digital economy have the different evolution stage characteristics and submarket characteristics, compared with other developed economies, due to the large scale and the diversity of social and economic environment of China's digital economy market.
This study has several limitations. First, due to data limitations, the indicators of urban digital economy development are not perfect at present. Second, the research on “digital divide” and “digital dividend” needs to be in-depth, such as how to achieve an all-round way to cross the “digital divide” and share the “digital dividend.” Future research should be conducted to remain up-to-date and continue to improve relevant measures combined with the new characteristics of digital technology at the national and regional levels. On the other hand, it further explores the problems of “digital divide” and “digital dividend” that different groups may face. It is worth exploring the spatial differences in the digital economy.
Data availability statement
The raw data supporting the conclusions of this article will be made available by the authors, without undue reservation.
Author contributions
JH: Conceptualization, Methodology, Writing—original draft. YS: Writing—original draft. JC: Methodology, Writing—original draft.
Funding
The author(s) declare that no financial support was received for the research, authorship, and/or publication of this article.
Conflict of interest
JC was employed by Xiamen Powerway Advanced Material Co., Ltd.
The remaining authors declare that the research was conducted in the absence of any commercial or financial relationships that could be construed as a potential conflict of interest.
Publisher's note
All claims expressed in this article are solely those of the authors and do not necessarily represent those of their affiliated organizations, or those of the publisher, the editors and the reviewers. Any product that may be evaluated in this article, or claim that may be made by its manufacturer, is not guaranteed or endorsed by the publisher.
References
Allcott, H., Gentzkow, M., and Song, L. (2022). Digital addiction. Am. Econ. Rev. 112, 2424–2463. doi: 10.1257/aer.20210867
Barro, R.-J., and Sala-I-Martin, X. (1991). Convergence across states and regions. Brookings Pap. Econ. Act. 22, 107–182. doi: 10.2307/2534639
Chen, G.-F., Han, J., and Yuan, H.-W. (2022). Urban digital economy development, enterprise innovation, and ESG performance in China. Front. Environ. Sci. 10:955055. doi: 10.3389/fenvs.2022.955055
Cheng, F.-Y. (2020). Research on the spatial difference and convergence mechanism of technological innovation in the Guangdong-Hong Kong-Macao Greater Bay Area. J. Quant. Tech. Econ. 37, 89–107. (in Chinese). doi: 10.13653/j.cnki.jqte.2020.12.005
China Academy of Information and Communications Technology (2020). White Paper On China's Digital Economy Development. Beijing: China Academy of Information and Communications Technology (in Chinese).
Dagum, C. (1997). A new approach to the decomposition of the Gini income inequality ratio. Empir. Econ. 22, 515–531. doi: 10.1007/BF01205777
Guo, F., Wang, J.-Y., Wang, F., Kong, T., Zhang, X., and Cheng, Z.-Y. (2020). Measuring China's digital financial inclusion: index compilation and spatial characteristics. China Econ. Q. 19, 1401–1418. (in Chinese). doi: 10.13821/j.cnki.ceq.2020.03.12
Han, Z.-A., Zhao, J.-F., and Wu, H.-Z. (2021). A study on the scale measurement, disequilibrium and regional differences of China's inter-provincial digital economy. J. Quant. Tech. Econ. 38, 164–181. (in Chinese). doi: 10.13653/j.cnki.jqte.2021.08.009
Hu, A.-G., and Zhou, S.-J. (2002). China: how to resolve the enlarging digital divide. China Ind. Econ. 5–12. (in Chinese). doi: 10.19581/j.cnki.ciejournal.2002.03.001
Jetha, A., Bonaccio, S., Shamaee, A., Banks, C.-G., Bültmann, U., Smith, P.-M., et al. (2023). Divided in a digital economy: understanding disability employment inequities stemming from the application of advanced workplace technologies. SSM Qual. Res. Health. 3:100293. doi: 10.1016/j.ssmqr.2023.100293
Jiao, S.-T., and Sun, Q.-B. (2021). Research on the development measurement and influencing factors of digital economy in China. Res. World 13–23. (in Chinese). doi: 10.13778/j.cnki.11-3705/c.2021.07.002
Kartiasih, F., Nachrowi, N.-D., Wisana, I.-D.-G.-K., and Handayani, D. (2023). Inequalities of Indonesia's regional digital development and its association with socioeconomic characteristics: a spatial and multivariate analysis. Inf. Technol. Dev. 29, 299–328. doi: 10.1080/02681102.2022.2110556
Kwilinski, A., Lyulyov, O., and Pimonenko, T. (2023). Unlocking sustainable value through digital transformation: an examination of ESG performance. Information 14:444. doi: 10.3390/info14080444
Liu, C.-M., Yin, X., and Wang, L.-S. (2020). Research on the spatial imbalance and distributional dynamic evolution of digital economy in China. Forum Sci. Technol. China 97–109. (in Chinese). doi: 10.13580/j.cnki.fstc.2020.03.012
Liu, P. Z., Zhao, Y.-M., Zhu, J.-N., and Yang, C.-Y. (2022). Technological industry agglomeration, green innovation efficiency, and development quality of city cluster. Green Finance 4, 411–435. doi: 10.3934/GF.2022020
Liu, Y., Xie, Y., and Zhong, K. (2023). Impact of digital economy on urban sustainable development: evidence from Chinese cities. Sustain. Dev. 32, 307–324. doi: 10.1002/sd.2656
Lucendo-Monedero, A.-L., Ruiz-Rodríguez, F., and González-Relaño, R. (2019). Measuring the digital divide at regional level. A spatial analysis of the inequalities in digital development of households and individuals in Europe. Telemat. Inform. 41, 197–217. doi: 10.1016/j.tele.2019.05.002
Luo, R., and Zhou, N. (2022). Dynamic evolution, spatial differences, and driving factors of china's provincial digital economy. Sustainability 14:9376. doi: 10.3390/su14159376
Lv, Y.-W., Xie, Y.-X., and Lou, X.-J. (2020). Study on the space-time transition and convergence trend of China's regional green innovation efficiency. J. Quant. Tech. Econ. 37, 78–97. (in Chinese). doi: 10.13653/j.cnki.jqte.2020.05.005
Machlup, F. (1962). The Production and Distribution of Knowledge in the United States. Princeton, NJ: Princeton University Press.
Myovella, G., Karacuka, M., and Haucap, J. (2021). Determinants of digitalization and digital divide in Sub-Saharan African economies: a spatial Durbin analysis. Telecomm. Policy 45:102224. doi: 10.1016/j.telpol.2021.102224
Nishida, T., Pick, J.-B., and Sarkar, A. (2014). Japan's prefectural digital divide: a multivariate and spatial analysis. Telecomm. Policy 38, 992–1010. doi: 10.1016/j.telpol.2014.05.004
Norris, D. T., and Conceição, S. (2004). Narrowing the digital divide in low-income, urban communities. New Dir. Adult Contin. Educ. 2004, 69–81. doi: 10.1002/ace.129
Pick, J.-B., and Nishida, T. (2015). Digital divides in the world and its regions: a spatial and multivariate analysis of technological utilization. Technol. Forecast. Soc. Change 91, 1–17. doi: 10.1016/j.techfore.2013.12.026
Pick, J.-B., Sarkar, A., and Johnson, J. (2015). United States digital divide: state level analysis of spatial clustering and multivariate determinants of ICT utilization. Socioecon. Plann. Sci. 49, 16–32. doi: 10.1016/j.seps.2014.09.001
Porat, M.-U. (1977). The Information Economy: Definition and Measurement. Washington, DC: U.S. Department of Commerce.
Qin, C.-L., and Zhang, W.-L. (2009). Convergence test and factor analysis of China's regional economic growth club: regional grouping and influencing factor information based on CART. Manag. World 21–35. (in Chinese). doi: 10.19744/j.cnki.11-1235/f.2009.03.004
Sampson, T. (2023). Technology Gaps, Trade, and Income. Am. Econ. Rev. 113, 472–513. doi: 10.1257/aer.20201940
Setthasuravich, P., and Kato, H. (2022). Does the digital divide matter for short-term transportation policy outcomes? A spatial econometric analysis of Thailand. Telemat. Inform. 72:101858. doi: 10.1016/j.tele.2022.101858
Tapscott, D. (1996). The Digital Economy: Promise and Peril in the Age of Networked Intelligence. New York, NY: McGraw-Hill.
Wang, J., and Lee, C. L. (2022). The value of air quality in housing markets: a comparative study of housing sale and rental markets in China. Energy Policy 160:112601. doi: 10.1016/j.enpol.2021.112601
Wang, J., Zhu, J., and Luo, X. (2021). Research on the measurement of China's digital economy development and the characteristics. J. Quant. Tech. Econ. 38, 26–42. (in Chinese). doi: 10.13653/j.cnki.jqte.2021.07.002
Wang, M.-F. (2005). Internet use and urbanization in China: a spatial perspective of digital Divide. Sociol. Res. 112–135.+244. (in Chinese). doi: 10.19934/j.cnki.shxyj.2005.06.005
Xu, Y., Yang, C.-Y., Ge, W.-F., Liu, G.-L., Yang, X.-D., and Ran, Q.-Y. (2023). Can industrial intelligence promote green transformation? New insights from heavily polluting listed enterprises in China. J. Clean. Prod. 421:138550. doi: 10.1016/j.jclepro.2023.138550
Xu, Z.-Q., Zheng, F.-T., and Chen, J. (2013). Digital divided or digital provided? The effective supply of information and the farm-gate price: an empirical study from micro-level. China Econ. Q. 12, 1513–1536. (in Chinese). doi: 10.13821/j.cnki.ceq.2013.04.015
Yang, L., and Sun, Z.-C. (2015). The development of western new-type urbanization level evaluation based on entropy method. Econ. Issues 115–119. (in Chinese). doi: 10.16011/j.cnki.jjwt.2015.03.023
Yu, W., Zhang, P., and Ji, Z.-H. (2021). Study on regional difference, distribution dynamics and convergence of eco-efficiency of urban clusters in China. J. Quant. Tech. Econ. 38, 23–42. (in Chinese). doi: 10.13653/j.cnki.jqte.2021.01.002
Zhang, X., Wan, G.-H., Zhang, J.-J., and He, Z.-Y. (2019). Digital economy, financial inclusion and inclusive growth. Econ. Res. J. 54, 71–86. (in Chinese).
Keywords: digital economy, spatial differences, convergence, digital divide, digital dividend
Citation: Han J, Song Y and Chen J (2024) Reducing the “digital divide” to reap the “digital dividend”: spatial differences and convergence of the digital economy in cities of China. Front. Sustain. Cities 6:1283604. doi: 10.3389/frsc.2024.1283604
Received: 06 September 2023; Accepted: 16 February 2024;
Published: 05 March 2024.
Edited by:
Chyi Lin Lee, University of New South Wales, AustraliaReviewed by:
Cunyi Yang, Sun Yat-sen University, ChinaZahid Hussain, Qilu University of Technology, China
Copyright © 2024 Han, Song and Chen. This is an open-access article distributed under the terms of the Creative Commons Attribution License (CC BY). The use, distribution or reproduction in other forums is permitted, provided the original author(s) and the copyright owner(s) are credited and that the original publication in this journal is cited, in accordance with accepted academic practice. No use, distribution or reproduction is permitted which does not comply with these terms.
*Correspondence: Jisheng Chen, chenjisheng03@163.com