Present day and future urban cooling enabled by integrated water management
 Kerry A. Nice
 Matthias Demuzere2*†
  Nigel Tapper
- 1Transport, Health, and Urban Systems Research Lab, Faculty of Architecture, Building, and Planning, University of Melbourne, Parkville, VIC, Australia
- 2B-Kode, Ghent, Belgium
- 3School of Earth, Atmosphere and Environment, Monash University, Clayton, VIC, Australia
The process of urbanisation has increased public health risks due to urban heat, risks that will be further exacerbated in future decades by climate change. However, the growing adoption of integrated water management (IWM) practices (coordinated stormwater management of water, land, and resources) provides an opportunity to support urban heat amelioration through water supply provision and irrigated and vegetated infrastructure that can provide cooling benefits. This study examines the thermal impacts of future implementations of IWM for nine Australian cities based on a review of Government policy documents in the present and over two future time frames (2030 and 2050) under different greenhouse gas emission scenarios (SSPs 1.2-6, 3.7-0 and 5.8-5). Statistical analysis of the future climate data using historical data shows that future warming is nuanced, with changes variable in both time and place, and with extremes becoming more pronounced in future. We have developed a unique approach to morph the future climate projections onto historical data (derived from the ERA5 Reanalysis product) for the 2010-2020 period. Additionally, we use locally appropriate Local Climate Zones (LCZs) for Australian cities, resulting from a holistic and global approach that is widely adopted by the urban climate modelling community. We developed scenarios for business-as-usual as well as implementation of moderate and high levels of IWM across each of the Australian LCZs and modelled them using TARGET (The Air temperature Response to Green infrastructure Evaluation Tool). Results generated at the LCZ level are aggregated to Australian statistical areas (SA4, the largest sub-city area) and city-wide levels. The thermal impacts associated with the various degrees of IWM were marked and geographically differentiated, depending on the climatic characteristics of the various cities. For the current climate, high IWM intervention provided reductions in annual mean daily maximum temperature ranging from -0.77°C in Darwin, up to -1.86°C in Perth. Generally, the drier southern cities of Sydney, Canberra, Albury, Melbourne, Adelaide, and Perth produced the greatest thermal response to implementation of IWM and the more tropical cities with higher rainfalls the least response. For some southern cities cooling was > -3.0°C at the time of maximum summer temperatures. Interestingly high levels of IWM in winter produced modest warming of minimum overnight temperatures, especially for the cooler southern cities. The cooling benefits of IWM were seen across all future climate scenarios and are a real opportunity to offset-projected temperature increases resulting from climate change.
1 Introduction
Cities, through the process of urbanization, have altered natural surface energy balances (Oke et al., 2017) and water cycles (Coutts et al., 2012). The conversion of vegetated surfaces to hard impervious surfaces with higher heat storage capacity, reduced shading of surfaces from shrinking vegetated urban canopies (Brunner and Cozens, 2013), and reductions in available water for evapotranspiration (Spronken-Smith and Oke, 2010; Middel and Krayenhoff, 2019; Cheung et al., 2022) result in increased canopy air and surface temperatures (Martilli et al., 2020; Nice et al., 2022) and greater risks to health (Nicholls et al., 2008; Loughnan et al., 2010; Nazarian et al., 2022). Urban heat will be further exacerbated by climate change, projected to bring increasingly frequent and intense heat waves (Perkins-Kirkpatrick and Lewis, 2020), increasing droughts (IPCC, 2021), and localized warming (Zhao et al., 2021).
Strategies to mitigate urban heat can involve methods such as surface albedo changes, vegetation cover, irrigation, and the use of water (Krayenhoff et al., 2021). Vegetation and water have been widely recognized to provide urban cooling benefits through evapotranspiration and shading (Bowler et al., 2010; Coutts et al., 2012, 2015; Demuzere et al., 2014a). Replacement of hard impervious surfaces with pervious vegetated surfaces provides additional cooling (Middel and Krayenhoff, 2019). The use of water provides urban cooling through evaporative cooling from large water bodies (Theeuwes et al., 2013; Völker et al., 2013). Additionally, irrigation of vegetated surfaces (Broadbent et al., 2017; Cheung et al., 2021) as well as impervious surfaces (Hendel et al., 2016; Solcerova et al., 2018) can provide cooling benefits.
Stormwater water management frameworks, to protect urban areas from flooding and provide waterway and pollution protections (Whiteoak, 2019; Renouf et al., 2020), also enable the provision of alternative water supplies. The physical infrastructure required for these frameworks, e.g., blue-green infrastructure (BGI), can also provide cooling benefits (Demuzere et al., 2014b; Jamei and Tapper, 2019; Probst et al., 2022). The frameworks include Water Sensitive Urban Design (WSUD) (Wong and Brown, 2009; Newton and Rogers, 2020), Sponge Cities (Jia et al., 2020), Sustainable Urban Drainage Systems (SUDS) (Woods-Ballard et al., 2007), among others. Integrated Water Management (IWM), defined by Global Water Partnership (2000) as ‘a process which promotes the coordinated development and management of water, land and related resources, in order to maximise the resultant economic and social welfare in an equitable manner without compromising the sustainability of vital ecosystems' provides the mechanisms for frameworks such as WSUD.
The growing adoption of IWM across governments and water providers, such as the Australian state of Victoria's IWM framework (State of Victoria, 2017), enables the adoption of cooling strategies based on increased urban vegetation and water. To explore the expected benefits from these strategies, the literature can provide some data, but ultimately a full exploration will require modelling. Cooling magnitudes from irrigation of green space varies with background climate. In most cities in the world in different climate types, the expected benefit is approximately 1°C in air temperature reductions, where arid cities see reductions of up to 1.65°C (Cheung et al., 2021). Surface temperature cooling from short vegetation (Santamouris et al., 2017; Yang et al., 2020) can range from 1-2°C whereas surface temperatures under tree canopies (Shashua-Bar and Hoffman, 2000; Cheung and Jim, 2018; Jia and Wang, 2021) can be up to 15°C cooler while air temperature reductions are more modest at 1–2°C. Artificial wetlands have been found to provide surface temperature reductions of up to 11°C and 1-2°C in air temperature, while water bodies were found to provide on average 2.5°C air temperature reductions (Theeuwes et al., 2013; Völker et al., 2013; Manteghi et al., 2015; Broadbent et al., 2017).
This study examines the potential cooling that can be provided through the additional BGI infrastructure enabled through IWM in all the major cities in Australia. We utilise the Air-temperature Response to Green/blue-infrastructure Evaluation Tool (TARGET) (Broadbent et al., 2019), a local-scaled climate model designed to efficiently evaluate heat mitigation benefits of blue-green infrastructure and to predict temporal and spatial patterns of air and surface temperatures at the neighbourhood to city scale. TARGET is efficient and easy to use, with fewer user-defined parameters and less model input data required than other urban climate models. The model utilises an idealised urban canyon representation with an aggregation of land cover types of grass, irrigated grass, trees, concrete, asphalt, buildings, and water. The modelling approach allows multiple IWM interventions to be tested across present day climate conditions as well as projected future climate conditions. The hypothesis that will be tested is that IWM interventions that increase fractions of vegetation cover and amounts of irrigated vegetation and water bodies, subsequently reducing fractions of hard impervious surfaces, will result in significantly cooler urban areas both in the present day and under future climate conditions. Results will test seasonal and diurnal variations across multiple years as well as across multiple cities in different climate zones (temperate and tropical). Finally, the potential to offset climate change warming will be tested under a range of IWM interventions.
2 Methods
To run the TARGET model, two sources of information are required: (1) meteorological time series of air temperature, humidity, wind speed, air pressure, and incoming short- and longwave radiation, and (2) gridded land cover fractions that include percentages of roof, road, water, concrete, vegetation (i.e., trees), dry grass, and irrigated grass.
Since TARGET will be applied over seven capital cities (Adelaide, Brisbane, Canberra, Darwin, Melbourne, Perth, and Sydney) and two regional centres (Albury-Wodonga and Townsville), which do not all have the required input data readily available, these datasets are sourced from generic and state-of-the-art data sources and re-structured to fit the requirements of this project.
2.1 Meteorological forcing and climate change data
Historical meteorological data are extracted from the ERA5 reanalysis product (Hersbach et al., 2020), provided by ECMWF (European Centre for Medium-Range Weather Forecasts), for the period 2010–2020 and for all nine capital cities and regional centres (see Figure 1 for Melbourne example). All required TARGET input variables are available at an hourly temporal resolution and represent the average background meteorology for a grid cell of ~30 × 30 km. ERA5 combines vast amounts of historical observations into global estimates using advanced modelling and data assimilation systems and is to date the best available reanalysis product. ERA5 data was used rather than Bureau of Meteorology (BoM) data for several reasons. The ERA5 data are a synthesis of observational (BoM) and modelling data that best represents the climate across the urban location of interest, rather than one observational location usually representing a rural environment outside of the urban centre. The data are available hourly and most critically include data (e.g., radiation) required to run TARGET that are not available from the BoM observations. When processed through TARGET, the ERA5 data will give a much better representation of the urban climate than is possible with the original BoM observations.
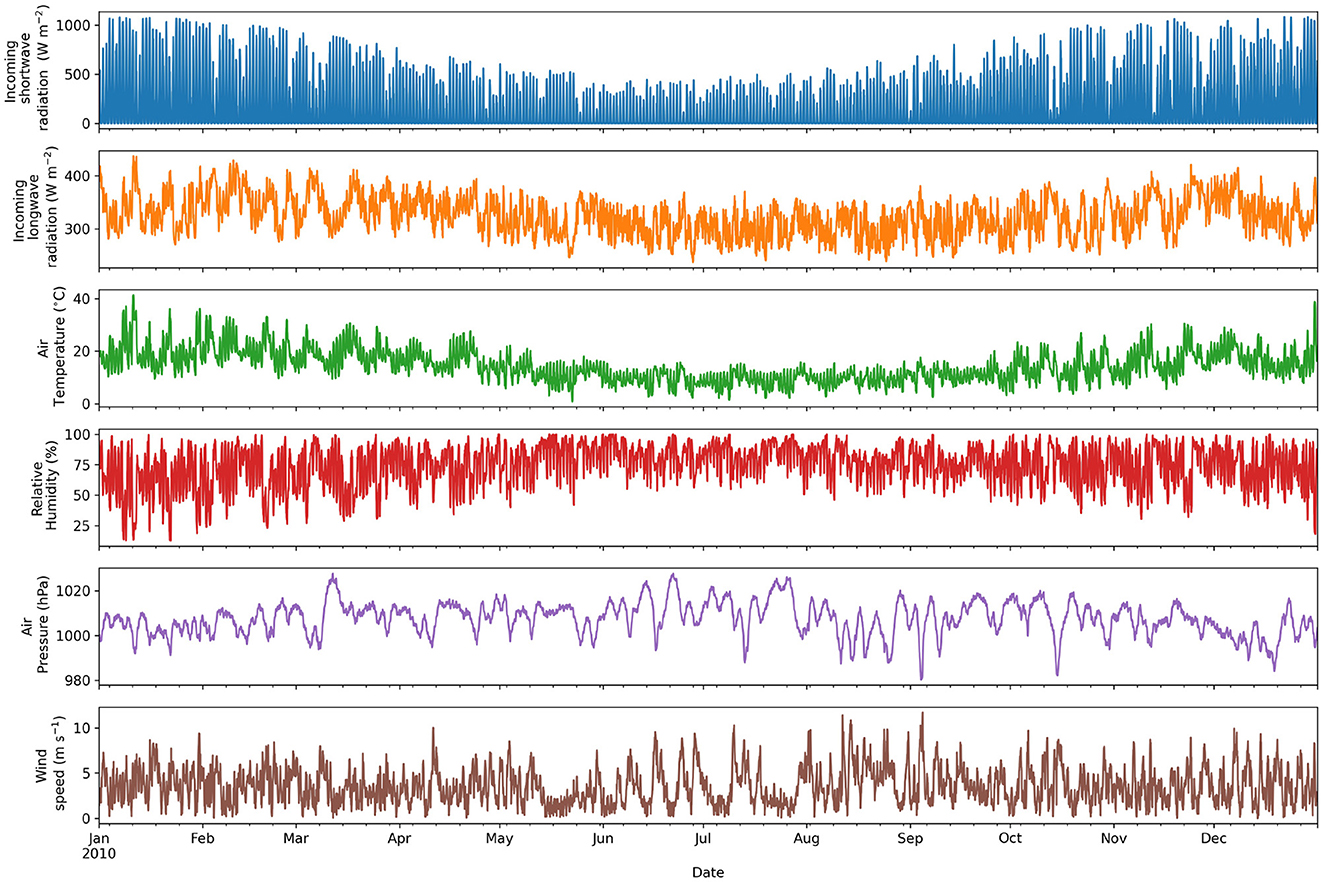
Figure 1. Historic hourly ERA5 forcing meteorology for Melbourne, showing only 2010 as an example.
Climate change data are taken from the most recent Coupled Model Intercomparison Project Phase 6 (Eyring et al., 2016) (CMIP6) archive, developed within the framework of IPCC's 6th Assessment Report (IPCC, 2021). Since hourly output is typically not available from the global climate models (GCMs) available in CMIP6, daily minimum, mean and maximum temperature are extracted from 17 CMIP6 models, for:
• all nine capital cities and regional centres
• three shared socioeconomic pathways (SSP) emission scenarios:
- 1.2-6: Limit warming below 2°C,
- 3.7-0: Middle of the road—current trajectory,
- 5.8-5: No policy (worst-case) scenario
• two future periods: centred on 2030 and 2050
The air temperature climate change signal obtained from CMIP6 data is superimposed onto the historic ERA5 time series via a “morphing” process. This technique refers to the application of a shift (in mean) and a stretch (in minimum and maximum) of the observed time series, to change both the mean and the variance (Belcher et al., 2005; Pulkkinen and Louis, 2021). For each month, a minimum, median, and maximum air temperature change is computed as the ensemble median over all CMIP6 models, per city, SSP scenario, and future period (see Figure 2 for Melbourne example).
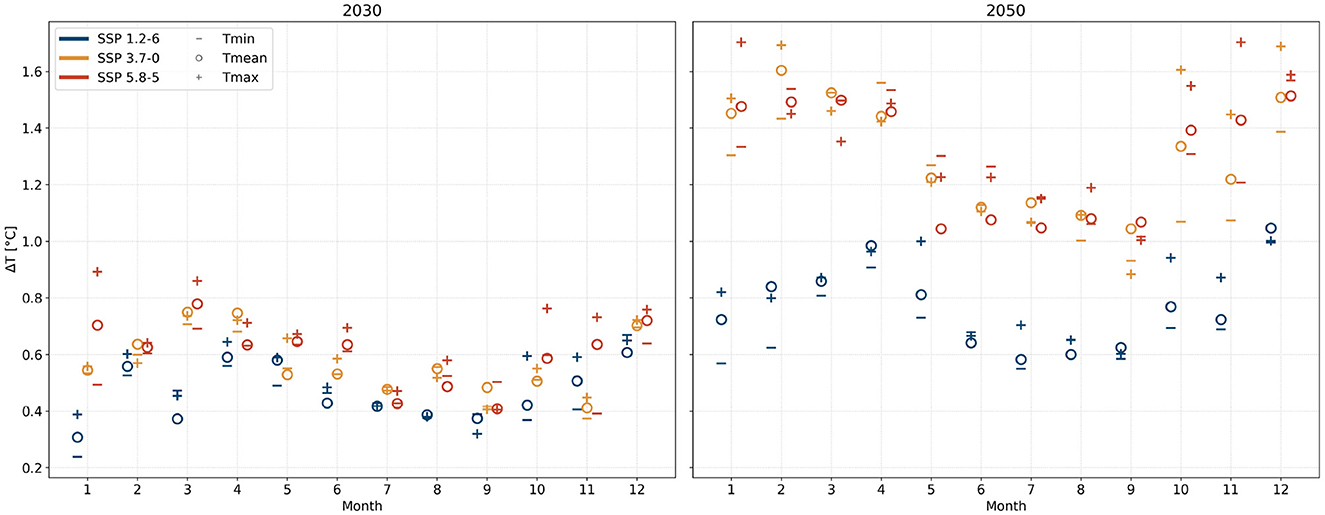
Figure 2. Projected change in minimum, mean and maximum monthly temperatures for Melbourne (ΔT, °C), as the median over all 17 CMIP6 models, for SSPs 1.2-6, 3.7-0, 5.8-5, and target periods 2030 (left) and 2050 (right).
Superimposing the CMIP6 ensemble median monthly minimum, mean and maximum temperature changes (ΔT) onto the ERA5 historical air temperature provides a detailed yet nuanced new time series of projected future air temperatures (Figure 3 for Melbourne). The seasonal histograms in Figure 3 indicate that temperature changes are variable in time, with the strongest warming in summer months, and a more moderate warming in cooler months. Simultaneously, warming patterns are often asymmetric, e.g., the long right-hand tail of ΔT for SSP 5.8-5 in SON (September, October, and November) 2050, indicating that extremes will become more pronounced in the future. This procedure has been finalised for all nine capital cities and regional centres (not shown), which means that all meteorological and climate change information are available to run TARGET.
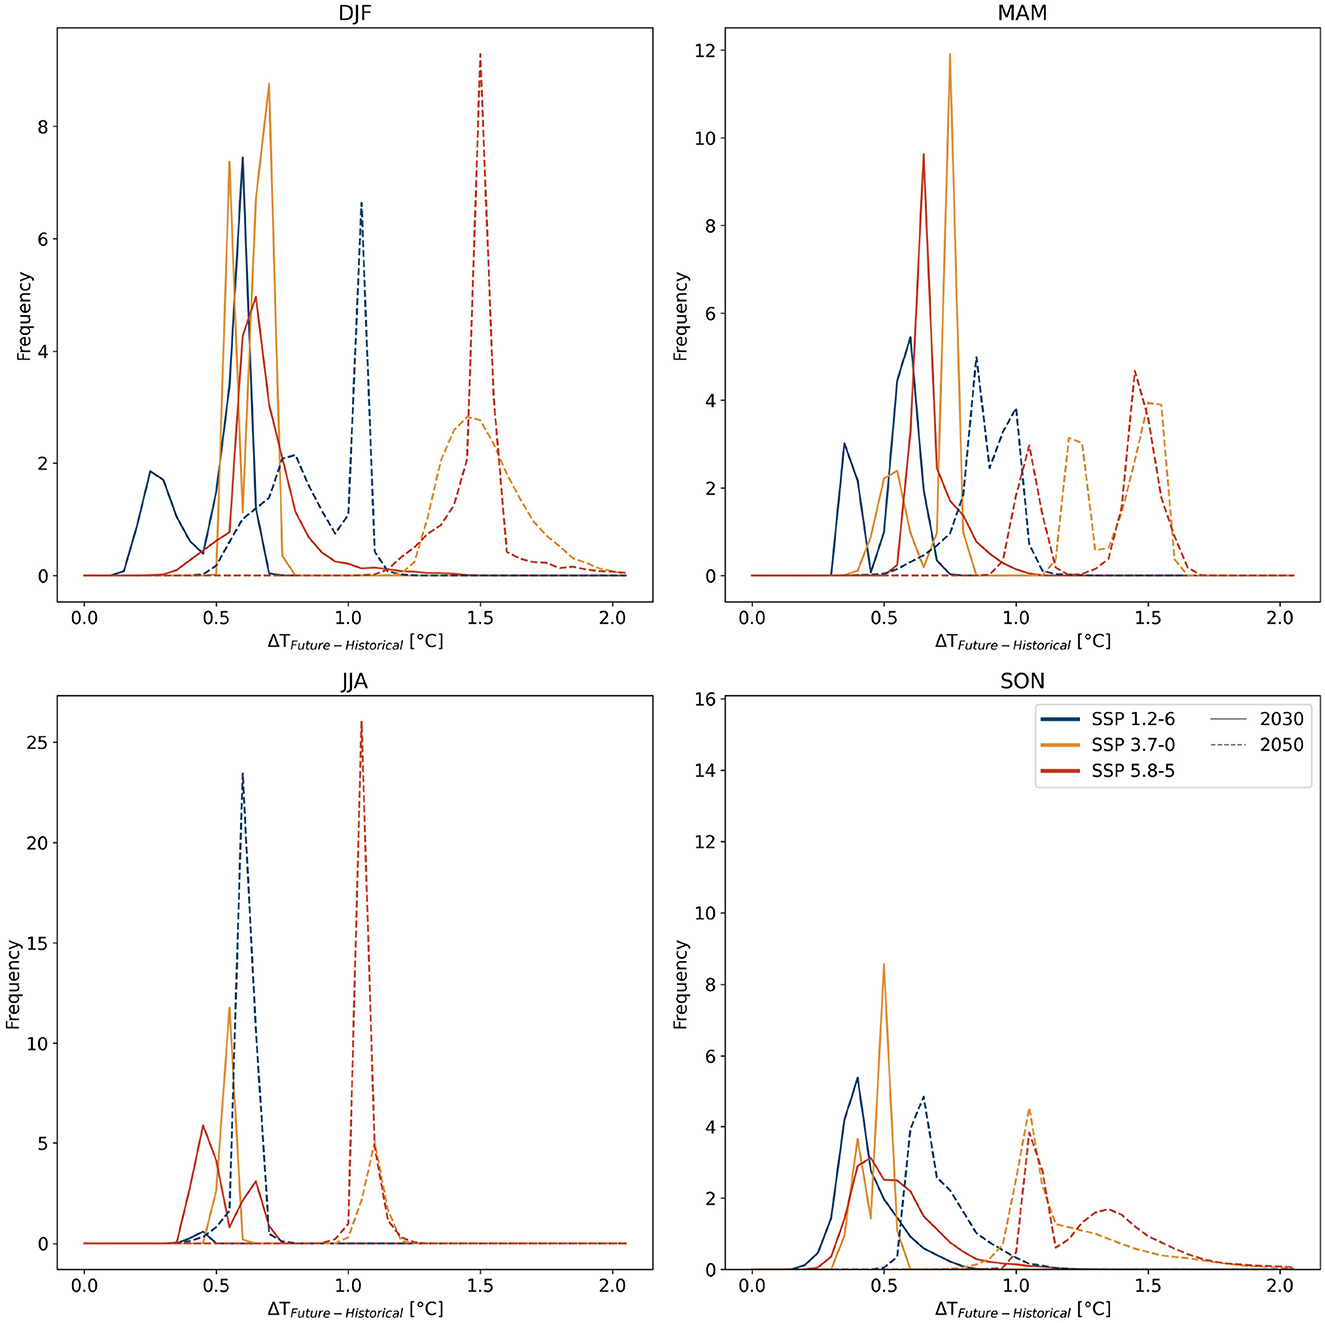
Figure 3. Seasonal histograms of hourly temperature change between the morphed future time series and the historical ERA5 time series, for Melbourne. Future time series reflect both the SSPs emission scenarios (line colours) and target future periods (line types). DFJ, MAM, JJA, and SON refer to the meteorological seasons: austral summer (December–January–February), autumn (March-April-May), winter (June-July-August), and spring (September–October–November).
2.2 Land cover fractions and IWM interventions
The land cover (fractions) for all nine selected cities is described using the LCZ typology (Stewart and Oke, 2012). This is a holistic and global approach that allocates landscapes according to properties that influence screen-height temperature, namely surface structure (height and spacing of buildings and trees) surface cover (pervious including vegetation, or impervious), and material properties. As each of the 17 LCZ classes (10 of which are built LCZs, see Figure S1 in the Appendix) are associated with key urban canopy parameters (Ching et al., 2018), this scheme is extremely well-suited for (1) providing universal and consistent present-day landscape data for TARGET, and (2) devising IWM scenarios for use in TARGET. Here, the LCZ maps for all 9 cities are extracted from the global LCZ map available at a 100m spatial resolution (Demuzere et al., 2022). The LCZ map for Melbourne is shown in Figure 4 as an example.
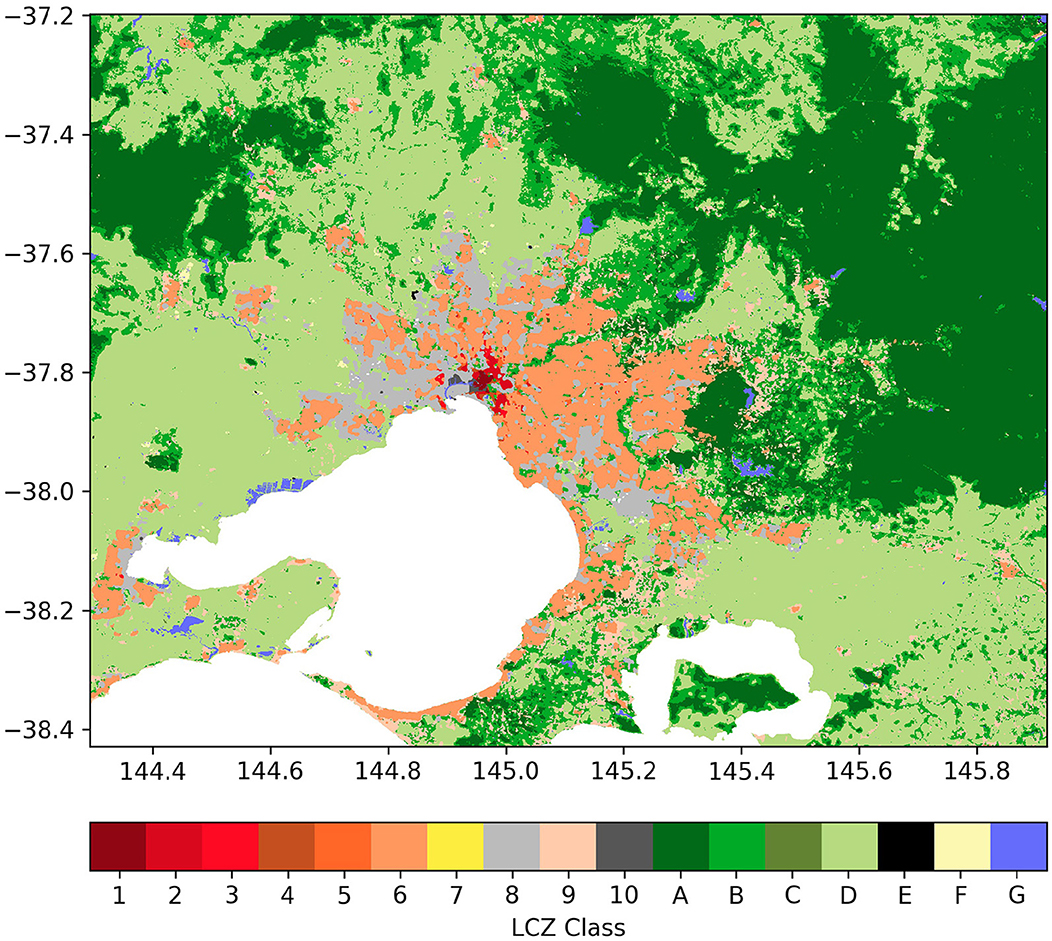
Figure 4. LCZ map for Melbourne.
Each of the LCZ typologies are assigned geometric properties (e.g., ratio of building height to street width) and surface cover fractions (e.g., impervious surface fractions). Stewart and Oke (2012) provide a range of values from which default values can be derived. Within these ranges, we sought to assign more accurate geometric and surface cover fractions for the Australian context that better represent the urban form found in Australian cities. Using a combination of grid point identification and GIS Land Use Land Cover databases (Geoscape, 2022) available for selected cities (see example in Figure 5), current business as usual (BAU) surface cover fractions were derived for each LCZ type as shown in Table 1 and Figure 6.

Figure 5. Example of the use of Land Use Land Cover maps to derive surface cover fractions.
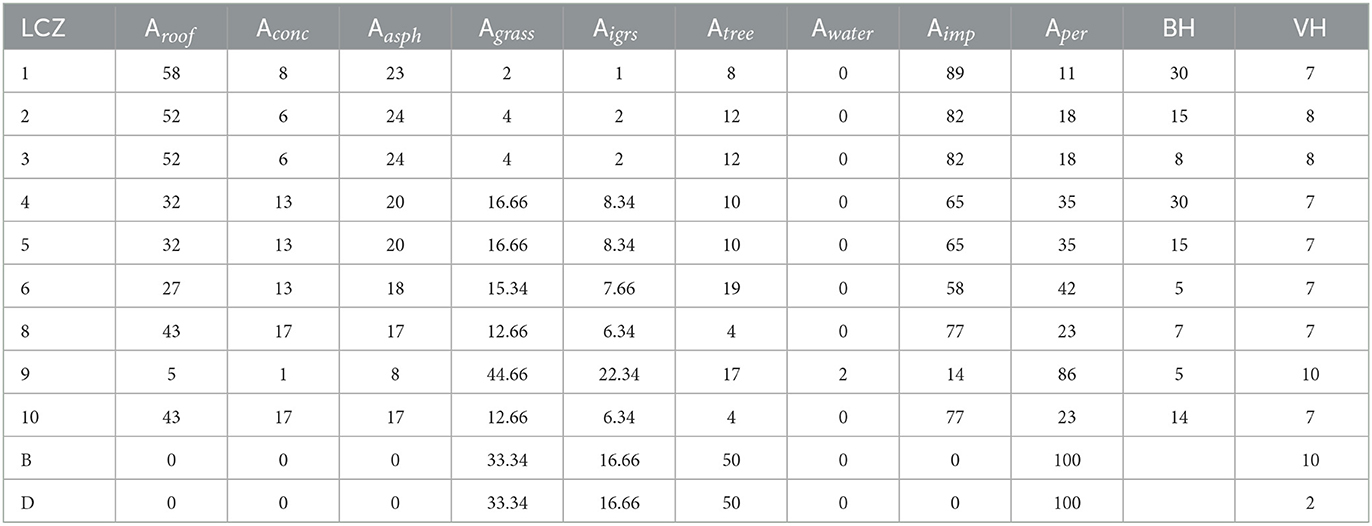
Table 1. Current (business as usual) surface cover properties (A: fraction of surface type, and total impervious and pervious, all in percentages) and geometric properties (BH building height and VH vegetation height, both in metres) for the LCZ classes present in the cities of interest (Subscripts to A refer to roof, conc (concrete), asph (asphalt), grass, igrs (irrigated grass), tree, water, and imp (impervious) and per (pervious) surface and land cover types).
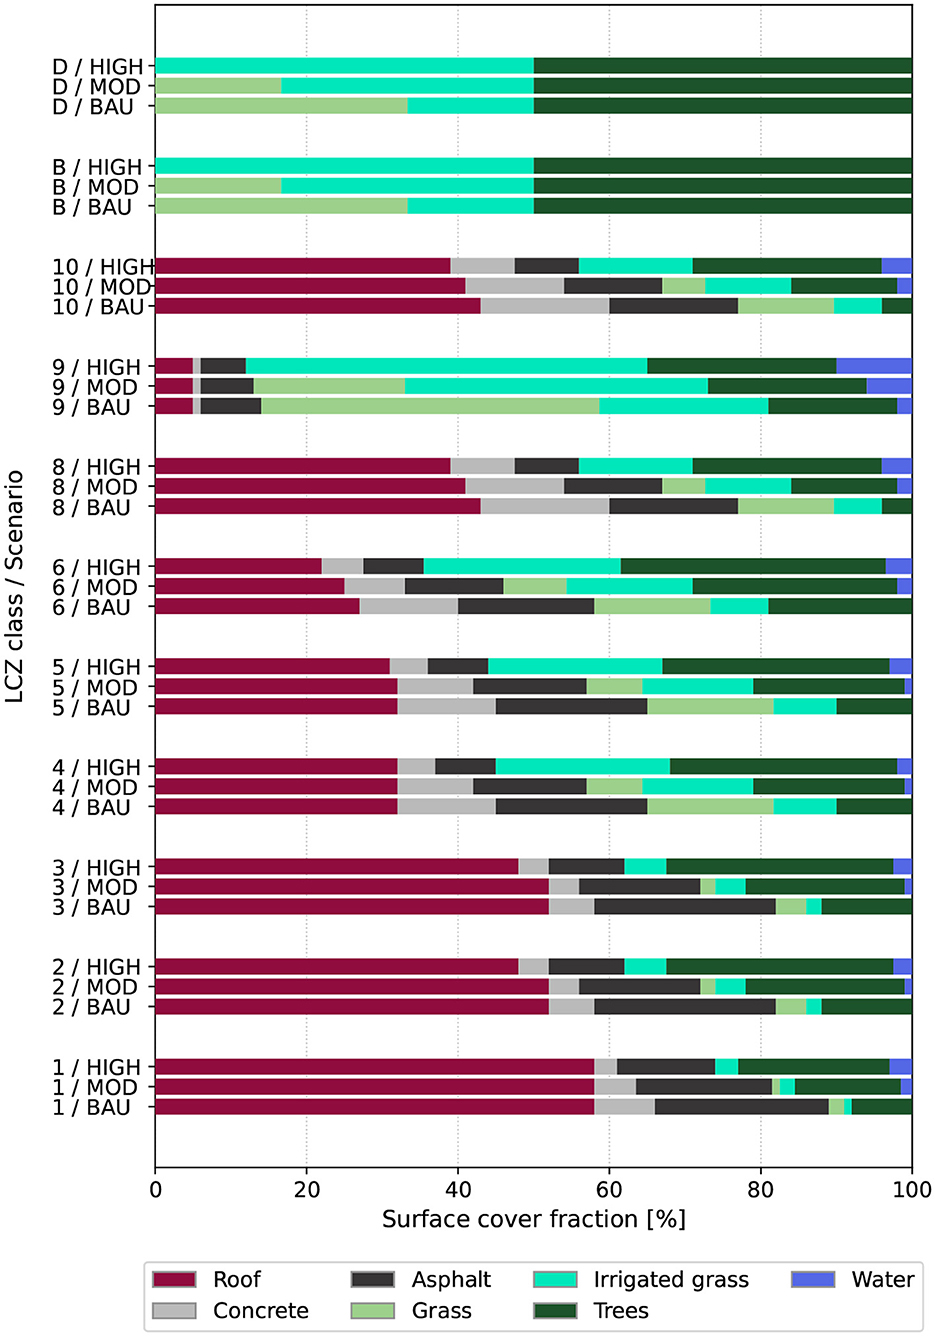
Figure 6. Surface cover fractions of each LCZ for business as usual (BAU), and moderate (MOD) and high (HIGH) IWM interventions.
Based on the current LCZ typologies for BAU, new typologies were developed that reflect the implementation of IWM. The interventions to be explored here focus on increasing tree canopy cover, retention of water in the urban landscape through water sensitive urban design, and irrigation (active or passive), and an overall shift from impervious (concrete/asphalt), to pervious surfaces, where possible. Several Australian states, territories, and Local Government Areas (LGA) are developing strategies or design guidelines that aim to mitigate urban heat. For example, the Parramatta Heat Strategy (City of Paramatta, 2021) aims to “Increase canopy cover to 40% by 2050 (based on 2016 levels)”. The Western Sydney Regional Organization of Council's (WSROC) (Western Sydney Regional Organisation of Councils, WSROC) Turn Down the Heat Strategy and Action Plan aims to “Reduce the average peak ambient temperatures in Western Sydney by 1.5°C through water, greening and cool materials strategies by 2023”. The draft NSW State Environmental Planning Policy (Design and Place) 2021 (SEPP) (New South Wales, 2021) includes a design consideration for green infrastructure including “whether the development maximizes tree canopy cover and provides sufficient deep soil to support the tree canopy”.
To develop future scenarios of IWM for implementation in this study, quite specific information is needed rather than broad guidelines that are more usually available in strategic reports. The NSW Government draft Urban Design Guide (2021) (New South Wales, 2021) provides canopy cover targets for street trees and lots across different urban land use types. The NSW Government Apartment Design Guide (2015) (NSW Department of Planning & Environment, 2015) specifies “deep soil zone” targets expected to support vegetation. The tree canopy cover and deep soil zone targets proposed in these guides align with the scenarios developed for each of the LCZ typologies (Table 2). In addition, for the ACT, Canberra's Living Infrastructure Plan: Cooling the City (ACT Government, 2019), a goal of 30% permeable surfaces by 2045 has been set, along with a goal of 30% tree canopy cover, and the Port Phillip Council in Melbourne requires that at least 20% of surfaces must be permeable (City of Port Phillip, 2018).
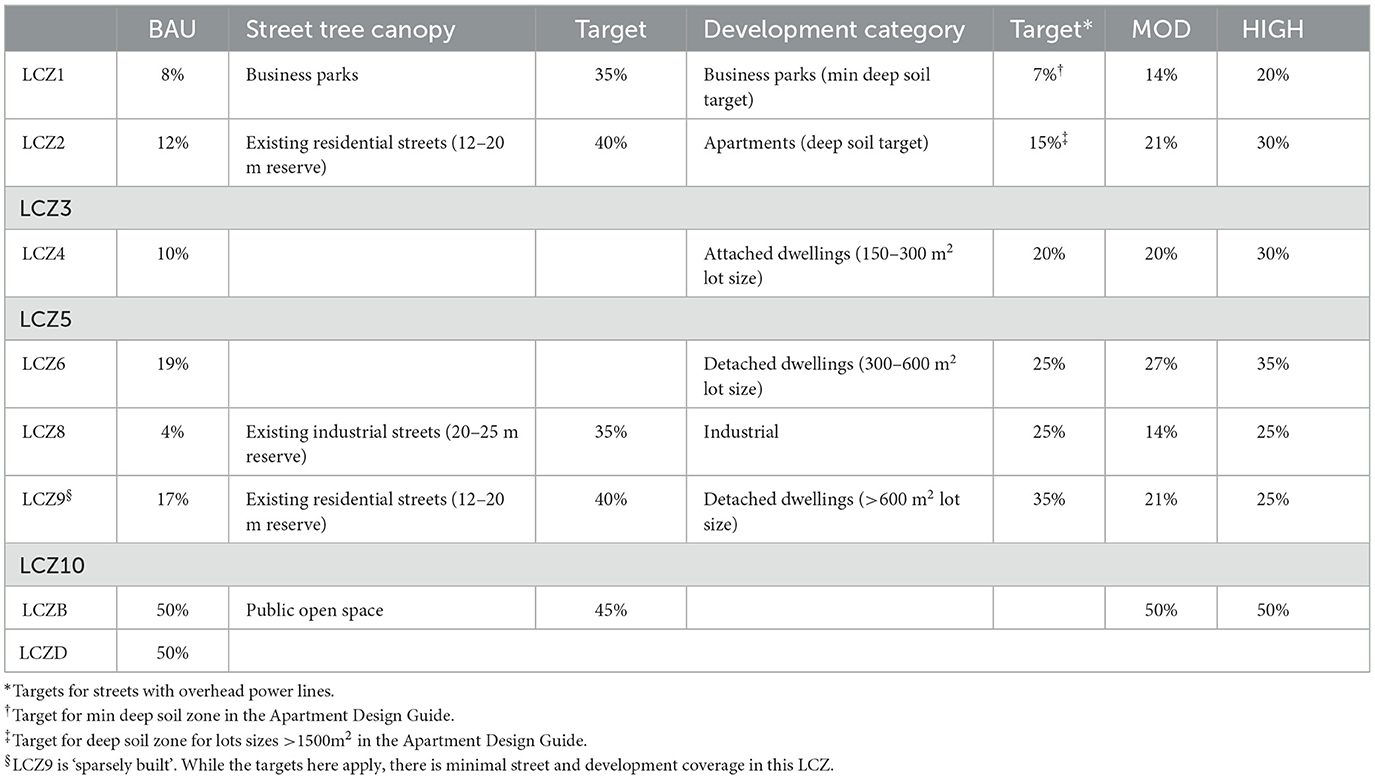
Table 2. Surface cover fractions for BAU scenarios followed by proposed tree canopy targets in the NSW Draft Urban Design Guidelines (Targets are given for both street trees and lots in various development categories).
IWM includes water sensitive urban design features such as rainwater tanks, raingardens, tree-pits, swales, and wetlands, as well as alternative water sources for irrigation. In TARGET, these features are represented by the surface type ‘irrigated grass' and water bodies. In planning documents for IWM strategy there is almost no specification of targets for each of these interventions and there is little alignment between individual jurisdictions.
To develop a consistent approach across all the cities and LCZ typologies in this study, we developed ‘moderate' and ‘high' IWM scenarios for each of the LCZs. These were developed to be broadly consistent with the guidelines available (e.g., see above and Table 2) along with professional judgement of what might reasonably be accomplished. An iterative process was employed so that the total area of pervious and impervious surface summed to 100% of the LCZ (see Table 1). Figure 6 summarizes the finalized moderate and high IWM interventions for all LCZ classes used in this study.
To account for tropical/subtropical cities with pronounced wet seasons (Darwin, Townsville, and Brisbane) a dry season/wet season “switch”, based on the local rainfall climatology, was applied to each of those cities so that effectively these landscapes were fully “irrigated” during their wet season. This was because the “unirrigated” vegetation did not reflect the substantial moisture associated with those areas during the wet summer months for the TARGET modeling on the largely naturally vegetated LCZs 9, B and D. The dates for the switch for dry seasons are May 1 - November 1 for Darwin, April 1 - January 1 for Townsville and August 1 - December 1 for Brisbane.
2.3 Spatial aggregation of LCZs to SA4 areas and entire cities
For this project, the heat modeling supported a public health analysis of heat mitigation in Australian cities (Varghese et al., 2024) in which the health data was available at a Statistical Area Level 4 (SA4s) level. These are geographic areas built from whole Statistical Areas Level 3 (SA3s) and are the largest sub-state regions in the Main Structure of the ASGS (Australian Statistical Geography Standard). They are designed for the output of a variety of regional data, including the 2021 Census data. For this reason, all LCZ and TARGET outputs for each city have been mapped onto the local SA4 areas. However, for many cities the SA4 areas include large areas (often >50%) of rural and natural landscape that have little population and no IWM interventions. The presence of these areas “washes" out the IWM benefits when averaged across the whole SA4 area, so we needed to find a valid way of removing this effect. The approach used is described below.
For each city, only the urban fraction of the SA4 statistical areas is selected, using the global urban boundaries database (GUB) from Li et al. (2020). The LCZ map is then extracted for each SA4-GUB intersection, and the relative LCZ class weights are calculated (considering all built LCZs (1 to 10) and LCZs B and D). Finally, these weights are used to calculate the TARGET temperatures representative for the urban fraction of the SA4 sector. Figure 7 provides an example of the process for Adelaide. The weighted SA4 areas can then be aggregated again to generate a city-wide value of the temperature metric required (air temperature or amount of cooling observed, etc.).
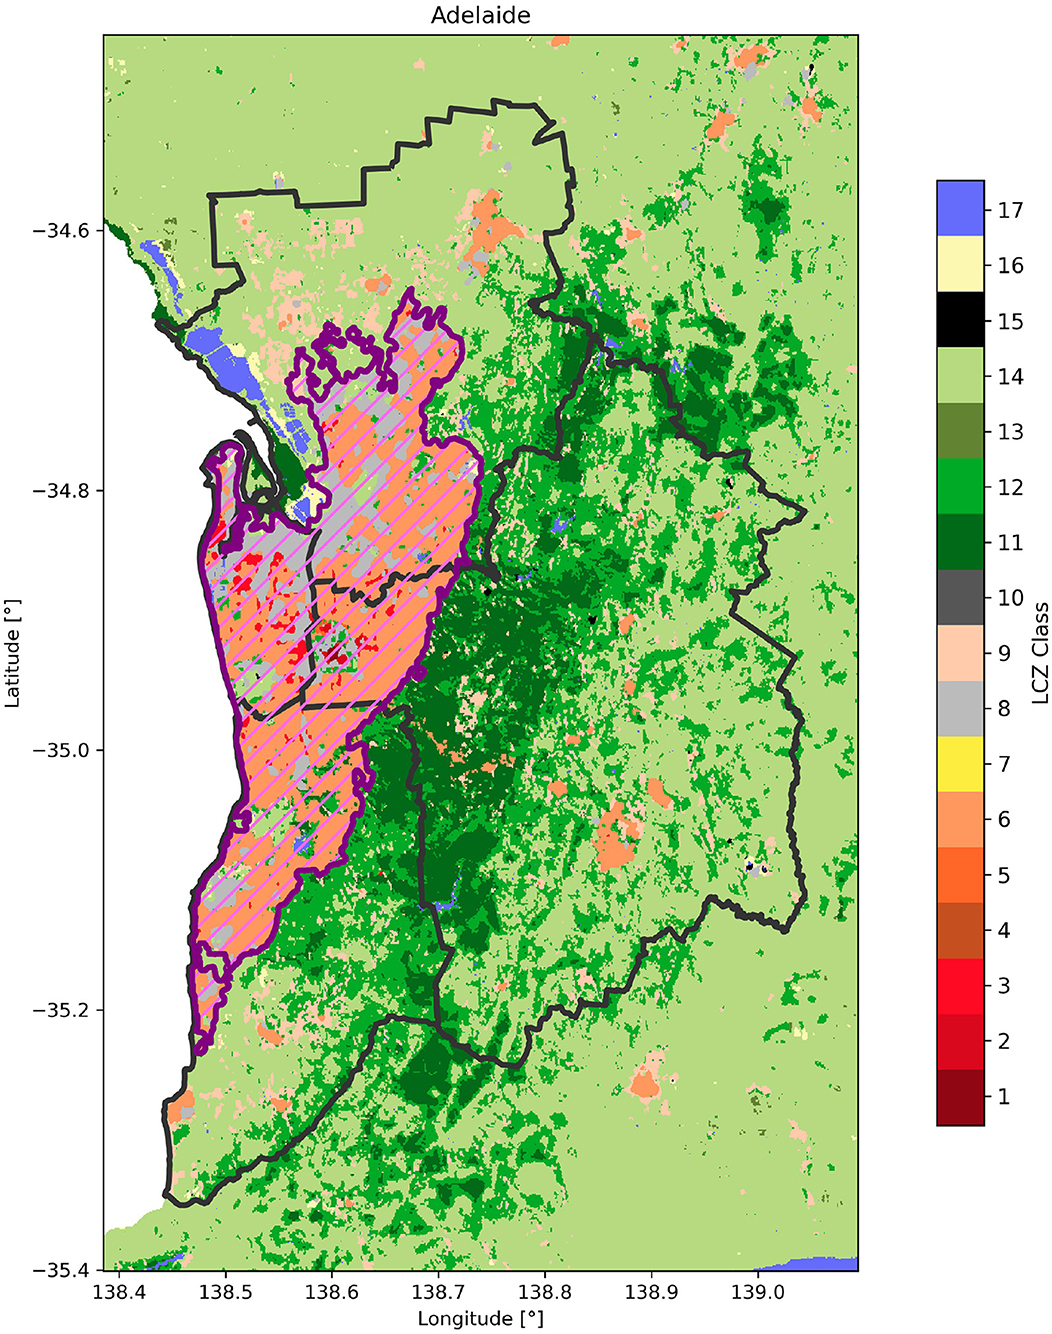
Figure 7. Mapping the SA4 areas from the LCZ map and the global urban boundaries (GUB) database, for Adelaide as an example. The SA4 statistical areas and GUB urban boundary are shown by the black and purple lines respectively. The pink hatched areas indicate the parts of the SA4 sections that are used to derive the LCZ class weights.
The climate of cities depends on their geographical location, local meteorology, and the form of the urban environment. It is well known that more built up areas are generally warmer than less built up and rural areas, particularly at night. However, because this is a relative comparison, these patterns do depend on the type, and moisture status, of natural surfaces. Data was collated at the SA4 level. For smaller cities (e.g., Canberra and Darwin) the SA4 level data covers the entire urban area. For larger cities, such as Melbourne and Sydney, there are several SA4s and spatial variability in temperature is likely. It should also be noted, that the outer SA4s do extend beyond the boundary of urban development and vary with elevation and natural surface cover.
3 Results
Scenario modeling with TARGET was performed for all LCZ classes and their IWM variations (BAU, MODERATE, HIGH) for all cities using ERA5 2010–2020 present day climate conditions as well as CMIP6-adjusted 2030 and 2050 SSP 1.2-6, 3.7-0, and 5.8-5 future climate scenarios. The complete results data set is available at https://doi.org/10.5281/zenodo.10099762 and summaries of the full set of results for each of the nine Australian cities in Appendix 2. The summary data are average daily values for 10-year time periods centered on 2015 (historical data), 2030, and 2050. Cooling for all cities associated with implementation of IWM is calculated as moderate [MOD] or high [HIGH] minus business as usual [BAU] temperatures.
3.1 Present day climate and BAU urban landscape modeling results for all cities
During the day, the SA4 that encompasses the CBD tends to be cooler than the surrounding low-density areas. Shading and heat storage during the day can lead to cooler temperatures in highly built-up areas. IWM tends to be more beneficial in low to medium density areas during the day. This is seen in both Brisbane and Melbourne (Figure 8). At night, the central, high-density areas of the city are warmest due heat trapping by buildings and the slow release of stored energy from urban surfaces.
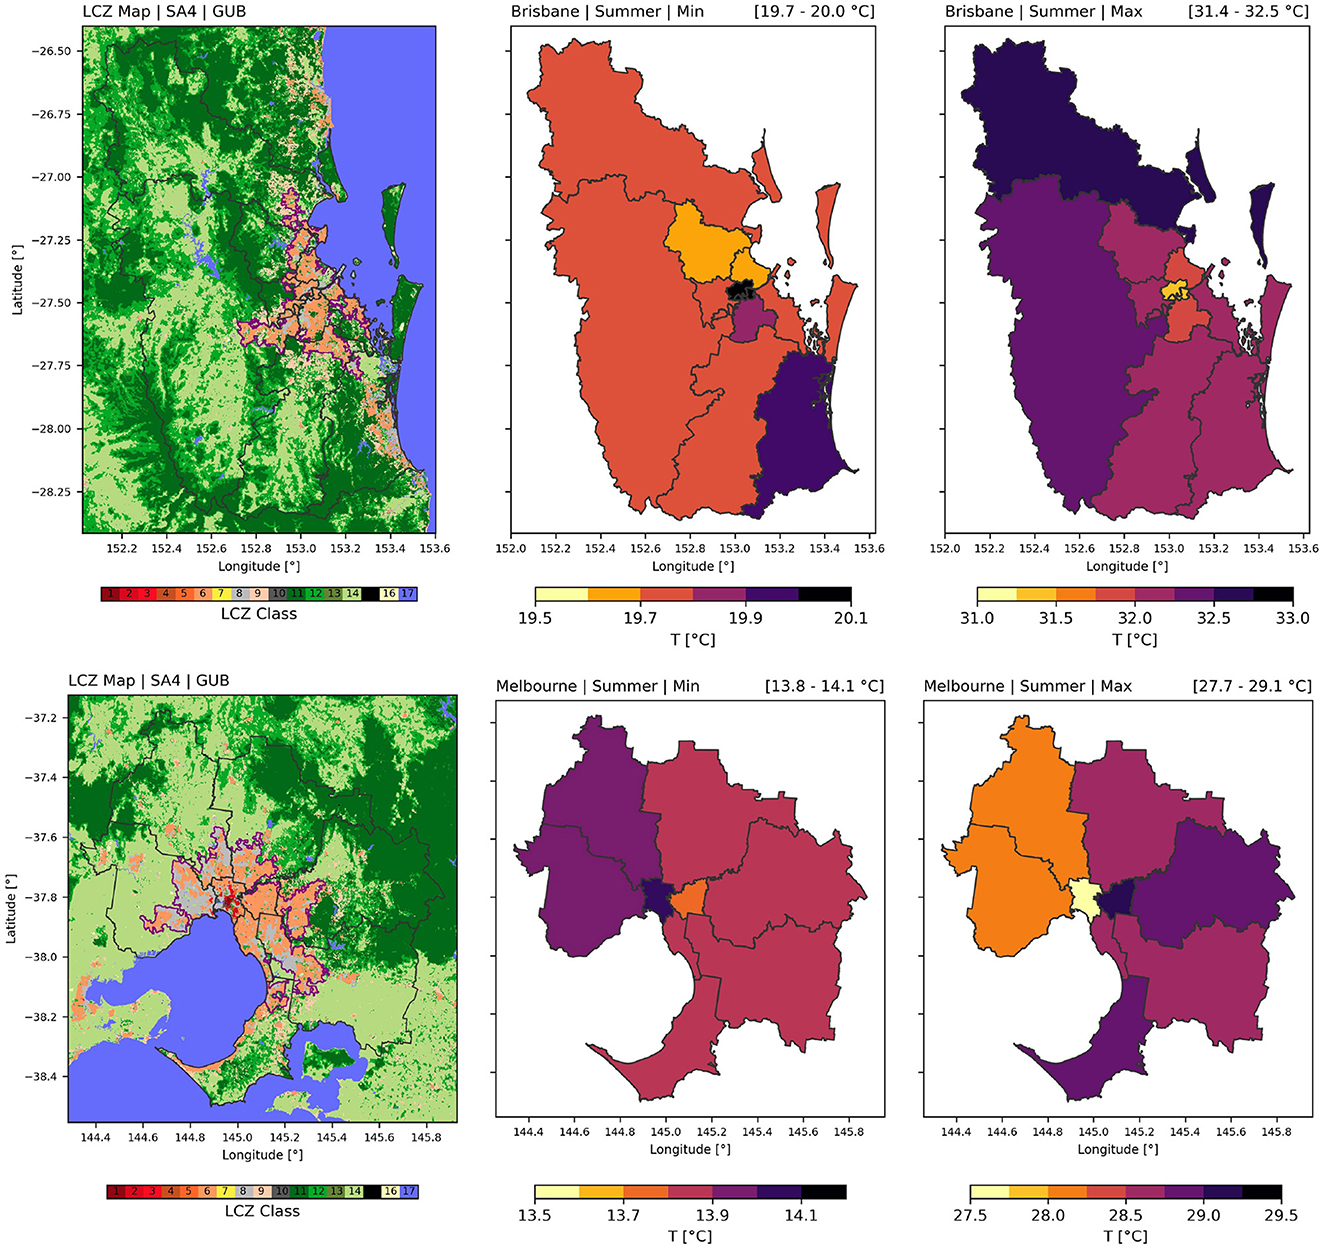
Figure 8. Present day LCZ map (left column), with SA4 (gray) and GUB (purple) boundaries. The middle and right panels indicate the (BAU) mean summer daily minimum (Min) and maximum (Max) temperatures respectively, for Brisbane (top row) and Melbourne (bottom row). Values in square brackets indicate the air temperature range across the available SA4 sections.
3.2 Impact of IWM on present day climate (BAU)
3.2.1 Annual impact of IWM interventions
The implementation of IWM for the present-day climate (as applied in TARGET) led to annual mean daily temperature reductions across all capital and regional cities. Results showed annual mean daily temperature reductions ranging from of -0.09°C in Brisbane to -0.22°C in Albury for MOD IWM interventions, and from -0.12°C in Brisbane to -0.35°C for Albury for HIGH IWM interventions (Table 3).
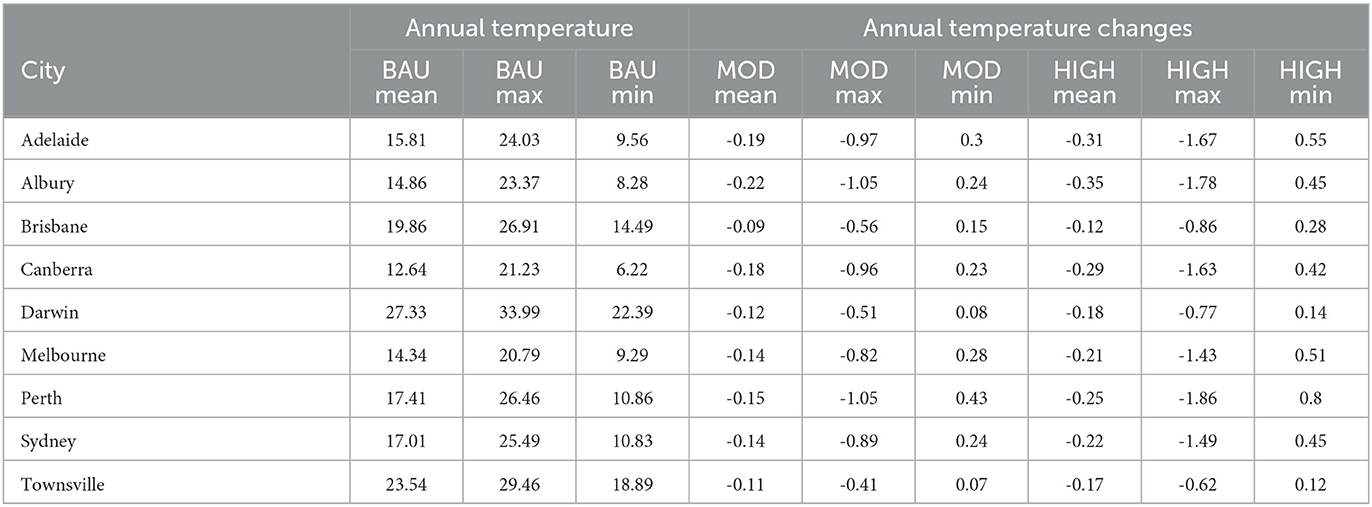
Table 3. Present day (BAU) annual daily mean, maximum (max) and minimum (min) air temperatures (in degrees C) for each capital or regional city, and the associated temperature changes resulting from moderate (MOD) and high (HIGH) IWM interventions.
We also considered the impact of IWM on annual mean maximum and minimum daily temperatures to identify the impact throughout the day. Results showed that the MOD IWM interventions reduced annual mean daily maximum temperatures from -0.51°C in Darwin to -1.05°C in Albury and Perth. The effect is even more pronounced for HIGH IWM interventions, with temperature reductions in annual mean daily maximum temperature ranging from -0.77°C in Darwin, up to -1.86°C in Perth (Table 3).
The cooling behaviors described above are in line with expectations and are driven by the physical processes operating. MOD and HIGH IWM interventions provide increasing amounts of vegetation, shading and water availability compared with BAU. Evapotranspiration is maximized for abundant vegetation with a good water supply providing an extremely effective cooling mechanism, especially when the ambient air is dry and hot.
Generally, the drier southern cities produce the greatest thermal response to implementation of IWM. Therefore, cities such as Perth, Albury and Adelaide show the largest reductions in annual mean maximum daily temperatures from IWM interventions, while the cities of Melbourne, Canberra and Sydney show slightly lower reductions. In contrast, tropical cities, with pronounced wet seasons, produce the smallest thermal response as cooling associated with evapotranspiration is dramatically reduced when the ambient air is moist. This means reductions in annual mean maximum daily temperature from IWM interventions are smaller for Brisbane, Darwin, and Townsville (Table 3).
While the annual mean and maximum daily temperatures show reductions following the implementation of IWM, the annual minimum daily temperatures show an increase across all capital and regional cities. These increases range from 0.08°C in Darwin, to 0.43°C in Perth for the MOD interventions of IWM, and from 0.14°C to 0.8°C for the HIGH IWM interventions for Darwin and Perth respectively. The warming effect of IWM at times of minimum overnight temperature is also in line with expectations and is driven largely by increased storage of daytime heat in the soil (water dramatically increases soil thermal conductivity) followed by its nocturnal release. Cities that showed larger annual maximum daily temperature reductions from IWM also show larger increases in corresponding minimum temperatures. The degree of warming at the time of minimum temperature was unexpected and suggests that IWM could potentially provide health benefits at both ends of the temperature spectrum. This should be investigated further.
3.2.2 Seasonal impact of IWM interventions
The BAU mean daily, maximum, and minimum temperatures are also provided for Summer (DJF: December, January, and February) in Table 4 and Winter (JJA: June, July, and August) in Table 5. Results showed that the cooling benefit of IWM is substantially enhanced during summer for most cities, but especially for the drier southern cities (Table 4). This is most evident in the mean maximum daily temperatures, meaning IWM interventions (especially if implemented widely as in the HIGH case) can help reduce the heat exposure.
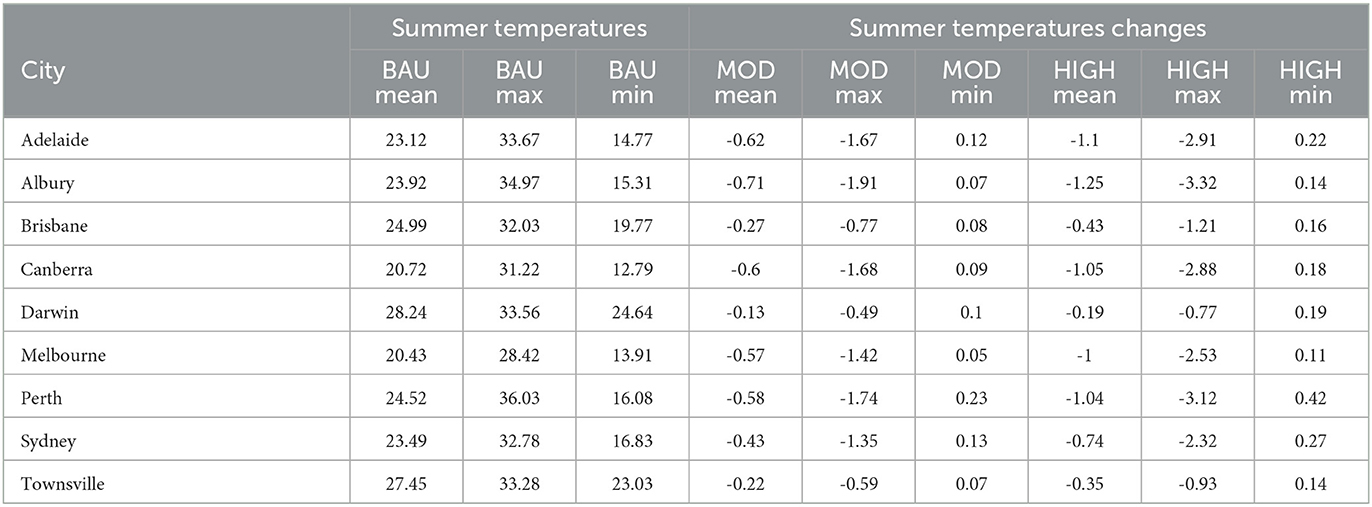
Table 4. Present day (BAU) austral summer (DJF) daily mean, maximum (max) and minimum (min) air temperatures (in degrees C) for each capital or regional city, and the associated temperature changes resulting from moderate (MOD) and high (HIGH) IWM interventions.
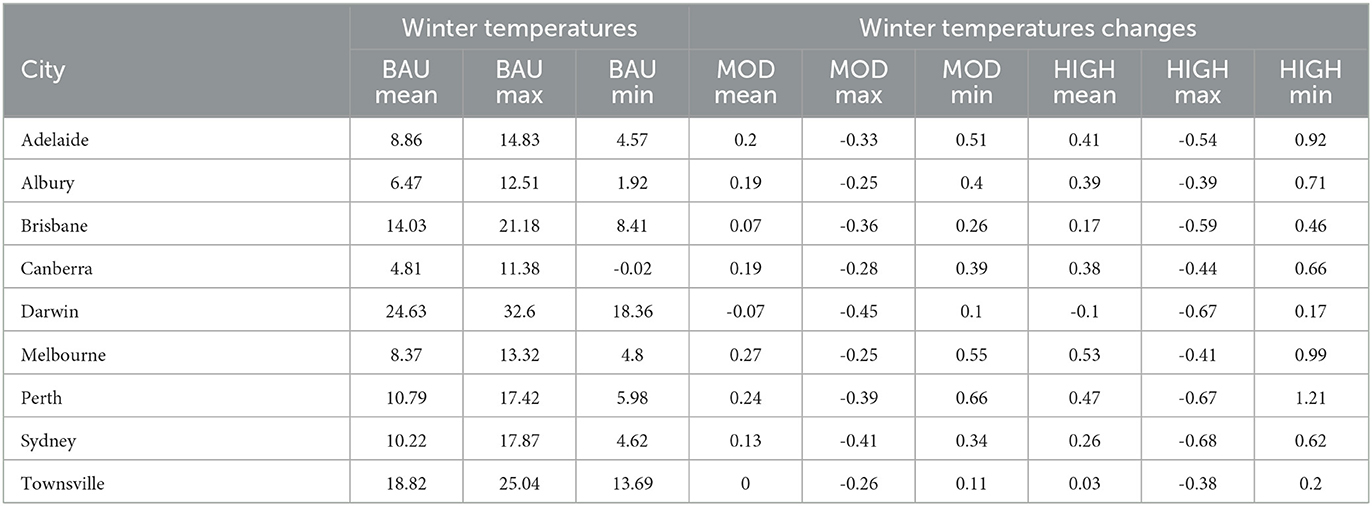
Table 5. Present day (BAU) Austral winter (JJA) daily mean, maximum (max) and minimum (min) air temperatures (in degrees C) for each capital or regional city, and the associated temperature changes resulting from moderate (MOD) and high (HIGH) IWM interventions.
The greatest summer IWM cooling benefits were once again seen for Albury (-3.32°C) and Perth (-3.12°C) at the time of maximum daily temperature for HIGH IWM interventions, while the reductions were more modest in tropical cities, such as Darwin (-0.77°C). Even the mean maximum daily temperature reductions for the MOD IWM interventions were between -0.49°C in Darwin and -1.91°C in Albury.
Considering the summer minimum daily temperatures, the increase in temperature from IWM interventions are not as large as the annual mean daily temperatures. While large temperature reductions are seen in the mean summer maximums during the day, only small temperature increases are seen in the mean summer minimums during the night, suggesting a net positive benefit for heat exposure in Australian cities from the widespread implementation of IWM.
In relation to the winter temperatures, IWM leads to some small reductions in mean winter maximum temperatures of between -0.25°C in Albury and Melbourne, -0.39°C for Perth and -0.45°C in Darwin (the dry season) (Table 5). However, the mean winter minimum temperatures seen at night increase, and to a greater amount than during Summer, meaning IWM can result in warmer nights during the winter, which may also have implications for health outcomes. This result was also seen in the mean daily winter temperatures. It is interesting to note that it is only Darwin that shows IWM cooling at mean daily (and maximum) temperatures.
3.3 Impact of IWM under changing climates
3.3.1 Climate change scenarios
As expected, all the Australian capital and regional cities warm considerably compared to the historical period, with the overall warming greatest for SSP5-8.5 for 2050. Albury has the greatest annual average daily increase in temperature of 1.3°C for SSP5-8.5 at 2050, while Melbourne has the lowest annual average daily increase in temperature of 1.05°C. These are not large changes in temperature, but it should be remembered that 2050 is less than 30 years away, and current average global warming levels are at 1.1°C warming since 1850–1900 (IPCC, 2021). Annual maximum temperatures increase more than mean or minimum temperatures, with Melbourne having the greatest increase in average annual daily maximum temperature of 2.12°C for SSP3-7.0 at 2050.
Comparing the annual average daily temperatures with the Austral summer and winter average daily temperatures (Tables S1–S9 in the Appendix), it is evident that for Australian cities, summers are warming slightly more than annual temperatures, and winter temperatures slightly less. For example, the increase in average daily mean temperatures in Albury in DJF is 1.5°C for SSP5-8.5 at 2050, 0.2°C greater than the annual increase. An example of the temperature increases under the selected climate change scenarios are given for Perth (Table 6). Projected temperature increases for the 2050 current trajectory emission scenario (SSP3-7.0 - highlighted green) are 1.09°C for mean annual daily temperatures but showed increases as high as 1.47°C for summer mean maximum temperatures. This is quite an additional heat load that communities, business, industry, and infrastructure will need to manage.
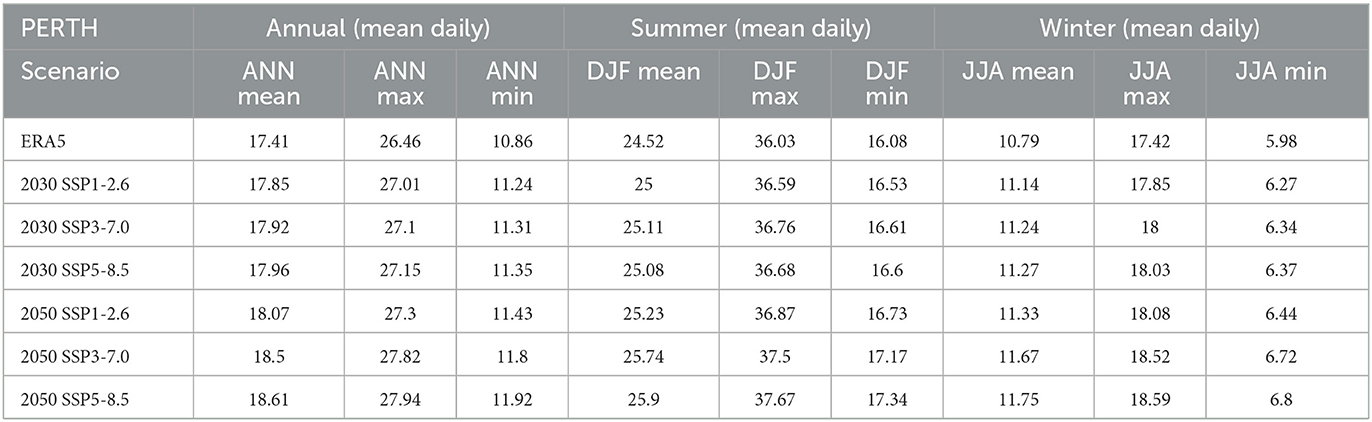
Table 6. Present day (BAU) annual (ANN) mean, maximum (max) and minimum (min) daily temperatures for Perth under each of the 2030 and 2050 climate change scenarios.
3.3.2 Impact of IWM interventions under a changing climate
IWM presents an opportunity to offset projected temperature increases resulting from climate change. The MOD and HIGH IWM interventions were applied in TARGET to see how temperatures would respond under each of the emissions scenarios (Appendix 2). Although cooling differs between cities (as with BAU), the temperature reductions from IWM are relatively constant across all climate scenarios. There are some slight increases in cooling of daytime maximum temperatures (and slight warming during nocturnal minimum temperatures) as warming from climate change increases, however, these are generally less than 0.05°C.
The largest cooling from IWM is provided in the warmer and drier capital and regional cities, and during summer, so this is when there is greatest potential for IWM to offset warming driven by climate change. Given the hazards caused by extreme summer heat, such interventions can be extremely beneficial for urban and suburban residents, reducing peak heat exposure during the day and lowering energy demands.
To demonstrate this, Table 7 presents example data for three cities across Australia's climate spectrum: Perth, Brisbane, and Sydney. Table 7 shows the present-day temperatures and the projected temperatures for the 2050 SSP 3.7-0, along with the temperatures under this scenario following MOD and HIGH IWM interventions. Data suggests that with the MOD IWM interventions, the warming from climate change in 2050 (SSP 3.7-0) at summer maximum temperatures could be offset by the implementation of MOD IWM in the cities of Perth and Sydney (green highlight in Table 7). With HIGH implementation of IWM, warming from climate change could offset both mean annual daily and summer maximum temperatures for Perth and Sydney. In the more sub-tropical city of Brisbane, HIGH IWM could offset the summer maximum temperatures.
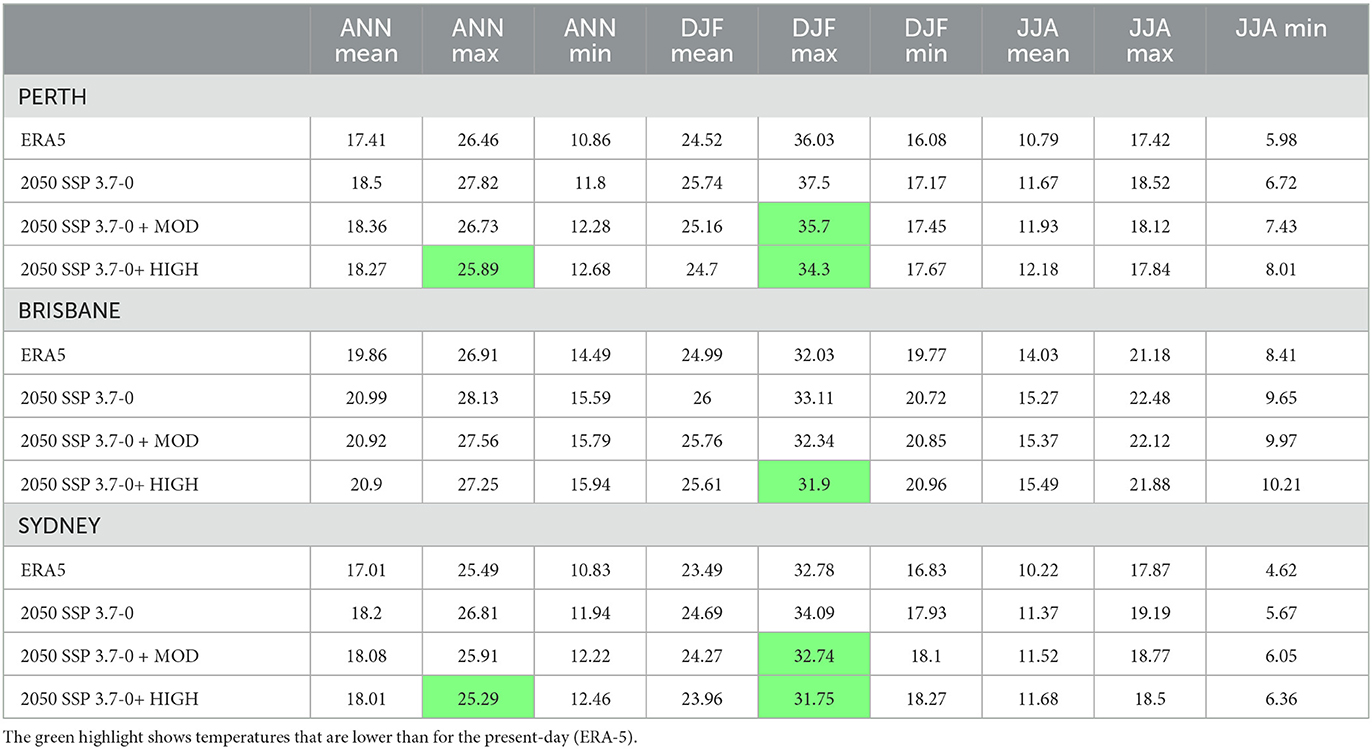
Table 7. Mean daily (mean), maximum (max) and minimum (min) air temperatures (in degrees C) for present day (ERA5), 2050 SSP3-7.5 emissions scenario, and the implementation of moderate (MON) and high (HIGH) IWM.
While there are benefits of IWM for daytime maximum temperatures, the combination of warming from climate change and IWM at night should be considered. While increasing minimum temperatures during winter could save heating energy costs and cold-related health concerns, warmer temperatures at night in summer can still contribute to heat stress, particularly during heat waves. However, the net benefit is positive. In addition, other measures are available that can address high summer minimum temperatures, namely an increase in the albedo of urban surfaces such as roofs and roads, controlling building heights and street widths and reducing waste heat production (from building energy use and transport). The results in Table 7 are also presented below in Figure 9 for Perth, to visualize the general trends seen across the cities.
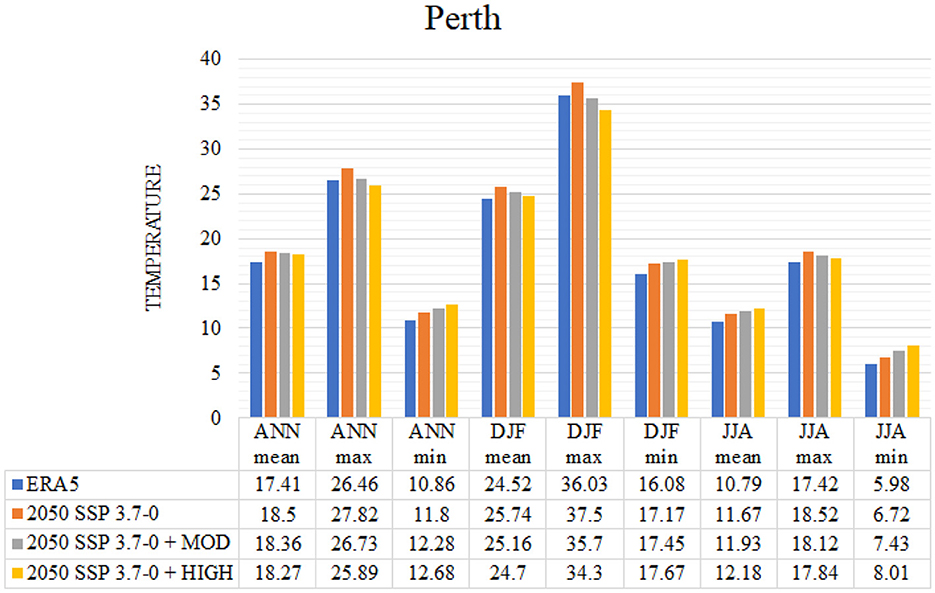
Figure 9. Mean daily, maximum (max) and minimum (min) air temperatures (degrees C) for present day (ERA5), 2050 SSP3-7.5 emissions scenario, and the implementation of moderate (MON) and high (HIGH) IWM.
4 Discussion and conclusion
The Australian Department of Agriculture, Water, and the Environment (DAWE) commissioned this study to evaluate the healthcare cost savings from reducing urban heat through Integrated Water Management (IWM) practices. A key requirement from DAWE was the application of a uniform method across seven capital cities and two regional centers, ensuring a thorough and consistent analysis in diverse urban environments to fully understand the wide-ranging impacts and benefits of IWCM strategies under varying geographical and projected climate change scenarios. The complexity of the task was heightened as none of the nine urban centers had all necessary input data readily available. To address this, a flexible, consistent, and robust approach was developed, including the use of (i) the Local Climate Zone (LCZ) typology as a universal method to depict present-day land surface cover and integrate IWM policy guidelines, (ii) globally available ERA5 reanalysis data providing a basis for current climate simulations, enhanced by CMIP6 climate change projections for future scenarios, and iii) the TARGET model proven to be effective in modeling air temperatures and capturing the spatial temperature variability within and between Australian cities.
This methodical and scalable approach led to significant findings, characterized by its comprehensive nature and adaptability for different urban settings. Climate change was found to lead to warmer (mean daily, maximum, and minimum) temperatures across all Australian cities compared to business as usual with the overall warming greatest for the SSP5-8.5 emissions pathway for 2050. In Australian cities, summers are warming slightly more than annual temperatures, and winter temperatures slightly less.
To provide adaptations to these changes, two scenarios of IWM implementation were explored based on current policy and IWM was found capable of reducing urban air temperatures. The HIGH IWM scenario provided greater reductions in mean daily maximum air temperature. In general, IWM reduces mean daily maximum temperatures during the day, yet increases mean minimum temperatures at night. The net effect of this is a reduction in mean daily temperatures. The largest reductions in temperature from IWM are seen in the mean daily maximum temperatures during summer. The impact of IWM on temperature varies between cities and is more evident in cities with a hotter and drier climate (such as Albury and Perth) resulting in large reduction in mean maximum temperature, particularly in summer. The impact of IWM on temperature is less evident in more humid, tropical cities (such as Darwin and Townsville). Impacts of IWM implementation on projected temperatures under climate change vary between cities, and again larger reductions are seen in cities with hotter and drier climates. The variations in temperature for each city resulting from IWM, are very similar under all climate change scenarios.
IWM has the potential to offset some warming impacts from climate change. In hotter and drier cities, a MOD level of IWM implementation is effective in offsetting the projected mean maximum daily summer warming in 2050 under SSP3-7.0, and some of the warming in more humid, tropical cities. A HIGH level of IWM is needed to offset mean maximum daily summer warming in 2050 under SSP3-7 in humid, tropical cities. IWM generally results in warmer night-time minimum temperatures. However, additional urban heat mitigation measures will be needed to help offset this warming, particularly in summer. A range of options are available including increasing the albedo of urban surfaces (such as roofs and roads), controlling building heights and street widths, and reducing waste heat production (from building energy use and transport).
While the study successfully utilized the TARGET model as an effective tool for modeling air temperatures and capturing both the inter-city and intra-city spatial variability of temperatures in Australian cities, there are some notable limitations. The use of Local Climate Zones (LCZs) for providing a holistic and uniform land surface cover data allowed for the efficient modeling setup, but inherently this approach may oversimplify the complex urban environments. Also the use of ERA5 data and the superimposed CMIP6 climate change data, although robust, may not completely capture the localized microclimatic variations within cities. Finally, other heat mitigation strategies are available, such as increasing the albedo of urban surfaces (such as roofs and roads), controlling building heights and street widths, and reducing waste heat production (from building energy use and transport). These options could be explored in future work using TARGET and the approach used here.
Despite the above, this study's findings are highly relevant in terms of policy making and planning. The detailed data provided by the study can inform urban planning and development, guiding strategies to mitigate urban heat islands and improve climate resilience. Policymakers can use this information to formulate targeted policies and allocate resources effectively, particularly in healthcare and urban infrastructure. Moreover, understanding the economic and environmental benefits of IWM measures can justify investments in green and blue infrastructure, aiding stakeholders in decision-making processes. Additionally, the utilization of simple and uniform data facilitates clearer communication and mutual understanding across different departments and stakeholders. This shared “language” in interpreting data ensures that all parties are aligned and can collaboratively work toward common goals, enhancing the efficacy of policy implementation and stakeholder engagement.
Data availability statement
The datasets presented in this study can be found in online repositories. The names of the repository/repositories and accession number(s) can be found below: https://doi.org/10.5281/zenodo.10099762.
Author contributions
KN: Conceptualization, Formal analysis, Methodology, Software, Writing – original draft, Writing – review & editing. MD: Conceptualization, Data curation, Formal analysis, Investigation, Methodology, Software, Visualization, Writing – original draft, Writing – review & editing. AMC: Writing – review & editing, Methodology, Investigation, Conceptualization. NT: Conceptualization, Funding acquisition, Methodology, Writing – original draft, Writing – review & editing.
Funding
The author(s) declare financial support was received for the research, authorship, and/or publication of this article. Funding for KN, MD, AMC, and NT were provided by the Australian Department of Agriculture, Water and the Environment (DAWE).
Conflict of interest
The authors declare that the research was conducted in the absence of any commercial or financial relationships that could be construed as a potential conflict of interest.
Publisher's note
All claims expressed in this article are solely those of the authors and do not necessarily represent those of their affiliated organizations, or those of the publisher, the editors and the reviewers. Any product that may be evaluated in this article, or claim that may be made by its manufacturer, is not guaranteed or endorsed by the publisher.
Supplementary material
The Supplementary Material for this article can be found online at: https://www.frontiersin.org/articles/10.3389/frsc.2024.1337449/full#supplementary-material
References
ACT Government (2019). Canberra's Living Infrastructure Plan: Cooling the City. Available online at: https://www.climatechoices.act.gov.au/policy-programs/canberras-living-infrastructure-plan (accessed October 1, 2022).
Belcher, S. E., Hacker, J. N., and Powell, D. S. (2005). Constructing design weather data for future climates. Building Serv. Eng. Res. Technol. 26, 49–61. doi: 10.1191/0143624405bt112oa
Bowler, D. E., Buyung-Ali, L., Knight, T. M., and Pullin, A. S. (2010). Urban greening to cool towns and cities: a systematic review of the empirical evidence. Landsc. Urban Plan. 97, 147–155. doi: 10.1016/j.landurbplan.2010.05.006
Broadbent, A. M., Coutts, A. M., Nice, K. A., Demuzere, M., and Krayenhoff, E. S. (2019). The air-temperature response to green/blue-infrastructure evaluation tool (TARGET v1.0): an efficient and user-friendly model of city cooling. Geosci. Model Dev. 12, 785–803. doi: 10.5194/gmd-12-785-2019
Broadbent, A. M., Coutts, A. M., Tapper, N. J., Demuzere, M., and Beringer, J. (2017). The microscale cooling effects of water sensitive urban design and irrigation in a suburban environment. Theor. Appl. Climatol. 134, 1–23. doi: 10.1007/s00704-017-2241-3
Brunner, J. and Cozens, P. (2013). 'Where have all the trees gone?' Urban consolidation and the demise of urban vegetation: a case study from Western Australia. Plann. Pract. Res. 28, 231–255. doi: 10.1080/02697459.2012.733525
Cheung, P. K. and Jim, C. Y. (2018). Comparing the cooling effects of a tree and a concrete shelter using PET and UTCI. Build. Environ. 130, 49–61. doi: 10.1016/j.buildenv.2017.12.013
Cheung, P. K., Jim, C. Y., Tapper, N., Nice, K. A., and Livesley, S. J. (2022). Daytime irrigation leads to significantly cooler private backyards in summer. Urban Climate 46, 101310. doi: 10.1016/j.uclim.2022.101310
Cheung, P. K., Livesley, S. J., and Nice, K. A. (2021). Estimating the cooling potential of irrigating green spaces in 100 global cities with arid, temperate or continental climates. Sustain. Cities Soc. 71, 102974. doi: 10.1016/j.scs.2021.102974
Ching, J., Mills, G., Bechtel, B., See, L., Feddema, J., Wang, X., et al. (2018). World Urban Database and Access Portal Tools (WUDAPT), an urban weather, climate and environmental modeling infrastructure for the Anthropocene. Bull. Am. Meterol. Soc. 1907–1924. doi: 10.1175/BAMS-D-16-0236.1
City of Paramatta (2021). Urban Forest. Available online at: https://www.cityofparramatta.nsw.gov.au/environment/city-in-nature/urban-forest (accessed October 1, 2022).
City of Port Phillip (2018). City of Port Phillip WSUD Guidelines. Available online at: https://www.portphillip.vic.gov.au/media/1tcd5vel/e27210-19-city-of-port-phillip-wsud_guidelines-final.pdf (accessed October 1, 2022).
Coutts, A. M., Tapper, N. J., Beringer, J., Loughnan, M., and Demuzere, M. (2012). Watering our cities: the capacity for water sensitive urban design to support urban cooling and improve human thermal comfort in the Australian context. Prog. Phys. Geography 37, 2–28. doi: 10.1177/0309133312461032
Coutts, A. M., White, E. C., Tapper, N. J., Beringer, J., and Livesley, S. J. (2015). Temperature and human thermal comfort effects of street trees across three contrasting street canyon environments. Theoret. Appl. Climatol. 124, 55–68. doi: 10.1007/s00704-015-1409-y
Demuzere, M., Coutts, A., Göhler, M., Broadbent, A., Wouters, H., van Lipzig, N., et al. (2014a). The implementation of biofiltration systems, rainwater tanks and urban irrigation in a single-layer urban canopy model. Urban Clim. 10, 148–170. doi: 10.1016/j.uclim.2014.10.012
Demuzere, M., Kittner, J., Martilli, A., Mills, G., Moede, C., Stewart, I. D., et al. (2022). A global map of local climate zones to support earth system modelling and urban-scale environmental science. Earth Syst. Sci. Data 14, 3835–3873. doi: 10.5194/essd-14-3835-2022
Demuzere, M., Orru, K., Heidrich, O., Olazabal, E., Geneletti, D., Orru, H., et al. (2014b). Mitigating and adapting to climate change: multi-functional and multi-scale assessment of green urban infrastructure. J. Environm. Manage. 146, 107-115. doi: 10.1016/j.jenvman.2014.07.025
Eyring, V., Bony, S., Meehl, G. A., Senior, C. A., Stevens, B., Stouffer, R. J., et al. (2016). Overview of the Coupled Model Intercomparison Project Phase 6 (CMIP6) experimental design and organization. Geosci. Model Dev. 9, 1937–1958. doi: 10.5194/gmd-9-1937-2016
Geoscape (2022). Geoscape Surface Cover: Product Description Version 1.7. Available online at: https://docs.geoscape.com.au/projects/surfacecover_desc/en/stable/index.html
Global Water Partnership (2000). Integrated Water Resources Management. Available online at: https://www.gwp.org/globalassets/global/toolbox/publications/background-papers/04-integrated-water-resources-management-2000-english.pdf (accessed October 1, 2022).
Hendel, M., Gutierrez, P., Colombert, M., Diab, Y., and Royon, L. (2016). Measuring the effects of urban heat island mitigation techniques in the field: Application to the case of pavement-watering in Paris. Urban Climate 16, 43–58. doi: 10.1016/j.uclim.2016.02.003
Hersbach, H., Bell, B., Berrisford, P., Hirahara, S., Horányi, A., Nicolas, J., et al. (2020). The ERA5 global reanalysis. Quart. J. Royal Meteorol. Soc. 146, 1999–2049. doi: 10.1002/qj.3803
IPCC (2021). “Climate change 2021: the physical science basis,” in Contribution of Working Group I to the Sixth Assessment Report of the Intergovernmental Panel on Climate Change. Cambridge, United Kingdom and New York, NY, USA: Cambridge University Press.
Jamei E. and Tapper, N. (2019). WSUD and Urban heat island effect mitigation. Appr. Water Sens. Urban Design. 19, 381–407. doi: 10.1016/B978-0-12-812843-5.00019-8
Jia, H., Wang, Z., and Yu, S. L. (2020). Opportunity and challenge-china's sponge city plan. Hydrolink 4, 100–102.
Jia S. and Wang, Y. (2021). Effect of heat mitigation strategies on thermal environment, thermal comfort, and walkability: a case study in Hong Kong. Build. Environ. 201, 107988. doi: 10.1016/j.buildenv.2021.107988
Krayenhoff, E. S., Broadbent, A. M., Zhao, L., Georgescu, M., Middel, A., Voogt, J. A., et al. (2021). Cooling hot cities: a systematic and critical review of the numerical modelling literature. Environ. Res. Lett. 16, 053007. doi: 10.1088/1748-9326/abdcf1
Li, X., Gong, P., Zhou, Y., Wang, J., Bai, Y., Chen, B., et al. (2020). Mapping global urban boundaries from the global artificial impervious area (GAIA) data. Environ. Res. Lett., 15, 094044. doi: 10.1088/1748-9326/ab9be3
Loughnan, M. E., Nicholls, N., and Tapper, N. J. (2010). When the heat is on: threshold temperatures for ami admissions to hospital in Melbourne Australia. Appl. Geograp. 30, 63–69. doi: 10.1016/j.apgeog.2009.08.003
Manteghi, G., bin Limit, H., and Remaz, D. (2015). Water bodies an urban microclimate: a review. Modern Appl. Sci. 9, 6. doi: 10.5539/mas.v9n6p1
Martilli, A., Krayenhoff, E. S., and Nazarian, N. (2020). Is the Urban Heat Island intensity relevant for heat mitigation studies? Urban Climate 31. doi: 10.1016/j.uclim.2019.100541
Middel, A. and Krayenhoff, E. S. (2019). Micrometeorological determinants of pedestrian thermal exposure during record-breaking heat in Tempe, Arizona: introducing the MaRTy observational platform. Sci. Total Environm. 687, 137–151. doi: 10.1016/j.scitotenv.2019.06.085
Nazarian, N., Krayenhoff, E. S., Bechtel, B., Hondula, D. M., Paolini, R., Vanos, J., et al. (2022). Integrated assessment of urban overheating impacts on human life earth's future. Earth's Fut. 10, e2022EF002682. doi: 10.1029/2022EF002682
New South Wales (2021). State Environmental Planning Policy (Design and Place). New South Wales Government. Available online at: https://thefifthestate.com.au/wp-content/uploads/2022/03/DPSEPP_ConsultationDraftRev2_e2021-137-d18_Accessible.pdf
Newton, P. W. and Rogers, B. C. (2020). Transforming built environments: towards carbon neutral and blue-green cities. Sustainability 12, 4745. doi: 10.3390/su12114745
Nice, K. A., Nazarian, N., Lipson, M. J., Hart, M. A., Seneviratne, S., Thompson, J., et al. (2022). Isolating the impacts of urban form and fabric from geography on urban heat and human thermal comfort. Build. Environm. 224, 109502. doi: 10.1016/j.buildenv.2022.109502
Nicholls, N., Skinner, C., Loughnan, M., and Tapper, N. (2008). A simple heat alert system for Melbourne, Australia. Int. J. Biometeorol. 52, 375–384. doi: 10.1007/s00484-007-0132-5
NSW Department of Planning Environment (2015). Apartment Design Guide. Available online at: https://www.planning.nsw.gov.au/apartmentdesignguide (accessed October 1, 2022).
Oke, T. R., Mills, G., Christen, A., and Voogt, J. A. (2017). Urban Climates. Cambridge: Cambridge University Press.
Perkins-Kirkpatrick, S. E. and Lewis, S. C. (2020). Increasing trends in regional heatwaves. Nat. Commun. 11, 3357. doi: 10.1038/s41467-020-16970-7
Probst, N., Bach, P. M., Cook, L. M., Maurer, M., and Leit ao, J. P. (2022). Blue Green Systems for urban heat mitigation: mechanisms, effectiveness and research directions. Blue-Green Syst. 4, 348–376. doi: 10.2166/bgs.2022.028
Pulkkinen, J. and Louis, J.-N. (2021). Near- and medium-term hourly morphed mean and extreme future temperature datasets for Jyväskylä, Finland, for building thermal energy demand simulations. Data in Brief 37, 107209. doi: 10.1016/j.dib.2021.107209
Renouf, M. A., Kenway, S. J., Bertram, N., London, G., Todorovic, T., Sainsbury, O., et al. (2020). Water Sensitive Outcomes for Infill Development: Infill Performance Evaluation Framework. Melbourne, Australia: Cooperative Research Centre for Water Sensitive Cities. Technical report, CRC for Water Sensitive Cities.
Santamouris, M., Ding, L., Fiorito, F., Oldfield, P., Osmond, P., Paolini, R., et al. (2017). Passive and active cooling for the outdoor built environment - analysis and assessment of the cooling potential of mitigation technologies using performance data from 220 large scale projects. Solar Energy 154, 14–33. doi: 10.1016/j.solener.2016.12.006
Shashua-Bar, L. and Hoffman, M. (2000). Vegetation as a climatic component in the design of an urban street: an empirical model for predicting the cooling effect of urban green areas with trees. Energy Build. 31, 221–235. doi: 10.1016/S0378-7788(99)00018-3
Solcerova, A., van Emmerik, T., Hilgersom, K., van de Ven, F., and van de Giesen, N. (2018). Uchimizu: a cool(ing) tradition to locally decrease air temperature. Water 10, 741. doi: 10.3390/w10060741
Spronken-Smith, R. A. and Oke, T. R. (2010). The thermal regime of urban parks in two cities with different summer climates. Int. J. Remote Sens. 19, 2085–2104. doi: 10.1080/014311698214884
State of Victoria (2017). Integrated Water Management Framework for Victoria: An IWM Approach to Urban Water Planning and Shared Decision Making Throughout Victoria. Available online at: https://www.water.vic.gov.au/__data/assets/pdf_file/0022/81544/DELWP-IWM-Framework-FINAL-FOR-WEB.pdf (accessed October 1, 2022).
Stewart, I. D. and Oke, T. R. (2012). Local climate zones for urban temperature studies. Bull. Am. Meteorol. Soc. 93:1879–1900. doi: 10.1175/BAMS-D-11-00019.1
Theeuwes, N. E., Solcerová, A., and Steeneveld, G. J. (2013). Modeling the influence of open water surfaces on the summertime temperature and thermal comfort in the city. J. Geophys. Res. 118, 8881–8896. doi: 10.1002/jgrd.50704
Varghese, B. M., Wondmagegn, B., Borg, M., Tong, M., Demuzere, M., Nice, K., et al. (2024). Heat-Attributable Hospitalisations and Associated Costs: Current Risk, Future Projection, and Intervention Effectiveness: A Multi-site Study in Australia, 2010-2019. Preparation
Völker, S., Baumeister, H., ClaSSen, T., Hornberg, C., and Kistemann, T. (2013). Evidence for the temperature-mitigating capacity of urban blue space – a health geographic perspective. Erdkunde 67, 355–371. doi: 10.3112/erdkunde.2013.04.05
Western Sydney Regional Organisation of Councils (WSROC) (2021). Turn Down the Heat. Available online at: https://wsroc.com.au/projects/project-turn-down-the-heat (accessed October 1, 2022).
Whiteoak, K. (2019). Economics of water sensitive urban design. Approach Water Sens. Urban Design. 14, 287–302. doi: 10.1016/B978-0-12-812843-5.00014-9
Wong, T. H. F. and Brown, R. R. (2009). The water sensitive city: principles for practice. Water Sci. Technol. 60, 673–682. doi: 10.2166/wst.2009.436
Woods-Ballard, B., Kellagher, R., Martin, P., Jefferies, C., Bray, R., and Shaffer, P. (2007). The SuDS Manual. London: CIRIA.
Yang, G., Yu, Z., Jørgensen, G., and Vejre, H. (2020). How can urban blue-green space be planned for climate adaption in high- latitude cities? A seasonal perspective. Sust. Cities Soc. 53, 101932. doi: 10.1016/j.scs.2019.101932
Keywords: integrated water management, climate change, TARGET, Local Climate Zones, climate adaptation strategies, cooling benefits
Citation: Nice KA, Demuzere M, Coutts AM and Tapper N (2024) Present day and future urban cooling enabled by integrated water management. Front. Sustain. Cities 6:1337449. doi: 10.3389/frsc.2024.1337449
Received: 13 November 2023; Accepted: 05 March 2024;
Published: 04 April 2024.
Edited by:
Victor L. Barradas, National Autonomous University of Mexico, MexicoReviewed by:
Stevan Savic, University of Novi Sad, SerbiaDragan Milosevic, Wageningen University and Research, Netherlands
Surabhi Mehrotra, Maulana Azad National Institute of Technology, India
Copyright © 2024 Nice, Demuzere, Coutts and Tapper. This is an open-access article distributed under the terms of the Creative Commons Attribution License (CC BY). The use, distribution or reproduction in other forums is permitted, provided the original author(s) and the copyright owner(s) are credited and that the original publication in this journal is cited, in accordance with accepted academic practice. No use, distribution or reproduction is permitted which does not comply with these terms.
*Correspondence: Kerry A. Nice, kerry.nice@unimelb.edu.au; Matthias Demuzere, matthias@b-kobe.be
†ORCID: Kerry A. Nice orcid.org/0000-0001-6102-1292
Matthias Demuzere orcid.org/0000-0003-3237-4077
Nigel Tapper orcid.org/0000-0002-3207-9978