The correlates of smartphone use for transportation purposes in Egypt and Lebanon
 Rania Elsayed Saber1 Dina M. Dief-Allah2,3
  Nora Osama Ahmed4 Basma M. Khalifa2
  Houshmand Masoumi5,6*
- 1Department of Urban Design, Faculty of Urban and Regional Planning, Cairo University, Giza, Egypt
- 2Department of Architectural Engineering, Faculty of Engineering and Technology, Future University in Egypt (FUE), Cairo, Egypt
- 3Department of Urban Design and Urban Planning, Faculty of Engineering, Ain Shams University, Cairo, Egypt
- 4Architecture and Housing Research Institute, Housing and Building National Research Center (HBRC), Giza, Egypt
- 5Center for Technology and Society, Technische Universität Berlin, Berlin, Germany
- 6Department of Transport and Supply Chain Management, College of Business and Economics, University of Johannesburg, Johannesburg, South Africa
The determinants of smartphone use for urban transportation purposes in developing countries, particularly in the cities of the Middle East and North Africa, have not been thoroughly investigated so far. This study aims to clarify the individual, mobility, and perception-related correlates of smartphone use specifically for ordering vehicles via ride-sourcing in medium-sized and large cities as well as the megacities of the region. The four cities of Cairo and Alexandria in Egypt and Beirut and Jounieh in Lebanon were taken as case-study cities. An overall sample of 3,285 face-to-face interviews was undertaken between late 2022 and early 2023 using a questionnaire focusing on individual, household, mobility, and perceptions of the respondents. The research depends on a chi-square test of independence and Binary logistic regression to answer three research questions: Are the levels of smartphone use for transportation purposes significantly different in the countries of Egypt and Lebanon? What are the correlates of smartphone use for transportation purposes in the four case-study cities? What are the differences among the correlates of smartphone use for transportation purposes in the four case-study cities? The results of a Chi-square test of independence show that there is a highly significant difference between the smartphone use levels for transportation purposes among the four case-study cities: in subsamples in the Egyptian and Lebanese capitals, there is a stronger tendency to use smartphones for transportation. Moreover, the model fit based on Binary Logistic regression shows that age, trip generation for non-commute purposes, perceived ease of using ride-sourcing apps, perceived security when using public transportation, education status, and gender are significantly correlated with smartphone use. These explanatory variables function somehow differently in the case-study cities, but in general, there are strong similarities among the four cities. In conclusion, the results of this study can be used to reduce personal car use and strengthen shared mobility in the cities of the Middle East and North Africa region.
1 Introduction
The use of smartphone applications (apps) is nowadays pervasive, and people usually carry them throughout the day. Transportation experts have often touted the various benefits of passenger multimode to curtail travel by private car and promote more sustainable transportation (Shaheen, 2016). Understanding transportation apps and their usage is important for policy development and transportation planners, enhances collaboration, and identifies opportunities for public and private partnerships (Nikolí and Bierlaire, 2017). Many previous studies have indicated the negative effects of using a smartphone in cities during transportation; the use of smartphones can increase accidents, especially among cyclists and pedestrians (De Angelis et al., 2020; Macioszek and Granà, 2021; Hersh et al., 2022; Sobrinho-Junior et al., 2022; Macioszek et al., 2023). However, this study addresses the other side and focuses on the correlation of smartphone usage for transport purposes from ordering vehicles in two less-studied developing countries: Egypt and Lebanon. Despite the spread of smartphone app usage, there is a lack of studies in this field, so this study seeks to determine the correlation between smartphone use in transport in the MENA region, especially in Egypt and Lebanon, to make decision policies easier.
The paper continues with a literature review of smartphone use for transportation purposes for ordering vehicles in the Middle East and North Africa (MENA) states, with a focus on the decisions of behaviors of urban passengers. The case study areas, data collection, variables, and statistical models applied for analysis are then explained. The discussion section includes a brief introduction to the differences between the findings of this study with different countries, as well as recommendations for policymaking and future expected research.
2 Literature review
2.1 Usage of smartphones for urban travels
Living in a world, where mobile phones have become a main part of our daily lives, the smartphone, rather than the basic or featured phones has developed to become the most common type of mobile used, also acting as a computer always underhand (Silver et al., 2019). It is assumed that the current number of smartphone users in the world stands at a figure of 6.92 billion, representing 85.88% of the world’s population. This percentage jumped from around 49.4% of the world’s population in 2016 (Turner, 2023). With internet connections, smartphones facilitate the lifestyles of different users by installing and accessing uncountable applications based on their personal needs and interests of individuals. Ranging from shopping, providing entertainment and news, socializing, and navigating to banking and governmental services, the developed and followed by emerging economies have shifted widely to depend digitally on their websites, social media, and applications. While most studies show that younger and highly educated adults tend to use smartphones more, the shift to digital dependency has driven and sometimes obliged larger sectors of our societies worldwide to depend on smartphones to access their daily needs and services. Generally, the rise in the use of smartphone applications triggered studies to test the social norms and personal behavior and the main intentions that drive individuals to become users or non-users of smartphone applications. For example, Verkasalo et al. (2010) focused their study on testing the perceived level of usefulness, adaptation, and enjoyment while using different applications to justify the difference in behavior of users and non-users.
Regarding the different travel behaviors of individuals, with the launch of smartphone devices in 2007, their usage offered the potential for its users to personalize their transport options. Users can navigate, decide, and change traveling plans by accessing real-time information and services. Worldwide web mapping and satellite navigation platforms/applications (i.e., Google Maps) offer street maps with real-time traffic conditions, in addition to trip planning, suggesting suitable routes, different mobility modes (i.e., by foot, bike, car, public transport, etc.) and the estimated time for traveling. Building on this development, international, regional, and country-based organizations and companies have been encouraged to offer services to their users ranging from public transport operators presenting their ticketing, schedules, updates, and tracking services via their applications to ride-sourcing companies. That facilitated the provision of private, taxi, or share-riding vehicles for their application users. Application-based transport networks (such as Uber, Lyft, Didi, Careeem, Bolt, Indrive, etc.) focused on narrowing the gap between private and public transport modes by showing reliable, comfortable, on-demand, end-to-end travel routes instead of owning or relying on personal cars for traveling, which has proven to change the context of transportation and influence users’ behavior (Chaudhry et al., 2023).
With the growing dependence on smartphone applications to travel, research studies have been revolving around the relationship between smartphone use and travel behavior, examining the different variables that affect this co-relationship. Academics have examined the factors that generally affect the use of transport-related smartphone applications, while more studies explored the perceived impact of smartphone usage on travel decisions. Caulfield and Brazil (2013) examined the different socio-economic and demographic factors that influence the usage of transport-based applications This led to the conclusion that the age of the users is the most distinguished variable, with younger adults ranging from 15 to 44 years old being most likely to own their personal smartphones, technologically adapt faster, and use these applications. Furthermore, the dependency on transport use applications is highly associated with the type of trip and transport mode(s). Unfamiliar or long or uncomfortable trip routes, lack of parking services, public transport arrival time, and the scarcity or unavailability of public transport modes or the need to exchange between more than one mode to reach the arrival destination points are some of the factors that encourage the use of smartphone transport applications, favoring ride-sourcing services rather than relying on the users’ private car or public transport. Furthermore, while the education level of the respondents was found to be of weak significance in Western higher economic countries, these factors have been found to have a higher significant effect on smartphone use in developing economies and the MENA region.
Taking a different perspective on the smartphone-commuting relationship, Jamal and Habib (2020) guided their study to explore how smartphones affect traveling decisions. The usage of smartphone applications has influenced the main decisions concerning trip planning, departure time, mode choice, and destination, in addition to travel outcomes. In reviewing different studies that have assessed the users and non-users of transport-use applications and the travel decisions related, the age of the respondents, attitudes towards smartphone usage for travel, public transport ticket ownership, and driving habits have been highlighted as the main significant factors. Moreover, the surrounding built environment has been pinpointed as a significant variable in several studies influencing the dependency on smartphones to travel, leading to the main travel decisions.
2.2 Smartphone use for transportation in the MENA region
Smartphone usage in the MENA region has vastly increased to reach a percentage of 76% of the region’s population and has affected people’s lifestyles and travel patterns dramatically (Statista, 2023). The shift in the economic, social, and cultural characteristics of the MENA region countries, in addition to the transformation of the different spatial patterns of its cities, triggered studies to analyze the gap within urban travel behaviors, perceptions, and attitudes between the MENA region and high-income, western countries. For instance, the study of Andraos et al. (2020) pinpointed the main shortcomings of urban transportation planning in the MENA region, to tailor and guide future transport policies in the region. Socioeconomics, land use distribution and urban sprawling, peoples’ perceptions, attitudes, active mobility, public transportation infrastructure, and the development of new technologies and concepts, were discussed to analyze the mentioned gap. The study also reflected the reaction of these MENA societies towards the introduction of new technologies and mobility concepts; ride-sharing and pooling programs through smartphone applications are on the increase in MENA cities, but still face cultural and gender issues. Ranging from countries where urban planning and infrastructure are mainly based on personal car use, lifestyles built around cars, and social status perceived from car ownership in addition to cultural and gender constraints. For example, in Saudi Arabia, or cities with poor public transport such as Lebanon to cities with higher populations and high poverty rates that hinder the ownership of cars or even smartphones; attitudes towards travel behavior and accepting new technologies to travel are variable. Whereas gender does not significantly affect the use of smartphones to travel in Western cities, it is of high significance in the MENA region. Females, seeking more secure, safe, and comfortable alternatives, while more reluctant to use public transport, depend highly on source riding applications as a second option after personal car use. Furthermore, Chaudhry et al. (2023) in their review highlighted the factors of climatic conditions, ethnic and faith values, and income differences that are deeply rooted in the socio-spatial contexts of the MENA cities influencing travel behavior and mode choice. Findings such as trip security, cost-effectiveness, anti-shared mobility, and technology-oriented attitudes influenced the use of ride-sourcing applications. Moreover, while exploring the correlation between regular use of ride-sourcing and public transport use in the MENA region, Mostofi et al. (2020) highlighted the socioeconomic factors, travel parameters, and the citizens’ perception of public transport. Their study assumed that regular usage of one transport mode affects the choice of other modes and concluded that individuals from high-income households, females, and individuals with a high perception of discomfort and unease in public transport are the most frequent users of ride-sourcing.
3 Methodology
3.1 Research questions and hypotheses
The study seeks to answer three research questions. First, are the levels of smartphone use for transportation purposes significantly different in the two countries, Egypt and Lebanon? Secondly, what are the correlates of smartphone use for transportation purposes in the four case-study cities? And lastly, what are the differences among the correlates of smartphone use for transportation purposes in the four case-study cities? The main hypothesis of this study is that using smartphones for transportation purposes in cities of Egypt and Lebanon is correlated with a wide range of explanatory variables including individual, household, mobility, and perceptions of the respondents. The levels of smartphone use for transportation purposes in MENA cities are different, and its correlates may vary in different cities, but, in general, they are similar to a high extent.
It is also hypothesized that the correlates of usage of smartphones for transportation purposes are to a high extent similar due to socioeconomic and cultural similarities in the selected case-study cities. Since similar studies in this geographical context have not been undertaken so far, the study is exploratory and can be used for future, more in-depth studies on the context. However, based on the local socioeconomic situation, it is expected that some differences can be found affected by the size of the cities as well as the availability of different modes of transportation and the related prices.
3.2 Case-study cities
Cairo and Alexandria in Egypt and Beirut and Jounieh in Lebanon, as shown in Figures 1, 2, are the cities of the research chosen depending on several factors. Cairo is the capital of Egypt and the largest city, the same as Beirut in Lebanon. Alexandria is a linear coastal city in Egypt, such as Jounieh in Lebanon. Another main factor is the diversity of the residents of the selected cities and the different mode choices for trips in the respective cities. In Egypt, Cairo residents can use public buses/minibusses, microbuses, metro, or taxis to move around, whereas in Alexandria, the available modes are public buses/ minibusses, microbuses, trams, or taxis. In addition, the two Egyptian cities offer ride-sourcing and informal public transport such as Tuk-tuk. In Lebanon, the cities of Beirut and Jounieh, the transport choices are limited to microbuses, taxis, and ride-sourcing.
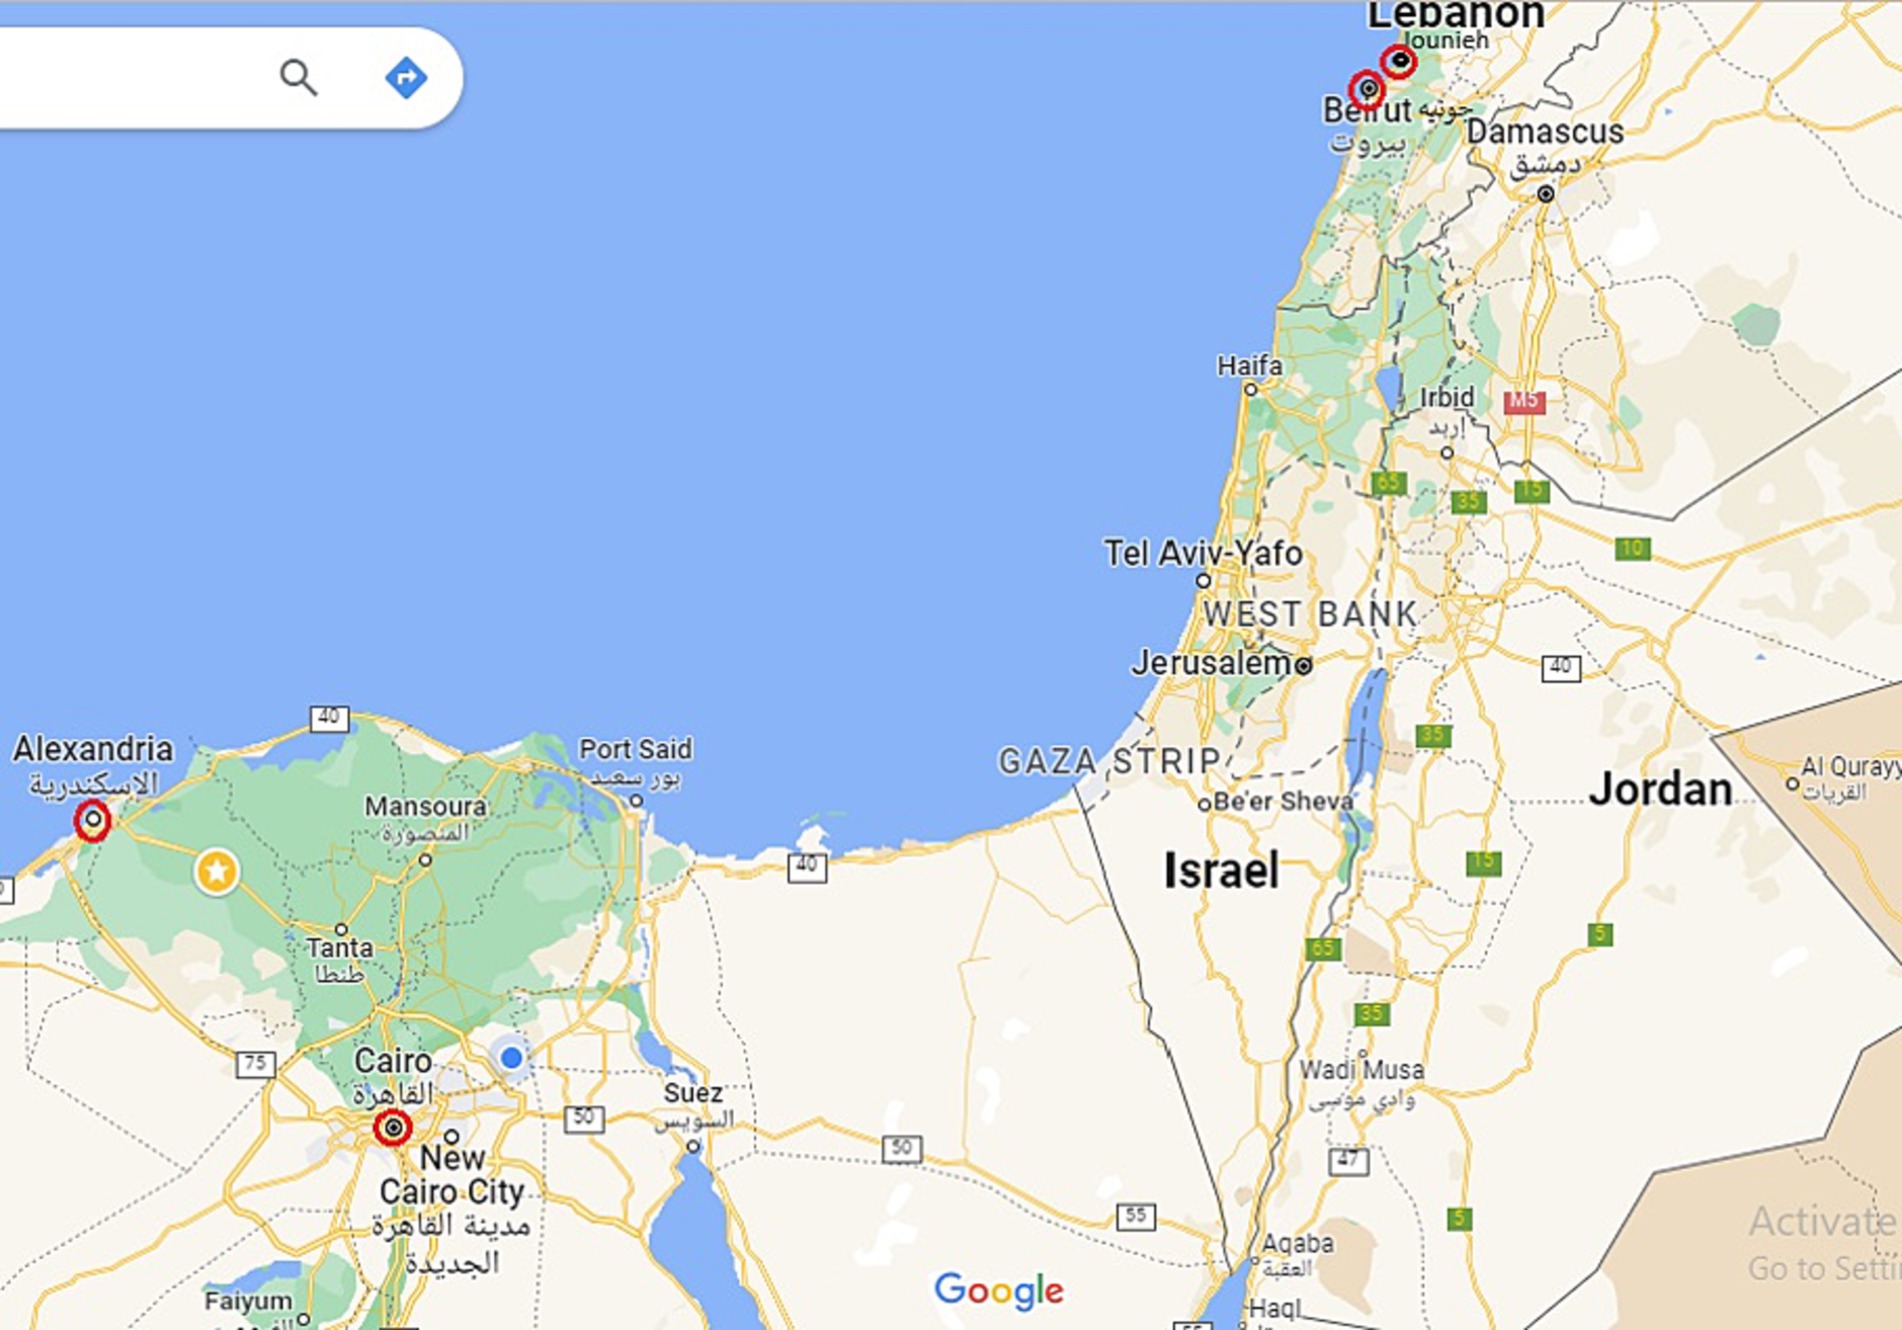
Figure 1. Case-study cities: Cairo, Alexandria, Beirut, Jounieh. Source: Google map editing by the authors.
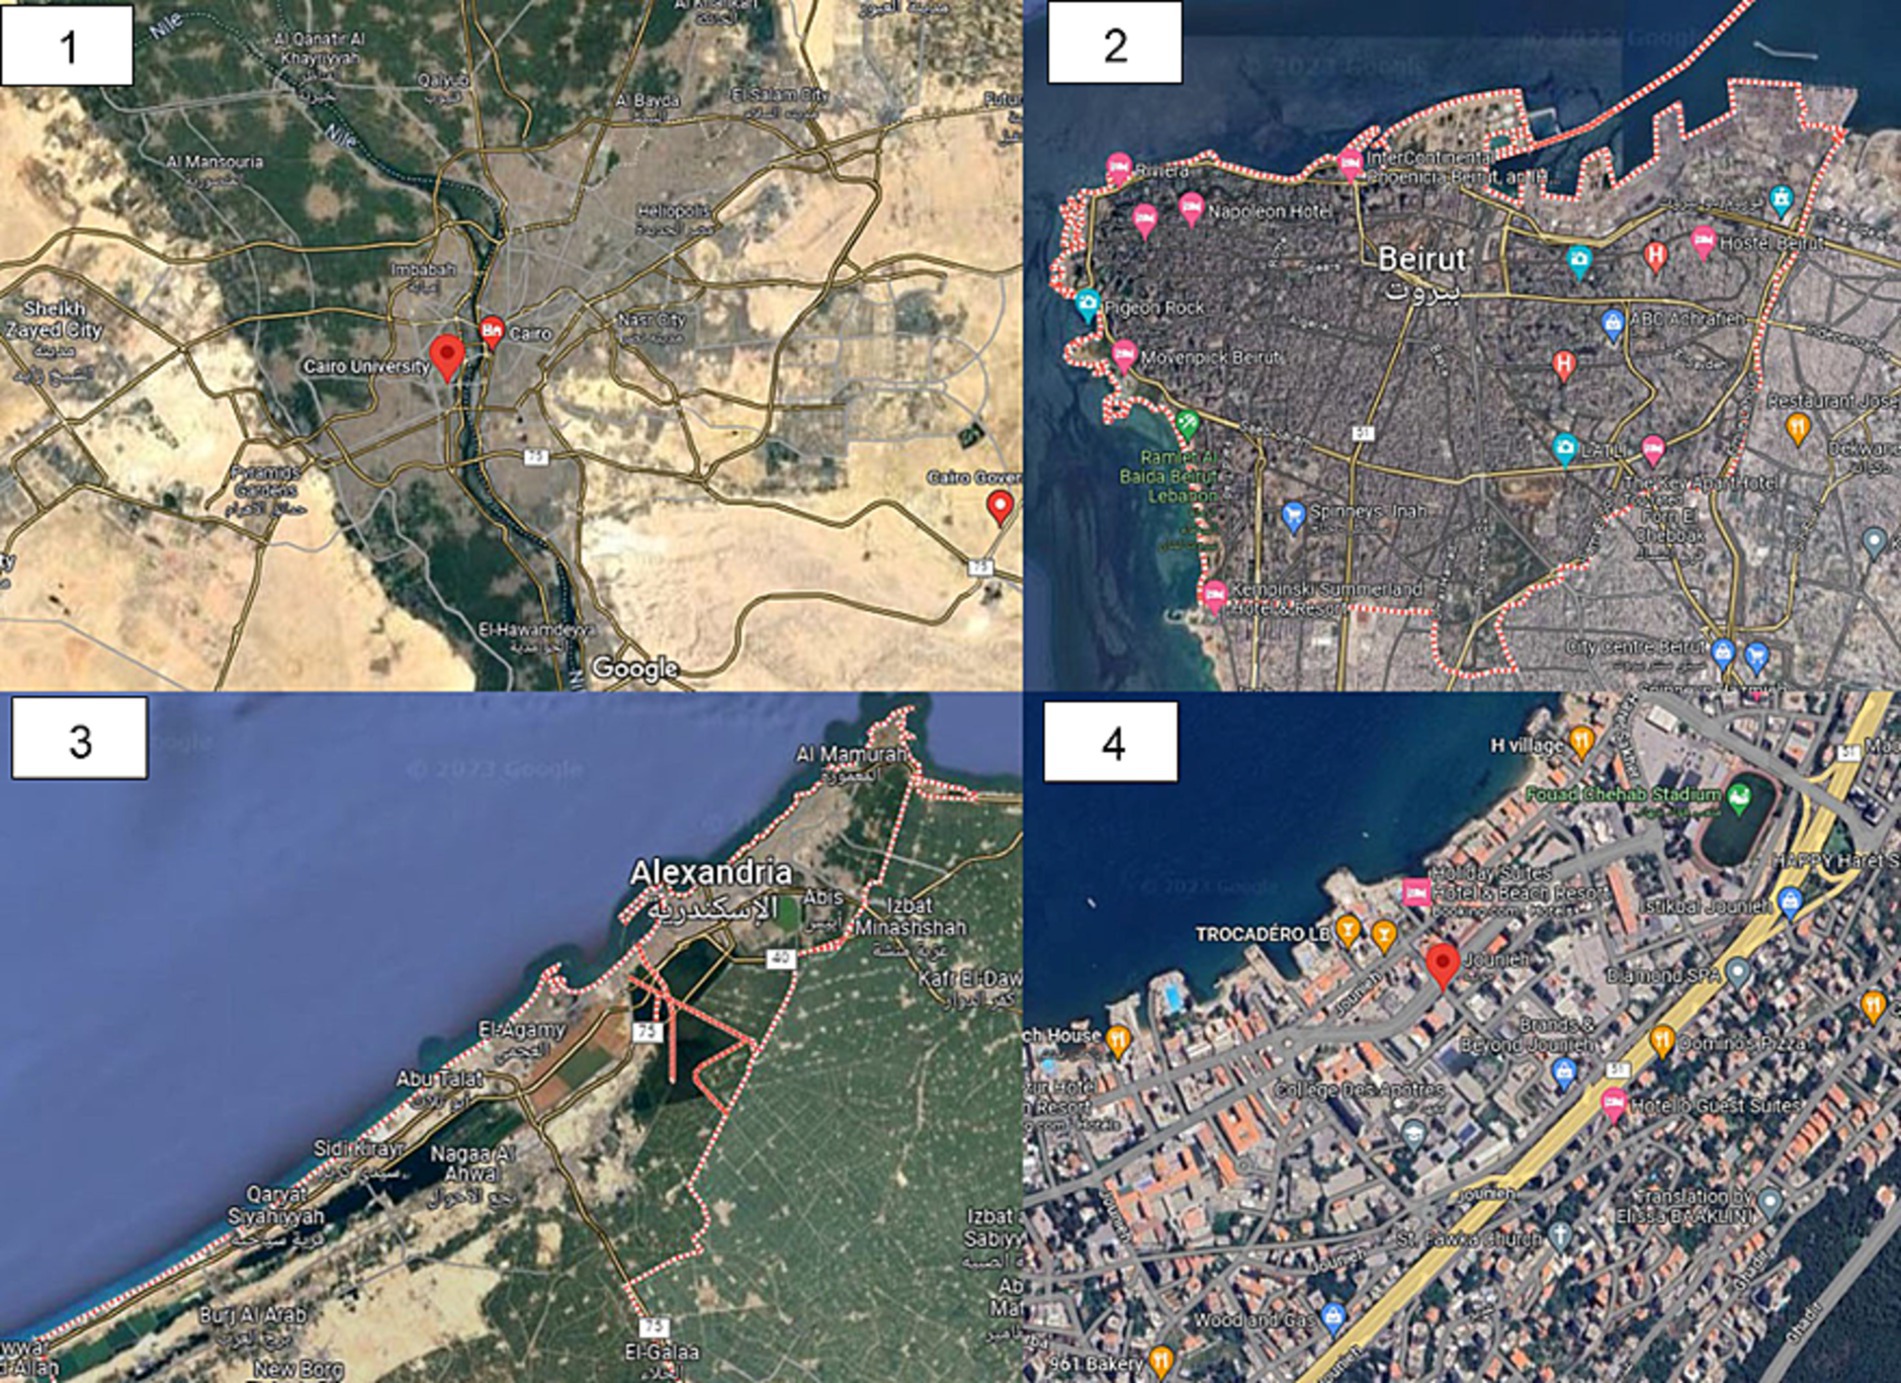
Figure 2. Case-study cities: 1: Cairo, Egypt; 2: Beirut, Lebanon; 3: Alexandria, Egypt; 4: Jounieh, Lebanon. Source: Google map editing by the authors.
The other important reason for selecting the case cities is their population [10.27 million in Cairo and 5.56 million in Alexandria (CAPMAS, 2023) 5.57 million in Beirut, and 150 thousand in Jounieh (UN-Habitat Lebanon, 2021)]. This makes them a solid basis for a general sample to maximize the accuracy of your research. City size (3084.67 sq. km and 2818.77 sq. km) (CAPMAS, 2023) (111.22 sq. km and 8.5 sq. km) (UN-Habitat Lebanon, 2021). Furthermore, these cities have the most complex transport networks, with official modes of transport (public cars, trams, railways, etc.), especially Cairo. Other reasons include geography, society, land use, and the influx of immigrants, with cities being the main destinations. By examining the different qualities of these cities, this study was conducted in these cities to gain a deeper understanding of the context in which smartphones are used for transportation purposes.
3.3 Data and variables
The data categories of this research were collected from a mobility quantitative survey designed and conducted within four prominent cities in Lebanon and Egypt. The survey was conducted first in Jounieh in Autumn 2021. The same data set was then collected simultaneously in Beirut and Cairo for another 3 months, starting from November 2022 till January 2023. The data for the city of Alexandria were collected during an interval of 6 months, from November 2022 to May 2023. In an attempt to capture different social/cultural and economic backgrounds, the neighborhoods selected in the mega and large dense cities of Cairo and Alexandria for this study encompass three main criteria. First, one is near the city center, which is compact or located near the historical core. Secondly, a semi-grid iron street network, and lastly, near the city boundaries with lower densities and incorporates grid-iron planning, prepared for car use.
These selection criteria led to a great diversity in the sample, as the study targeted. Additionally, the questionnaire was conducted in different neighborhoods in the four studied cities to ensure a broader diversity of respondents. For example, in Cairo, the study chose three neighborhoods, one of which is Hadayek Al-Qubba, a high-density neighborhood with a medium standard of living and close to the historical heart of the capital. Another one is the 6th of October, characterized by having the highest standard of living and relatively lower population density. The last is in New Cairo, which is the highest in terms of standard of living and the least populated. The three areas are characterized by a diverse road network, allowing us to investigate the difference in smartphone usage according to the different contexts.
The survey results were obtained from a total of 3,285 face-to-face interviews, 938 questionnaire interviews were conducted in Jounieh, 537 in Beirut, 1,193 in Cairo, and 617 in Alexandria. The margin of error of sample size collected for Jounieh and Beirut were 4 and 5% respectively, while Cairo and Alexandria’s margins of error were 2.84 and 3.95% respectively, according to the overall adult population in 2022. The estimated population of Jounieh and Beirut in 2022 was 94,000 and 1,870,000 respectively, and the adult population of Jounieh was around 72,000 and Beirut 1,444,500 (Zhujiworld, 2023). Furthermore, the population of Cairo and Alexandria Governorates were 10,100,166, and 5,469,480, respectively (CAPMAS, 2023). The adult population was 4,720,227 for Cairo, and 2,452,602 for Alexandria according to the 2017 census (CAPMAS, 2023).
The collected data were based on a questionnaire which comprised 39 questions. These questions were divided into 6 sections that covered the following aspects: sociodemographic and household profiles, mobility habits, commuting habits and preferences, perceptions of public transportation and ridesharing, and housing. In addition to the gender, age, employment status, education level, and car ownership number from the sociodemographic section, some of the questions that were employed in this manuscript were how many commute and non-commute trips you made during the past 7 days. Questions related to commuters’ satisfaction and perception, for instance: If you commute, how satisfied are you with your commuting; and questions on perception towards the ease and performance of using ride-sourcing applications, and perceived security while commuting in public transport. Questions on satisfaction and perception were answered using a numerical scale from 0 to 100, in which 0 is the worst and 100 is the best.
The overall variables generated from this questionnaire are 39 variables, of which 9 questions focused on commuting determinants, and 3 questions on the perception of ride-sourcing applications. The data exploration phase initiated with smartphones for transport purposes as the dependent variable along with the other 11 independent variables. Some of the variables (household size, household car ownership, perceived risk of using ride-sourcing, evaluation of the quality of buses and minibuses, and public transport use) were eliminated during an iteration process in which the other six variables were considered for this study, which will be further elaborated in the analysis section. The variables were quantified according to the methods elaborated in Table 1. Tables 2, 3 summarize the descriptive statistics of continuous variables in the overall sample and in the city-wide sub-samples, respectively. Table 4 shows the frequencies of the categorical and binary data. Finally, Table 5 illustrates the frequencies of responses about the variable in the investigation.
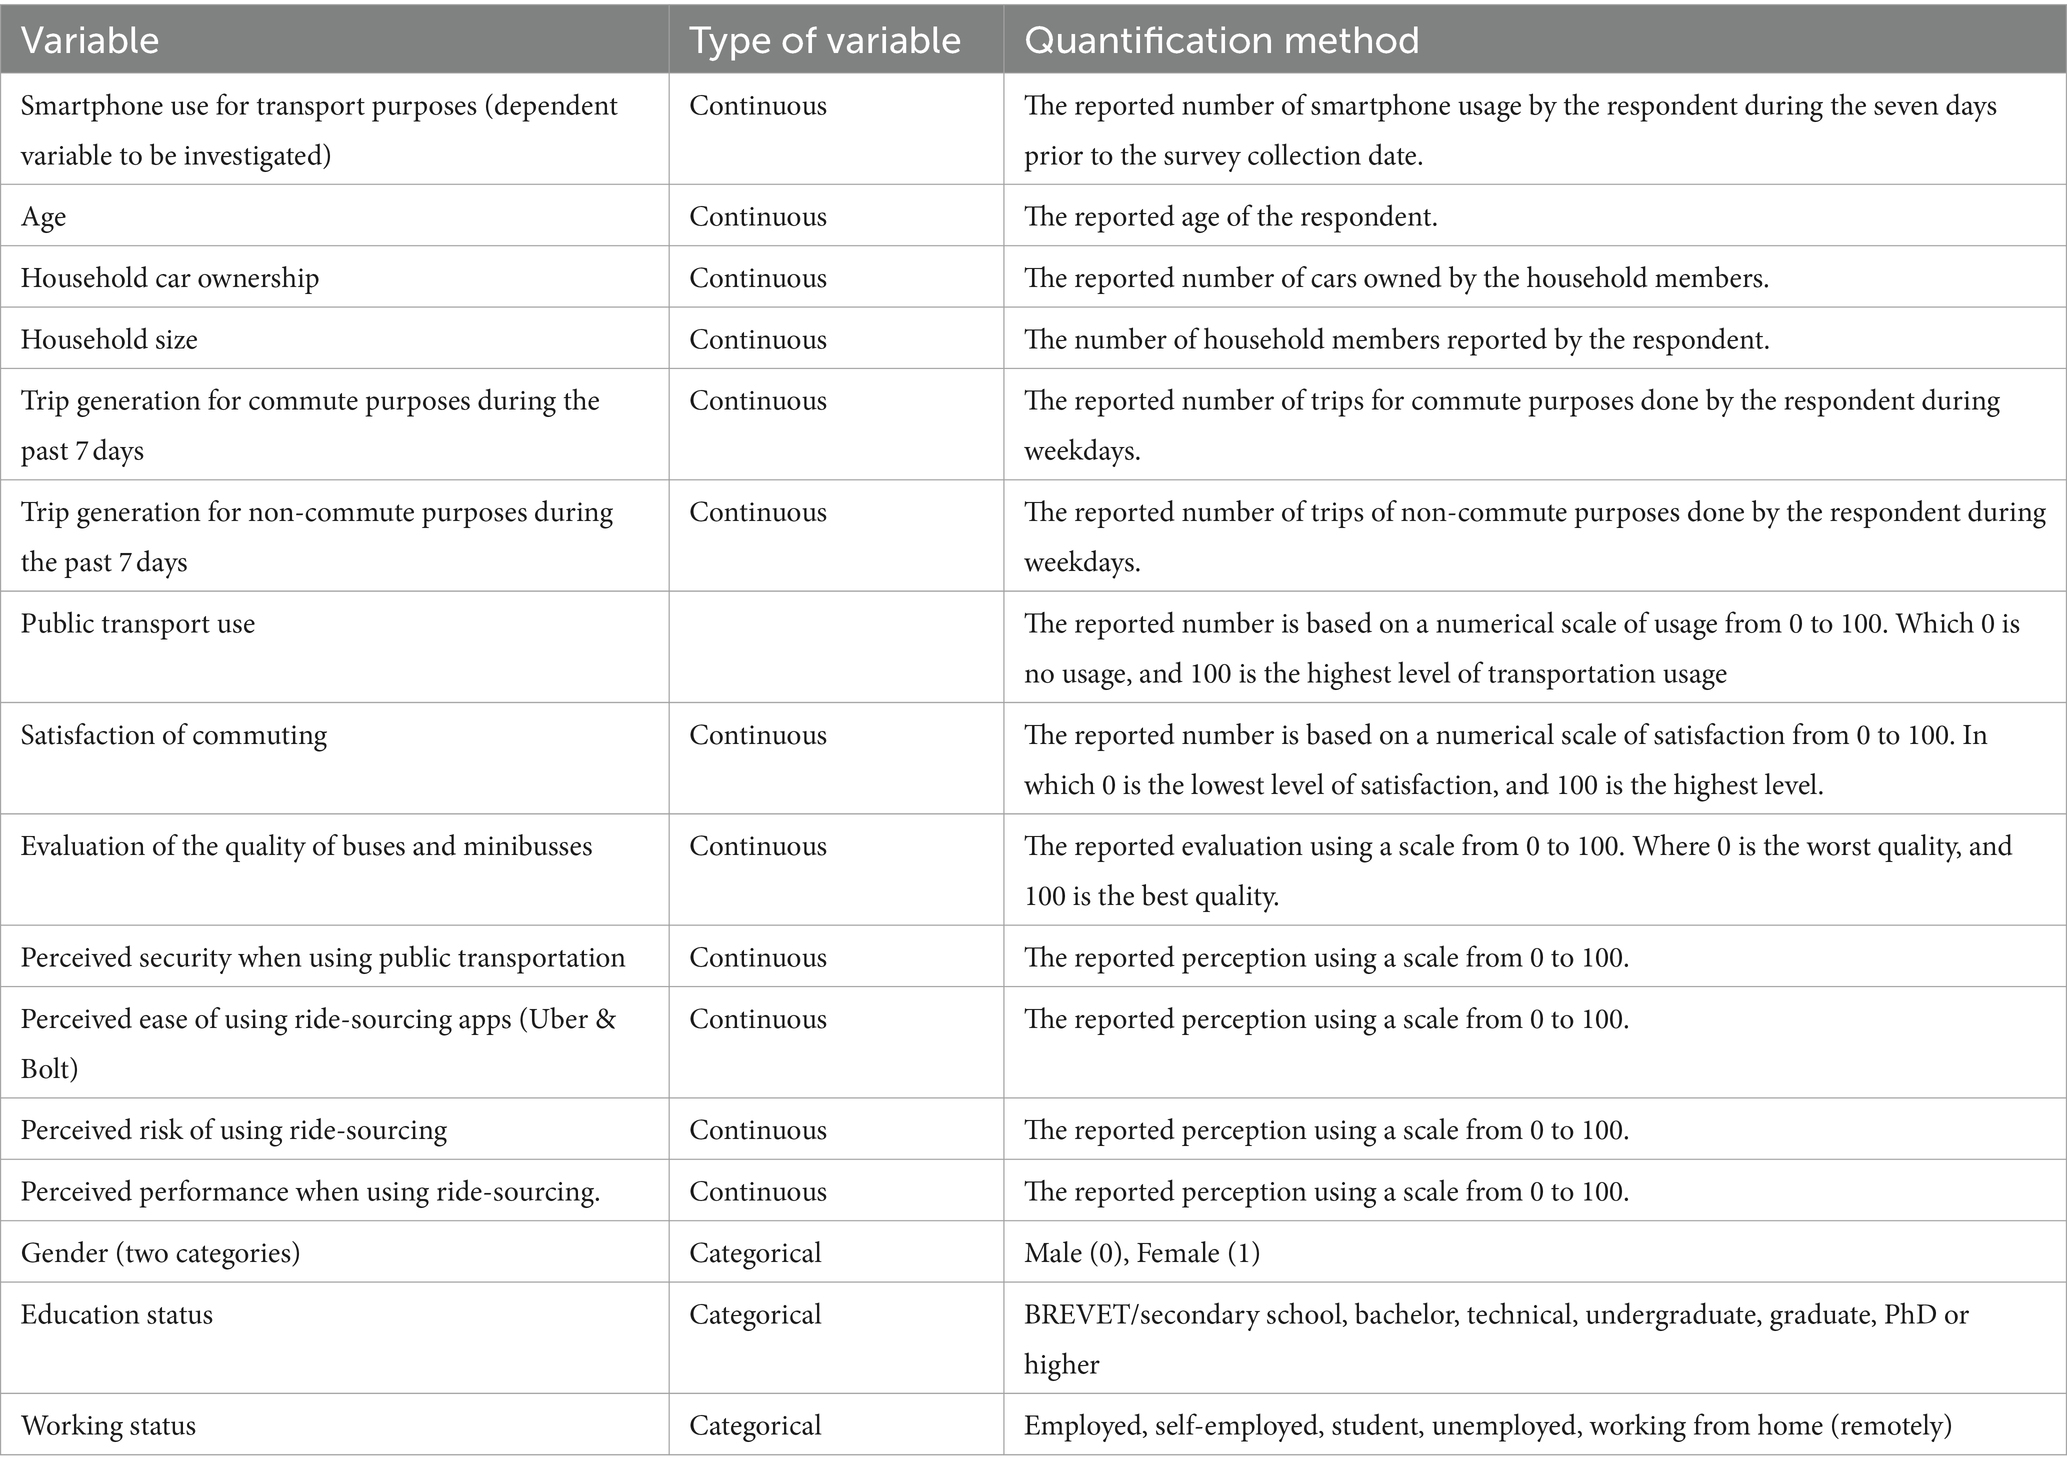
Table 1. The variables used in the study.
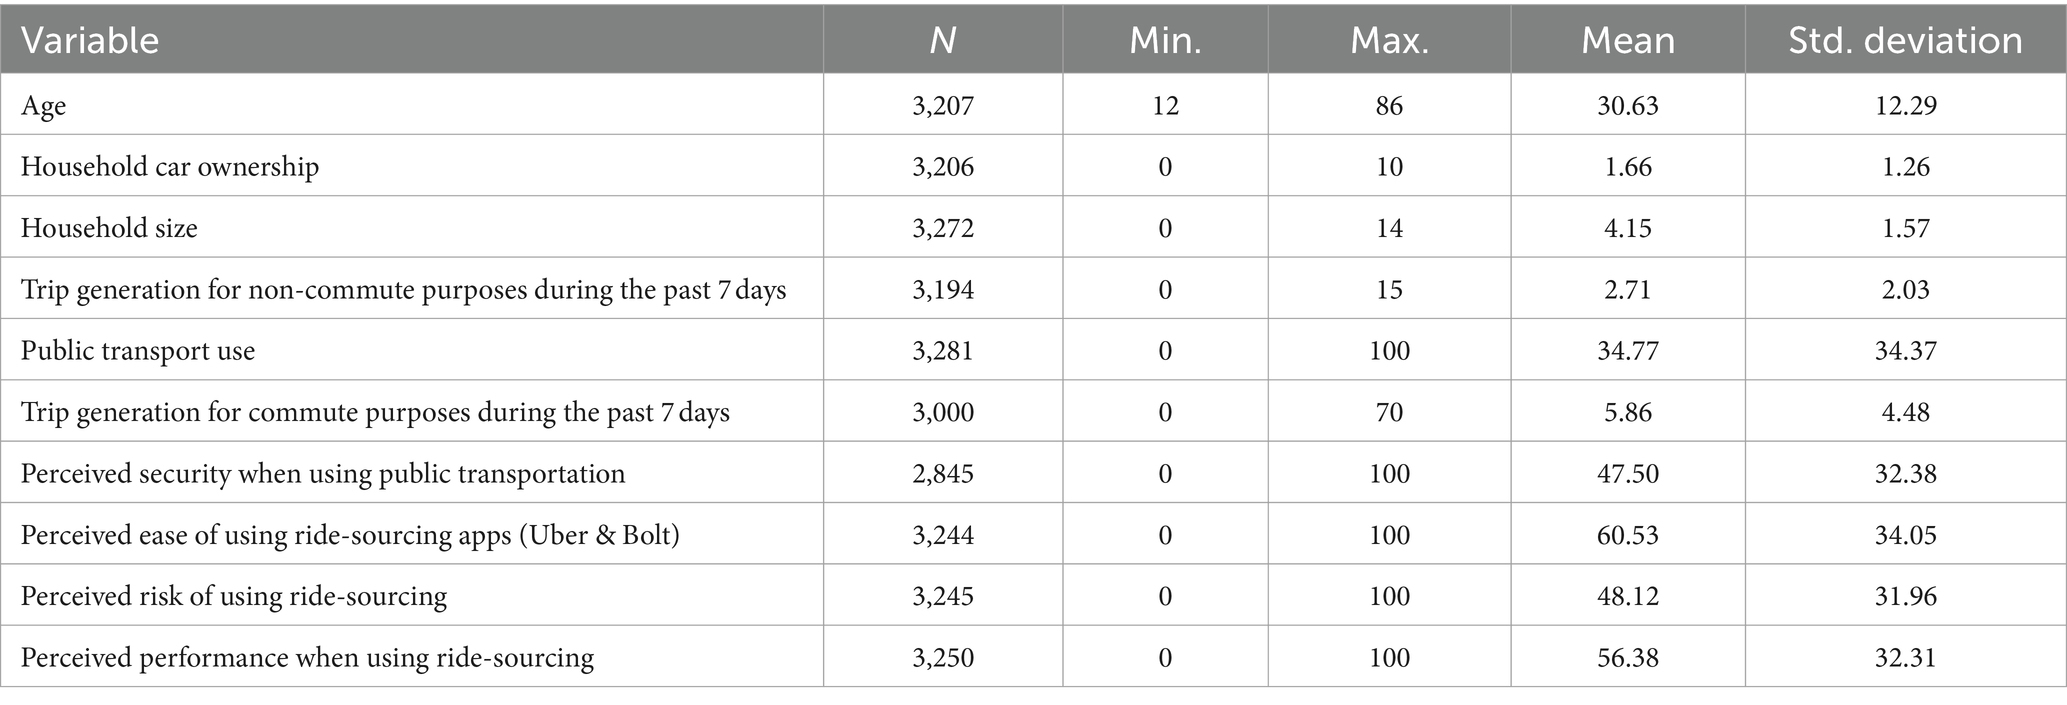
Table 2. The descriptive statistics of the continuous variables used in the study.
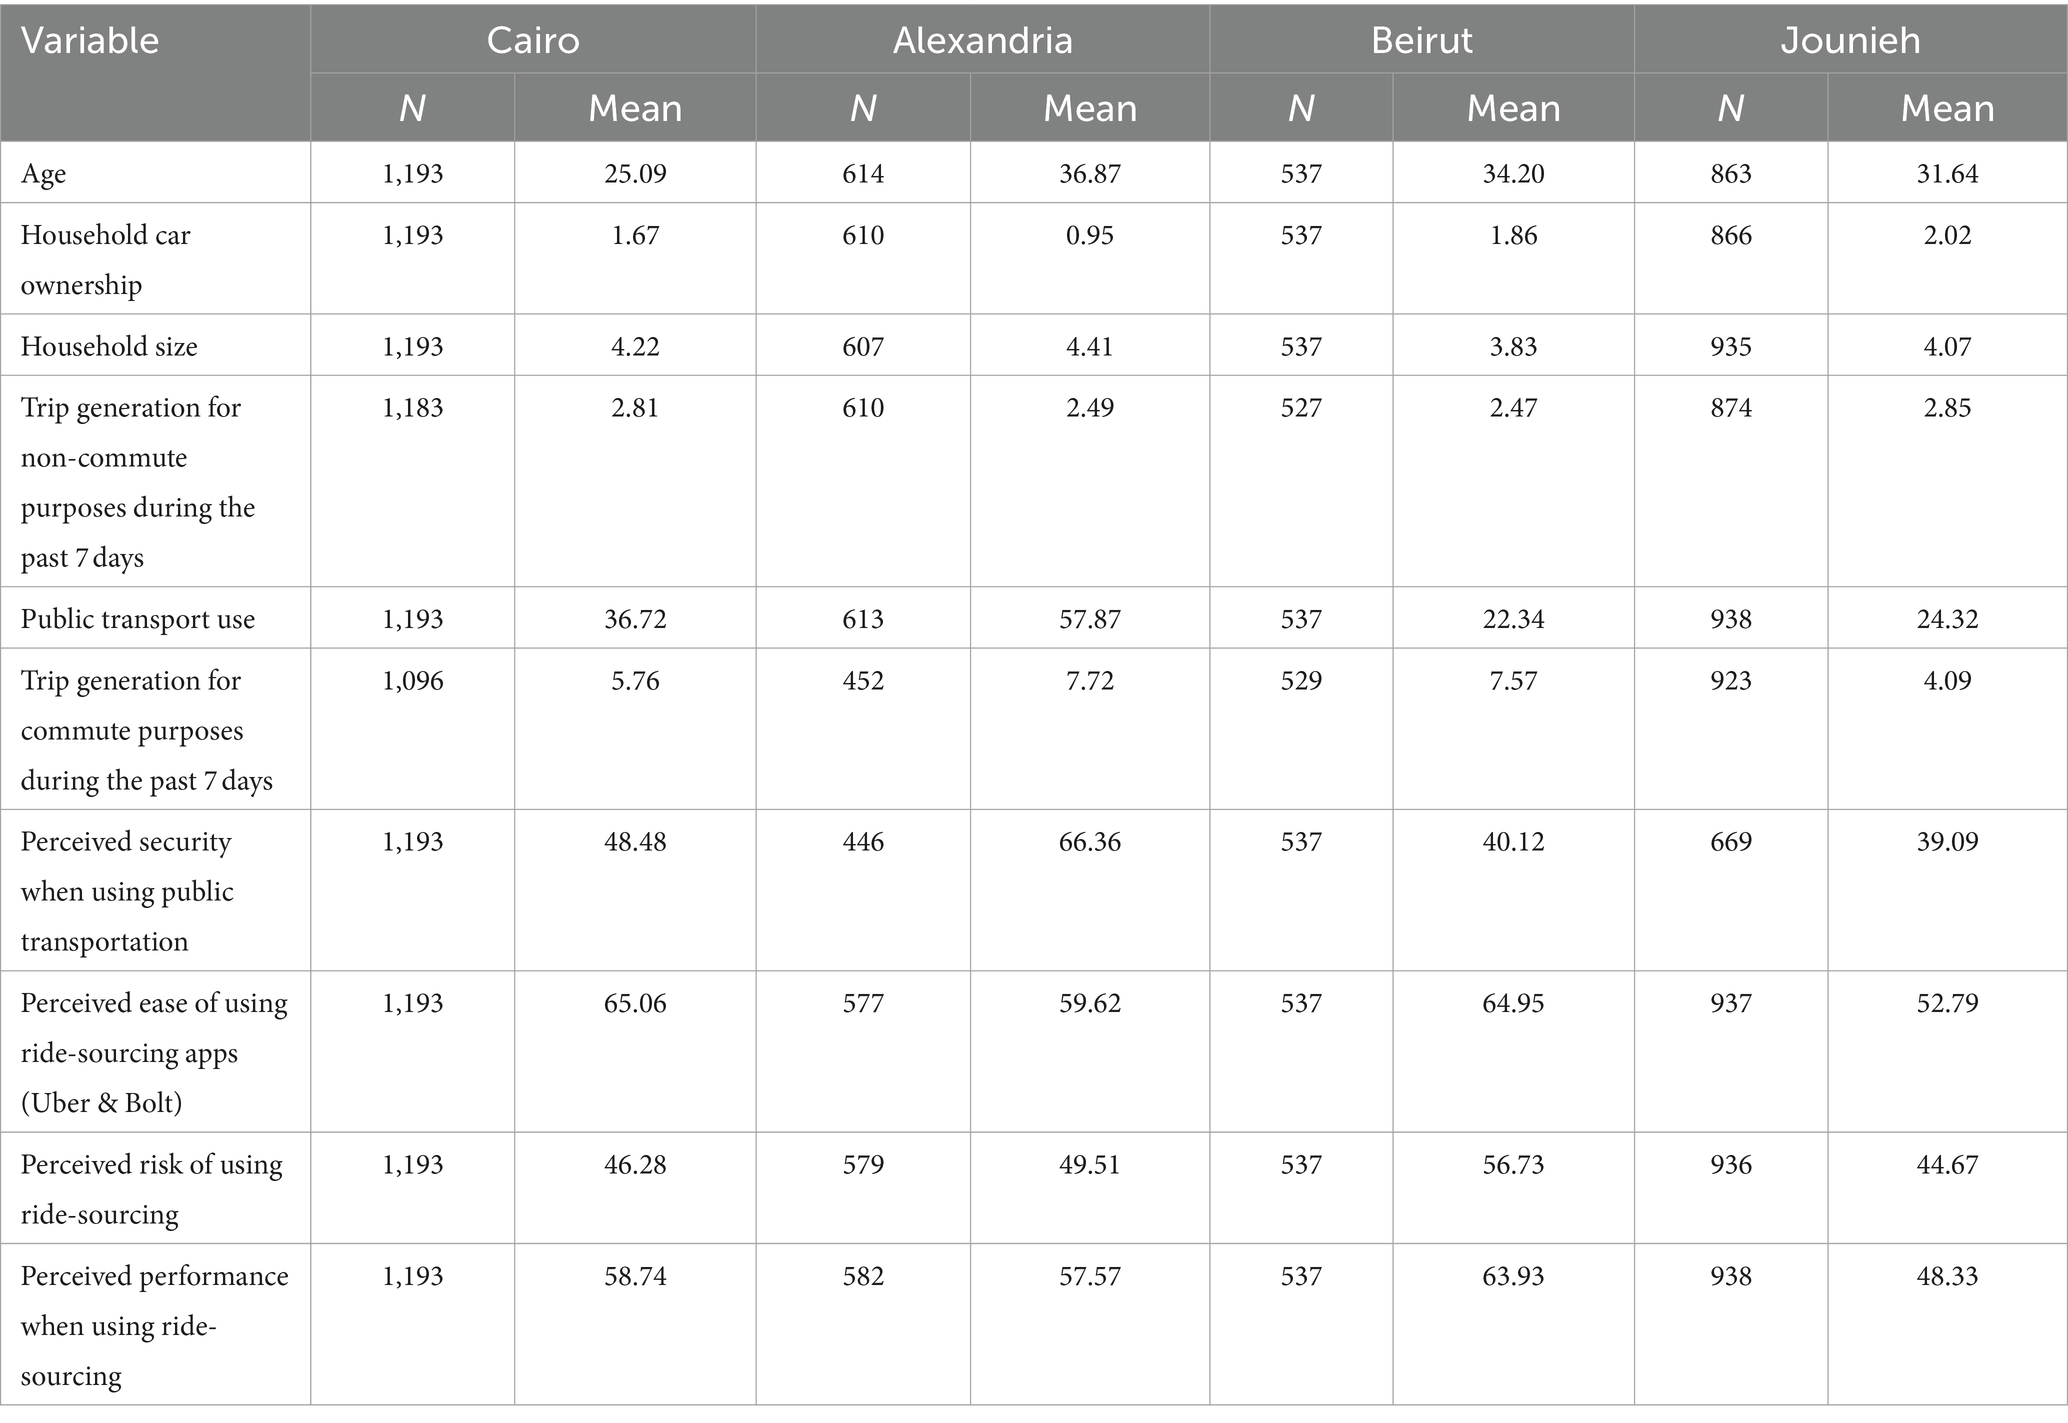
Table 3. The descriptive statistics of the continuous variables in each of the four cities.
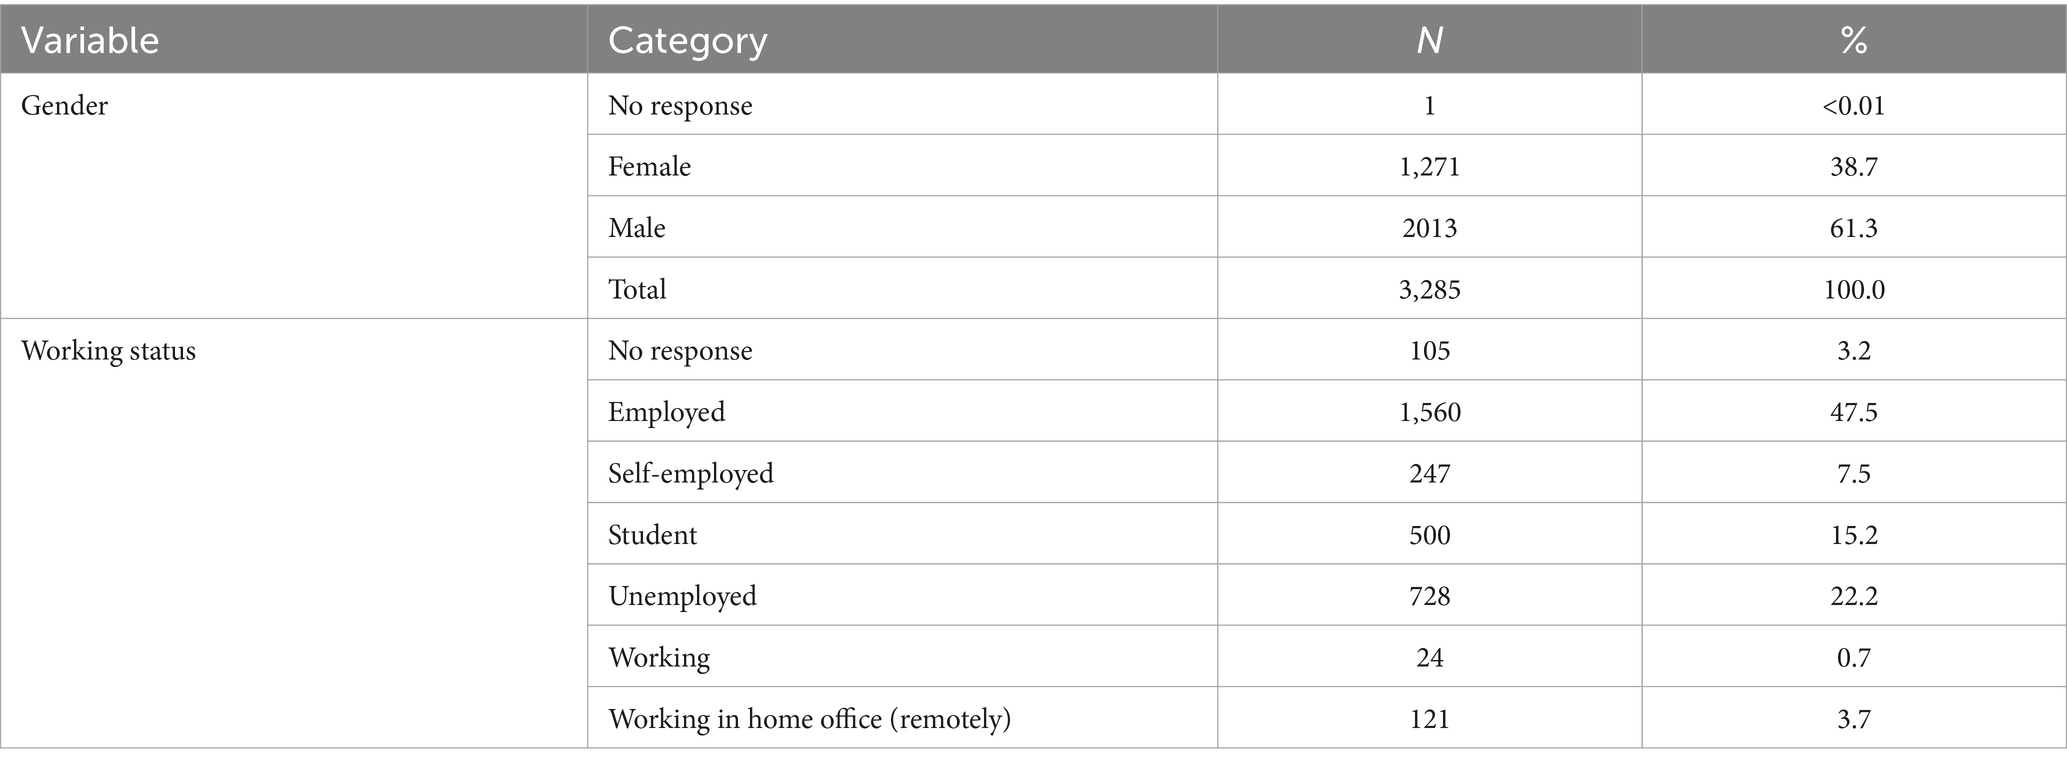
Table 4. The frequencies of the categorical variables used in the overall sample.
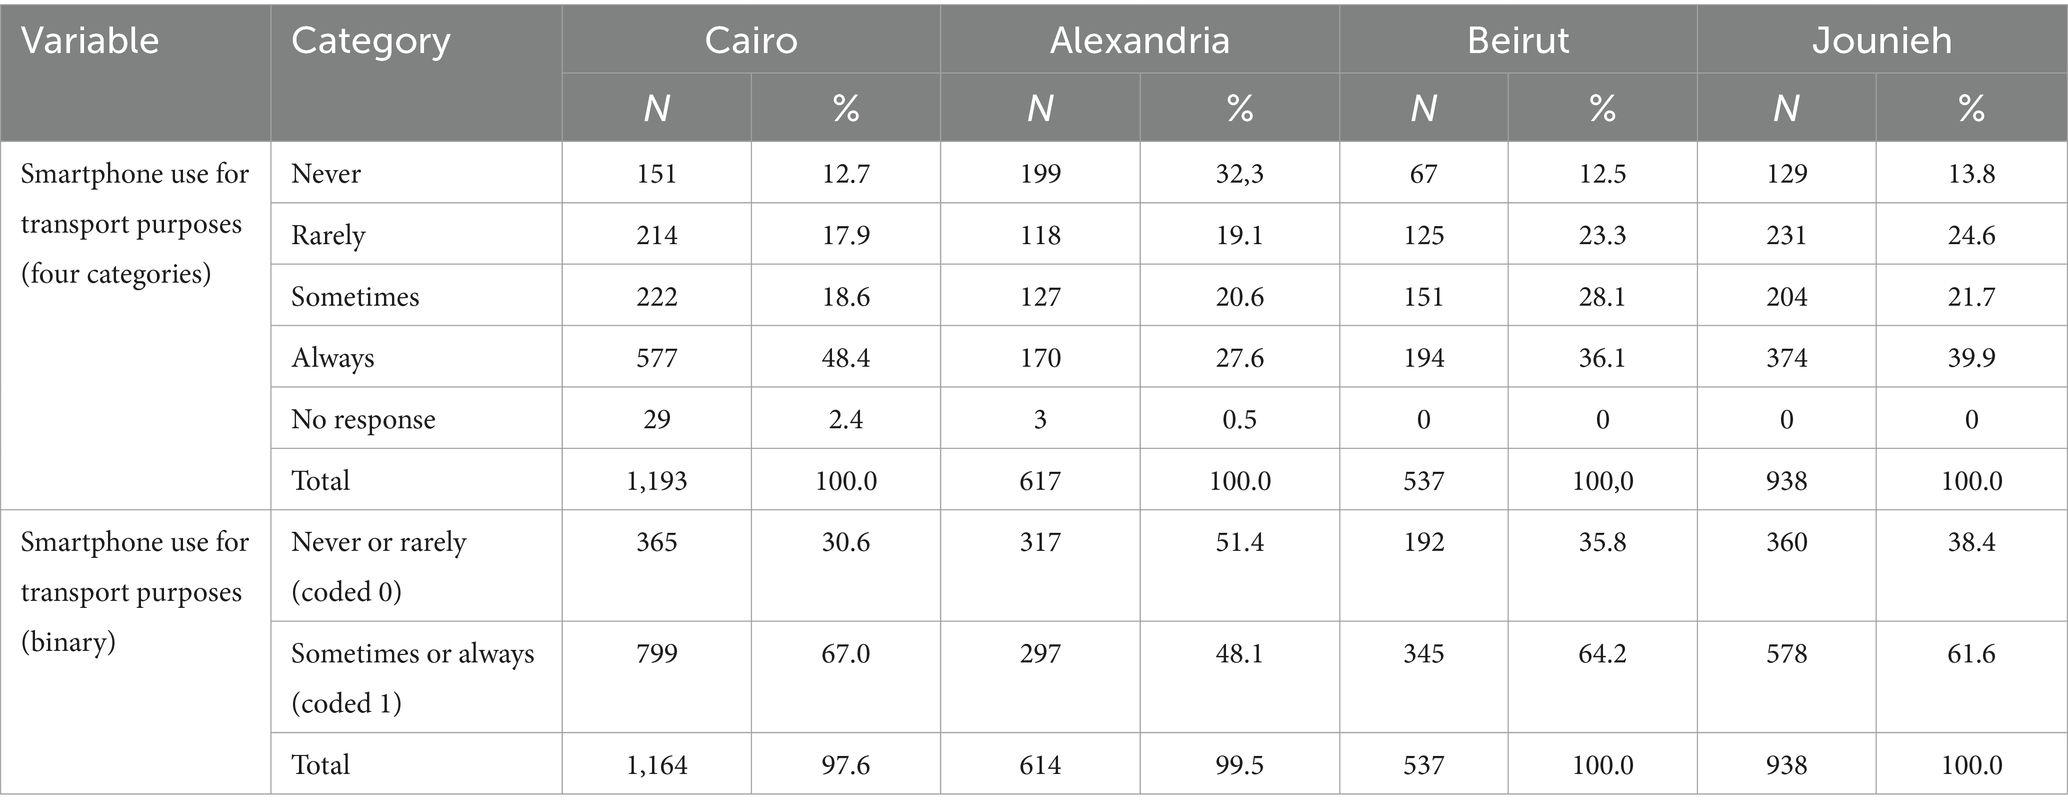
Table 5. The frequencies of smartphone use in the overall sample and the four cities.
3.4 Analysis methods
The research depends on two analysis methods to answer its research questions. The chi-square test of independence was applied to the tabular data to examine if the levels of smartphone use for transportation purposes vary considerably across cities in Egypt and Lebanon. For interpreting the findings, p-values less than 0.05 were considered significant, and values between 0.05 and 0.10 were taken as marginally significant. Secondly, Binary logistic regression modelling was applied to study the correlations and differences between smartphone use for transportation purposes on two levels, the regional and city levels. Binary logistic regression models the relationship between a set of categorical and continuous independent variables (i.e., age, trip generation for non-commute purposes during the past 7 days, trip generation for commute purposes during the past 7 days, perceived ease of using ride-sourcing apps (Uber & Bolt), perceived performance when using ride-sourcing, perceived security when using public transportation, education status, gender) and a binary dependent variable (i.e., smartphone usage). After six iterations, the best model fit has resulted. The five explanatory variables that are not statistically significant were household car ownership, perceived risk of using ride-sourcing, household size, evaluation of the quality of buses and minibuses, and public transportation use. The procedure of these iterations was to select the insignificant independent variables in the models based on their p-values starting from the highest values. After each elimination, the quality of the p-values of the remaining independent variables improved. The elimination was continued all through the lower p-values continuing to nearly 0.1. The iterations were conducted in a way that the value of Nagelkerke R2 does not drop greatly. As a result, the highest number of significant and the highest Negelkerke R2 were resulted. For testing the validity of the models, the Omnibus test was applied, whereas p-values of less than 0.05 indicated a valid model fit.
For answering the third research question related to the differences in the determinants of smartphone use in different case-study cities, the same structure resulted from the overall sample (explained above) was applied.
4 Findings
4.1 Difference between smartphone use for transport in the MENA region
Table 6 summarizes the frequencies of the responses to smartphone usage for transport purposes as the dependent variable. The question regarding smartphone usage frequency was answered by 3,253 respondents in the four case-study cities; 40% of them always use the smartphone and 21.4% sometimes, whereas 20.9% rarely use it and 16.6% never. Among the four studied cities, Cairo marked the highest percentage of smartphone dependency with 48.4%, while Alexandria was the lowest city with 27.6%. That is confirmed by the descriptive findings showing that around 32% of respondents in Alexandria have declared that they never use smartphones for mobility and 19% rarely. While Alexandria recorded the lowest usage among the two studied cities in the Egyptian context, Jounieh is the least Lebanese city; around 25% of travelers rarely use smartphones, whereas Beirut always and sometimes uses smartphones by percentages of 36 and 28, respectively. Thus, the capitals of Egypt and Lebanon have a high degree of dependency on smartphone use for transport purposes compared to the other two cities.
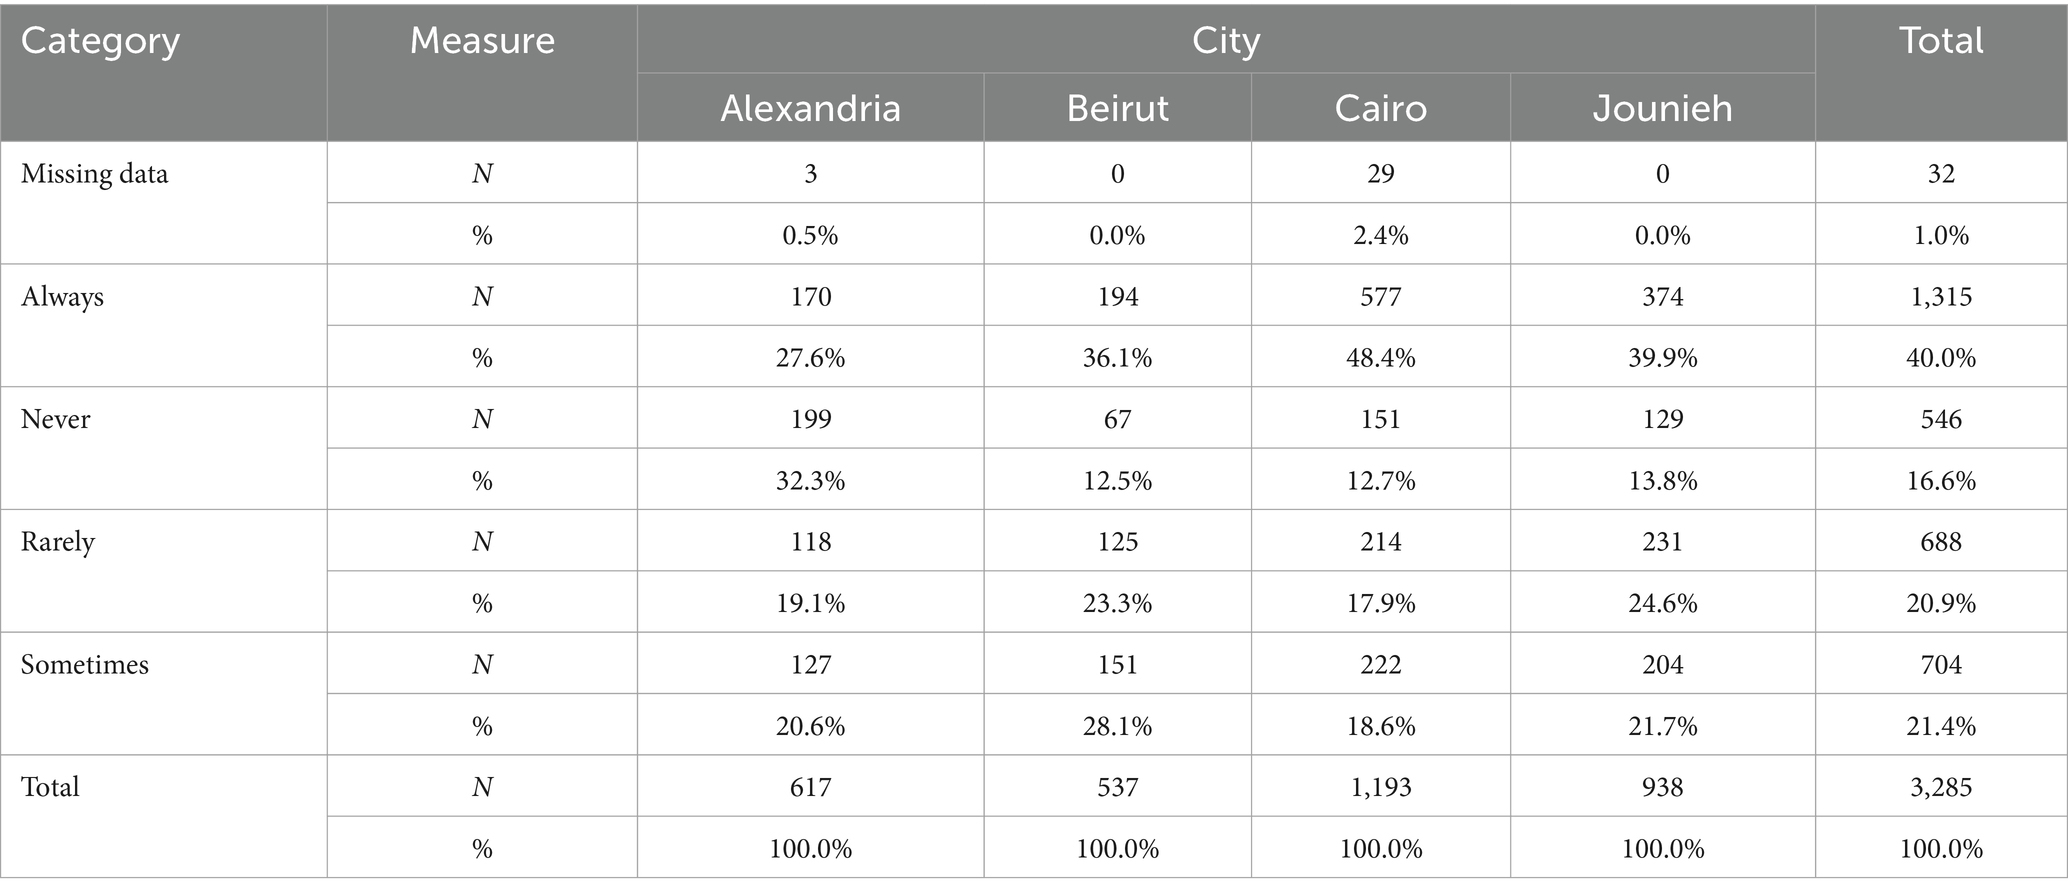
Table 6. The frequencies of smartphone use for transport purposes in Cairo, Alexandria, Beirut, and Jounieh.
Moreover, there is a highly significant difference between the smartphone use levels for transportation purposes among the four case-study cities (p ≤ 0.001), as illustrated in Table 7. Since we have four cities and five categories, then the degrees of freedom (df) equals (4–1) * (5–1) =12, and as the p-value is less than 0.05, the Chi-square test of independence shows that the two variables are related. In other words, when the city changes, the level of smartphone use will change.
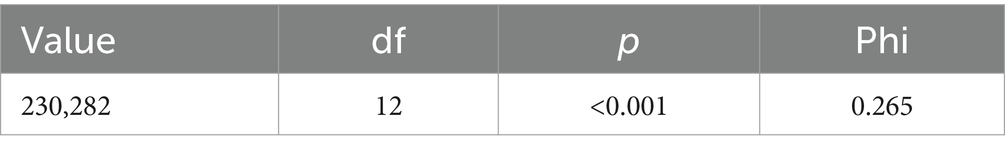
Table 7. Chi-square test of independence for testing the differences in smartphone use in the four case-study cities.
4.2 Determinants of smartphone use for transport purposes in the region
The results of the Binary logistic regression model show that six independent variables of age, trip generation for non-commute purposes during the past 7 days, perceived ease of using ride-sourcing apps (Uber & Bolt), perceived security when using public transportation, as well as education status, and gender or at least one of their categories are significantly correlated with smartphone use (Table 8). Whereas two variables of trip generation for commute purposes during the past 7 days and perceived performance when using ride-sourcing are marginally significant. Five categories in the education variable are significantly correlated with smartphone use, indicating that if people have studied up to brevet, graduation, middle, and secondary or technical school levels, then they are more likely not to use smartphones for transportation purposes. However, master’s and Ph.D. holders, as well as people who earned bachelor’s degrees, are more likely to use smartphones compared to undergraduates. The model reveals that for every year of age increase, the odds of using smartphones in transportation decrease by 4%. Similarly, the usage of smartphones has 0.7% less odds as the perception of security increases when using public transportation. This finding confirms the inverse relationship between smartphone usage and age and security. Moreover, the greater increase in the three variables of trip generation for commute and non-commute purposes during the past 7 days, the apparent simplicity of utilizing ride-sourcing applications, and performance as perceived when utilizing ride-sourcing, the more likely it is that people will use smartphones for transport. The model also displays that men and women have different patterns in using smartphones. Women have 77% higher odds of using smartphones compared to men. The Omnibus test confirms the validity of the model (p ≤ 0.001). The Nagelkerke Pseudo R2 value is 24%, indicating that the model explains 24% of the variances of the dependent variable (smartphone use for transportation).
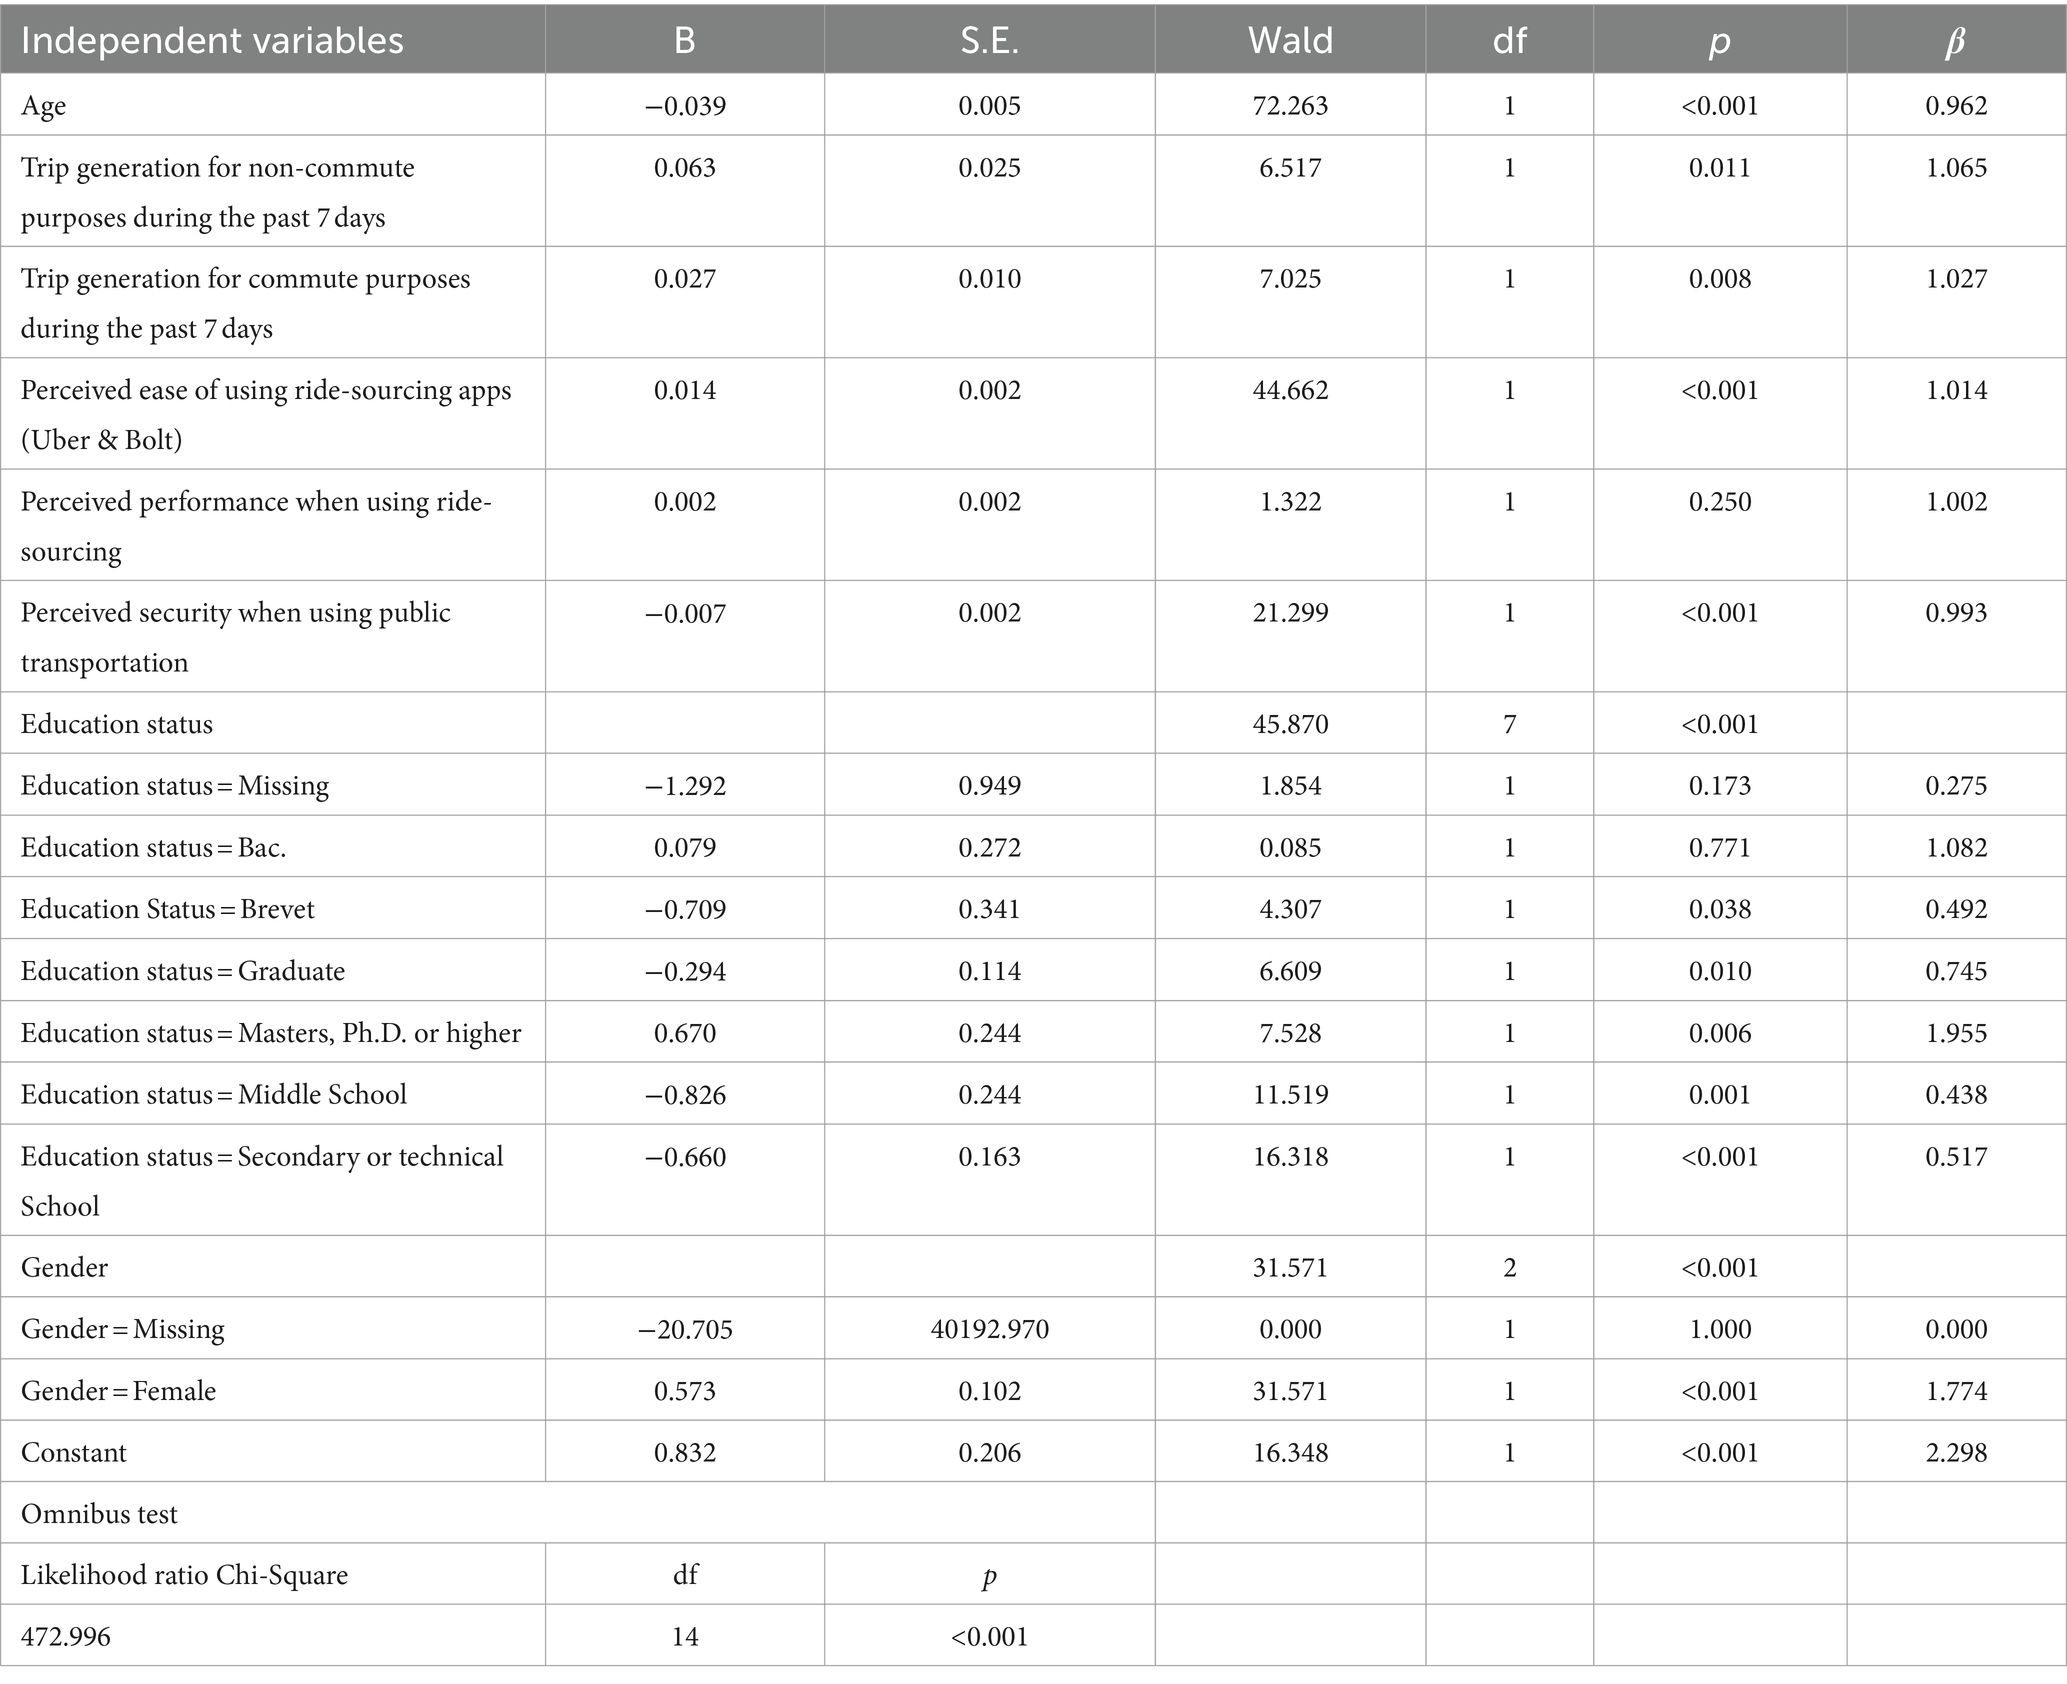
Table 8. Binary logistic regression model for smartphone uses for transportation purposes (coding: 0: never or rarely; 1: sometimes or always) (Nagelkerke R2 = 24%).
4.3 Determinants of smartphone use for transport purposes at the city level
In studying the four case-study cities, the Binary logistic models show that age and the apparent simplicity of utilizing ride-sourcing applications are significantly correlated with smartphone usage. For every year of age increase, the smartphones for mobility have 4, 4.5, 2.6, and 6% less odds of usage in Cairo, Alexandria, Beirut, and Jounieh respectively, on the contrary, as the apparent simplicity of utilizing ride-sourcing applications increases, the more likely people use smartphones (Table 9). Findings for Trip generation for commute and non-commute purposes during the past 7 days reveal that non-commute purposes are marginally significant among all four cities except Alexandria, where the more it increases, the more probable people use smartphones whereas commute purposes are only significant in Alexandria and Beirut, however, as it increases in Alexandria, smartphone usage is more likely to decrease, unlike Beirut. The performance as perceived when utilizing ride-sourcing is marginally significant only in Cairo, whereas the perception of security when using public transportation is only significant in Beirut. Remarkably, gender is significant in all three cities except Beirut. In Alexandria, women have three times higher odds of using smartphones compared to men.
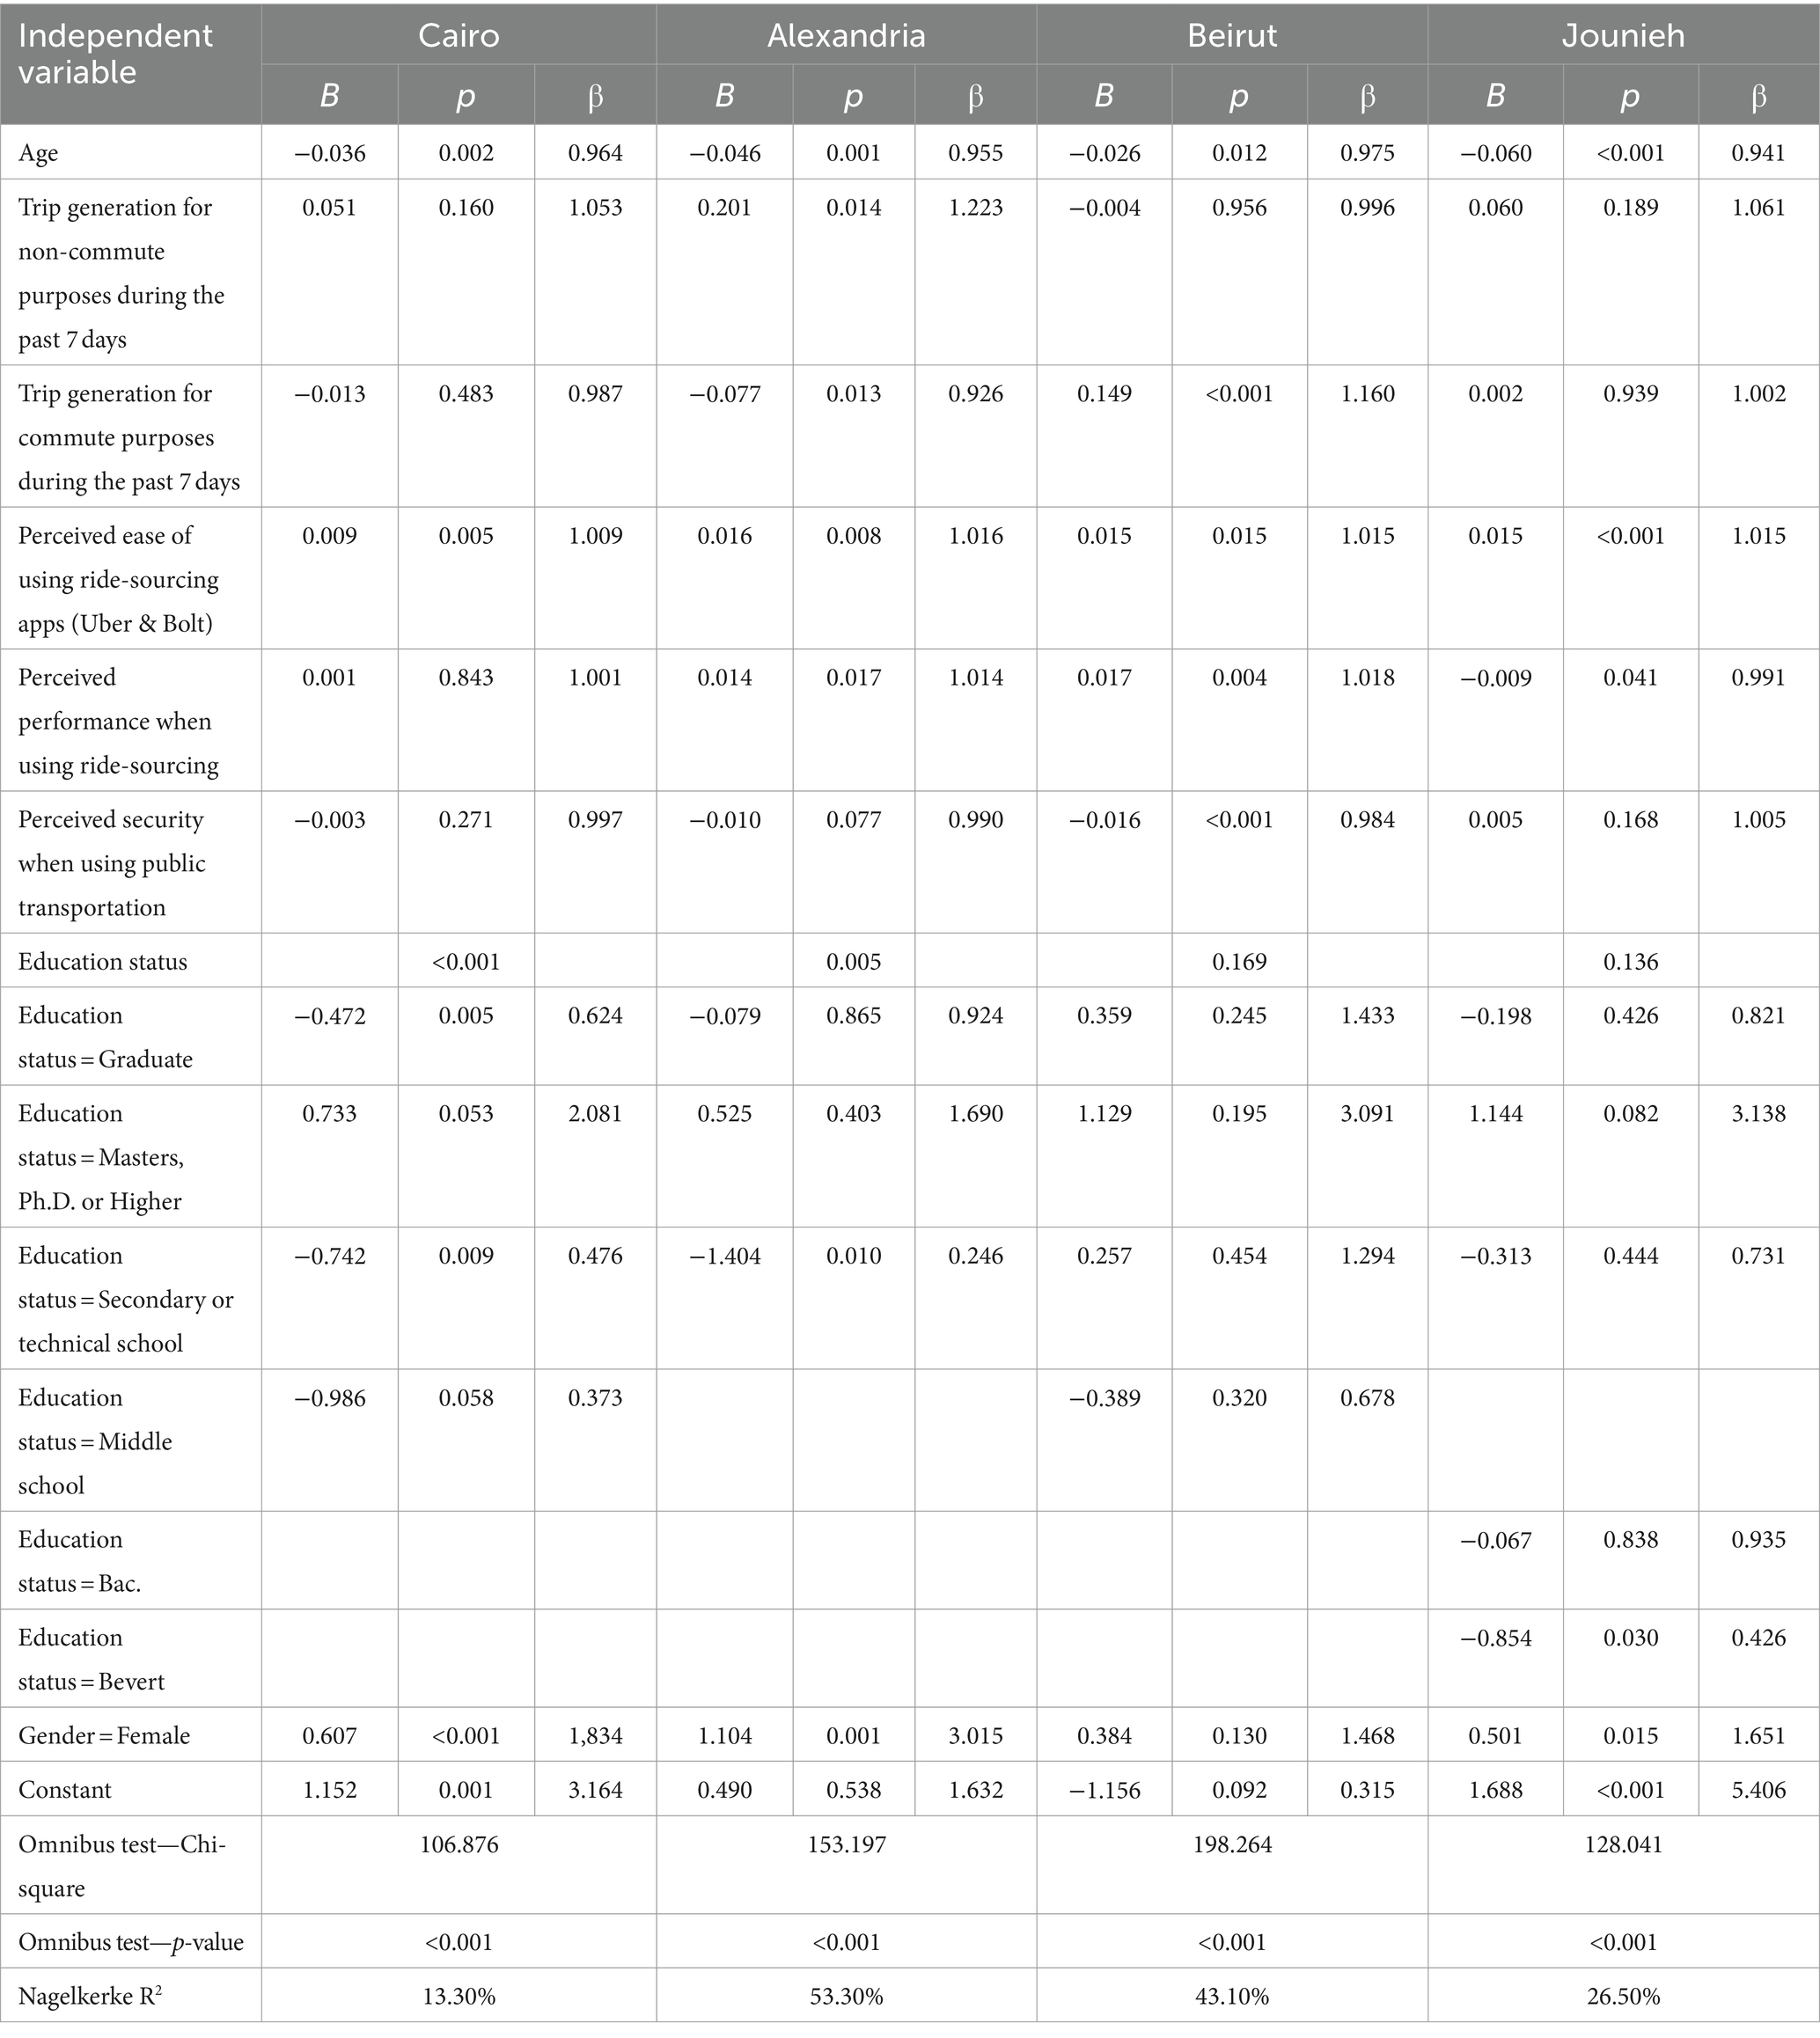
Table 9. Binary logistic models for smartphone use for transportation purposes in four case-study cities.
Among the six categories in the education variable, Beirut in Jounieh is the only significant variable in smartphone use, and in Alexandria, Secondary or technical school is the only significant one, whereas, in Cairo Graduates, master’s and Ph.D. holders or Higher, and secondary or technical school are significantly correlated with smartphones usage. Importantly, in Beirut, all the education variables are marginally significant with smartphone use. In the four studied cities, people holding master’s and Ph.D. or Higher have more than two times higher odds of depending on smartphones for transport compared to undergraduates except Alexandria, for which the odds are 1.7 times higher. Also, in Beirut, graduates have 43% more odds of using smartphones compared with undergraduates, whereas students at secondary or technical schools compared to undergraduates have 29% more odds of using smartphones. Additionally, the results of the model validity test are illustrated in Table 9. The omnibus test result indicated the validity of the model (p ≤ 0.001). The Nagelkerke R2 is 26.50%, indicating that 26.50% of the variation can be predicted by the model (Table 9).
5 Discussion
The use of smartphones for daily life errands and activities was emphasized greatly during the COVID-19 pandemic. Various people were directed to use smartphone applications to reach services and acquire basic needs, especially with accessibility being greatly affected (Liu et al., 2021). Much research on transportation equality focuses on determining the spatial distribution of access to activities and opportunities (e.g., Rietveld, 2000; Liu et al., 2018; Chang et al., 2019). Academics, legislators, and transportation practitioners were triggered by new mobility services, many of which are smartphone-based in the forms of studying (and, in many cases, advocating) the adoption of these new services, such as dockless bike-sharing, car-sharing, and Mobility-as-a-Service (MaaS) (e.g., Alonso-González et al., 2020; Link et al., 2020), owing to a belief that such services can effectively shift demand away from private cars.
Going through the study and recognizing how highly significant smartphone use is for transportation purposes, it is also recognized how these data align with societal norms and economies of each city. The answers collected in the questionnaire regarding smartphone use frequency in the four cities emphasized how Cairo and Beirut have a high degree of dependency on smartphone use for transport purposes compared to Alexandria and Jounieh. Cairo is a megacity containing a dense formal and informal network of transportation modes. That makes traveling through Cairo usually a long trip, costly and time-consuming. Long trips require comfort for passengers, and time is a critical matter when deciding on a transportation mode. Cairo probably marked the highest due to the city’s size and the complexity of its transportation network. The same is the case for Beirut, even though it is smaller in area and population than Cairo, it still contains the characteristics of a dense capital city where time consumption is correlated with the economy. Alexandria and Jounieh are both linear coastal cities, which is a condition that helps navigate the existing context and always provides a location reference (Kubat and Ekinoglu, 2012). Having clear landmarks and orientation makes it easier to recognize directions and walkthroughs. These two traits probably explain why Alexandria and Jounieh scored the least in smartphone use frequency.
The discussion takes on the following set of indicators for research investigation: age, gender, education, perception of safety, and perception of ease of use and accessibility. Following the international literature addressing the issue of smartphone use specifically for mobility and ride-sourcing directly, the research succeeds in relating the importance and impact of these defined indicators through relevant studies regarding urban mobility and transportation.
Age is a strongly definitive factor regarding the usage of smartphones for transportation. Some studies indicated a generational difference in smartphone usage frequency, stating that young adults are more likely to use smartphone applications (Jamal et al., 2017; Julsrud and Denstadli, 2017; Jamal and Habib, 2019). Millennials (born between 1980 and 2001) are argued to be more adaptable to advanced technology (Kamargianni and Polydoropoulou, 2014). In addition, by 2017, studies were published proving with statistics that older generations are evolving like a new set of smartphone users. The model reveals an opposite correlation between age increase and the odds of using smartphones in transportation, where it decreases by 4% as shown in Figure 3. Many reasons can result in this relation. One probability is that with age, people become more aware of the context they are navigating and are more secure in going on public transportation without the need for smartphone usage neither for navigation nor for ride-sourcing. Familiarity also plays a role; people accustomed to regular routes, like daily commutes to work or school, may feel less insecure due to their repeated exposure. Also, costs can have an effect as when people grow older, they become more financially independent and carry financial responsibilities. That can make older people more aware of their expenses, so spend less money on transportation by using formal and informal public transportation.
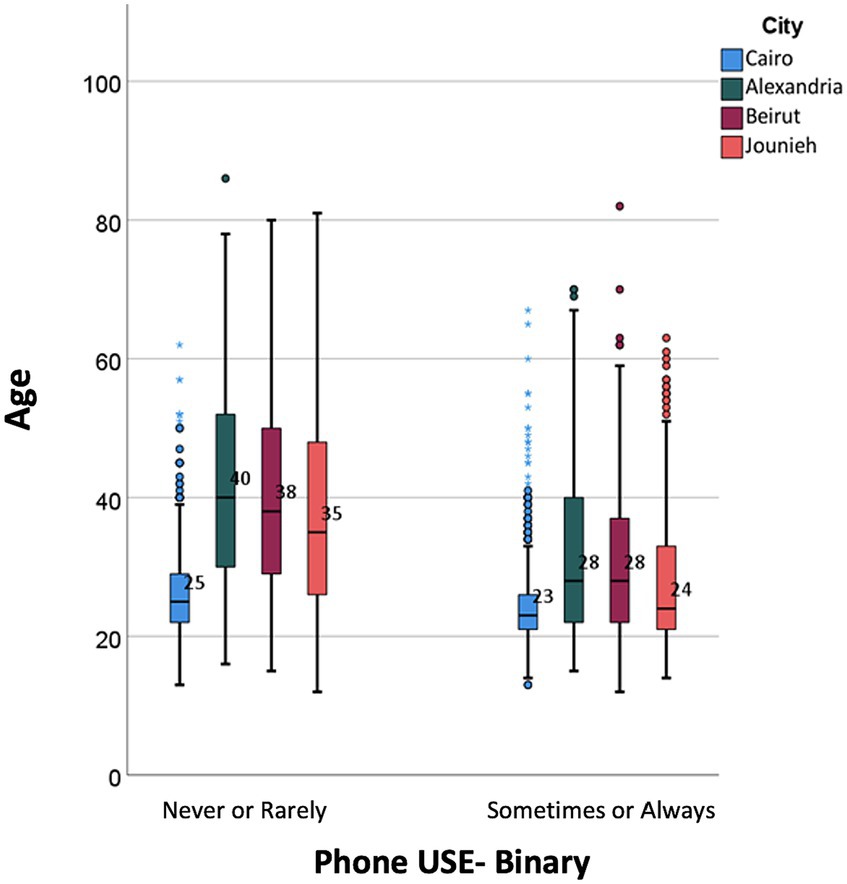
Figure 3. Illustration of the age and smartphone use in the four cities.
Gender difference also proved to be of great significance as a variable in the model output. Women-oriented urban design, women’s safety in urban environments, and designing cities for women are three of many research topics discussing how women are vulnerable and always insecure in navigating existing contexts worldwide. Transportation and mobility are a branch of research where women are a target sample for study regarding the perception of safety and comfort. Data gathered in our model by women proved 77% higher odds of smartphone usage compared to men in the four cities collectively. Looking at β values Cairo Scored 1.834, Beirut scored 1.468, and Jounieh 1.651 scored, but Alexandria scored 3.015 making it 3 times more likely for women to use smartphones in transportation than the other three cities. Alexandria’s societal norms provide several probabilities. As mentioned, Alexandria is a linear coastal city with a dense formal and informal public transportation network. Women in Alexandria would prefer using smartphones for transportation for reasons of safety, comfort, and luxury to name a few. Safety, as previously discussed, is a fundamental reason for women to use ride-sourcing or navigate using Smart apps. Also, trips in Alexandria are not too costly since trips are not as long as in Cairo, for example, and are less congested or complex in routes and directions. Moreover, the strikingly higher usage by women may also reflect less access to private vehicles, which may be preferentially available to the men in their household. Therefore, women likely prefer comfort in commuting over price when selecting a transportation mode.
A study on how smartphone use affects travel decisions stated that the increase in employment rate, as well as the dense land use mix in neighborhoods, tends to increase smartphone use for determining trip destinations (Jamal and Habib, 2020). Presumably, more discretionary facilities are available in a neighborhood where professionals and workforce are the majority, and the land use is mixed, therefore more frequent use of smartphones for destination choice.
In comparing education variable categories, it is noted how different the use of smartphones is between categories below university degrees and above university graduation. School education usually relies on school buses for the students’ mobility. Also, school students do not commute a lot through 7 days of the week. Citizens who have bachelor’s degrees and higher education degrees commute more daily for various reasons like reaching work destinations, leisure activities, personal errands, etc.
Feeling secure riding a vehicle with strangers or walking down a road you are not familiar with is a fundamental characteristic for a person. Public transportation modes—formal and informal—are required to provide a strong feeling of security to encourage users (Joewono and Kubota, 2006). In our case study, it is found that the perception of security is also in an inverse relationship with the usage of smartphones. Cities in Europe like Berlin and Rome have travel apps where you can track and book trips made of multiple formal transportation modes. When a user tracks a trip on Google Maps, for instance, in many of the European cities, the application provides alternatives for transportation trips with all the information needed as well as the option to book tickets on the spot. Cairo, Alexandria, Beirut, and Jounieh all have a dense network of public transportation that serves public mobility around each city. Still, what drives people to use smartphones for transportation is the availability of data and applications that ease user’s transportation selection and booking. A trip was planned using Google Maps in each city to see if the app would provide information on transportation modes. In Egypt, the Cairo trip provided information about the metro and buses. Alexandria, Beirut, and Jounieh trips did not generate public transportation data. That likely explains the inverse relationship between using public transportation and smartphone use. Users who feel secure with formal public transport are less likely to rely on smartphones for navigation or ride-sourcing.
Another dimension regarding the feeling of security is personal and physical safety. It was reported that even though technologies facilitating ride sourcing are increasing in popularity (Shaheen et al., 2017), there were documented cases in which some users may have experienced racial discrimination and sexual harassment (Ge et al., 2016). Although the study had limiting answers to confirm or deny these factors being a steering force for users’ feeling of security using transportation, it is definite that using a smartphone for mobility and decision-making does elevate feelings of security since the user has the power to select the mode and time of transportation which they feel most comfortable with. Our model showed that women were 77% more likely to use smartphones for transportation compared to men across the four cities. This score favors the probability that women feel safer using smartphones for transportation.
According to some, ride-sourcing services presented the chance to switch from ownership-based to access-based consumption (Paundra et al., 2020). Ride-sourcing services encourage people to reconsider owning a car by offering a reasonably priced, practical, and comfortable substitute for current transportation options (Bilgin et al., 2023). While ride-sourcing primarily fills mobility gaps rather than serving as a regular transportation mode (Feigon and Murphy, 2018), it pointed out the advantages of lower waiting time (Rayle et al., 2016), less exposure to stress and time loss while driving, and lower congestion and cost which is even higher when the ride is shared (Etminani-Ghasrodashti and Hamidi, 2019), and operative first- and last-mile connection to public transit (Habib, 2019; Ghaffar et al., 2020). All these studies’ findings actualize our research answers to perceived ease of use and performance. These variables that answered to increase the likelihood of using smartphones in transportation are shown in Figure 4. This variable holds weight in dense cities with lengthy rush hours. Looking at β values, Cairo Scored 1.009, Beirut scored 1.016, Jounieh 1.015, and Alexandria scored 1.015 perceived ease of use. It is probably due to the need for multimodal trips to reach a destination in the four cities. Some people would find it easier to take one transportation mode for a trip. Also, age and health status affect the selection of transportation, where multimodal options can be hindering to older people, women, and anyone with a physical health issue.
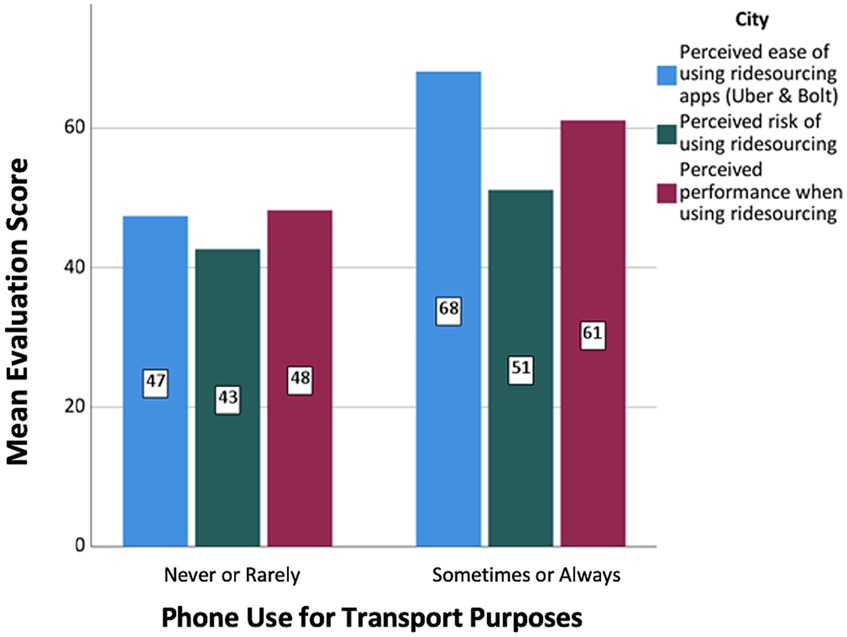
Figure 4. Using smartphones for transportation versus perceptions of the respondents about using ride-sourcing.
Questions that involved costs and income were later removed from the study due to currency differences between Egypt, Lebanon, and the Euro. The values gathered from Egypt were in EGP since it is the only currency used in the country. Values gathered from Lebanon were not confirmed to be all in USD or if some answers were using Lebanese currency. These doubts were brought up from the data gathered and how numbers showed a big variance between Beirut and Jounieh. This made all data about cost and income removed from the model.
6 Conclusion
With the increase in the usage of smartphone apps for transport purposes, this study contributes by analyzing the relationship between smartphone usage for transportation and the significant variables determining this correlation. Furthermore, the variation of the effect of the different variables ranging from age, gender, and education status to trip generation for non-commute purposes, trip generation for commute purposes, perceived ease of using ride-sourcing apps, perceived performance when using ride-sourcing, perceived security when using public transportation, highlighted the socio-economic differences between Lebanon and Egypt. The question regarding smartphone usage frequency was answered by 3,285 respondents in the four case-study cities; 40% of them always use the smartphone and 21.4% sometimes, whereas 20.9% rarely use it and 16.6% never. The capitals of Egypt and Lebanon have a high degree of dependency on smartphone use for transport purposes, compared to Alexandria and Jounieh. As indicated, if people have studied up to brevet, graduation, middle, and secondary or technical school levels, they are more likely not to use smartphones for transportation purposes. However, master’s and Ph.D. holders users who earned bachelor’s degrees are more likely to use smartphones compared to undergraduates. As indicated for every year of age increase, the odds of using smartphones in transportation decrease by 4%. Similarly, the usage of smartphones has 0.7% less odds as the perception of security increases when using public transportation. The model also displays that Women have 77% higher odds of using smartphones compared to men. Gender is significant in all three cities (Cairo, Alexandria, and Jounieh) except Beirut.
These statistical analyses of smartphone use for transportation purposes in the four case-study cities of this study have highlighted a set of matching highly significant variables. Presenting these correlations can help policymakers better plan and define priorities in sustainable transportation and mobility plans. Gender stands out as a variable that proposes further research on how women interact with transportation and mobility in MENA cities. Another interesting relation for further investigation would be the level of education and the use of smartphones for transportation. Many variables can be defined in this relation, like employment, economic status, social impression, types of transportation modes available, and multimodal trips that are easily planned. Security in public transportation and how it correlates with the ride-sourcing quality and simplicity of using smartphones for transportation and mobility is also a recommended research area. Furthermore, throughout the literature review related to the usage of smartphones generally in cities, most studies have focused on the negative effects of continuously using smartphones while traveling, risking the safety of individuals (pedestrians, cyclists, drivers, etc.). This study aimed positively to view the smartphone as a source-riding tool only influencing choice and decision-making; however, this may trigger more potential to give further research to assess the different risks and potentials associated with smartphone usage for transport uses. Moreover, while this investigation has been limited to Lebanon and Egypt only, it can be considered as an initial step to analyze and compare different variables that affect smartphone usage for transport purposes throughout more cities representing the diversity of the MENA region, analyzing the region’s diverse socio-economic contexts that directly affect traveling behavior. Further research can also analyze the gap between Western and MENA region countries concerning the determinants of traveling behavior while enhancing the understanding of smartphone usage for transport purposes context to guide decision-makers, policymakers, and transport planners.
Conducting the study was mainly built on two methods: data collection using questionnaires targeting users from Cairo, Alexandria, Beirut, and Jounieh and data analysis of questionnaire answers. Data collection was conducted by students and staff members of private universities, one in each city. Having 90% of study conductors be students of middle to high-income households may have isolated a sample of society. Since students may not properly bear in mind the importance of variety and social inclusion when conducting the data collection. This assumption was brought up from the analysis of variables of household size, number of cars owned, and household income. Another difficulty that faced data collection was the political conditions in each country. Some students faced harassment from passengers due to feelings of insecurity among the public on the streets. Also, some study conductors were asked by authorities for clarifications from their universities that they were conducting an academic study. However, we recommend that policymakers, innovators, and the business sector involved with transportation use the findings of the paper and conduct further affirmation on the significance of the above-mentioned variables. Public transportation modes—formal and informal—are important pillars adding to the quality of life in cities on many levels; environmental, economic, and social.
Data availability statement
The original contributions presented in the study are included in the article/supplementary material, further inquiries can be directed to the corresponding author.
Ethics statement
Ethical review and approval was not required for the study on human participants in accordance with the local legislation and institutional requirements. Written informed consent from the [patients/ participants OR patients/participants legal guardian/next of kin] was not required to participate in this study in accordance with the national legislation and the institutional requirements.
Author contributions
RS: Writing – original draft, Conceptualization, Investigation. DD-A: Investigation, Methodology, Writing – original draft, Conceptualization. NA: Conceptualization, Methodology, Writing – original draft. BK: Conceptualization, Methodology, Writing – original draft. HM: Methodology, Writing – original draft, Conceptualization, Formal analysis, Supervision, Writing – review & editing, Investigation.
Funding
The author(s) declare financial support was received for the research, authorship, and/or publication of this article. We acknowledge support by the German Research Foundation and the Open Access Publication Fund of TU Berlin. “/” Diese Publikation wurde von der Deutschen Forschungsgemeinschaft und aus dem Open-Access-Publikationsfonds der Technischen Universität Berlin unterstützt.
Conflict of interest
The authors declare that the research was conducted in the absence of any commercial or financial relationships that could be construed as a potential conflict of interest.
Publisher’s note
All claims expressed in this article are solely those of the authors and do not necessarily represent those of their affiliated organizations, or those of the publisher, the editors and the reviewers. Any product that may be evaluated in this article, or claim that may be made by its manufacturer, is not guaranteed or endorsed by the publisher.
References
Alonso-González, M. J., Hoogendoorn-Lanser, S., van Oort, N., Cats, O., and Hoogendoorn, S. (2020). Drivers and barriers in adopting mobility as a service (MaaS) – a latent class cluster analysis of attitudes. Transp. Res. A Policy Pract. 132, 378–401. doi: 10.1016/j.tra.2019.11.022
Andraos, J., Awad, R., Geagea, T., Habib, C., Koberssi, L., Lahoud, J., et al. (2020). Urban travel behavior and socio-spatial issues in the MENA region: what do we know? Transp. Telecommun. 22, 425–443. doi: 10.2478/ttj-2021-0033
Bilgin, P., Mattioli, G., Morgan, M., and Wadud, Z. (2023). The effects of ridesourcing services on vehicle ownership: the case of Great Britain. Transp. Res. Part D: Transp. Environ. 117:103674. doi: 10.1016/j.trd.2023.103674
CAPMAS . (2023). Available at:https://www.capmas.gov.eg/ (Accessed September 20, 2023)
Caulfield, B., and Brazil, W. (2013). Factors affecting use of transport related smartphone applications, 9th ITS European Congress, Dublin, Ireland, 4–7 June, Paper No. TP-SP 0007. Available at:https://www.researchgate.net/publication/283720136
Chang, Z., Chen, J., Li, W., and Li, X. (2019). Public transportation and the spatial inequality of urban park accessibility: new evidence from Hong Kong. Transp. Res. Part D: Transp. Environ. 76, 111–122. doi: 10.1016/j.trd.2019.09.012
Chaudhry, A.-G., Masoumi, H., and Dienel, H.-L. (2023). A systematic literature review of mobility attitudes and mode choices: MENA and South Asian cities. Front. Sustain. Cities 4:1085784. doi: 10.3389/frsc.2022.1085784
De Angelis, M., Fraboni, F., Puchades, V. M., Prati, G., and Pietrantoni, L. (2020). Use of smartphone and crash risk among cyclists. J. Transp. Saf. Secur. 12, 178–193. doi: 10.1080/19439962.2019.1591559
Etminani-Ghasrodashti, R., and Hamidi, S. (2019). Individuals’ demand for ride-hailing services: investigating the combined effects of attitudinal factors, land use, and travel attributes on demand for app-based taxis in Tehran, Iran. Sustainability 11:5755. doi: 10.3390/su11205755
Feigon, S., and Murphy, C. (2018). Broadening Understanding of the Interplay Between Public Transit, Shared Mobility, and Personal Automobiles (Transit Cooperative Research Program Research Report 195), Transportation Research Board of National Academies, Washington, DC.
Ge, Y., Knittel, C. R., MacKenzie, D., and Zoepf, S., Racial and gender discrimination in transportation network companies (2016). NBER Working Paper No. w22776. Available at SSRN: https://ssrn.com/abstract=2861708
Ghaffar, A., Mitra, S., and Hyland, M. (2020). Modeling determinants of ridesourcing usage: a census tract-level analysis of Chicago. Transp. Res. Part C Emerg. Technol. 119:102769. doi: 10.1016/j.trc.2020.102769
Habib, K. N. (2019). Mode choice modelling for hailable rides: an investigation of the competition of uber with other modes by using an integrated non-compensatory choice model with probabilistic choice set formation. Transp. Res. Part A Policy Pract. 129, 205–216. doi: 10.1016/j.tra.2019.08.014
Hersh, J., Lang, B. J., and Lang, M. (2022). Car accidents, smartphone adoption and 3G coverage. J. Econ. Behav. Organ. 196, 278–293. doi: 10.1016/j.jebo.2022.01.033
Jamal, S., and Habib, M. A. (2019). Investigation of the use of smartphone applications for trip planning and travel outcomes. Transp. Plan. Technol. 42, 227–243. doi: 10.1080/03081060.2019.1576381
Jamal, S., and Habib, M. (2020). Smartphone and daily travel: how the use of smartphone applications affect travel decisions. Sustain. Cities Soc. 53:101939. doi: 10.1016/j.scs.2019.101939
Jamal, S., Habib, M. A., and Khan, N. A. (2017). Does the use of smartphone influence travel outcome? An investigation on the determinants of the impact of smartphone use on vehicle kilometres travelled. Transp. Res. Procedia 25, 2690–2704. doi: 10.1016/j.trpro.2017.05.201
Joewono, T. B., and Kubota, H. (2006). Safety and security improvement in public transportation based on public perception in developing countries. IATSS Res. 30, 86–100. doi: 10.1016/S0386-1112(14)60159-X
Julsrud, T. E., and Denstadli, J. M. (2017). Smartphones, travel time-use, and attitudes to public transport services. Insights from an explorative study of urban dwellers in two Norwegian cities. Int. J. Sustain. Transp. 11, 602–610. doi: 10.1080/15568318.2017.1292373
Kamargianni, M., and Polydoropoulou, A. Social networking effect on next generation’s trip making behavior: findings from a latent class model. No. 14-5318. (2014).
Kubat, A. S., and Ekinoglu, H. (2012). The effect of built space on wayfinding in urban environments: a study of the historical peninsula in Istanbul. Eight International Space Syntax Symposium.
Link, C., Strasser, C., and Hinterreiter, M. (2020). Free-floating bikesharing in Vienna – a user behaviour analysis. Transp. Res. A Policy Pract. 135, 168–182. doi: 10.1016/j.tra.2020.02.020
Liu, Q., An, Z., Liu, Y., Ying, W., and Zhao, P. (2021). Smartphone-based services, perceived accessibility, and transport inequity during the COVID-19 pandemic: a cross-lagged panel study. Transp. Res. D Transp. Environ. 97:102941. doi: 10.1016/j.trd.2021.102941
Liu, R., Chen, Y., Wu, J., Xu, T., Gao, L., and Zhao, X. (2018). Mapping spatial accessibility of public transportation network in an urban area–a case study of Shanghai Hongqiao transportation hub. Transp. Res. Part D: Transp. Environ. 59, 478–495. doi: 10.1016/j.trd.2018.01.003
Macioszek, E., and Granà, A. (2021). The analysis of the factors influencing the severity of bicyclist injury in bicyclist-vehicle crashes. Sustainability 14:215. doi: 10.3390/su14010215
Macioszek, E., Granà, A., and Krawiec, S. (2023). Identification of factors increasing the risk of pedestrian death in road accidents involving a pedestrian with a motor vehicle. Arch. Transp. 65, 7–25. doi: 10.5604/01.3001.0016.2474
Mostofi, H., Masoumi, H., and Dienel, H. (2020). The relationship between regular use of ridesourcing and frequency of public transport use in the MENA region (Tehran and Cairo). Sustainability 12:8134. doi: 10.3390/su12198134
Nikolí, M., and Bierlaire, M. (2017). Review of transportation mode detection approaches based on smartphone data. In STRC 17th Swiss Transport Research Conference.
Paundra, J., van Dalen, J., Rook, L., and Ketter, W. (2020). Ridesharing platform entry effects on ownership-based consumption in Indonesia. J. Clean. Prod. 265:121535. doi: 10.1016/j.jclepro.2020.121535
Rayle, L., Dai, D., Chan, N., Cervero, R., and Shaheen, S. (2016). Just a better taxi? A survey-based comparison of taxis, transit, and ridesourcing services in San Francisco. Transp. Policy 45, 168–178. doi: 10.1016/j.tranpol.2015.10.004
Rietveld, P. (2000). The accessibility of railway stations: the role of the bicycle in the Netherlands. Transp. Res. Part D: Transp. Environ. 5, 71–75. doi: 10.1016/S1361-9209(99)00019-X
Shaheen, S., Bell, C., Cohen, A., and Yelchuru, B. (2017). “Travel behaviour. Shared mobility and transportation equity,” p. 66.
Shaheen, S. (2016). Mobile apps and transportation: A review of smartphone apps and a study of user response to multimodal traveler information.
Silver, L., Smith, A., Johnson, C., Jiang, J., Anderson, M., and Rainie, L. (2019), Mobile connectivity in emerging economies: use of smart phones and social media is common across most emerging economies, Pew Research Center. Available at:https://www.pewresearch.org/internet/2019/03/07/use-of-smartphones-and-social-media-is-common-across-most-emerging-economies
Sobrinho-Junior, S. A., de Almeida, A. C. N., Ceabras, A. A. P., da Silva Carvalho, C. L., Lino, T. B., and Christofoletti, G. (2022). Risks of accidents caused by the use of smartphone by pedestrians are task-and environment-dependent. Int. J. Environ. Res. Public Health 19:10320. doi: 10.3390/ijerph191610320
Statista (2023). Smartphone market in MENA – statistics & facts (September 2023). Available at:https://www.statista.com/topics/5338/smartphone-market-in-MENA/#topicOverview
Turner, A. , (2023), How many people have smartphones worldwide (September 2023), BankMyCell. Available at:https://www.bankmycell.com/blog/how-many-phones-are-in-the-world#part-5
Verkasalo, H., Lopez-Nicolas, C., Molina-Castillo, F., and Bouwman, H. (2010). Analysis of users and non-users of smartphone applications. Telem. Inform. 27, 242–255. doi: 10.1016/j.tele.2009.11.001
Zhujiworld . (2023). Available at:https://worldpopulationreview.com/countries/lebanon-population; https://zhujiworld.com/ (Accessed October 22, 2023)
Keywords: urban transportation planning, travel behavior, shared mobility, ride-sourcing, smartphone, MENA region, sustainable transportation
Citation: Saber RE, Dief-Allah DM, Ahmed NO, Khalifa BM and Masoumi H (2024) The correlates of smartphone use for transportation purposes in Egypt and Lebanon. Front. Sustain. Cities. 6:1340372. doi: 10.3389/frsc.2024.1340372
Edited by:
Sergio A. Useche, University of Valencia, SpainReviewed by:
Elżbieta Macioszek, Silesian University of Technology, PolandEdmund Zolnik, George Mason University Arlington Campus, United States
Copyright © 2024 Saber, Dief-Allah, Ahmed, Khalifa and Masoumi. This is an open-access article distributed under the terms of the Creative Commons Attribution License (CC BY). The use, distribution or reproduction in other forums is permitted, provided the original author(s) and the copyright owner(s) are credited and that the original publication in this journal is cited, in accordance with accepted academic practice. No use, distribution or reproduction is permitted which does not comply with these terms.
*Correspondence: Houshmand Masoumi, masoumi@ztg.tu-berlin.de