Measuring the level of urban traffic congestion for sustainable transportation in Addis Ababa, Ethiopia, the cases of selected intersections
 Daniel Lirebo Sokido
- Department of Urban Planning and Development, College of Urban Development and Engineering, Ethiopian Civil Service University, Addis Ababa, Ethiopia
Traffic congestion poses a persistent and escalating problem for major cities in both developed and developing countries, exerting a direct impact on the economic growth and development of these urban areas. Quantifying the extent of traffic congestion is the fundamental initial step in comprehending the severity of traffic congestion in order to devise effective methods for alleviation. The city of Addis Ababa is currently experiencing significant traffic congestion at its main intersections. The primary aim of this research is to assess the current level of traffic congestion at specific intersections. The assessment of traffic congestion was conducted using the travel time method. Data on travel time, traffic volume, and travel speed were gathered at three blocks and two intersections using a combination of quantitative and qualitative data collection methods. The travel rate, delay rate, and total travel delay (in vehicle-minutes) were computed. The total vehicle-minute delay for the selected three segments is estimated to be approximately 12,708 vehicle-minutes (or 212 vehicle-hours). The text reveals the significance of measuring the various components of traffic congestion in order to ensure a sustainable traffic system. It also highlights the importance of maintaining a satisfactory level of service for the future sustainability of City.
Introduction
Background
Cities are dynamic hubs of social and economic activities, making them the focal point of urbanization and significant agents of change on a larger scale (Fantahun, 2012). Transport sectors play a vital role in the development and vitality of urbanization and urban cities (Amselati et al., 2011). Transportation serves as the catalyst for the social and economic endeavors within urban areas. The establishment of a proficient and effective transport system is crucial for cities, particularly in the contemporary era of globalization and information age. Cities serve as hubs of urbanization and catalysts for national and global economies (Fantahun, 2012). The urbanization rate in Africa is relatively low, standing at 37.1%, in contrast to developed regions such as Europe (72.7%) and North America (79.1%) (Kasa et al., 2011). Nevertheless, urbanization in developing nations is advancing at a significantly higher pace compared to developed nations, with an annual growth rate potentially reaching 3% or even 4% (Soubbotina, 2004). The estimated urban population in Ethiopia is only 17.3 percent. According to the World Bank group in 2015, Ethiopia is experiencing rapid urban population growth. It is projected that the number of people residing in cities will almost triple from 15.2 million in 2012 to 42.3 million in 2037. This growth is expected to occur at an annual rate of 3.8 percent over the next 20 years.
Furthermore, African cities are becoming increasingly populous and spread out and are undergoing rapid and acute changes. At the same time, African countries are aspiring to make their capitals showcases of professed economic dynamism and modernity. Urban sprawl and the concentration of citizens create serious challenges. Mobility is crucial, both socially—due to increasing urban mobility needs (Nallet, 2018), longer distances, and difficulties in accessing the city—and economically—congestion, which has a negative impact on business and attractiveness (Provonsha and Sifuentes, 2017). Congestion pricing is one piece of a comprehensive traffic reduction strategy in Singapore, with major investments in public transit, bicycling and walking networks, and transit-oriented development. In addition, parking fees have increased over time, as well as taxes and fees related to car ownership.
Addis Ababa, the capital city of Ethiopia, is the largest urban center in the country and serves as the hub for economic, social, and political affairs. Additionally, it holds the distinction of being the fourth largest diplomatic city globally. Based on the CSA 2008 data, the city's total population exceeds 2.7 million, representing 32.27% of the country's overall urban population. In 2014, Ethiopia had the lowest motorization rate in the world, with only two cars per 1000 inhabitants (OICA, 2016). The Ministry of Transport in Ethiopia has reported that there are currently 587,400 vehicles being used on the country's roads, and this number is increasing at an annual rate of ~6%. Although Ethiopia has a relatively low rate of motorization, vehicle registration is increasing, particularly in urban areas like Addis Ababa, where around 70% of all registered vehicles in the country are located (Ethiopia Ministry of Transport, 2011).
The rises in population, substantial income levels, and rapid urbanization have resulted in an escalation in the demand for travel (Amselati et al., 2011). According to a study conducted by CES in association with SABA Engineering in 2005, the Urban Transport study report of Addis Ababa predicts that the travel demand in the city will double by 2020. This means that the number of daily trips is expected to increase from 3.6 million in 2004 to 7.7 million trips per day. The disparity between the demand for travel and the available supply is causing traffic congestion. The city's transport system is currently plagued by chronic issues of traffic congestion and traffic accidents (Birhanu, 2000). Both developed and developing nations are experiencing varying degrees of traffic congestion. The 2009 Urban Mobility Report, published by the Texas Transportation Institute, found that in 2007, congestion resulted in urban Americans spending an additional 4.2 billion h traveling and purchasing an extra 2.8 billion gallons of fuel. This congestion cost amounted to $87.2 billion, representing a growth of over 50% compared to the previous decade. The exponential expansion of The increasing traffic congestion in Addis Ababa is becoming a significant problem for the city, impacting the overall GDP (economy) of the country, human health, and various social activities. Properly measuring traffic congestion is crucial in order to accurately assess the level of congestion and the level of service provided. This measured data is essential for policy makers and urban planners to implement appropriate mitigation methods.
Problem statement
Transportation plays a crucial role in the economic growth of urban centers by facilitating the smooth movement of goods and commuters within different areas of the city. The majority of the country's manufacturing industries, as well as numerous financial and commercial institutions, are situated within and on the outskirts of Addis Ababa (Taddesse, 2011). The city itself presently accounts for around 50% of the national GDP, underscoring its crucial role in the overall economic progress of the country (Annual Report, 2015). In recent years, Addis Ababa has experienced significant traffic congestion at numerous major intersections and on various routes, resulting in commuters wasting valuable time during transportation. During the morning and evening peak hours, traffic congestion reaches a high level, resulting in increased commuter frustration. Congestion has direct and indirect effects on employee productivity, economic growth, human health, the environment, and other social activities. During a traffic accident in Addis Ababa, the movement of commuters and various types of support vehicles such as ambulances, police vehicles, towing machines, and fire brigades are significantly hindered for a prolonged period. This obstruction negatively impacts life-saving efforts and contributes to an increase in mortality rates. Traffic congestion not only has consequences, but it also hampers the movement of various emergency support organizations' vehicles during peak hours of the day.
Traffic congestion has a detrimental impact on both transportation expenses and a nation's yearly fuel consumption. In Addis Ababa, it is common to experience delays in work, school, and business meetings due to the large size of queues. In order to accurately assess and address the significant traffic congestion, it is crucial to measure both the level of congestion and the level of service. Without this information, it becomes challenging to fully comprehend the extent of congestion and the appropriate methods to alleviate it. This research gap necessitates additional investigation and research.
Hypothesis and aim of the research
Hypothesis
The hypothesis of this study is “The measurement of the level of traffic congestion at intersections can indicate the efficiency of urban mobility and the level of service”.
Aim of the research
The objective of this study is to measure and analyse the current level of urban traffic congestion at specific intersections in Addis Ababa, using urban planning perspectives. Hence, this study examined the influence of traffic congestion on the health quality of the main roads and intersections in commercially vibrant urban areas across various locations in Addis Ababa.
Limitations of this study
The major limitations of this study were the absence of willingness in politicians and officials to respond to interview questions and provide other related support. Another serious limitation was the country's security issues, as Ethiopia was facing civil unrest and a lack of rule of law, which hindered the successful execution of the research activities. Additionally, financial limitations posed a significant challenge to the success of the research.
Materials and methods
In order to achieve the goals of this study, a range of methodologies have been employed. The level of traffic congestion at selected intersections in Addis Ababa was measured and calculated using various parameters such as traffic volumes, traffic flows, delay ratio, total segment delay, congested time, travel time, and delay time rates. The measurements were obtained through cross sections, aerial photographs, on-site counting of road users, video capturing equipment, satellite images, and on-site observations. Quantitative data obtained from the intersections or junctions in the case study, along with their corresponding traffic components. Furthermore, a survey was conducted in conjunction with a questionnaire and interviews to obtain comprehensive perspectives. Both overt and covert observations were made, and a videography technique was used to collect data on pedestrians and vehicles. This was done to enhance the physical analysis and measure the level of traffic congestion at the chosen intersections. This research study has employed both qualitative and quantitative research methodologies, a practice commonly referred to as “triangulation”.
Hence, the research methodology seeks to attain utmost validity to ensure the research's reliability. Therefore, a wider frame has been selected in order to analyse the time series data. To ensure maximum reliability, research methods are chosen that employ cross-validation to verify the analysis and inferences. The analysis of the interviews was conducted using Kvale's (1996) method of analysis. Three out of the five recommended approaches for analyzing interviews by Kvale were utilized. Condensation refers to summarizing lengthy interviews into concise statements or shorter formulations. Narrative involves constructing a cohesive story from the various events discussed in an interview. Interpretation involves placing the statements within a broader context of reference. By employing condensation, the interviews obtained during the fieldwork were initially purged of unnecessary and redundant information, and concise formulations were also created. These case study reports have been intricately interwoven to create a cohesive narrative. Ultimately, the narratives were aligned, as elucidated in the primary approach, with the pre-established research question-driven subjects. The questionnaire and measurements data were initially inputted into the SPSS programme, specifically version-23. Aside from analyzing interviews and questionnaires, this research also involved interpreting video recorded data, GIS, photographs, and secondary written documents. These different sources of information were used to address the key research questions and were included in the case reports to measure the extent of traffic congestion in Addis Ababa.
Justifications for selecting the two mid-blocks (intersections)
There are several intersections in the area that experience complicated traffic congestion due to high mobility. However, this research specifically focuses on two major intersections, Urael and Haihulet Junctions, which have larger traffic jam complexes. These intersections require technical solutions, as no previous research has been conducted to measure the level of traffic congestion and address the associated problems. The selected intersections are heavily trafficked in the urban environment and have a greater negative impact on city residents compared to other intersections and junctions. Additionally, they serve as important economic nodes for the city. Both Urael and Haihulet junctions have four entry approaches. The Urael junction approaches include Meskel Square, Atlas Hotel, Kazanchis, and “Wuhalemat”. The Haihulet junction approaches include “Wuhalemat,” Bole Bras, Lem Hotel, and the British Embassy.
Theoretical frameworks
The rapid growth of cities in developing countries is directly influenced by the extent of interaction they can achieve both between cities and within individual cities. Urban transport enables and supports these interactions (Abeje, 2012). Transport systems serve as the vital network that connects different parts of urban areas, facilitating movement between social areas and functional zones (Solanke, 2013). In contemporary times, cities in both developed and developing nations rely heavily on urban transport systems. Urban residents must engage in constant mobility to facilitate various urban activities and functions. This mobility is made possible through the use of transport mechanisms (Solanke, 2013). In developing nations, urban transport infrastructures remain inadequate and have limited capacity to meet the increasing demands resulting from rapid urbanization. Therefore, traffic flow theories seek to describe in a precise mathematical way the interactions between the vehicles and their operators (the mobile components) and the infrastructure (the immobile component). The latter consists of the highway system and all its operational elements: control devices, signage, markings, etc. (Gartner et al., 2001). As such, these theories are an indispensable construct for all models and tools that are being used in the design and operation of streets and highways.
Similarly, (Knoop, 2017) traffic processes cause several problems in the world. Traffic delay, pollution are some of it. They can be solved with the right road design or traffic management (control) measure. Before implementing these designs or measures, though, their effect could be tested. To this end, knowledge of traffic flow theory is needed (Afrin and Yodo, 2020). Traffic congestion is a perpetual problem for the sustainability of transportation development. Road traffic jams continue to remain a major problem in most cities around the world, especially in developing regions resulting in massive delays, increased fuel wastage and monetary losses (Berisha, 2016). Traffic congestion causes delays, inconvenience, and economic losses to drivers, as well as air pollution. Identification and quantification of traffic congestion are crucial for decision-makers to initiate mitigation strategies to improve the overall transportation system's sustainability.
With an estimated population of 84.7 million inhabitants in 2011, Ethiopia is the second most populous country in Africa, after Nigeria. Nevertheless, it has a relatively low urbanization rate of 17%, making it one of the least urbanized countries in Africa, ranking only above Burundi (10.9%), Malawi (15.7%), and Uganda (15.6%). According to the World Bank group in 2015, urbanization in Ethiopia is experiencing rapid growth, making it one of the fastest in the world. Urban infrastructures become strained as a result of the rapid growth of urbanization. These stresses also impact urban transport by increasing the demand for it. Addis Ababa faces a challenge with urban mobility. Mobility refers to the capacity for individuals and goods to travel swiftly, effortlessly, and inexpensively to their intended destinations, maintaining a level of speed that reflects unhindered movement or similarly excellent conditions (NCHRP report 398, 1997). Urban mobility refers to the capacity to transport individuals and commodities within a city. Motorized transport is the primary mode of urban mobility in Addis Ababa, accounting for 55% of the city's total modal share. According to the AACPPO report from 2012, the city's modal share in 2006 was approximately 45% for pedestrians, 46% for public transport, and 9% for private modes- refer to Figure 1 for visual representation. Traffic congestion and road traffic accidents have an impact on the mobility of individuals and the transportation of goods. The current urban transport system exhibits a high incidence of traffic accidents, significant traffic congestion, adverse environmental effects, inadequate safety measures in public transport, and limited accessibility (Bogale, 2012).
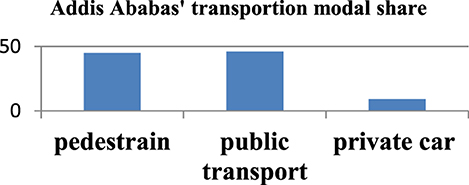
Figure 1. Transportation mode share of Addis Ababa (AACPPO, 2017).
Traffic congestion
Weisbrod et al. (2001) as shown on Figure 2 below defines traffic congestion as the result of an imbalance between the volume of traffic and the capacity of the road, leading to delays. The 2007 ECMT report highlights the absence of a universally agreed-upon definition of traffic congestion. This lack of consensus can be attributed to the fact that congestion is influenced by both physical factors, such as the volume of traffic and capacity ratio, as well as subjective factors, such as users' expectations. The NCHRP 398 report also concurred with this assessment, referring to it as both congestion and deemed it as unacceptable.
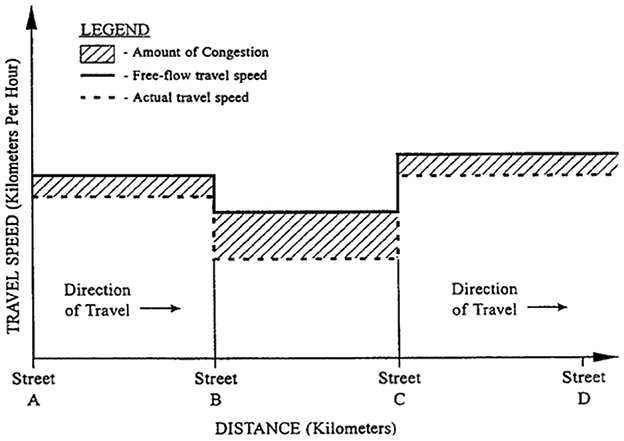
Figure 2. The Definition of congestion (NCHRP, 2019).
Congestion refers to the increased travel time or delay experienced beyond what is typically encountered during periods of light or smooth-flowing traffic. Unacceptable congestion is when the travel time or delay exceeds a predetermined standard. The established standard may differ depending on the specific transportation facility, mode of travel, geographical location, and time of day (NCHRP 398, 1997).
Congestion refers to the hindrance that vehicles cause to each other as a result of the relationship between speed and flow, when a transport system is nearing its maximum capacity (ECMT, 2007). Emerging vehicles are exerting dominance over the existing vehicles on the road, resulting in a disruption of their mobility and overall functionality. Traffic congestion arises when there is an excessive demand for a highway or road, or when the number of vehicles on the road exceeds its capacity to maintain smooth traffic flow. Traffic congestion is characterized by sluggish speeds, extended travel durations, and a higher number of vehicles waiting in queues (Altshore, 1977).
Traffic congestion refers to the situation where the flow of traffic is significantly slowed down due to an excessive number of vehicles on the road, surpassing the capacity of the traffic network to handle them (Weisbrod et al., 2001).
The impact of traffic congestion and the economic decline of cities
Road transport plays a critical role in the development of a country, particularly in Ethiopia, with various impacts associated with it. One major impact is the occurrence of road traffic accidents, which are considered a significant problem worldwide. Factors within the traffic system often lead to these accidents, resulting in an estimated 1.25 million deaths and up to 50 million injuries annually (Deme, 2019). Third world countries bear the majority of these fatalities, accounting for over 85% of global road fatalities. Therefore, road traffic accidents represent a major health concern globally.
Conversely, a well-functioning transportation system can accelerate a country's economic growth, benefiting businesses, individuals, and the environment (Fattah and Morshed, 2021). However, the presence of large vehicles and increased transport activities contribute to traffic congestion on roads. This congestion poses a significant challenge to establishing a sustainable transport system in most cities worldwide. It leads to higher travel costs, reduced accessibility due to longer travel times, and various adverse effects such as increased noise pollution, driver stress, decreased satisfaction, hindered economic growth, and heightened time pressure for passengers (Higgns et al., 2017). Furthermore, congestion results in environmental issues like increased fuel consumption and air pollution emissions, impacting both urban and rural areas globally. The socioeconomic and environmental impacts of traffic congestion continue to worsen, posing a threat to the quality of life in both urban and rural areas (Higgns et al., 2017). The implementation of transport policies in developing countries faces numerous challenges.
Traffic congestion is considered one of the major barriers to sustainable urban development because it increases journey times, energy consumption, road collisions, and environmental pollution. Its main manifestation is the gradual slowing of traffic, which leads to increased travel times, fuel consumption, pollution, and other costs (Bigazzi and Clifton, 2015). Traffic lineups and delays are common in core metropolitan centers, particularly due to the ongoing rise in traffic. If no measures are taken to control it, individual journey costs will rise, and the entire municipal transportation system will become paralyzed, limiting sustainable urban development. As a result, how to alleviate traffic congestion has become a prominent topic in every city (Ye, 2012). Estimating the impact of traffic delays on the total national economy in monetary terms is the first priority for any policy-making process aiming to address the worsening situation.
Furthermore, estimates of delay costs provide a value that may be imposed on road users, which is a very effective and extensively utilized traffic demand management strategy (Chakrabartty and Gupta, 2012). Congestion has significant economic impacts. Increasing the average speed of public transport by 0.5 km/h and private cars by 1 km/h would reduce travel times and operational expenses by 0.1% of the GDP (Levinson, 2015). Automobiles attempting to circulate are directly affected by congestion. This not only impacts motorists, but also public transport users, who are often low-income individuals that have to travel long distances and pay higher costs due to congestion. City dwellers suffer from a reduced quality of life due to increased air and noise pollution, as well as long-term health effects, making it imperative to keep traffic under control.
Therefore, measuring the level of traffic congestion is crucial in identifying the role it plays in hindering economic development in cities. As the economic recovery continues to lag, traffic congestion, one of the nation's job killers, is re-emerging.
Cause of traffic congestion
Traffic planning and management are important and essential, especially in urban centers, as life relies more on vehicular movement (road transportation) for various daily activities. On a daily basis, people go to work, school, shopping, etc., creating a scramble for the right-of-way among all road users. This often creates what is referred to as “traffic conflict” (traffic bottlenecks or crashes) (Taiwo Ajala, 2016). Therefore, good traffic planning and management are required to resolve traffic conflicts in order to ensure the free flow of traffic and safe motoring. Poor traffic planning, on the other hand, is the cause of traffic congestion.
World cities face significant challenges due to traffic congestion. The causes of traffic congestion vary from one place to another or from one city to another. The Cambridge systematic study conducted in 2004 focused on analyzing traffic congestion and reliability. The study aimed to identify the causes of traffic congestion in the United States of America, the different types of congestion, and the percentage share of each cause. The study found that the main causes of traffic congestion in the United States are bottlenecks (40%), traffic incidents (25%), bad weather (15%), work zones (10%), poor signal timing (5%), and special events/other (5%). Jain Vazirani (2010) identified several factors contributing to traffic congestion in developing countries, including unplanned urban development, lack of orderliness, inadequate transportation options, outdated management practices, and ineffective lane management. Table 1 below indicate the major factors contributing to the emergence of traffic congestion in Lagos Metropolitan.
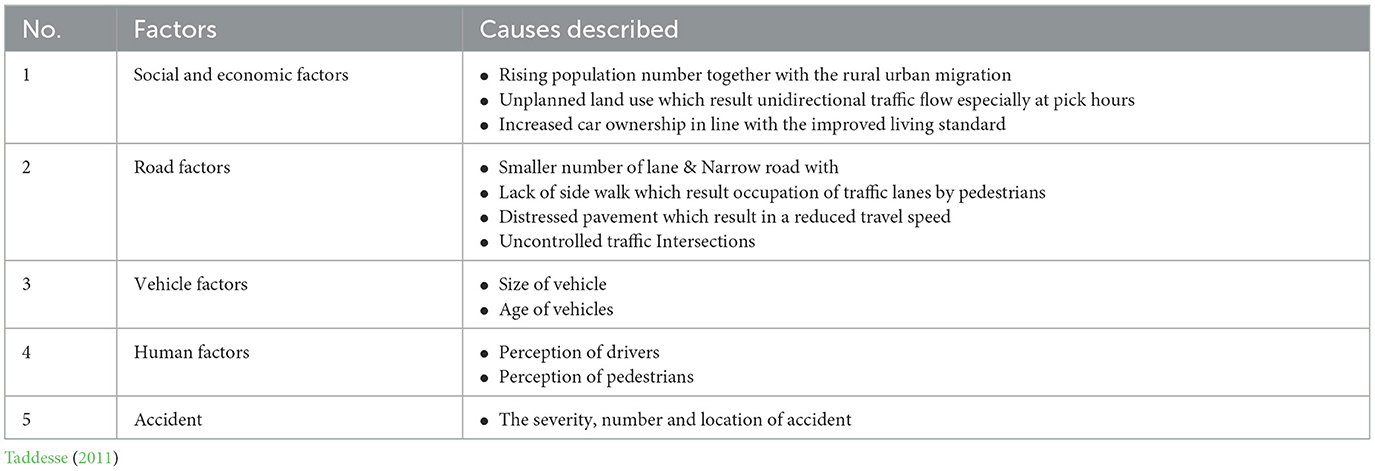
Table 1. Major causes of traffic congestion in Lagos Metropolitan.
The ECMT (2007) report on managing urban traffic congestion identifies three main categories of causal factors that affect road traffic: micro-level factors, macro-level factors, and exogenous factors. Micro-level factors pertain to traffic conditions on the road, while macro-level factors are related to the demand for road use. Exogenous factors refer to patterns and volumes of trip-making. Additionally, there are unpredictable factors such as weather and visibility that can contribute to the occurrence of congestion (ECMT, 2007). Congestion occurs at the individual level, such as on the road, and is influenced at the larger scale by factors that contribute to its occurrence and severity (Rao and Rao, 2012). Traffic congestion can occur repeatedly and unpredictably. Recurrent congestion manifests consistently at a specific location during the same time period on weekdays or weekends. The issue at hand is a matter of insufficient capacity, which can be effectively addressed by increasing the capacity of the roadways. Nonrecurring congestion arises from events such as accidents, adverse weather conditions, or road maintenance (Lomax, 1997).
Components of traffic congestion/measuring
According to the NCHRP 398 and NCHRP 618 reports, there are four components that interact within a congested roadway or system. The components encompassed are duration, extent, intensity, and reliability. The components are fully depicting the phenomenon of congestion. They exhibit variability both across and within urban regions. Duration refers to the length of time that impacts the travel system. Extent is determined by quantifying the impact of congestion on the number of individuals or vehicles, as well as by analyzing the spatial spread of congestion. Intensity refers to the degree of severity of congestion that impacts travel, as perceived by an individual traveler. Reliability refers to the alterations in the aforementioned three parameters and their level of predictability.
Measuring congestion is crucial for comprehending the expansion, attributes, consequences, and extent of congestion, as well as for identifying strategies to alleviate it. Multiple methods exist for defining and quantifying the degree of congestion. Traffic congestion measures can vary depending on the specific requirements, ranging from the conventional volume capacity ratio to more intricate empirical equations (Lomax, 1997). The report by Lomax (1997) states that the 1992 Lomax investigation found that around 90 percent of the agencies surveyed use the Level of Service (LOS) concept to measure congestion. The report also suggests that measures related to travel time, delay, and speed are more versatile and practical for various types of analysis, and they are easily comprehensible to both professionals and the general public. There is no agreement on how to define congestion solely based on the volume to capacity ratio. However, in the 1992 Lomax investigation, the agencies involved considered congestion to be present when the v/c ratio was equal to or greater than 0.8, 1.0, and 1.25. However, 46 percent of the surveyed agencies concur that the volume-to-capacity (v/c) ratio of 1.0 is the threshold for defining congestion or rating the level of service on a scale from A to F, with A representing good and F representing the worst.
Various literatures propose diverse methods for assessing congestion. Table 2 below shows the congestion measures are derived from the NCHRP 398 report “Quantifying Congestion” and the NCHRP 618 report “Cost-Effective Performance Measures for Travel Time Delay, Variation, and Reliability.”
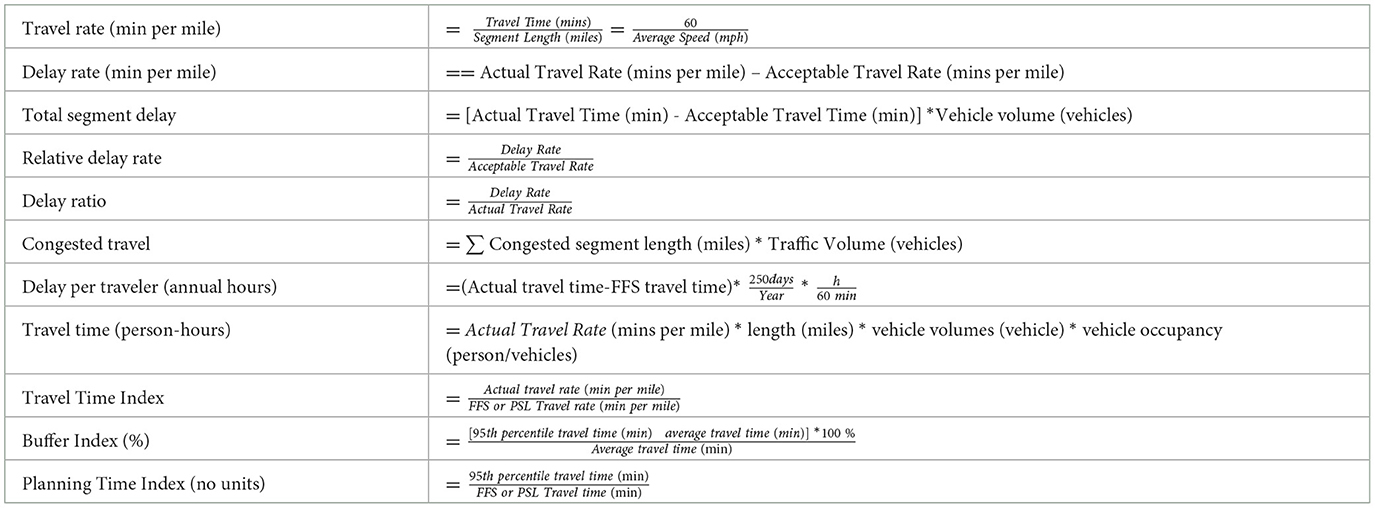
Table 2. Summary of congestion measures (source; NCHRP 398 report and NCHRP 618 report).
Level of service
The Lomax (1997) investigation found that the level of service (LOS) is commonly employed as a metric to assess congestion. LOS, or Level of Service, refers to the various operating conditions experienced by a transportation facility while handling different levels of traffic volumes (Mekonnen Ayehu, 2015). The 2000 Highway Capacity Manual (HCM) defines Level of Service (LOS) as a means to represent reasonable ranges in the three critical flow variables: speed, density, and flow rate. The Line of Sight (LOS) is categorized into six levels, ranging from level A to level F, similar to a grading system in school. Level A represents excellent conditions, while level F indicates the most unfavorable conditions. Sitotaw (2019) similarly indicates that the perception of drivers and passengers on the socio-economic impacts of traffic congestion in Addis Ababa is very high. In terms of level of services.
Highway Capacity Manual (HCM) (2000) has clearly defined all six of these ranges. LOS A—Vehicles have unrestricted maneuverability, providing users with a high level of physical and psychological comfort. LOS B indicates a relatively unobstructed traffic flow, with speeds being maintained at their maximum level. There is a slight limitation in the ability to navigate within the flow of traffic. LOS C accommodates traffic flow at or close to the free-flow speed (FFS) of the motorway. The driver's ability to navigate through traffic is significantly limited, and changing lanes requires increased caution and attentiveness. LOS D represents the point at which speed starts to decrease slightly as traffic volume increases, and density begins to increase at a faster rate. Transportation systems are extensively used to transport people and goods, which is detrimental for faster, reliable, and cost-effective socioeconomic activity. However, there are major challenges associated with the accelerated utilization of such systems (Bireda, 2018). These challenges include threats to the safety of life and property, pollution, congestion leading to a reduction in road network utilization, reduced cost-effectiveness of vehicles, and increased waiting and traveling times for passengers.
The capacity for maneuvering is significantly constrained. A minor incident can result in the formation of queues. LOS E refers to the state in which an operation is functioning at its maximum capacity. At this stage, the stream attains its utmost density threshold. LOS F refers to disruptions in the movement of vehicles. These conditions typically occur in queues that form behind points of breakdown. The average velocity at which vehicles travel along an urban street is the key factor in determining the level of service (Highway Capacity Manual (HCM), 2000). The average travel speeds for the given street class define Level of Service (LOS) A to LOS F as approximately 90%, 70%, 50%, 40%, 33%, and one third to one fourth of the Free Flow Speed (FFS) respectively. Table 3 indicates that the Level of Service (LOS) for urban streets is determined by two factors: the density of signals per kilometer and the delay caused by intersection control (Highway Capacity Manual (HCM), 2000). The maximum delay fluctuates at both signalized and un-signalized intersections.
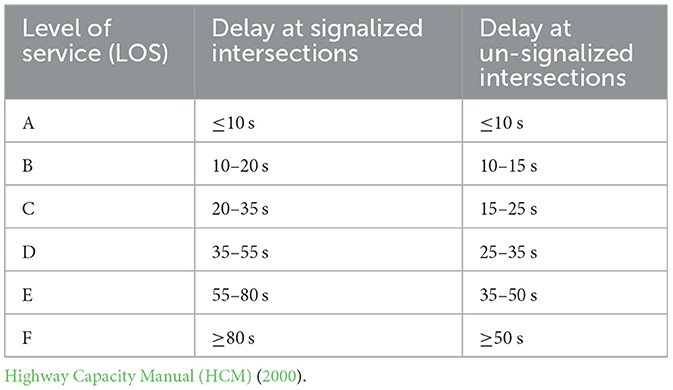
Table 3. Level of service at signalized and un-signalized intersections.
Result and discussion
Directional traffic volume
A unidirectional traffic flow is implemented for a continuous 12-h period, with measurements taken at 15-min intervals, at two specific mid-blocks: Urael-Atlas and Haihulet-Wuhalemat. The traffic flow is monitored in both directions at these locations. This unequivocally illustrates that Traffic Congestion poses a significant menace to road transport and represents a primary obstacle for transport policy at all levels. The economic impact of traffic congestion in Addis Ababa is estimated to be approximately 25% of the city's Gross Domestic Product (GDP). As a result, addressing and reducing congestion is the primary focus of various infrastructure projects, traffic management initiatives, and road pricing strategies. Measuring congestion is complex because traffic is not evenly distributed in time and space.
Urael—Atlas midblock analysis
The Urael-Atlas road experiences daily active traffic that begins in the morning and persists throughout the day. The collected data indicates that the traffic volume in both directions (from Urael to Atlas and from Atlas to Urael) is relatively similar. The average traffic volume in the direction from Atlas to Urael is 1275 vehicles per hour, while the average traffic volume in the direction from Urael to Atlas is 1,408 vehicles per hour. The Urael-Atlas direction experiences a significant increase in traffic during the time interval of 9:00–10:00, with a recorded volume of 1,528 vehicles per hour. This hourly traffic volume represents the highest level of traffic for both directions. The Urael-atlas and Atlas-Urael direction experience the lowest traffic volume during the morning hours from 7:00 to 8:00 and in the evening from 6:00 to 7:00. Please refer to Table 4, Figure 3 for more details. During these time intervals, the directional traffic volume is decreasing. The Urael—Atlas directional volume experiences a higher influx of vehicles compared to the opposite direction. Based on the raw data, the daily volume of vehicles traveling in the Urael–Atlas direction is 16,901 vehicles per 12-h period. According to Figure 15, there is an increase in both directional flows during the morning. However, during the evening period, the volume decreases.
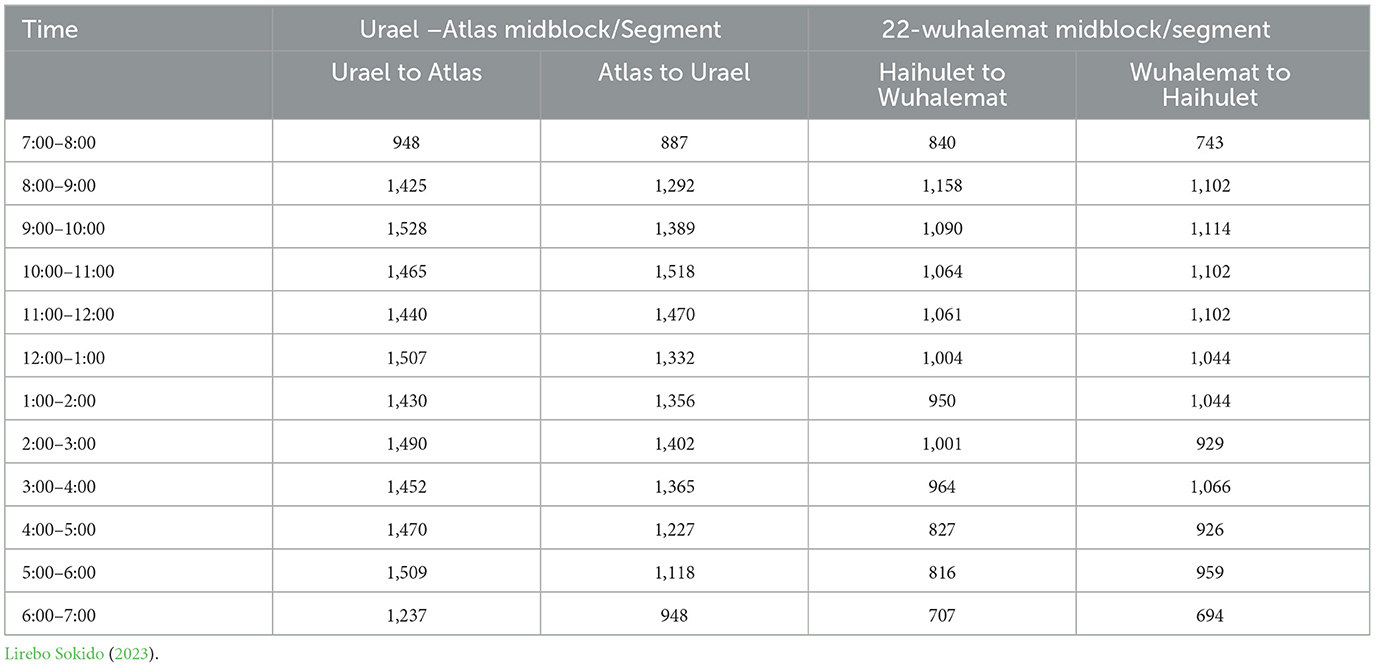
Table 4. Selected midblock's directional traffic volume per hour.
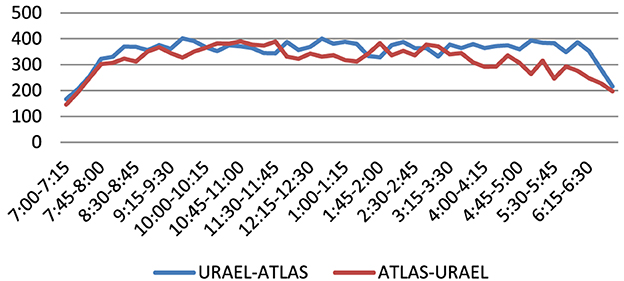
Figure 3. Traffic volume for Urael-Atlas Midblock (Lirebo Sokido, 2023).
The Figure 4 illustrates the various types of vehicles present at the Atlas—Urael midblock. When analyzing the distribution of vehicle types in both directions, the majority consists of car taxis, pickups, minibuses, and vans, accounting for 75.2% or 24,220 vehicles out of the total number of vehicles. However, the bus coverage from the total directional volume in both directions is only 1.64%.
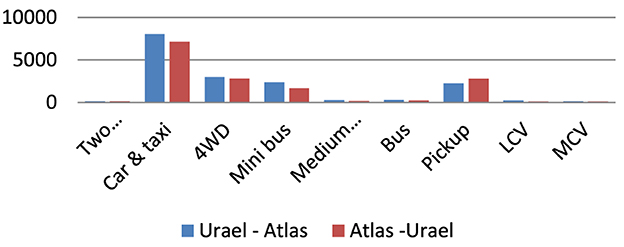
Figure 4. Traffic volume by vehicle types (Lirebo Sokido, 2023).
Haihulet to Wuhalemat midblock
The Haihulet – Urael midblock exhibits symmetrical directional flows in both opposite directions. The total daily directional flow for Haihulet to Wuhalemat is 11,482, while the flow from Wuhalemat to Haihulet is 11,667. The morning 7:00–8:00 and evening 6:00–7:00 time intervals experience the least amount of traffic flow in both directions. The traffic volume during the morning peak period is higher compared to the traffic volume during the evening peak period. Figure 5 displays the peak flow in the direction from Haihulet to Wuhalemat, occurring between 8:00 and 9:00 in the morning, with a value of 1,158.
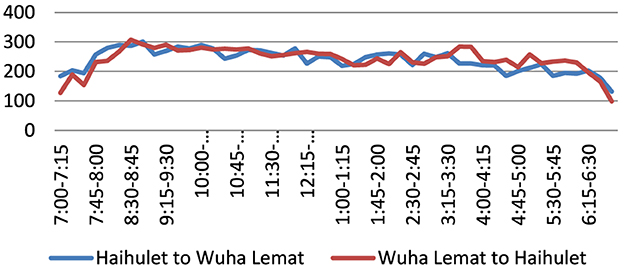
Figure 5. Traffic volume for Haihulet–Wuhalemat Midblock (Lirebo Sokido, 2023).
The proportion of two-wheeler transportation modes at the Haihulet–Wuhalemat midblock is only 1%. The data indicates that motorized transportation dominates the transportation sector. Based on the gathered data, the majority of vehicles at this midblock consist of cars and taxis, accounting for 39.35% and 42.52% of the Haihulet—Wuhalemat and Wuhalemat—Haihulet directional flows, respectively. Figure 6 displays the different types of vehicles present at the Haihulet–Wuhalemat midblock.
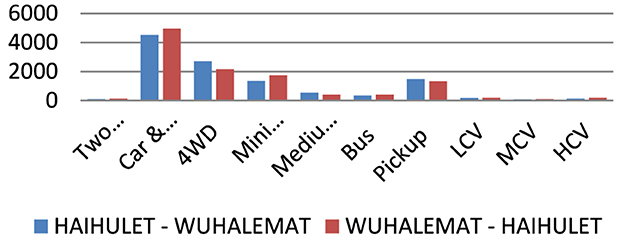
Figure 6. Traffic volume by vehicle types (Lirebo Sokido, 2023).
Level of service (LOS)
Intersections level of service (LOS) analysis
The level of service (LOS) at the chosen intersection was assessed using the SIDRA intersection software version 5.0. To ensure the accuracy of the results, the programme was installed with right-hand driving rules and HCM 2000 metric options, which are appropriate and compatible with Ethiopian driving rules. The HCM 2000 metric version was selected due to its global recognition as the widely accepted Highway Capacity Manual. The input data required for the analysis includes basic field measurements such as the number of lanes, lane width, median width, island diameter, circulating lane number and width. Additionally, directional traffic hourly flow data, number of pedestrians, peak hour factor, and heavy vehicle percentage are also needed. Nevertheless, input data for the analysis has utilized default values, such as a saturated flow rate of 1,900 vehicles per hour.
As a result of the availability of traffic flow data, a level of service (LOS) analysis was conducted on only two specific intersections: Intersection 1–Urael roundabout and Intersection 2–Haihulet roundabout (Figure 7). The input data for both selected intersections are summarized in Table 5 below. The total traffic volume encompasses all types of vehicles, including heavy vehicles. However, the heavy vehicles are treated separately when inputting data into the SIDRA intersection software programme.
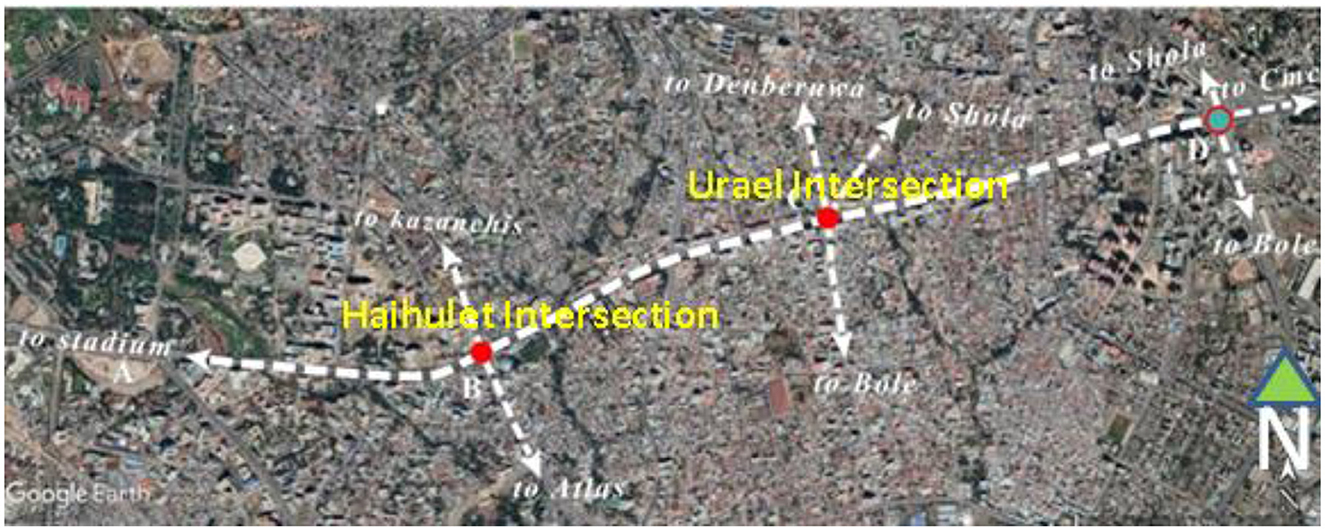
Figure 7. Showing Intersection 1–Urael roundabout and Intersection; 2–Haihulet roundabout (Google Earth, 2023).
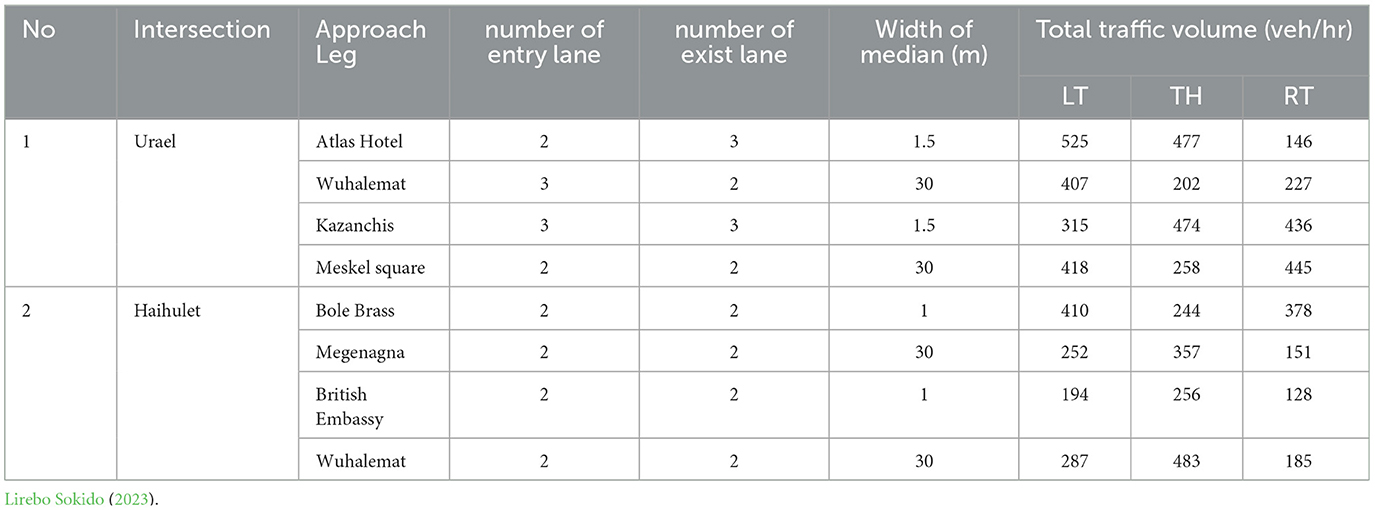
Table 5. Input geometric and traffic demand data.
The program's output data is summarized in Table 6 below. Based on the findings, all selected intersection approaches, except for Kazanchis and the British Embassy, are classified as having the lowest level of service.
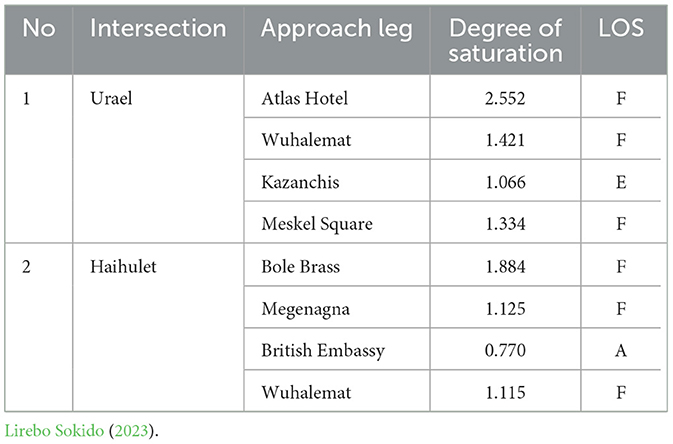
Table 6. Summary of output for level of service analysis for intersections.
Congestion analysis
Travel time
The travel time data was analyzed using the procedures outlined in the travel time data collection handbook (1998). The figure displays the average travel time of the selected road segments at 15-min intervals, represented by the number 19. The first chart (Figure 19) displays the average travel time for the road segments from Bole brass to Haihulet and from Haihulet to Bole brass.
The Haihulet segment of the Bole brass road is 225 m long
The Haihulet—Bole brass road segment measures 225 meters in length. The traffic flow at this road segment can be readily observed from the vantage point of a building with an adjusted height camera. The Figure 8 below shows the average travel time for the two opposite directional segments, namely Haihulet to Bole Brass and Bole Brass to Haihulet. The analysis indicates that the traffic flow on the Haihulet to Bole brass segment is more congested compared to the road segments from bole brass to Haihulet. The traffic on the Haihulet—Bole brass segment is more heavily congested compared to the Bole Brass-Haihulet segment. The average travel time of the Haihulet—Bole brass segment peak was recorded during the time intervals of 2:30–4:15. The Haihulet—Bole brass segment has a maximum travel time of 551.8 s and a minimum travel time of 30 s. The average travel time during the heavily congested time intervals (2:30–4:15) was observed to be 298.27 s.
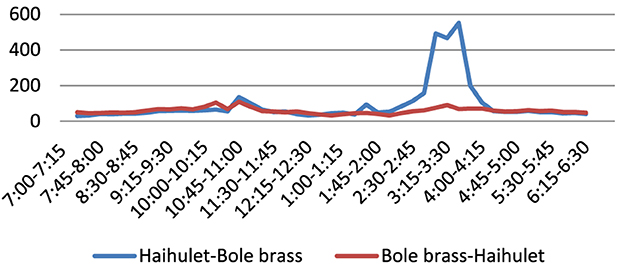
Figure 8. Average travel time (s) of Haihulet-Bolebrass and Bolebrass Haihulet road segment (Lirebo Sokido, 2023).
The road segment in the opposite direction of this one is the Bole Brass to Haihulet road segment. The average travel time at this road segment is comparatively shorter than the travel time at the Haihulet—Bole Brass road segment. During the time intervals of 9:00–11:15 in the morning and 2:45–4:30 in the afternoon, the average travel time exceeded 1 min. Specifically, the average travel time during these intervals was 80.11 s in the morning and 71.71 s in the afternoon. The highest average travel time is 108.9 s, which was recorded at 11:00 in the morning.
Kazanchis—Urael segment (150 m long)
The Kazanchis-Urael road segment has a length of 150 m. Various vehicles utilize these lanes to access Urael roundabout from Kazanchis. These vehicles have varying travel times when passing through specific road segments, as observed during the data collection period spanning from morning to evening. The travel time at selected road segments may vary from the desired travel time due to factors such as the volume of vehicles, road conditions, weather, and other causes of traffic congestion. The average travel time for the entry leg of the Urael roundabout from Kazanchis to Urael is indicated as Figure 9.
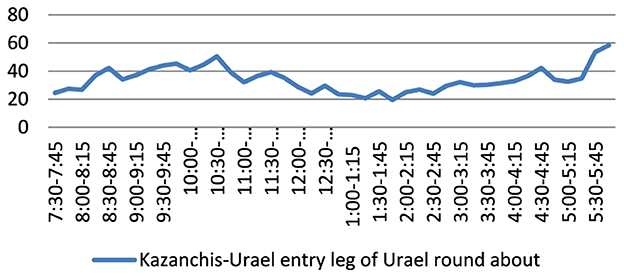
Figure 9. Average travel time (s) of Kazanchis—Urael entry leg of Urael roundabout road segment (Lirebo Sokido, 2023).
The average travel time increases during the time intervals of 8:15–12:00 in the morning and 3:00–6:00 in the afternoon. The highest travel time (58.3 s) was recorded during the evening rush hour at 6:00. The mean travel duration during the heavily congested morning and evening periods was 39.88 s and 33.92 s, respectively. Upon observing the outcome, it was evident that the morning session required more travel time compared to the evening session. The duration of the segment travel time is shorter at midday.
Average speed and travel rate
The Figure 10, displays the computed average velocity of the road segment from morning until evening hours. Between 3:15 and 4:00 in the afternoon, the average speed of the Haihulet—Bole brass dropped to below 5km/h. The average speed on the Haihulet—Bole brass, Bole Brass—Haihulet, and Urael—Kazanchis road segments is consistently below 15km/h. for duration of ~12 h. The Haihulet—Bole brass road segments have the lowest recorded speed of 1.5 km/h in the afternoon. On the other hand, the Kazanchis-Urael road segments have the highest recorded speed of 28.3 km/h. The Kazanchis—Urael leg has the highest recorded travel speed among the other segments during midday.
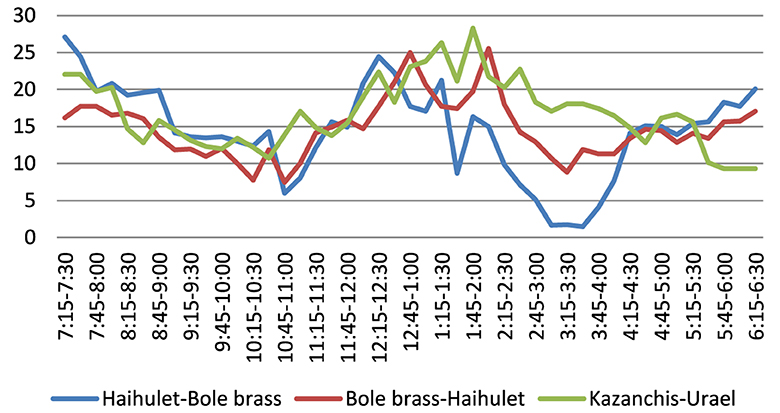
Figure 10. Average travel speed (km/h) (Lirebo Sokido, 2023).
The travel rate, measured in minutes per kilometer, is the speed at which a road segment is traversed. The travel speed for the Haihulet—Bole brass leg is the highest among all the other legs during the time interval of 1:30–4:15 in the afternoon. The travel rate at the Kazanchis—Urael entry leg of the Urael roundabout is lower compared to other segments (refer to Figure 11).
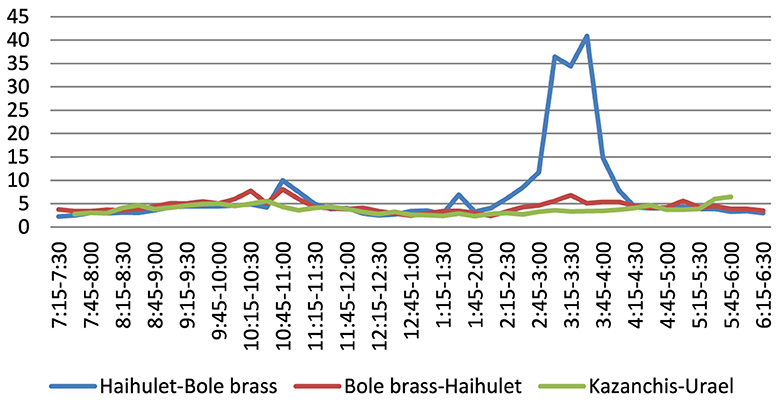
Figure 11. Average travel rate (min/km) (Lirebo Sokido, 2023).
Delay rate, delay ratio and delay per traveler
Delay is a crucial metric for measuring congestion and can be comprehended by both technical and non-technical users with ease. To analyze the delay rate, delay ratio, and delay per traveler, we refer to the daily minimum travel rate or the travel time during the period of highest speed, which is considered as the acceptable or free flow condition. Lomax (1997) considered the travel rate at an uncongested state to be an acceptable travel rate. Delay refers to the additional amount of time it takes to travel compared to the expected or unrestricted travel time. Traffic congestion ratio measures are typically created by dividing one element of travel time or delay by another. Lomax (1997) developed several ratio measures, including delay rate, relative delay rate, and delay ratio, which were based on travel rate (Aftabuzzaman, 2007).
The delay rate is calculated as the discrepancy between the actual travel rate and the acceptable travel rate. Figure 12 displays the delay rates for the segments “Haihulet”—”Bole Brass”, “Bole Brass”—“Haihulet”, and “Kazanchis”—“Urael”. The segment with the highest delay rate was observed in the afternoon between the 'Haihulet' and 'Bole Brass' areas, specifically from 2:30 to 4:15. The peak delay rate reached 38.67 min per kilometer and was observed at 3:30. In the morning, the peak delay rate is 7.77 min per kilometer. The analysis indicates that the segment with the highest delay rate, known as “Bole Brass”—“Haihulet”, experienced its peak delay at 10:45 in the morning. Similarly, the segment “Kazanchis”—“Urael” had its highest delay rate during the peak hour at 5:45 in the afternoon.
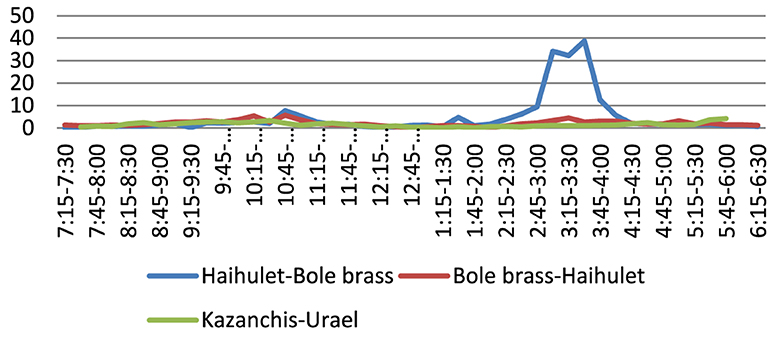
Figure 12. Delay rate (min/km) (Lirebo Sokido, 2023).
The delay ratio can be determined by dividing the delay rate by the actual travel rate. It is utilized to assess the relative levels of traffic congestion on various roadways. The figure (Figures 4, 10) displays the delay ratio for the road segments “Haihulet”—“Bole Brass”, “Bole Brass”—“Haihulet”, and “Kazanchis”—“Urael”. The majority of delay ratios observed at these road segments fall within the range of 0.4 to 0.6. The “Kazanchis”-“Urael” road segment exhibited the lowest delay ratio, with most of the day sections falling within the range of 0–0.4. Figure 13 show that the midday hours have the lowest delay ratio. The highest delay ratio was observed during the afternoon session at the road segments between “Haihulet” and “Bole brass”. Only these segments have delay ratios that exceed 0.8.
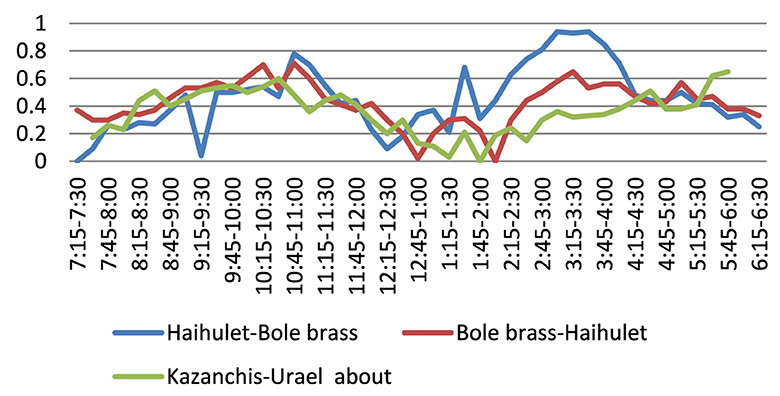
Figure 13. Delay ratio of all the selected road segments (Lirebo Sokido, 2023).
The delay per traveler is determined by calculating the amount of time lost by commuters over the course of 250 working days. Comparing one segment to another segment is challenging due to variations in segment length. Upon observing the delay in the 225 m Haihulet—Bole brass road segments, it was found that an individual who uses these segments once daily at 3:00 pm experiences a loss of 32.1 h per year. This equates to 1.33 days per year being negatively impacted by congestion (refer to Figure 14).
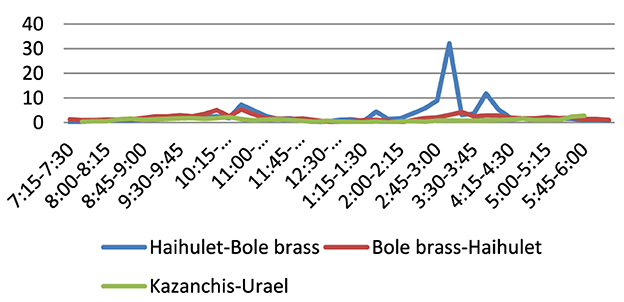
Figure 14. Delay per traveler (Lirebo Sokido, 2023).
Total segment delay
The measure of congestion intensity is determined by the total segment delay, which is quantified in terms of Vehicle-min and/or Person-hour. It quantifies the level of congestion and the impact it has on individuals. Figure 15 displays the cumulative delay experienced by vehicles in minutes for the chosen segment.
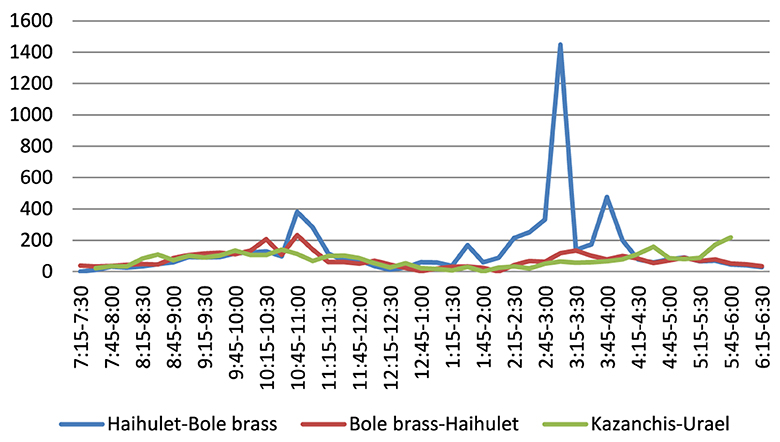
Figure 15. Total segment delay (Lirebo Sokido, 2023).
The total segment delay results of the three selected segments were divided by their respective segment lengths and the delay was converted to a unit length delay. The converted data can be readily compared to the delay of other units of length. Figure 16 displays the density of total segment delay in terms of vehicle-minutes per meter. Figure 15 above shows that the congestion severity at the Haihulet—Bole brass is highest at 3:30 in the afternoon. The congestion severity at this segment is 12–15 times higher than the congestion severity at the same time in other segments. The congestion severity at 3:30 in the afternoon is 0.52 in Haihulet and 0.43 in Kazanchis-Urael. The most severe congestion at the Kazanchis—Urael intersection occurs during the evening peak hour, starting at 5:30 PM. The Kazanchis—Urael road segments experienced the most severe congestion during morning and evening peak hours. However, the Haihulet—Bole brass road segment recorded the highest congestion severity between 12:45 and 4:15.
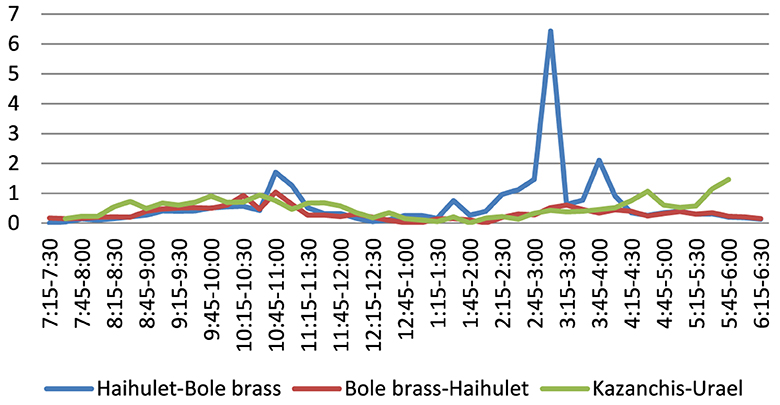
Figure 16. Total segment delay density (veh-min)/meter (Lirebo Sokido, 2023).
Cause of congestion
Urban areas currently face significant challenges, with traffic congestion being one of the most prominent. Aworemi and Abdul-Azeez (2009) identified five factors that influence the smooth flow of traffic. However, the causes of congestion vary depending on factors such as population size, infrastructure condition, driver behavior, and other related factors. This study aims to investigate the underlying factors contributing to traffic congestion at the Urael and Haihulet intersections. Both of the chosen intersections are located along the east-west corridor of Addis Ababa, which is the route where the Addis Ababa light rail transit (AALRT) passes. The researcher employed on-site observation and questionnaires to examine the underlying factors contributing to traffic congestion at the chosen intersection. The site observation commenced at 7:00 am in the morning and concluded at 7:00 PM in the evening. The purpose of the questionnaire is to ascertain the road users' perception regarding the factors contributing to traffic congestion at the Urael and Haihulet intersection.
Figures 17, 18 below clearly demonstrate that the primary factors contributing to traffic congestion at the chosen intersection are significant pedestrian activity and insufficient walkways, the impact of AALRT, on-street parking, a high volume of vehicles, inadequate mass transportation, ineffective traffic management, and driver misconduct. Based on site observation, it is observed that public transportation such as taxis and buses utilize a location near an intersection as a “fermata” or stop point (refer to Figures 17, 18). The improper placement of taxi and bus stops significantly disrupts the smooth flow of traffic at intersections. These stops require additional space for loading and unloading passengers, causing congestion and hindering other vehicles when changing lanes. The primary factors contributing to congestion, as reported by the respondents, are a significant number of vehicles, a narrow road, and insufficiently sized walkways. These factors account for 60.81%, 52.7%, and 39.18% of the congestion, respectively.
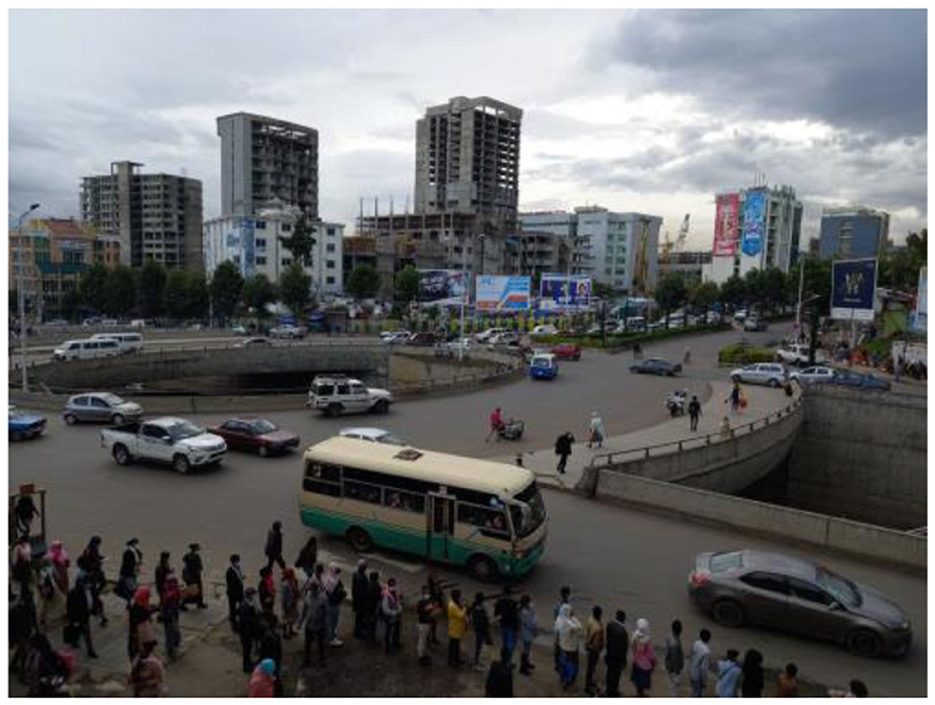
Figure 17. Urael—Haihulet bus and taxi stop point (Lirebo Sokido, 2023).
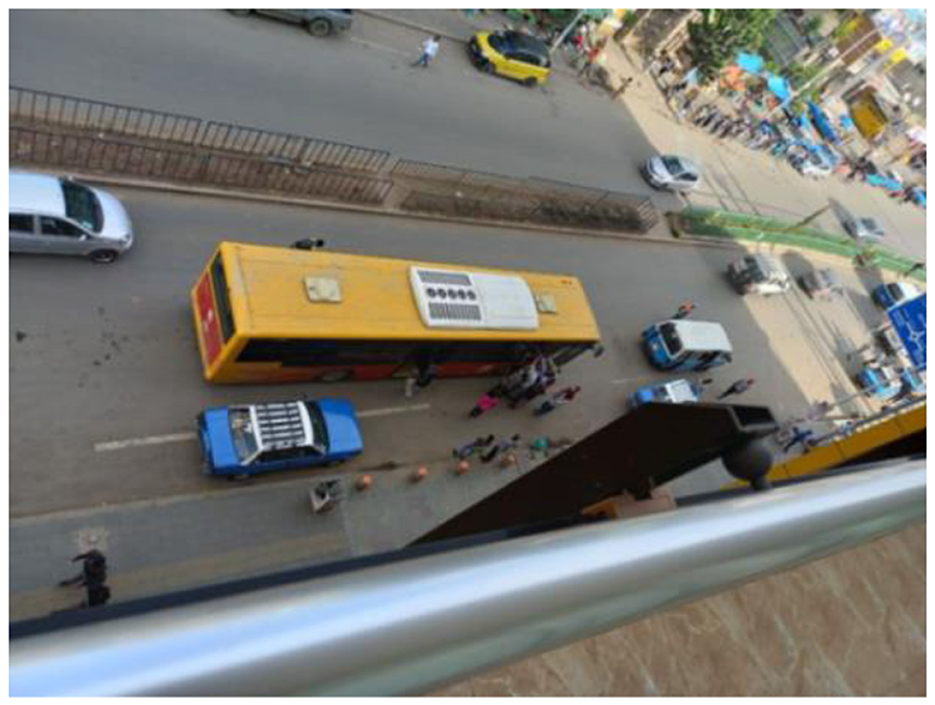
Figure 18. Haihulet—Bolebrass bus and taxi stop point (Lirebo Sokido, 2023).
Inadequate pedestrian walkways; the city lacks sufficient and secure pedestrian infrastructure, resulting in inadequate walkways for pedestrians. According to the Addis Ababa city structural plan 2017-2027 report, more than half (53%) of the streets in the city core lack sufficient pedestrian facilities. The same issue arises at this particular intersection, as there is a lack of suitable pedestrian infrastructure, resulting in pedestrians being compelled to use the roadway and causing disruptions to the flow of traffic. For instance, when we observed the 'Haihulet - Bolebrass' pedestrian pathway, we found it to be insufficient, and the remaining pedestrian walkways are occupied by vendors located along the street. The insufficient pedestrian infrastructure is a contributing factor to the traffic congestion at this particular intersection.
Street parking contributes to traffic congestion at both selected intersections. The Urael and Haihulet area experience significant levels of commercial and social activities. Nevertheless, the parking area is insufficient to accommodate the parking needs. Commuters are compelled to utilize on-street parking, both temporarily and for extended periods, due to the insufficient availability of suitable off-street parking facilities (refer to Figure 19). Street-side parking significantly hampers road capacity, disrupts pedestrian and vehicular flow, and exacerbates traffic congestion.
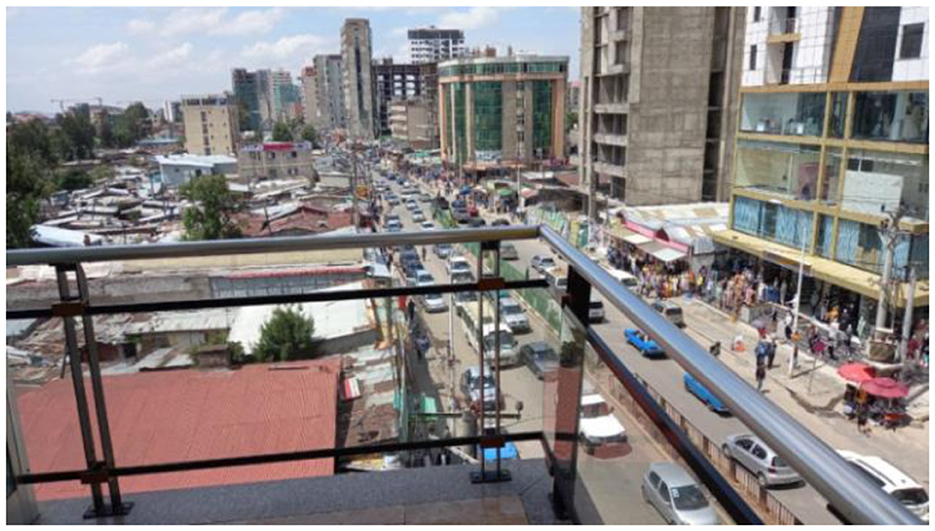
Figure 19. On street parking at Bolebrass approach (Lirebo Sokido, 2023).
Inadequate transport infrastructure, the mass transportation system in Addis Ababa continues to offer inadequate service to customers, primarily due to various factors. Consequently, the roads of Addis Ababa are congested with vehicles that have low passenger occupancy. The abundance of vehicles necessitates additional space for maneuvering and diminishes road capacity.
Conclusion and recommendation
Conclusion
The traffic congestion at the chosen intersection is significant. The total vehicle-minute delay for the selected three segments is estimated to be approximately 12,708 vehicle-minutes (equivalent to 212 vehicle-hours or 27 vehicle-days). As a result of the high volume of traffic in this area, approximately 27 vehicles remain unused for the entire day. Merely There are 13 vehicles at the “Haihulet”—”Bole Brass” intersection that remain idle for the entire day. These three segments experience a loss of 19,495 minutes per year or 324.9 hours per year due to traffic congestion. During the peak hours, the travel speed of the segment will be reduced to a maximum of 1.5 kilometers per hour. According to the Highway Capacity Manual (HCM) 2000, the selected intersections are operating above their capacity in terms of level of service. However, the British embassy and “Kazanchis” approaches are the only ones with a level of service F, while all other approaches have the same level. The primary factors contributing to traffic congestion at these specific intersections include a significant influx of vehicles, a large number of pedestrians with insufficient walkways, bus and taxi stopping points, on-street parking, inadequate public transportation, subpar traffic management systems and reckless driving behavior by motorists. The presence of AALRT at the “Urael” intersection contributes to traffic congestion, as it attracts a large number of people traveling to and from the AALRT ‘Urael' station.
Prior to, the study also asserts that optimizing efficiency in transport networks is a primary focus of transport policy at the Addis Ababa level, as indicated in the study. The links within the Addis Ababa road transport network at various intersections differ greatly in terms of the amount of transport they handle. As a result, they experience varying levels of capacity utilization and congestion. Statistics, such as the number of vehicles on the road, are not easily accessible and are typically provided as an average daily traffic count (AADT) on an annual basis. The available data does not provide a means to quantitatively assess congestion levels, as congestion tends to occur primarily at a few specific nodes and links for short durations.
The methodology utilized in this study enables the measurement and monitoring of road congestion in Addis Ababa by utilizing data from selected intersections' in-vehicle navigation systems. This approach relies on analyzing a substantial dataset of actual vehicle speeds recorded on each road segment. By employing algorithms, it enables the calculation of congestion indicators for specific road types during specific time intervals. The results encompass a comprehensive analysis of recurring traffic congestion, both in terms of its geographical distribution and temporal patterns. Additionally, the study includes a comparison of the performance of road networks across various segments. The data utilized comprises actual speed measurements obtained from in-vehicle navigation systems, collected during various time periods and days of the week. The abundance of “probes” provides a precise and comprehensive depiction of the real driving conditions throughout the road network in Addis Ababa. The collected data is organized into clusters of speed profiles, which depict variations in average speed patterns along a road segment at five-minute intervals throughout a 24-h period. Every road link is assigned a distinct speed profile for each day of the week. One can compare the average speed on a particular link during a specific time period to the estimated benchmark speed for the link under normal traffic conditions or against specific threshold values. Consequently, it is possible to measure and compare congestion indicators for various time periods across different links, regions, and countries. The methodology has the potential to be beneficial for policy formulation in the transport sector through a range of applications:
• Analyzing traffic congestion and tracking its changes over time by comparing the extent and pattern of congestion at two distinct time periods.
• This study examines the utilization of congestion indicators in European transport policy. It compares the average congestion levels during peak hours with those during wider time periods. The study also aims to identify measures that can enhance the temporal distribution of congestion.
• Integration of congestion indicators and traffic counts to enhance speed flow curves utilized in transport network models
• The key conclusion of the study is that congestion primarily impacts urban areas and key bottlenecks in Addis Ababa. The results additionally indicate that congestion often arises due to insufficient road infrastructure capacity and inadequate traffic management systems.
• Mapping traffic congestion and tracking its changes over time by comparing the level and distribution of congestion at two different time points. This would facilitate the detection of bottlenecks in the road network, the examination of strategies to prevent congestion, and the monitoring of the advancement.
• This study examines the utilization of congestion indicators in Ethiopian transport policy. It compares the average congestion during peak hours with congestion during other time periods and identifies strategies to enhance the temporal distribution of traffic. Such analysis can assist in determining the effectiveness and implementation of demand management measures, as well as in estimating the appropriate levels and durations of congestion charging.
• Integrating congestion indicators with traffic counts to enhance the accuracy of speed flow curves employed in transport network models. In addition to facilitating the monitoring of traffic flows, this combination can also be valuable for predicting the future development of congestion and anticipating potential new bottlenecks.
Recommendations
• This study conducted a traffic volume count for each intersection on a single day, as a result of budget constraints. Hence, it is advisable to allocate a minimum of 7 days for the purpose of accurately measuring traffic volume.
• The city municipality, ministry of transport, policy makers, and other stakeholders should prioritize the implementation of a traffic congestion charge. This measure aims to reduce traffic congestion, mitigate environmental impact, increase street capacity, and improve public transport in the city.
• The street capacity can be increased by implementing off-street parking and vertical parking space. Additionally, relocating the bus and taxi stop point away from the intersection can help reduce congestion caused by the current placement of these stops and on-street parking. Design recommendations are presented on the following pages.
• Policy makers should prioritize the implementation of modern traffic management systems, such as smart, digital, or intelligent transportation systems, and establish a dedicated traffic management center.
• Implementing sustainable urban and transport planning solutions (“Avoid”) to reduce congestions
○ Creating “green” corridors that combine the advantages of environmental corridors with opportunities for active mobility.
○ Orienting urban development toward high-capacity green, safe, healthy and high-quality public transport systems.
○ Ensuring that spatial and urban planning guidelines and policies primarily focus on the accessibility needs of the entire population, including vulnerable users, in particular children and youth, as well as senior citizens and persons with reduced mobility.
• Putting effective, high-quality and safe public transport at the center of mobility (“Shift” and “Improve”) by reducing traffic congestions:
○ Prioritize the development of public transport. The provision and use of high quality and attractive public transport services should be an integral part of wider planning for recovery, resilience and sustainable urban mobility, to integrate transport, health and environmental objectives into urban and spatial planning policies.
○ Plan public transport services around passenger needs and expectations to ensure a system that is attractive to users and that integrates services, modes to provide a reliable, affordable, easily accessible, safe and comprehensive door-to-door network.
• The city administration and policy makers should prioritize the promotion and creation of favorable conditions for non-motorized transportation. Additionally, See Figure 20 design solutions above.
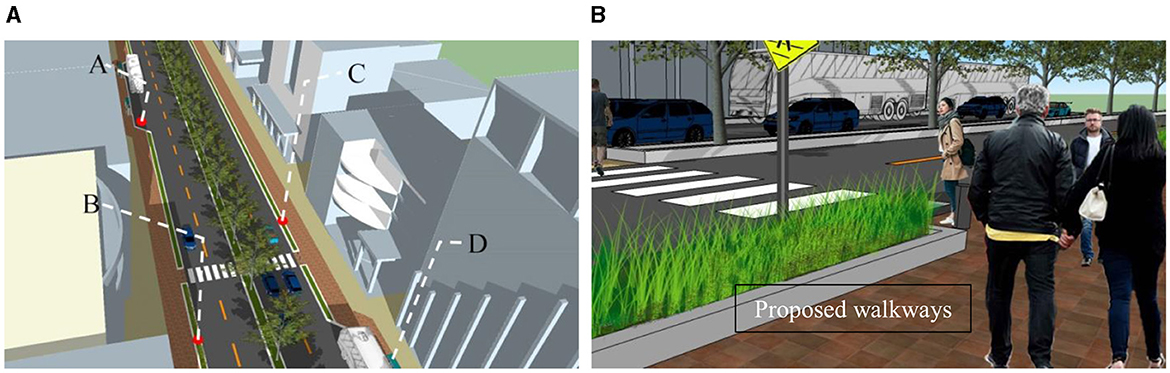
Figure 20. Design solutions. (A) Proposed bus and taxi stop point. (B) Proposed greenery to separate walkway and street. (C) Proposed walkway and (D) proposed bus and taxi waiting area design. Images created using Lumen https://lumion.com/news/lumion-11-5-release.
Data availability statement
The original contributions presented in the study are included in the article/Supplementary material, further inquiries can be directed to the corresponding author/s.
Ethics statement
Ethical review and approval was not required for the study on human participants in accordance with the local legislation and institutional requirements. Written informed consent from the [patients/ participants OR patients/participants legal guardian/next of kin] was not required to participate in this study in accordance with the national legislation and the institutional requirements.
Author contributions
DS: Conceptualization, Data curation, Investigation, Methodology, Supervision, Writing—review & editing, Formal analysis, Funding acquisition, Project administration, Resources, Software, Validation, Visualization, Writing—original draft.
Funding
The author(s) declare that no financial support was received for the research, authorship, and/or publication of this article.
Conflict of interest
The author declares that the research was conducted in the absence of any commercial or financial relationships that could be construed as a potential conflict of interest.
Publisher's note
All claims expressed in this article are solely those of the authors and do not necessarily represent those of their affiliated organizations, or those of the publisher, the editors and the reviewers. Any product that may be evaluated in this article, or claim that may be made by its manufacturer, is not guaranteed or endorsed by the publisher.
Supplementary material
The Supplementary Material for this article can be found online at: https://www.frontiersin.org/articles/10.3389/frsc.2024.1366932/full#supplementary-material
References
Abeje, W. (2012). Sustainable Urban Mobility Planning for Coping Challenges of Urban Transportation in the Fast Urbanizing Ethiopia. Addis Ababa: Addis Ababa University.
Afrin, T., and Yodo, N. (2020). A survey of road traffic congestion measures towards a sustainable and resilient transportation system. Sustainability 12, 4660. doi: 10.3390/su12114660
Aftabuzzaman (2007). Measuring Traffic Congestion—A Critical Review. Melbourne, VIC: Melbourne Polytechnic Melbourne.
Altshore, A. (1977). The changing pattern policy. The decision making environment of urban transportation. Public Policy 25, 171–203.
Amselati, A. S. I., Atiq, R., Rahmat, O. K., and Jaafar, O. (2011). An overview of urban public transport in Malaysia. J. Soc. Sci. 6, 24–33.
Aworemi, J. R., and Abdul-Azeez, I. F. (2009). A study of the causes, effects, and ameliorative measures of road traffic congestion in Lagos metropolis. Lagos State University, Lagos, Nigeria.
Berisha, B. (2016). Alleviating Traffic Congestion in Prishtina. Rochester, NY: Rochester Institute of Technology.
Bigazzi, A. Y., and Clifton, K. J. (2015). Modeling the effects of congestion on fuel economy for advanced power train vehicles. Transp. Plan. Technol. 38, 149–161. doi: 10.1080/03081060.2014.997449
Bireda, T. (2018). “Intelligent transport system in ethiopia: status and the way forward,” in Information and Communication Technology for Development for Africa ICST Institute for Computer Sciences, Social Informatics and Telecommunications Engineering (Addis Ababa University, Addis Ababa, Ethiopia).
Bogale, Y. A. (2012). Evaluating Transport Network Structure: Case Study in Addis Ababa, Ethiopia. Enschede: University of Twente.
Chakrabartty, A., and Gupta, S. (2012). Estimation of congestion cost in the city of Kolkata—a case study. Curr. Urban Stud. 3, 2. doi: 10.4236/cus.2015.32009
Deme, D. (2019). Road traffic accident in Ethiopia from 2007/08-2017/18 (Since Ethiopia Millennium). Am. Int. J. Sci. Eng. Res. 2, 49–59. doi: 10.46545/aijser.v2i2.90
ECMT (2007). European Conference of Ministers of Transport. Managing Urban Traffic Congestion. Summary Report. Rotterdam: Transport Research Center.
Fantahun, T. D. (2012). Integrating Public Transport Networks and Built Environment: The case of Addis Ababa and Experiences from Stockholm. Stockholm: KTH-Royal Institute of Technology.
Fattah, S. R. M., and Morshed, S. R. (2021). Assessing the sustainability of transportation system in a developing city through estimating CO2 emissions and bio-capacity for vehicular activities. Transp. Res. Interdiscip. Perspect. (2021) 10, 100361. doi: 10.1016/j.trip.2021.100361
Gartner, N., Messer, C. J., and Rathi, A. K. (2001). Traffic Flow Theory: A State-of-the-Art Report. University of Massachusetts Lowell, United States.
Google Earth (2023). A Complete Google Earth Pro Beginner's Guide in 2023. #googleearth #spatialdata.
Higgns, C. D., Sweet, M. N., and Kanaroglou, P. S. (2017). All minutes are not equal: travel time and the effects of congestion on commute satisfaction in Canadian cities. Transportation 45, 1249–1268.
Highway Capacity Manual (HCM) (2000). Transport Research Board And National Academic Of Science, 4th Edn. Washington, DC.
Jain Vazirani, N. (2010). Competencies and competency model-a brief overview of its development and application. SIES J. Manage. 7, 121–131.
Kasa, L., Zeleke, G., Alemu, D., Hagos, F., and Heinimann, A. (2011). Impact of Urbanization of Addis Abeba City on Peri-Urban Environment and Livelihoods. Environmental Science and Geography, Addis Ababa University, Addis Ababa, Ethiopia.
Kvale, S. (1996). InterViews: An Introduction to Qualitative Research Interviewing. Thousand Oaks, CA: Sage.
Levinson, H. S. (2015). “Overview of the causes of congestion,” in Road Traffic Congestion: A Concise Guide. Cham: Springer.
Lirebo Sokido, D. (2023). Questionnaire Survey, Interview and Observation, Field Survey, 2023 at Selected Intersections. Addis Ababa.
Mekonnen Ayehu, F. (2015). Evaluation of Traffic Congestion and Level of Service at Major Intersections in Adama City (Unpublished MSC Thesis). Addis Ababa University, Addis Ababa, Ethiopia.
Nallet, C. (2018). The challenge of urban Mobility: A case study of Addis Ababa Light Rail, Ethiopia. Melbourne: Notes de Nord.
NCHRP (2019). The National Cooperative Highway Research Program, Collaborative Efforts of the Federal Highway Administration. Washington, DC: Transportation Research Board.
OICA (2016). World Vehicles in Use: By Country and Type 2005-2013. The International Organization of Motor Vehicle Manufacturers (OICA). Retrieved from: http://www.oica.net/category/vehicles-in-use/Oak_Ridge_National
Provonsha, E., and Sifuentes, N. (2017). “Road pricing in London, Stockholm and Singapore a way forward for New York city,” in Tri-State Transportation Campaign Mobilizing the Region (New York, NY: State of New York Metropolitan Transportation Authority).
Rao, M., and Rao, K. R. (2012). International Journal for Traffic and Transport Engineering (IJTTE). Sci. Acad. Publ. 2, 286–305.
Sitotaw, S. S. (2019). Assessing Socio-Economic Impact of Road Traffic Congestion in Addis Ababa City in Case of Megenagna to CMC Michael Road Segment. Addis Ababa: Addis Ababa University.
Solanke, M. O. (2013). Challenges of urban transportation in Nigeria. Int. J. Dev. Sustain. 2, 891–901.
Soubbotina, T. P. (2004). Beyond Economic Growth, Second Edition, An Introduction to Sustainable Development. Saint Petersburg State University Russia.
Taddesse, W. (2011). Assessing & Quantifying the Level of Traffic Congestion at Major Intersections in Addis Ababa (Masters thesis). Addis Ababa University, Ethiopia.
Taiwo Ajala, A. R. (2016). Traffic Management Strategies & Best Practices. Abeokuta: Gbenga Gbesan Associates.
Weisbrod, G., Vary, D., and Treyz, G. (2001). Economic Implications of Congestion. Washington, DC: Transportation Research Board, National Research Council.
Keywords: transport, traffic congestion, level of service, traffic management, intersections, Addis Ababa
Citation: Sokido DL (2024) Measuring the level of urban traffic congestion for sustainable transportation in Addis Ababa, Ethiopia, the cases of selected intersections. Front. Sustain. Cities 6:1366932. doi: 10.3389/frsc.2024.1366932
Received: 07 January 2024; Accepted: 05 February 2024;
Published: 03 April 2024.
Edited by:
Cesáreo Fernández, University of Jaume I, SpainReviewed by:
Zeynep Arda, Izmir University of Economics, TürkiyeMireia Faus, University of Valencia, Spain
Copyright © 2024 Sokido. This is an open-access article distributed under the terms of the Creative Commons Attribution License (CC BY). The use, distribution or reproduction in other forums is permitted, provided the original author(s) and the copyright owner(s) are credited and that the original publication in this journal is cited, in accordance with accepted academic practice. No use, distribution or reproduction is permitted which does not comply with these terms.
*Correspondence: Daniel Lirebo Sokido, daniel.lirebo@ecsu.edu.et