Unveiling transportation disparities: investigating accessibility gaps in metropolitan cities using GIS—a case study of Alexandria, Egypt
 Sally ElDeeb
 Rowan Adel Abd EL-Baky
 Houshmand Masoumi
- 1Architectural Engineering and Environmental Design Department, College of Engineering, Arab Academy for Science and Technology and Maritime Transport, Alexandria, Egypt
- 2Center for Technology and Society, Technische Universität Berlin, Berlin, Germany
- 3Department of Transport and Supply Chain Management, University of Johannesburg, Johannesburg, South Africa
Introduction: Public transportation is essential to reduce pollution and traffic congestion in urban areas. However, in densely populated regions like Alexandria, characterized by high population density and limited road infrastructure, accessibility to diverse transportation options is crucial.
Methods: This study investigates the accessibility of public transportation modes, including railways and buses, and their interaction with informal transit. Questioning if public transportation alone will be sufficient for pedestrians or if the presence of informal transit is crucial, and whether all residents of Alexandria have their rightful accessibility for different transport modes, the goal was to establish an efficient and interconnected transportation network. A survey was conducted in cooperation with Transport for Cairo to investigate all transport routes throughout Alexandria, further using ArcGIS Pro to identify gaps in public transportation coverage.
Results: Findings revealed that public transportation alone is insufficient due to limited bus and railway coverage because of their fixed linear routes. Informal transit, like microbuses, plays a vital role in filling these gaps.
Discussion: The study emphasizes the need for a comprehensive and sustainable transportation network that considers both formal and informal transit. These insights can guide policymakers and urban planners in improving public transportation in Alexandria and similar cities worldwide.
1 Introduction
Demand for mobility has increased as a result of population growth. Insufficient transportation infrastructure results in longer wait times and more traffic congestion on the roads (Saif et al., 2018). “Door-to-door mobility” can make public transit more appealing, and the expansion of transportation services is a crucial component of social quality (Jackiva et al., 2017). Accessibility is one of the most important outcomes of the transportation system and is defined as the efficiency with which a certain area or location may be reached (Bocarejo and Oviedo, 2012). In order to reduce traffic on the roads, the main objective of the public transportation accessibility assessment is to improve connectivity between individuals and destinations (Weber, 2003). In other words, having a well-organized transportation system will increase a city’s mobility level.
In order to create a user-friendly public transportation system, transportation stops, connectivity between modes of transportation, and system mobility should be taken into account (Cheng and Chen, 2015), moreover, the distance individuals should walk when using public transportation is a crucial accessibility element (Truden et al., 2022). In metropolitan environments, 5 min of walking—or 400 m in terms of walking distance—is considered acceptable based on an approximated average walking speed of approximately 0.3 m/s (Foda and Osman, 2010; Saif et al., 2018). The distance between a destination and a transportation station or the time it takes to get from an origin to a destination by public transportation can be used to assess accessibility (Cheng and Chen, 2015).
Furthermore, the last mile problem which refers to the difficulty of transporting individuals from transportation hubs to their ultimate destinations, such as the short walk from the closest bus or train station to their workplace. As this distance exceeds a quarter mile (400 m), our inclination to utilize public transportation declines (Campbell, 2023), access should be insured for residents to the initial and final stops of public transport, (so-called final stops) as it is crucial. In highly developed nations, bike-sharing systems have proven to be highly successful in fulfilling this role (Macioszek and Cieśla, 2022), besides using public scooters as it showed success (Macioszek et al., 2023), as public scooters were tested in parts in Alexandria, and had succeeded in filling some gaps of transport.
On the other hand, there are six basic types of public transportation accessibility that can be made as mentioned by Truden et al. (2022), travel time and distance, travel time and cost, integral accessibility, time geography, utility-based accessibility, and relative accessibility—which is a function of cost, time, convenience, and safety (Chekmareva et al., 2023). These six types can be generally classified into three primary groups: access to public transportation stops, the length of a trip by public transportation, and access to a destination using public transportation modes (Mavoa et al., 2012; Truden et al., 2022).
GIS-based transport accessibility is computed by ArcGIS pro analysis tools to assess accessibility based on access to transportation stops, and to identify areas that are beyond walking distance of these stops. This approach uses origin-based accessibility, considering the stops and the routes of transportation as the origins. The expected outcome of this process is to identify gaps between different public transportation modes throughout the city.
The transportation map of Alexandria was collected through a group analysis conducted by Transport to Cairo Institute in cooperation with students of AAST (Transport for Cairo, 2023), in order to make the first collective map of all transportation methods in Alexandria, this data, along with the addition of the existing tram railway and new surface metro stops, were used to create the complete map of transportation in Alexandria (Figure 1).
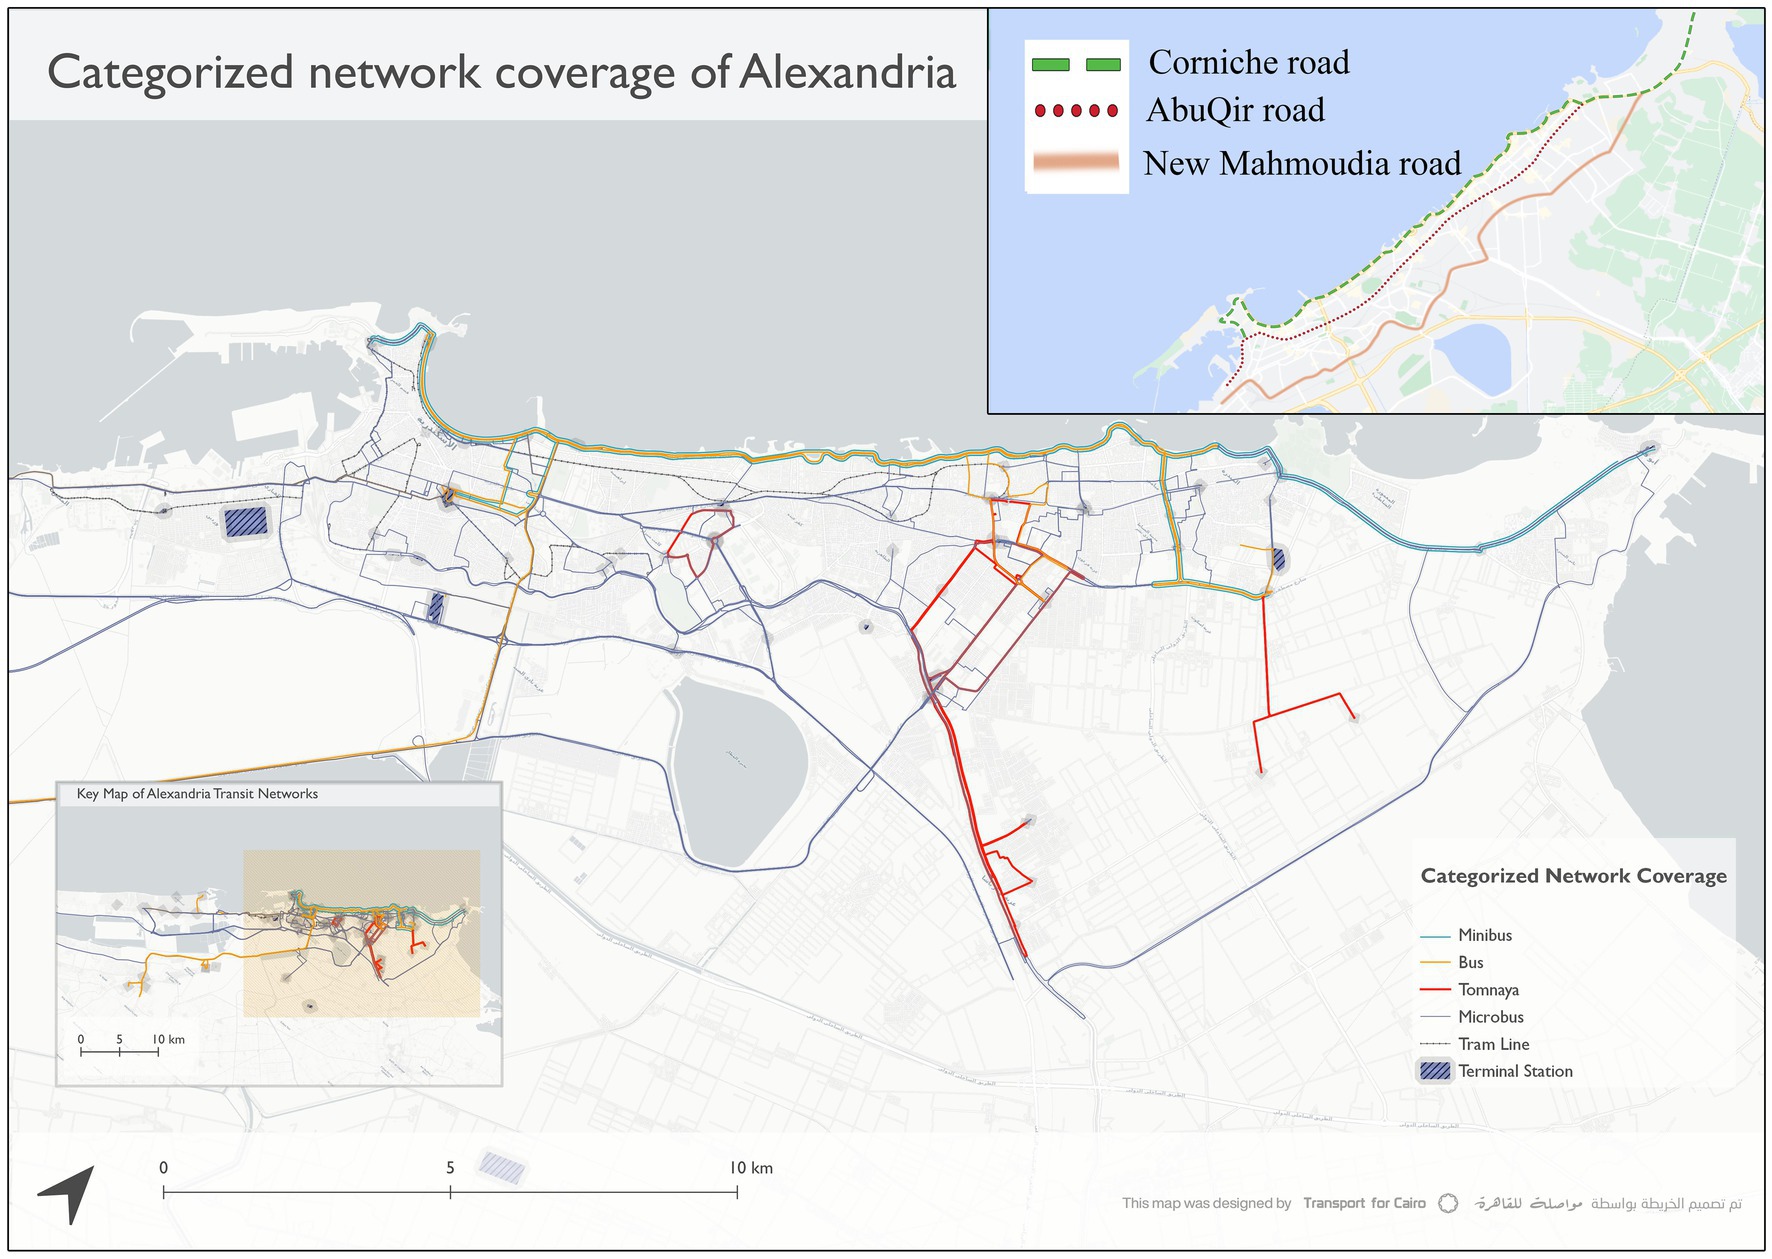
Figure 1. Map of public transportation in Alexandria. Source: The World Resource Institute and Transport for Cairo.
This paper aims to evaluate the accessibility of the entire chain of public transportation services, as well as other forms of mass transportation in the study area, based on the walking distance required to reach each of them. Additionally, it aims to find new routes for transportation services in order to reach all the residents and fill the identified gaps.
This has been studied in the metropolitan city of Alexandria, which is serviced by a train, tram, minibus, and bus network for public transportation, as well as microbuses and minibuses, which are informal transport means with fixed routes supervised by the government. Background information is provided in the following section. The methodology, which explains how the index is computed, is introduced in Section 3. Section 4 presents the analysis and outcomes of the ArcGIS application that was used for the analysis in the city, while Sections 5 and 6 discuss and summarize the results and suggest directions for additional study.
1.1 Background
Alexandria is a metropolitan city with an area of 1,661 km2 and a population of five and a half million people (United Nations, 2023), it is the second largest city in Egypt, and the largest city on the Mediterranean coast. The city of Alexandria is planned linearly with only three parallel arterial roads (the Corniche Road, Abu Qir road, and the new Mahmoudia road). As a result, traffic is a daily problem during rush hours, especially due to the car dependency of residents. The public transportation network does not adequately meet their needs, besides that there are areas that lack any means of public transportation.
On the other hand, the government aims to replace the old train railway with a surface metro to decrease traffic. Additionally, there are plans for the development of the old tram railway. However, despite the advantages of these projects, the developments follow the same path as the old railways, and the existing gaps are not analyzed or fixed.
Alexandria, as a metropolitan city, suffers from traffic, in spite of the fact that only 7% of the residents have a private car (CEIC, 1995). Traffic is still severe in rush hours, although the government’s new development of the old tram line and the new surface metro, which will replace the old train line, still poses challenges as these routes are all linear lines in the city that are parallel to the sea line (Egypt’s Projects Map, 2023a), which creates a lot of gaps in the middle, making it difficult for residents to access them.
A user-friendly public transportation system should take into consideration the accessibility of the stations and the mobility of the system (Cheng and Chen, 2015). Accessibility is a crucial factor that controls the choice of residential location, as the most expressed factor influencing residents’ decisions in choosing their home places appears to be “availability of public transit” (Ibrahim, 2017) as people tend to live in inadequate informal housing near public transportation rather than adequate housing outside the city without public transportation.
On the other hand, due to urban sprawl, informal settlements have emerged in the south of the city, with no accessibility for public transportation. This forces residents to walk longer distances to reach transit options (Soliman, 1992). In many cases, there is no public transportation available, and people rely on microbuses, which are the most common means of informal transportation in Alexandria (Figure 1), and people mostly depend on it rather than the public ones, as they are more spread and do not cost much.
1.2 Transportation modes in Alexandria
As shown in Figure 1, public transportation such as buses, minibuses, trams, and metros are all limited to linear areas parallel to the seashore line, as the buses are moving mainly on the Corniche arterial road and minibuses are on the Corniche and Abu-Qir streets, while the tram line stops in the middle of Alexandria-Victoria station, leaving behind the eastern part of Alexandria. On the other hand, the metro project is still in process (Egypt’s Projects Map, 2023b), but the old train is also not accessible to most of the areas because of its stops, as the stops are located away from each other, with no fixed time for arrival, which makes it hard to access.
Because of that, people depend mainly on microbuses and minibuses—eight-passenger microbuses—to transport, as they are more available and reach most of the areas, rather than being affordable, but still, they do not reach all areas, which encourages car dependency, especially in upper-medium and high-income areas.
The study is focused on finding the gaps between different modes of transportation using ArcGIS Pro as a tool in order to allow accessibility for all residents to use it while offering suggestions for new routes to offer the maximum accessibility. The aim is to make at least one transportation method accessible for any resident that he can reach in a 5-minute walk, which is 400–600 m.
2 Methodology
The conceptual framework of this paper (Figure 2), is to analyze the accessibility of different transportation routes to know if they are walkable or not, and evaluate their proximity to residential areas while assessing whether public transportation and informal transport methods conflict or complement each other.
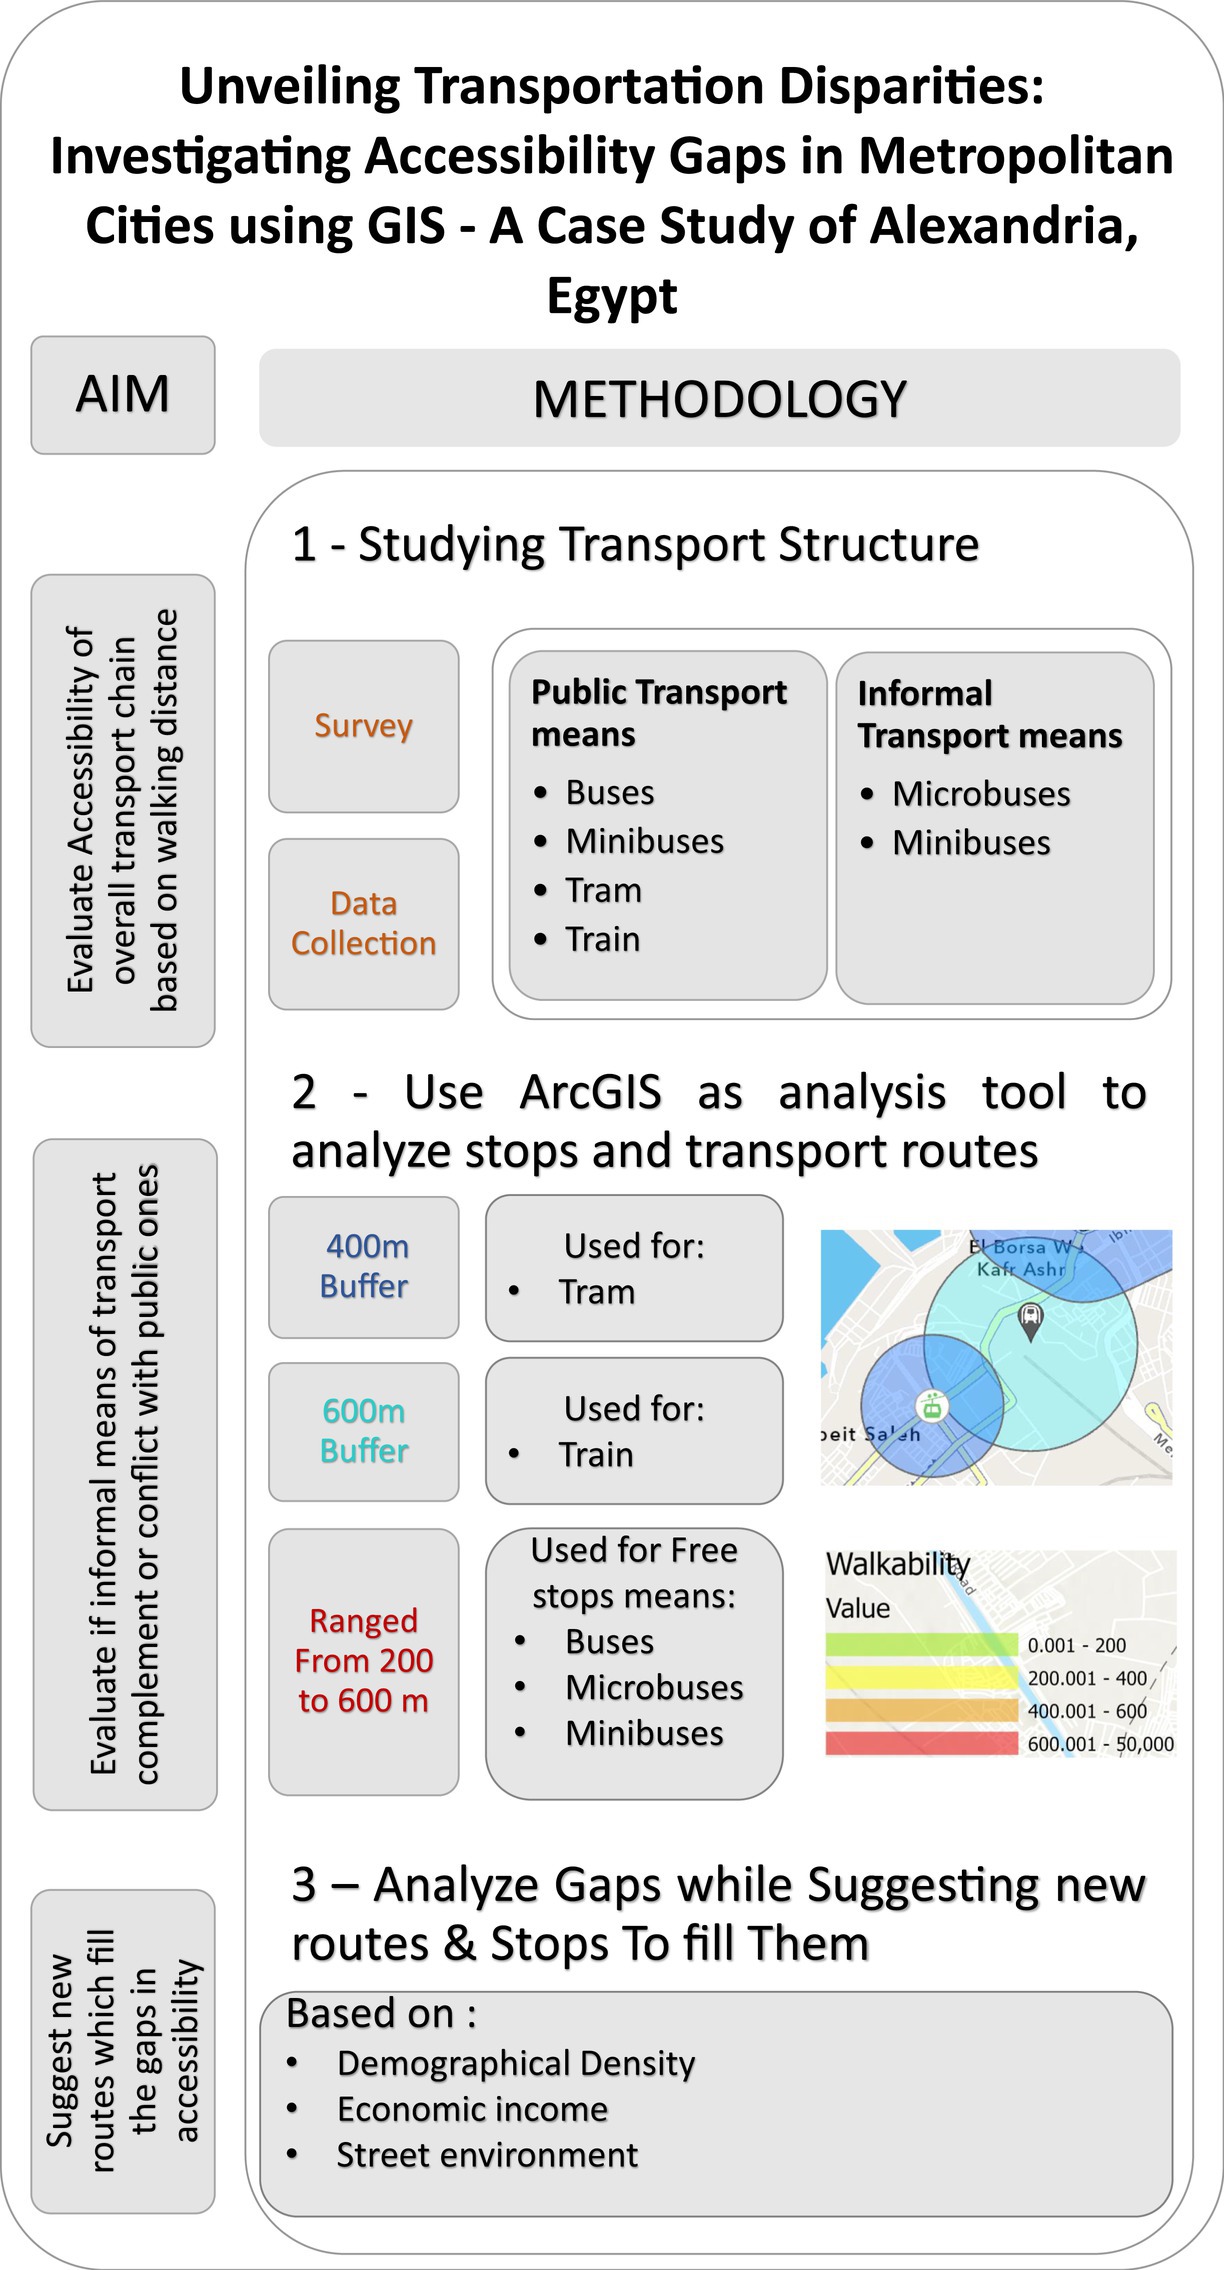
Figure 2. Conceptual diagram of methodology and scheme of activities performed. Source: Author.
Public transportations would be analyzed alone first (buses, mini buses, tram, and metro), to see if it would cover the area of Alexandria without the support of the informal means of transportations, then add the informal forms of transportation (microbuses, minibuses) to the map to show the full accessibility map of the city, that would show if there is a conflict between public and informal transportation or both work with each other symbiotically, also it would show the areas which do not have any kind of transportation reaching it, finally, suggesting new routes and stops in order to make areas in the gaps accessible for at least one kind of transportation, in order to create a walkable and connected network of transportations, that would be done by using ArcGIS PRO by illustrating the different coverage areas of transportation modes in Alexandria.
ArcGIS Pro analysis tools use origin-based accessibility, which considers the stops and routes of transportation as the origins, to calculate accessibility based on access to transportation stops and to identify the areas that are beyond these stops’ walking distances.
2.1 Accessibility of public transportation
The development of al-Raml tram line and the establishment of a metro from Abu Qir in east Alexandria to Burg al-Arab in west Alexandria, each of which would cost US$2.5 billion, are two transportation projects that are put in place to reduce traffic congestion in the coastal city streets and extend for a length of 43 km (Egypt Independent, 2020), but thinking about this, would that be possible? As the surface metro will rely on the 22-km-long current Abu Qir railway track from Abu Qir to Misr station, with no additional lines, and no change except adding two stations, otherwise, there are no additional lines added, so in order to use the metro for people who are not living within walking distance of it, they should use more than one mode of transportation to reach their destination, thus, looking for the results shown in Figure 3. Public transportations alone would not serve all the residents of Alexandria, as it has limited routes compared to other modes of transportation.
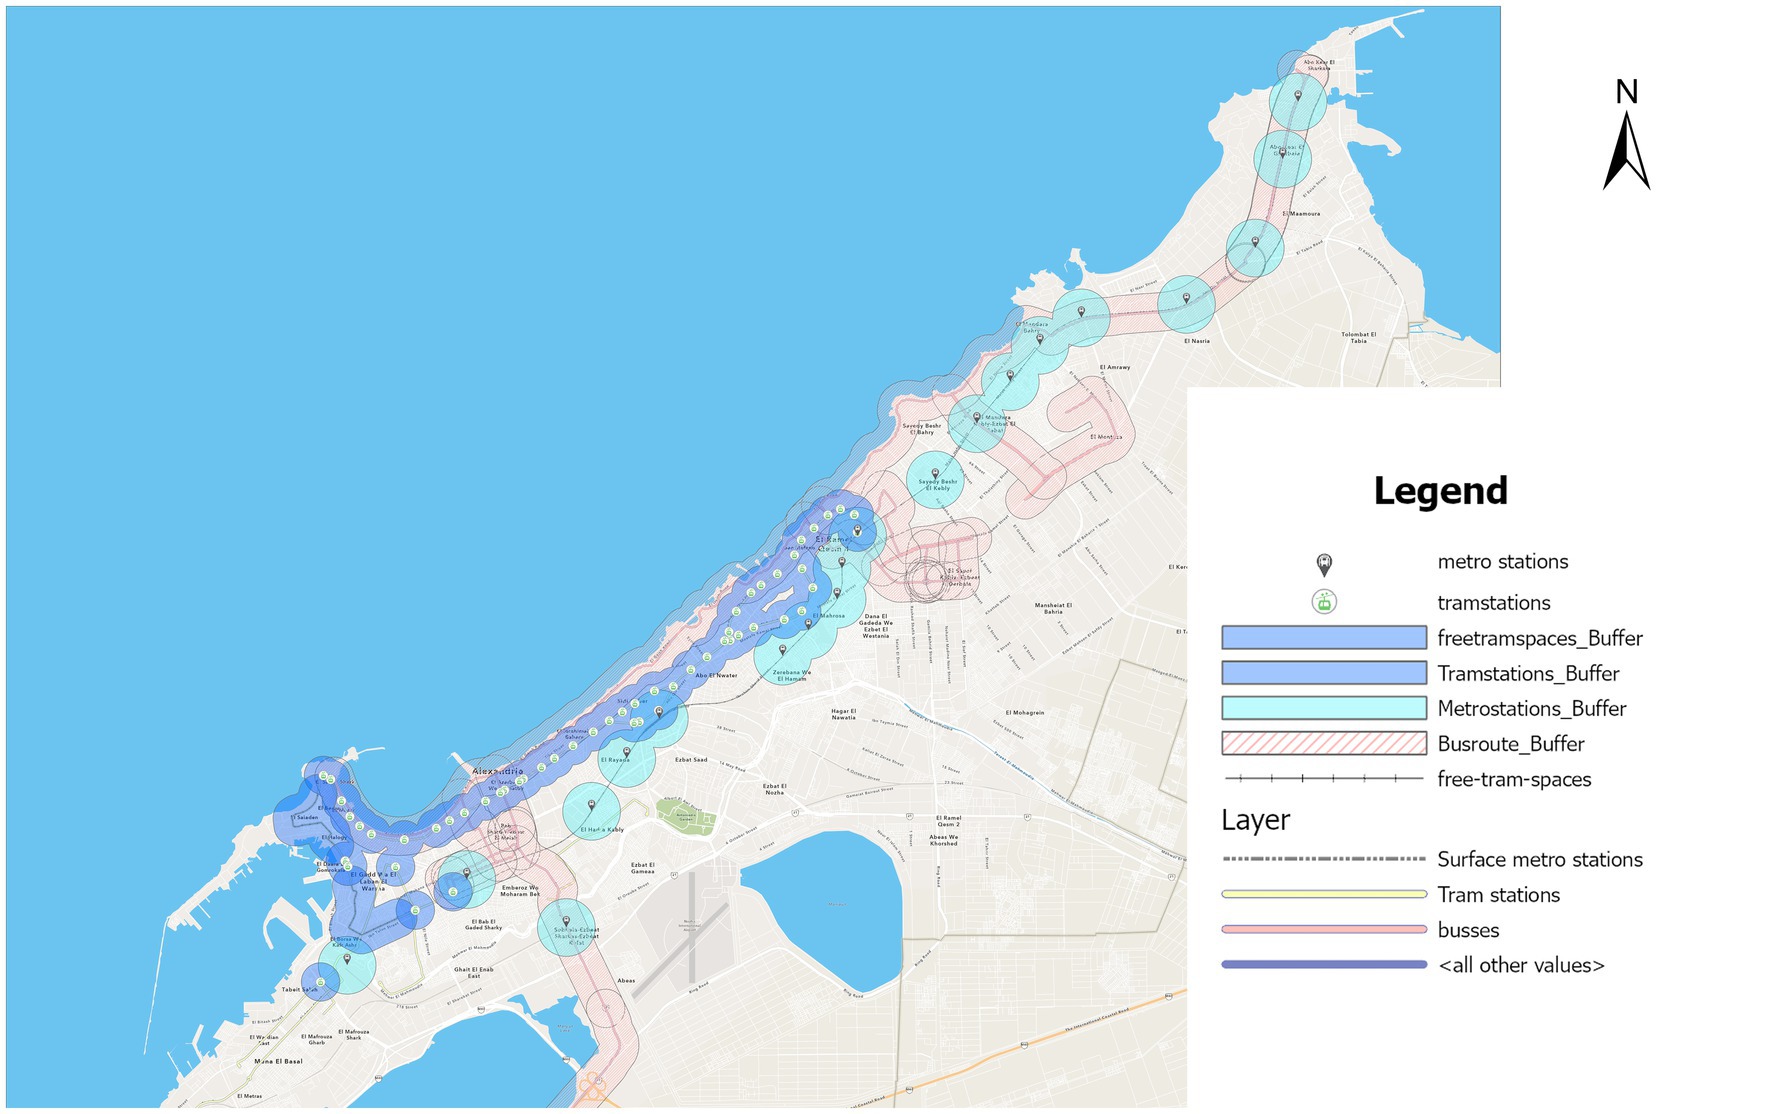
Figure 3. ArcGIS map showing the catchment area of different public transportation modes buses, minibuses, tram, and metro. Source: Author.
As per the tram, the development is mainly for the infrastructure and new tram vehicles, which would encourage people to use it more, but still, people who are not living around it would find it hard to use it, especially for the residents living in the southern and eastern parts of the city, which the tram line does not reach.
As for buses, the government increased the number of buses noticeably, as it contracted 50 new air-conditioned buses that connect the east and west of Alexandria through the Corniche road and Abu-Qir road, as well as 81 minibuses, each with a capacity of 37 passengers to serve in the narrow streets, which are hard to serve with larger vehicles (Youm7, 2016); thus, the new routes with a large number of buses did not cover the wide area of Alexandria, as there are still lots of places that buses do not cover.
As for the presentation of these different modes of transportation on ArcGIS, the 18 metro stations were located on the map, which was taken from the Egypt map—the site of the new projects in Egypt—(Egypt’s Projects Map, 2023c), then put the catchment area of 600 m, which is the average walking distance for a metro (O’Sullivan and Morrall, 1996), while for the tram stations, a catchment area of 400 m was used which is the average walking distance for tram stations (O’Sullivan and Morrall, 1996) butting in consideration that there is a part where the tram has no stations and stops if people wave to it on the east part of the city in the Bahary area. On the other hand, buses and minibuses in Alexandria do not have regular stops; they stop anywhere if anyone waves to ride, so in this case, the catchment area of the buses, which is an average of 400 m, was taken along the route. All the previous processes in the program data entry are shown in Figure 4 lead to the public transportation map shown in Figure 3.
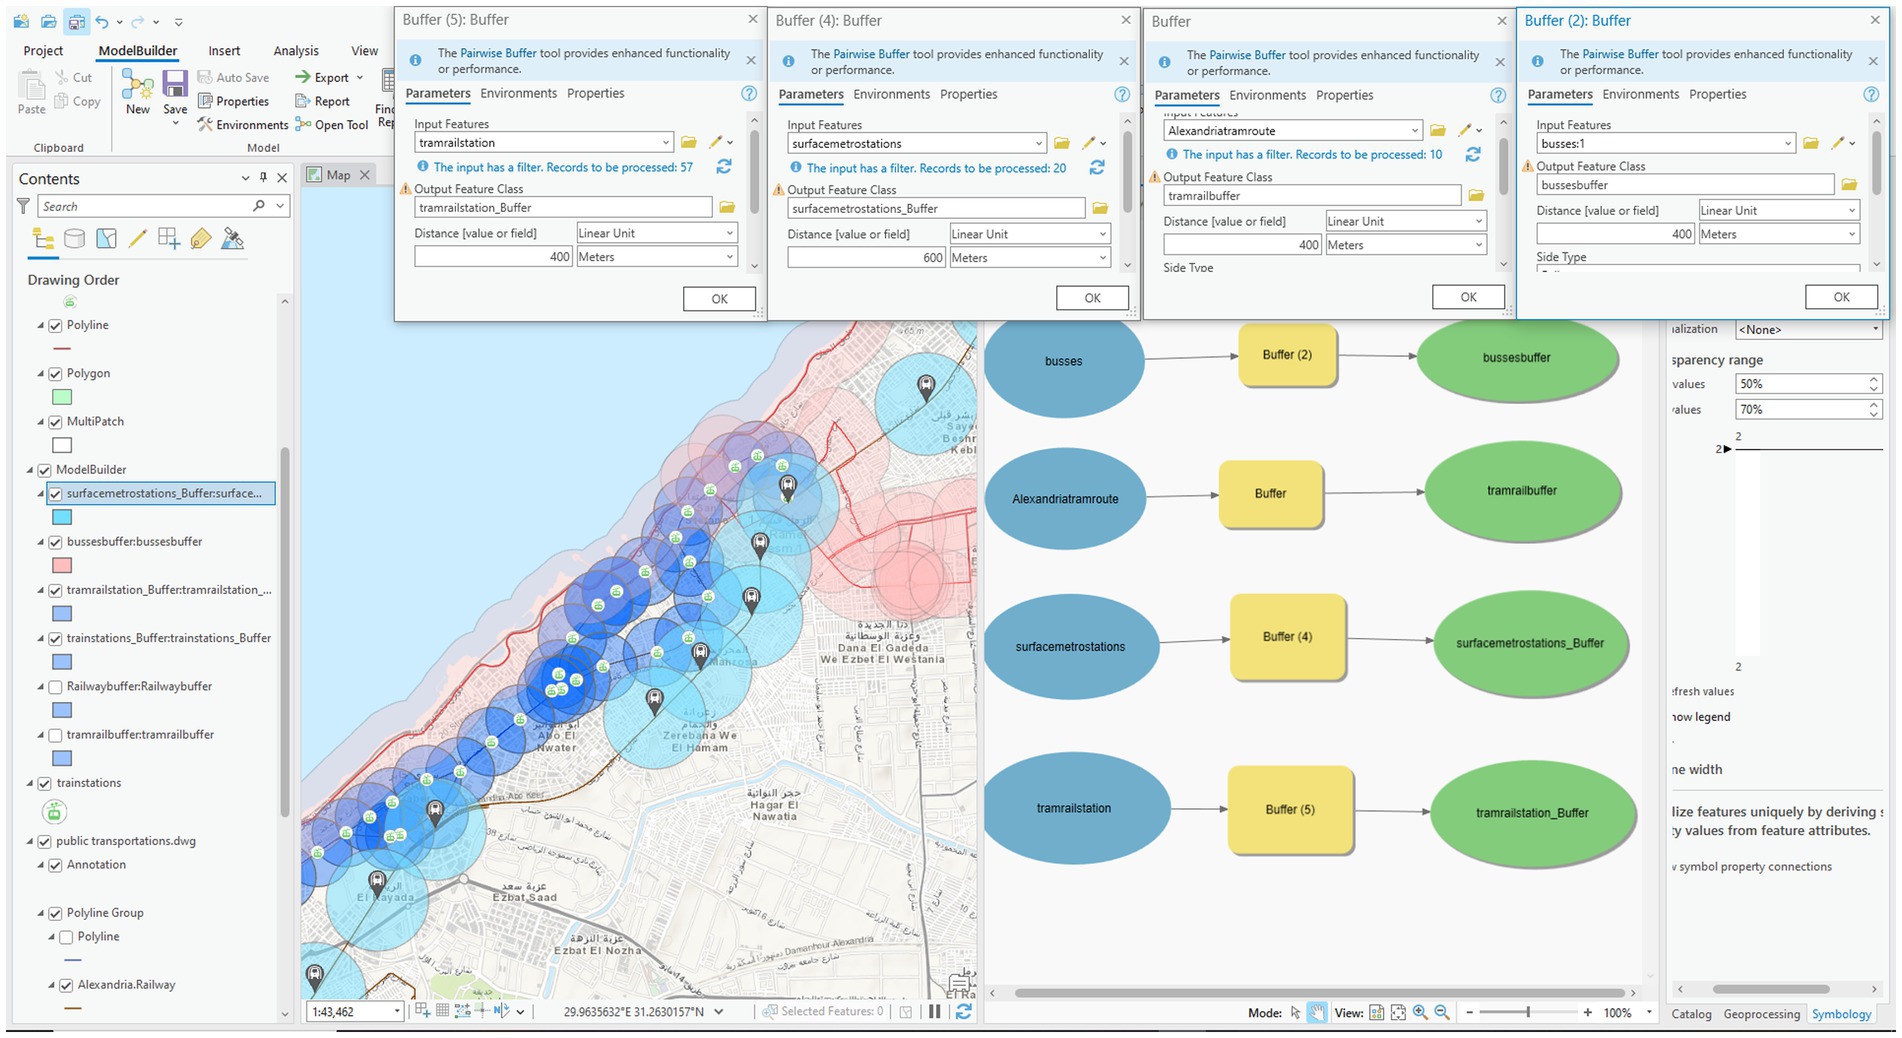
Figure 4. ArcGIS shows the model used for buffer ranges for buses, trams, and train stations. Source: Author.
2.2 Accessibility of informal forms of transportation
As per microbuses and minibuses, they usually determine their routes by the needs of people, and with the management of the government, it controls that these methods of transportation follow the rules of the city and the pricing that the city estimates for the trip, but it is vehicles that have private ownership.
Like the buses, there are no specific stops for mini buses; thus, it was presented as ranges of distances. The map shows all the routes of informal forms of transportation with their catchment areas. It was illustrated with three different colors, and each has different distances of 200, 400, 600, and more than 600 m, to show the areas close to main streets with transportation and the far ones as shown in Figure 5.
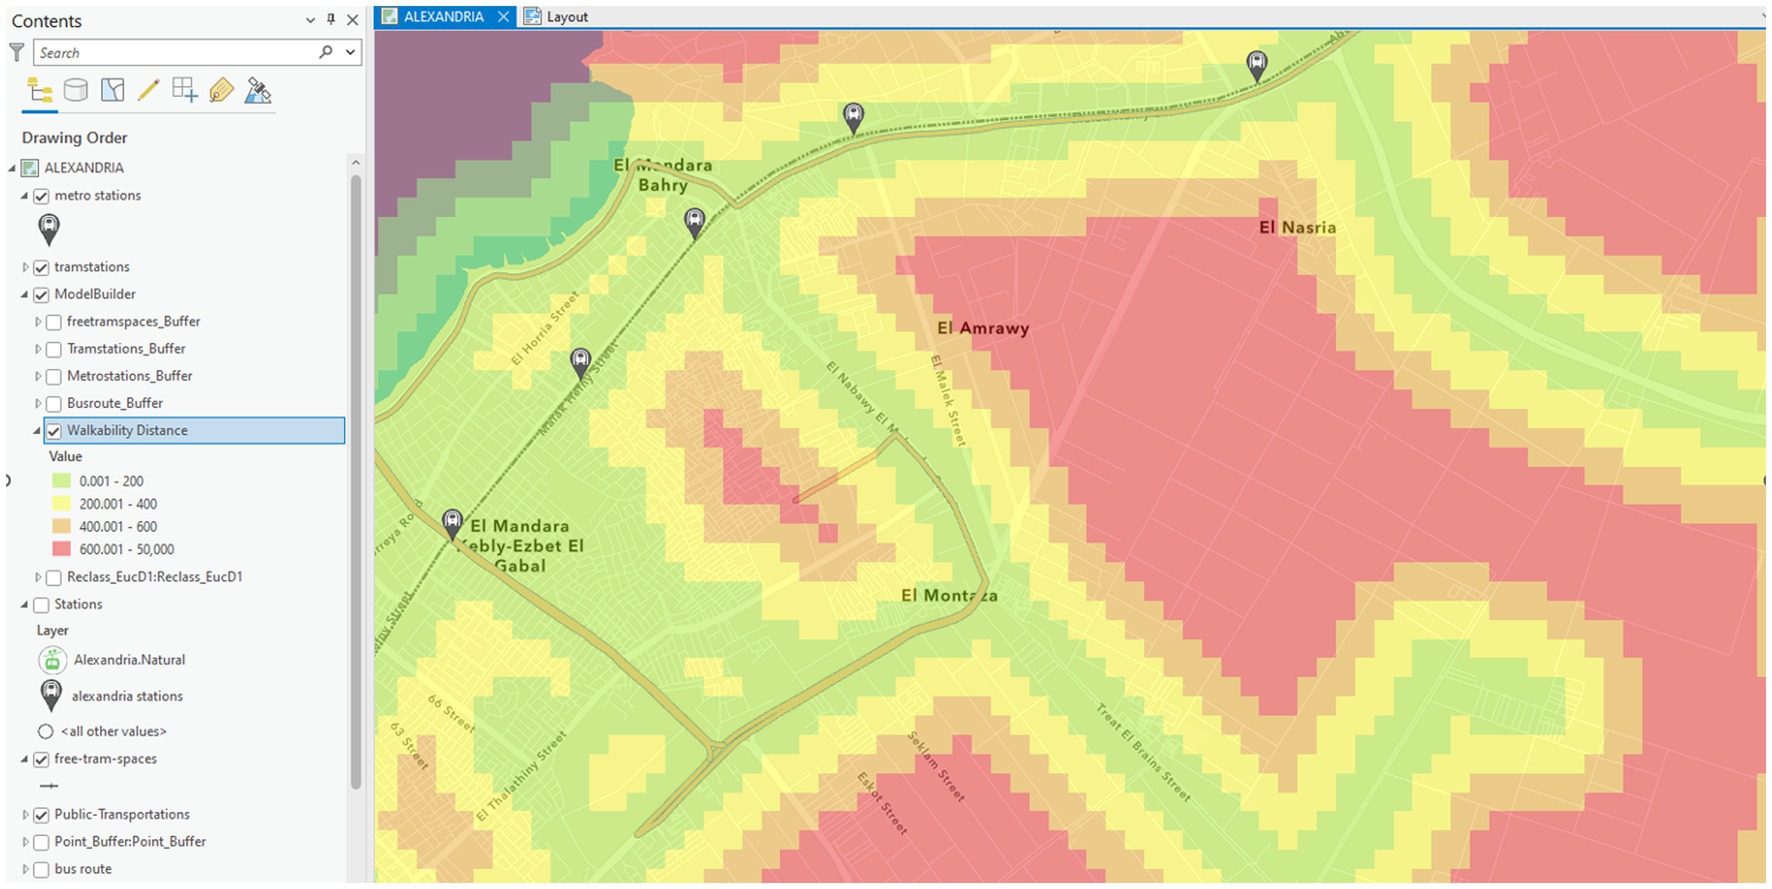
Figure 5. ArcGIS showing the different range of colors used for different distances from the transport route, Green: 200 m; yellow: 400 m; orange: 600 m; red: more than 600 m. Source: Author.
Any other unofficial method of transportation that is used without a license from the government, such as tuk-tuk, is not included in this paper, as it works only on narrow streets, and the government is preventing it from spreading.
At the end of the above-mentioned process, a map with all public and informal means of transportation would be applied to the ArcGIS map with its catchment areas, which would allow showing the gaps in transportation in Alexandria (Figure 5).
The areas without any means of transportation reaching them are shown in red, which means that they are more than 600 m walking distance from the determined routes of transportation. It means that it would take more than the average distance for people living in these areas to reach any mode of transportation. The areas were analyzed separately to find the reasons for the transportation shortage and to analyze the physical and demographical environment in order to find the possible solutions to cover these areas with suitable forms of transportation that can be connected to the existing transportation network.
3 Results
3.1 Gaps areas
As shown in Figure 6, several areas were found to be away from transportation routes, considering different reasons. For example, area 1, shown in Figure 7A, is Smouha neighborhood. It is a relatively high-income and medium-income area where most of its residents are car-dependent, especially in the gap part, where most of it is residential compounds with high prices. The area has a high car-dependency for several reasons, one of which is that there is no accessibility for quality transportation in the area. Area 2, shown in Figure 7B, is Elmandara Qebly; it has low, low-medium, and medium-income residents, and it is probably the width of its streets that there are not transportation modes passing through this area, as there is no proper maintenance for roads (Abdelreheem, 2021; Figure 8), which makes it hard for vehicles to pass through it. As for Area 3, shown in Figure 7C, it is a residential-educational area that has newly built buildings such as compounds and colleges, and most of the area is still under construction. Although this area is newly built, the colleges in it have started functioning, so it needs a transportation route to make it accessible for students, as the nearest transportation route is about 1,200 m away. On the other hand, area 4, shown in Figure 7D, is informal settlements (Izbat Elkobanya, Izbat Hod 11, and Izbat Maqnas), which were built as sprawl areas; they were originally agricultural areas, but now the density of the buildings is increasing gradually with increasing population. Finally, in area 5, shown in Figure 7E, it is mainly Elmaamoura compound, which is a gated community in the west, besides Elmontazah Park, which is a gated park that needs payments for entry. On the other hand, there is a military area on the east, which is not accessible for all people, so this area has limited transportation for gates, as this area is mostly private.
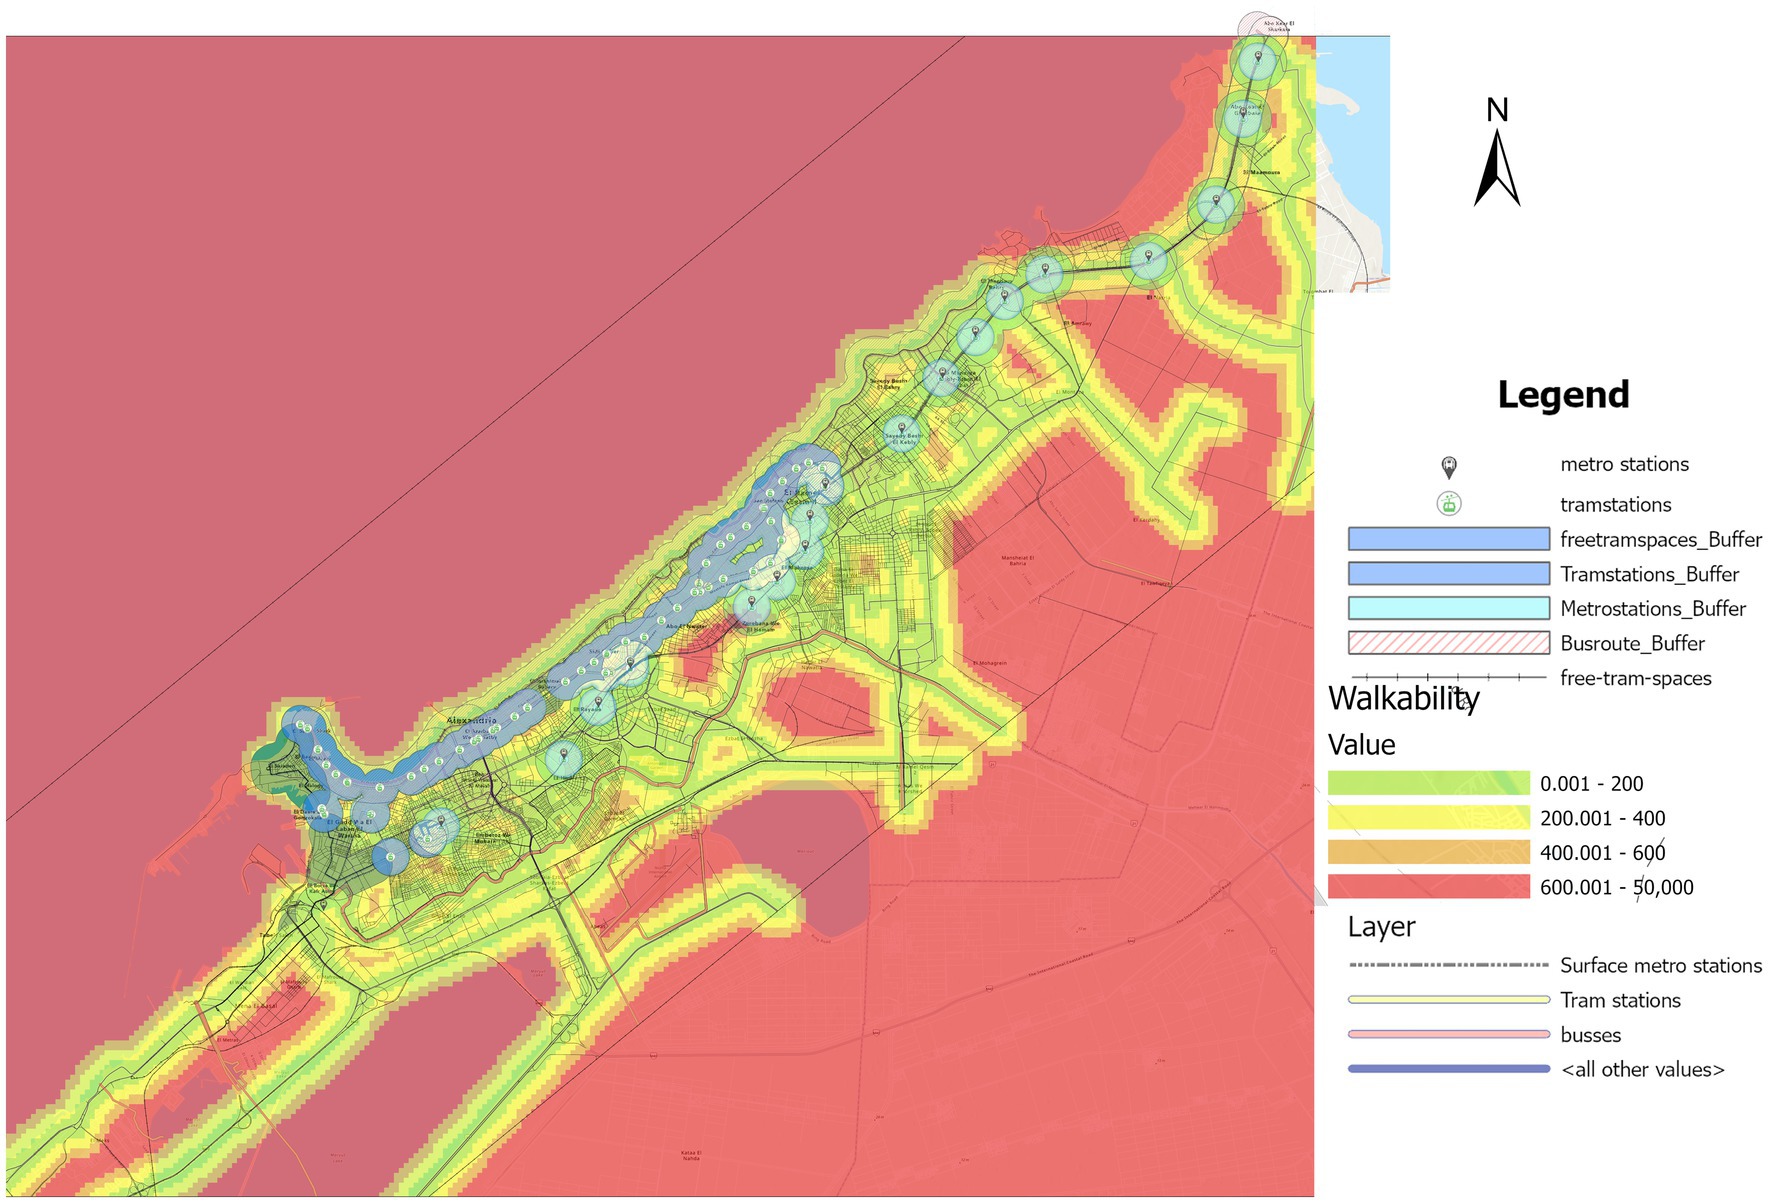
Figure 6. ArcGIS map showing the catchment area of all transportation modes—buses, minibuses, tram, metro, and microbus all in one map. Source: Author.

Figure 7. ArcGIS maps showing the gaps in transportation in Alexandria, should be listed as (A) Smouha neighborhood; (B) Elmandara Qebly; (C) Residential-educational area; (D) informal settlements; and (E) Elmaamoura compound. Green: 200 m; yellow: 400 m; orange: 600 m; and red: not accessible. Source: Author.
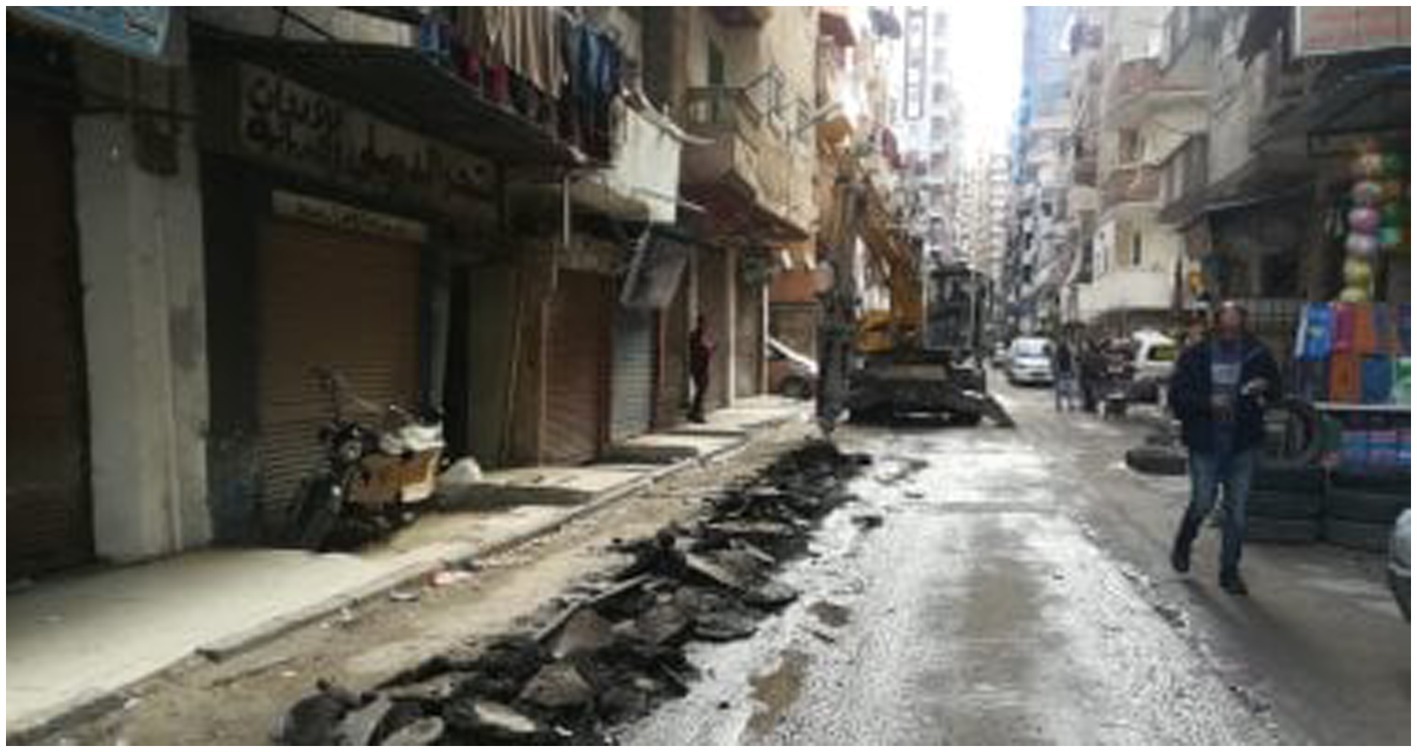
Figure 8. Streets of Elmandara Qebly area that have poor maintenance. Source: Author.
Thus, more areas have no access to transportation; this paper is focused on the areas with the current probability of expansion, ignoring the future extensions for development.
3.2 Filling the gaps
In this section, proposed new routes will be introduced in order to fill the gaps. These routes will differ in transport mode and positioning depending on several factors, including demographic density, average economic income of residents, and route conditions such as width and congestion.
The new proposed routes for transportation are shown in Figure 9. As for Area 1, in order to decrease car dependency, a new surface metro station would be added as a solution as the area is already near the existing metro line. Adding to that, the metro would be better for the residents, as they are high-income residents, so they would prefer using new and more comfortable transportation methods. Rather than microbuses or buses, which are crowded and uncomfortable,
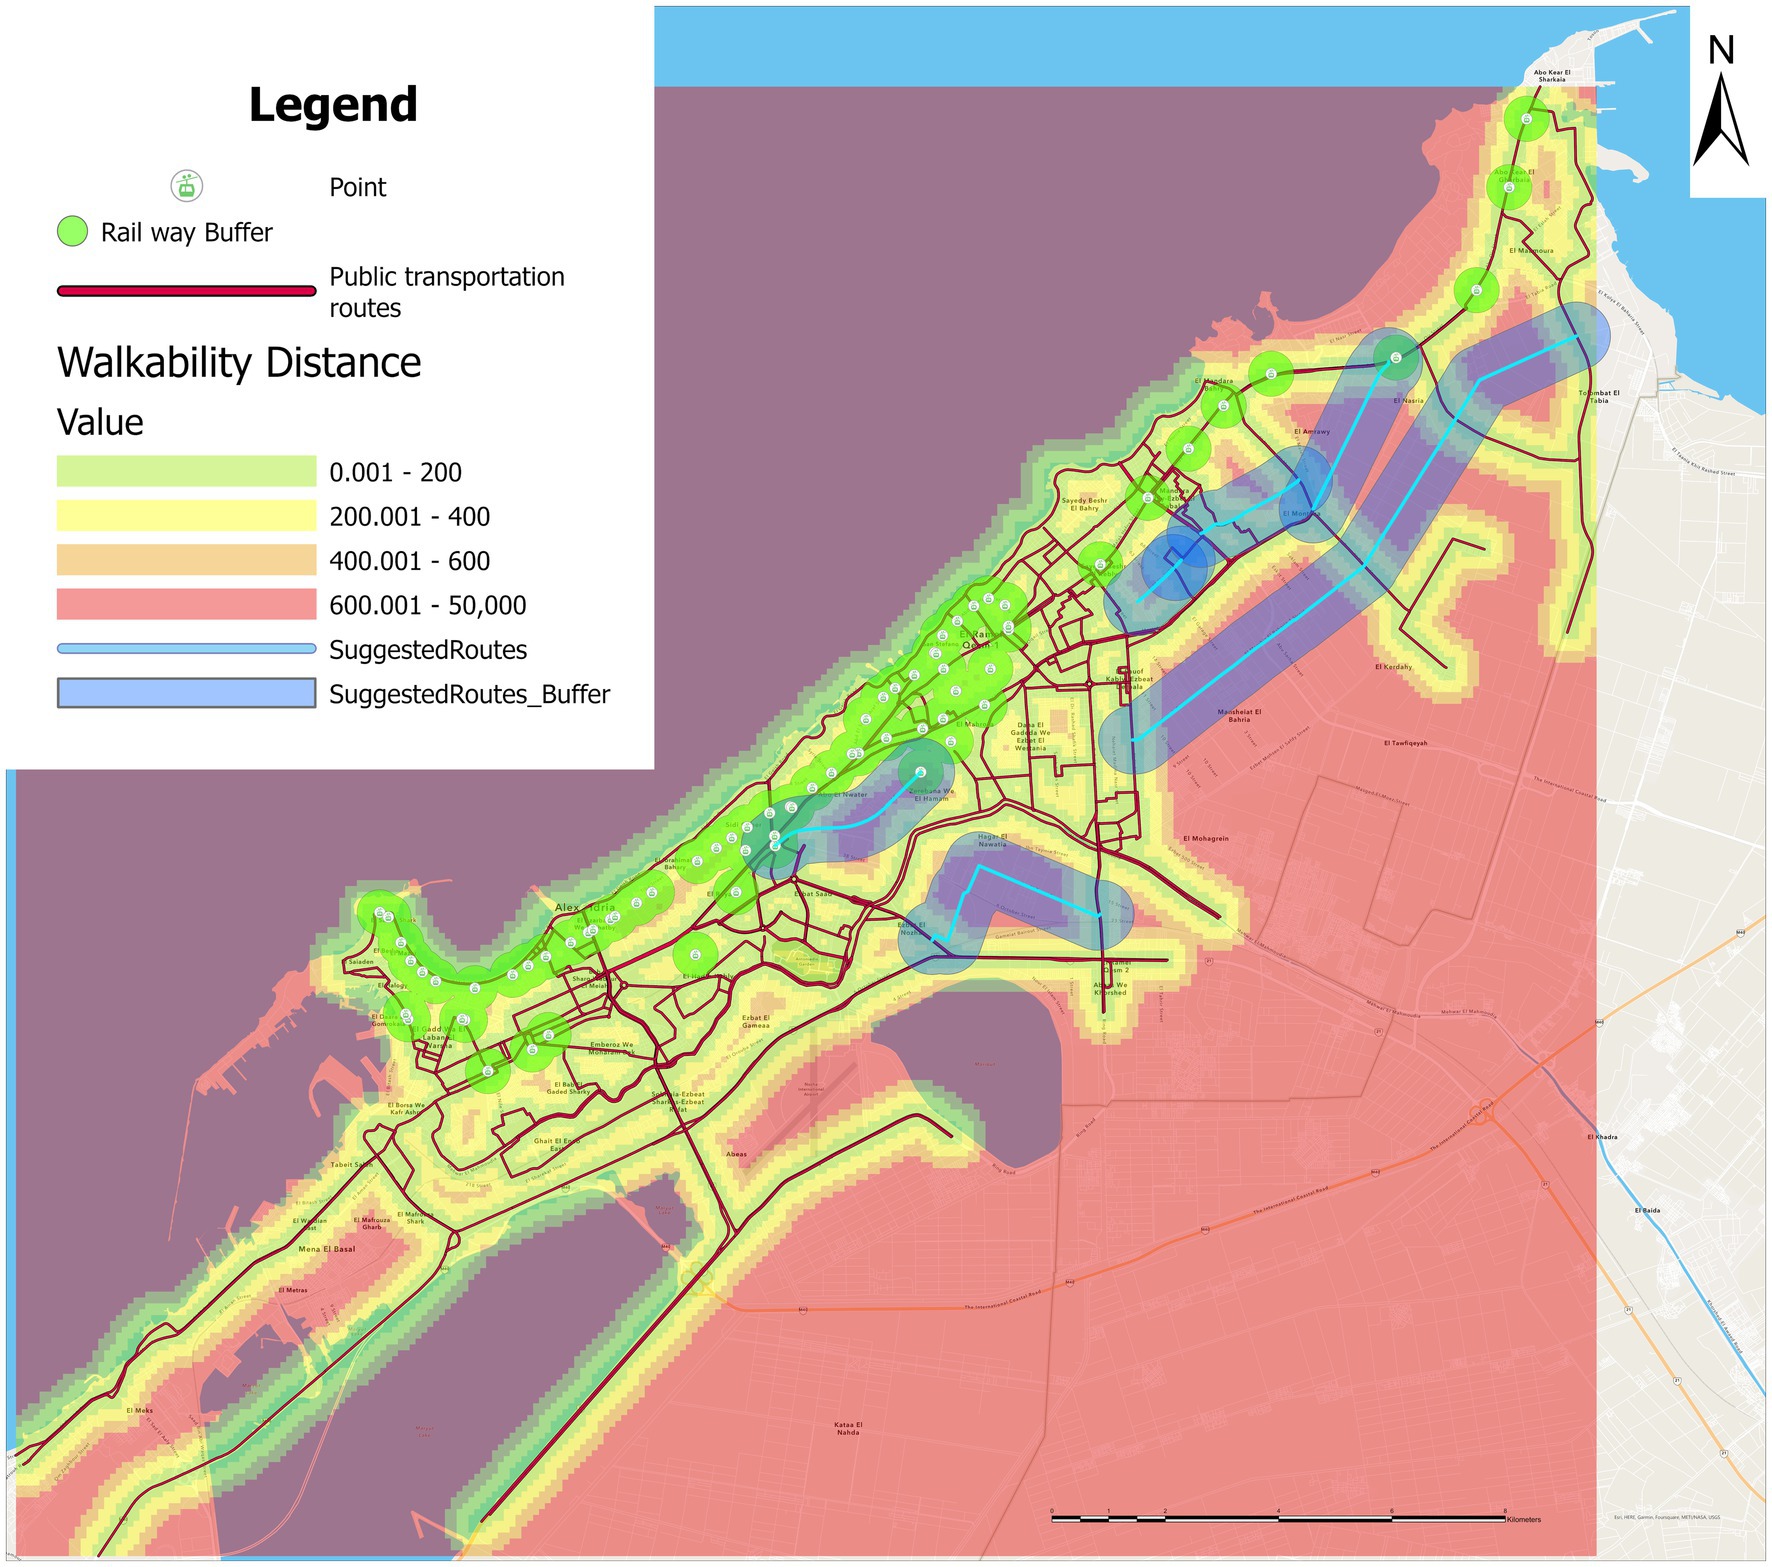
Figure 9. ArcGIS map with the new lines added to the transportation routes. Source: Author.
Area 2 has small routes so that the 30-street, which is a main street, can be used to connect the existing transportation routes with each other with a new route for minibuses or microbuses passing through the area. This would offer connected routes with more accessibility to this area.
Area 3 has two options. The first is adding a stop for the train railway that is passing through it, but it is not preferable as the train used on this line is the new electric train used between cities. The second option is a new route for buses which may be added to fill this gap; buses in this area would fit as it has wide streets as a newly developed area; besides, it would allow more people to use it to reach the educational area.
In the case of area 4, the density of residents in this area is low; that is why there are not transportation modes to reach it; thus, this paper suggests putting one transportation route in the middle of this area in order to cover the built area and enable transportation to reach most of the residents with a maximum walking distance of 600–800 m, which is a nearly 10-min walk, and as it said by Mavoa et al. (2012) and Okami et al. (2022), lower-income residents are more likely to walk more than the high-income ones, so adding micro-transit stops can be an effective means to reduce the walking distance needed to reach the main stops (Truden et al., 2022). The transportation mode used for this area is more likely to be minibuses or microbuses, as buses are big relative to the route used. So smaller and more available transport would be more suitable.
Ending with area 5, this area is gated as mentioned before, so it does not need inner transportation to pass through. On the other hand, it is better to consider adding micro-mobility modes such as cycling or electric scooters, especially in the park area, as the park is very wide, so it is about 1,200 m*1,700 m. If we consider the inner routes, it is a long walking distance with no transportation modes except cars.
All new routes were selected to be connected with at least two other transportation routes to offer the residents more options to switch their transportation mode to reach any place they want, which offers more connected multi-modal modes of transportation, besides selecting a transportation mode that fits with the physical environment of the selected routes and fits the travel behavior and socioeconomic factors affecting the mode choice.
4 Discussion
To satisfy public transportation users, prioritizing the quality of transportation services and facilities is essential. Additionally, it is necessary to incorporate modern technologies in this field to assess user needs and manage them effectively (Liu et al., 2022). Spatial analysis techniques such as ARCGIS are valuable for assessing public transportation accessibility (Gharaibeh et al., 2022). It highlights the importance of considering both network-based measures and spatial modeling approaches to identify areas with limited access to public transportation. The findings can aid in targeted interventions to improve accessibility and enhance transportation planning. This study focuses on one aspect of user needs, which is accessibility in terms of distance. However, it is important to consider other aspects that require deeper analysis with more variables (Twardzik et al., 2023).
Encouraging people to use public transport requires a comprehensive cycle of actions, including assessment and improvement. This cycle should involve enhancing service quality, optimizing the allocation of modes across different spaces, introducing new technologies to streamline the transport process, and exploring new routes and modes to alleviate pressure on existing modes (Li et al., 2023). For instance, that was parallel to the results of Iosti (2019), the study concludes that a combination of infrastructure improvements, service integration, and technology applications is essential for enhancing public transportation accessibility. And in the case of Alexandria, considering water transport could provide a parallel route to the Corniche Road, thereby reducing congestion during rush hours.
This paper analyzes transport modes primarily in terms of distance. However, a more comprehensive assessment should consider additional numerical indicators such as passenger numbers and the variety of transport modes (Saghapour et al., 2016). Factors like safety, timelines, efficiency, and comfort should also be taken into account to enhance transportation quality (Malekzadeh and Chung, 2019). Accessibility measures are crucial for evaluating public transportation systems. It emphasizes the need for comprehensive approaches that consider the diverse needs of different user groups and suggests that policy interventions should focus on improving accessibility to enhance the overall quality and effectiveness of public transportation (Sullivan and Novak, 2023).
Besides that, establishing rules and regulations for public transportation is crucial to ensure safety and order. Moreover, a comprehensive assessment and improvement of all transportation-related facilities, including stops, terminals, warehouses, and other necessary infrastructure, should be undertaken (Ong et al., 2023).
Furthermore, the government should consider forming larger partnerships with investors who possess financial capabilities, professional experience, effective management skills, and the necessary materials and technical infrastructure to coordinate and manage various modes of transportation, as the available information is lacking and not enough on the Egypt’s Projects Map website which shows all Egypt’s future projects (Egypt’s Projects Map, 2023a).
In the specific case of this paper, it is evident that Egypt lags behind in terms of technical and technological advancements in the transportation field. This requires additional investments, and a long-term strategy should be devised to improve the transportation system as a whole. Creating conditions for sustainable socio-economic development related to transportation is crucial.
On a positive note, Alexandria has microbuses, which are privately operated but regulated by the government. Public-private partnerships in the transportation sector can be a way to enhance public transportation with fewer investments from the government, that is as mentioned in Rye et al. (2018) that there is a need for coordination, policy support, and regulatory frameworks to ensure seamless integration and enhance connectivity for passengers while improving the overall efficiency and sustainability of transportation networks.
On the other hand, this study had limitations due to a lack of government-supported information on demographic distribution across the layers of Alexandria. Additionally, there was a lack of information about ongoing and future road projects in Alexandria, which are carried out without prior notice or planning. Examples include the widening of El Corniche Road, the removal of the train, or the unnecessary bridges that are built through El Corniche Road. These factors contribute to an unpredictable traffic flow throughout Alexandria for individuals outside of the governmental sector.
5 Conclusion
In this paper, the accessibility of various transportation modes in Alexandria, a metropolitan city, was studied. The objective was to identify gaps in transportation options where there are no modes of transport within walking distance. Subsequently, new routes were proposed to bridge these gaps. The study examined both public modes of transportation, such as the tram, metro, and buses, as well as informal modes of transportation, including microbuses and minibuses. Despite their informal nature, these modes have their routes and pricing regulated by the government, making them relevant to the study. Each mode was analyzed to determine the areas it covered, aiming to address accessibility gaps. Then, different modes of transportation were utilized to accommodate the routes in areas with identified gaps, thereby ensuring accessibility from almost all locations during commuting.
The study revealed that relying solely on public transportation would not be efficient for residents, particularly due to the limited routes of buses, which are constrained by bus size compared to street width. Even with the ongoing developments for tram and metro railways, people living away from these routes would find it challenging to use them without feeder transportation methods. In contrast, microbuses and other informal methods play a crucial role in the city’s transportation structure, as they cover more areas where public transportation does not reach.
To analyze all the routes and stops of different transportation modes, a map was created using ArcGIS Pro. The transportation map provided by the Transport for Cairo organization was utilized, and with the addition of trams and new metro stops to the map, a comprehensive transportation map of Alexandria was created. The results of this analysis showed the gaps of transport which was used to reorganize existing gaps and fill it by adding stops or routes. These routes respected the walking distance of 400 m, or a 5-min’ walk to facilitate accessibility for all residents.
The analysis revealed that a good percentage of the study area is covered by transportation, except for a few areas where no transportation currently reaches. After identifying the gaps, new routes were proposed to connect at least two existing transportation options while adding stops to make the metro accessible to more areas. Each of these areas used a different transport method depending on different factors, such as social, economic, and demographic factors, as well as the condition of the route used. At the end of this modification, the maximum walking distance to the nearest transport was reduced to less than 600 m for all residents.
The aim of this study is to minimize car dependency and provide more accessible transportation routes to reduce traffic congestion, particularly during rush hours and on arterial routes. It also facilitates more sustainable approaches to decrease pollution, as the air quality index in Alexandria has reached an unhealthy level of 168.
The findings of this study provide valuable insights into transportation accessibility and solutions in the specific context of our study area. While Alexandria is a metropolitan city with its unique characteristics, such as high population density and being a strip on the sea lines, which makes its routes limited, they offer a foundation for understanding and addressing similar transportation issues in other metropolitan areas. However, the generalizability of these findings to different contexts should be approached with caution, considering the variations in infrastructure, demographics, and socio-economic factors. Further research and comparative studies across similar metropolitan contexts are recommended to validate and expand upon the findings.
The limitations of this study are that it does not include variations in density across different areas due to a lack of information, which makes it challenging to make an accurate assessment of transportation in all aspects. Future research aims to incorporate the elements of time and cost, taking into consideration the socio-economic factors that influence the usage of different transportation modes, besides adding solutions for the last mile problem, which makes people choose to use their cars more, and ensuring equity by involving more psychological factors, such as fear of crime (FOC), and physical factors for the handicapped, policymakers should take into consideration that developing transport should include more technologies, like integrating ticketing systems to facilitate the passenger’s switching between modes and using the Advanced Traffic Management System (ATMS), which is used in various countries to monitor and manage traffic flow, detect accidents or congestion, and provide real-time information to vehicles and drivers, enabling them to change routes accordingly. These technologies would enhance the management and development of transport.
Data availability statement
The original contributions presented in the study are included in the article, further inquiries can be directed to the corresponding author/s.
Author contributions
SE: Conceptualization, Investigation, Methodology¸ Project administration, Supervision, Validation, Writing – review & editing. RA: Conceptualization, Data curation, Formal Analysis¸ Investigation, Methodology, Resources, Software, Validation, Visualization, Writing – original draft, Writing – review & editing. HM: Funding acquisition, Project administration, Supervision, Writing – review & editing.
Funding
The author(s) declare that financial support was received for the publication of this article. HM was supported by Center for Technology and Society, Technische Universität Berlin, Berlin, Germany. The authors acknowledge support by the German Research Foundation and the Open Access Publication Fund of TU Berlin.
Acknowledgments
The completion of this article would not have been possible without Transport for Cairo for their invaluable support and collaboration in conducting the survey of transport means in Alexandria and gathering essential data.
Conflict of interest
The authors declare that the research was conducted in the absence of any commercial or financial relationships that could be construed as a potential conflict of interest.
Publisher’s note
All claims expressed in this article are solely those of the authors and do not necessarily represent those of their affiliated organizations, or those of the publisher, the editors and the reviewers. Any product that may be evaluated in this article, or claim that may be made by its manufacturer, is not guaranteed or endorsed by the publisher.
References
Abdelreheem, A. (2021) Alexandria Governor: Allocating 244 million pounds to develop Asafra Qebli. Alexandria Governor: Allocating 244 million pounds to develop Asafra Qebli, Retrieved January 30, 2023, Available at: https://www.albawabhnews.com/4387924
Bocarejo, S. J. P., and Oviedo, H. D. R. (2012). Transport accessibility and social inequities: a tool for identification of mobility needs and evaluation of transport investments. J. Transp. Geogr. 24, 142–154. doi: 10.1016/j.jtrangeo.2011.12.004
Campbell, F. (2023). Why Public Transport Isn’t Working—The Last Mile Problem. See. Sense. Available at: https://seesense.cc/blogs/hub/why-public-transport-isn-t-working-the-last-mile-problem-1#:~:text=The%20last%20mile%20problem%20is,to%20utilise%20public%20transport%20dwindles
CEIC (1995). Egypt Number of Registered Vehicles: Alexandria and Alexandria Port: Bury’s Cars | Economic Indicators. Available at: https://www.ceicdata.com/en/egypt/number-of-registered-vehicles-annual/no-of-registered-vehicles-alexandria-and-alexandria-port-burys-cars (Accessed January 10, 2023).
Chekmareva, G., Khamburova, D., Matyashchuk, S., Fillimonova, E., and Mamaev, E. (2023). Expert methods for assessing the quality of transportation services. Transport. Res. Proc. 68, 98–108. doi: 10.1016/j.trpro.2023.02.012
Cheng, Y. H., and Chen, S. Y. (2015). Perceived accessibility, mobility, and connectivity of public transportation systems. Transp. Res. A Policy Pract. 77, 386–403. doi: 10.1016/j.tra.2015.05.003
Egypt Independent (2020). Alexandria to launch its first surface metro project at $2.5 billion—Egypt Independent. Available at: https://egyptindependent.com/alexandria-to-launch-its-first-surface-metro-project-at-2-5-billion/ (Accessed January 21, 2023).
Egypt’s Projects Map (2023a), Abu Qir Upper Metro Project. Egypt’s projects map| Abu Qir Upper Metro Project. Retrieved January 10, 2023, Available at: https://www.egy-map.com
Egypt’s Projects Map (2023b). Egypt’s Projects Map | Egypt’s Projects Map. Available at: https://egy-map.com/projects/%D9
Egypt’s Projects Map (2023c). Abu Qir Upper Metro Project. Available at: https://egy-map.com/project/
Foda, M., and Osman, A. (2010). Using GIS for measuring transit stop accessibility considering actual pedestrian road network. J. Public Transp. 13, 23–40. doi: 10.5038/2375-0901.13.4.2
Gharaibeh, A. A., Tawil, H. S., and Alomari, A. H. (2022). Developing an indicative spatial accessibility analysis tool for urban public transportation system. Case Stud. Transport Policy 10, 175–186. doi: 10.1016/j.cstp.2021.11.015
Ibrahim, M. R. (2017). How do people select their residential locations in Egypt? The case of Alexandria. Cities 62, 96–106. doi: 10.1016/j.cities.2016.12.012
Iosti, P. (2019). Accessibility to public health facilities by public transportation and health inequalities in São Paulo. Rev. Francophone Sur La Santé Et Les Territ. doi: 10.4000/rfst.825
Jackiva, I. Y., Savrasovs, M., Kabashkin, I., Nathanail, E., Adamos, G., and Mitropoulos, L. (2017). Knowledge sharing strategy as a key element of the H2020 Programme: enhancing excellence and innovation capacity in sustainable transport interchanges (Alliance) project. Proced. Eng. 187, 458–464. doi: 10.1016/j.proeng.2017.04.400
Li, Z., Gao, F., Xiao, C., and Tang, J. (2023). The effects of the urban built environment on public transport ridership: similarities and differences. Travel Behav. Soc. 33:100630. doi: 10.1016/j.tbs.2023.100630
Liu, Y., Gu, H., and Shi, Y. (2022). Spatial accessibility analysis of medical facilities based on public transportation networks. Int. J. Environ. Res. Public Health 19:16224. doi: 10.3390/ijerph192316224
Macioszek, E., and Cieśla, M. (2022). External environmental analysis for sustainable bike-sharing system development. Energies 15:791. doi: 10.3390/en15030791
Macioszek, E., Cieśla, M., and Granà, A. (2023). Future development of an energy-efficient electric scooter sharing system based on a stakeholder analysis method. Energies 16:554. doi: 10.3390/en16010554
Malekzadeh, A., and Chung, E. (2019). A review of transit accessibility models: challenges in developing transit accessibility models. Int. J. Sustain. Transp. 14, 733–748. doi: 10.1080/15568318.2019.1625087
Mavoa, S., Witten, K., McCreanor, T., and O’Sullivan, D. (2012). GIS based destination accessibility via public transit and walking in Auckland, new Zealand. J. Transp. Geogr. 20, 15–22. doi: 10.1016/j.jtrangeo.2011.10.001
O’Sullivan, S., and Morrall, J. (1996). Walking distances to and from light-rail transit stations. Transport. Res. Rec. J. Transport. Res. Board 1538, 19–26. doi: 10.1177/0361198196153800103
Okami, S., Matsuyuki, M., Sarmiento-Ordosgoitia, I., and Nakamura, F. (2022). Residents’ travel behavior in a low-income settlement with aerial cable cars in Medellin, Colombia. Case Stud. Transport Policy 10, 1332–1342. doi: 10.1016/j.cstp.2022.04.016
Ong, A. K. S., Agcaoili, T. I. F., Juan, D. E. R., Motilla, P. M. R., Salas, K. A. A., and German, J. D. (2023). Utilizing a machine learning ensemble to evaluate the service quality and passenger satisfaction among public transportations. J. Public Transp. 25:100076. doi: 10.1016/j.jpubtr.2023.100076
Rye, T., Monios, J., Hrelja, R., and Isaksson, K. (2018). The relationship between formal and informal institutions for governance of public transport. J. Transp. Geogr. 69, 196–206. doi: 10.1016/j.jtrangeo.2018.04.025
Saghapour, T., Moridpour, S., and Thompson, R. G. (2016). Public transport accessibility in metropolitan areas: a new approach incorporating population density. J. Transp. Geogr. 54, 273–285. doi: 10.1016/j.jtrangeo.2016.06.019
Saif, M. A., Zefreh, M. M., and Torok, A. (2018). Public transport accessibility: a literature review. Period. Polytech. Transp. Eng. 47, 36–43. doi: 10.3311/pptr.12072
Soliman, A. M. (1992). Housing consolidation and the urban poor: the case of Hagar El Nawateyah, Alexandria. Environ. Urban. 4, 184–195. doi: 10.1177/095624789200400219
Sullivan, J., and Novak, D. C. (2023). A method for evaluating accessibility in transportation problems considering social vulnerability. Eur. J. Oper. Res. doi: 10.1016/j.ejor.2023.04.015
Transport for Cairo (2023). Portfolio—Transport for Cairo. Available at: https://transportforcairo.com/portfolio/
Truden, C., Kollingbaum, M. J., Reiter, C., and Schasché, S. E. (2022). A GIS-based analysis of reachability aspects in rural public transportation. Case Stud. Transport Policy 10, 1827–1840. doi: 10.1016/j.cstp.2022.07.012
Twardzik, E., Schrack, J. A., Porter, K. M. P., Coleman, T., Washington, K., and Swenor, B. K. (2023). TRansit ACessibility tool (TRACT): developing a novel scoring system for public transportation system accessibility. medRxiv [Preprint]. doi: 10.1101/2023.03.07.23286932
United Nations (2023). Alexandria, Egypt Metro Area Population 1950–2023. Alexandria, Egypt Metro Area Population 1950–2023, MacroTrends. Available at: https://www.macrotrends.net/cities/22804/alexandria/population (Accessed January 28, 2023).
Weber, J. (2003). Individual accessibility and distance from major employment centers: an examination using space-time measures. J. Geogr. Syst. 5, 51–70. doi: 10.1007/s101090300103
Youm7 (2016). Youm7—in pictures: “Alexandria Transport” supports its fleet with 131 buses and minibuses, Youm7. Available at: https://www.youm7.com/Article/NewsPrint/2966860 (Accessed January 21, 2023)
Keywords: Alexandria, transportation routes, public transportation accessibility, walkability, ArcGIS pro, urban mobility, 15-min city, sustainable cities
Citation: ElDeeb S, Abd EL-Baky RA and Masoumi H (2024) Unveiling transportation disparities: investigating accessibility gaps in metropolitan cities using GIS—a case study of Alexandria, Egypt. Front. Sustain. Cities. 6:1372918. doi: 10.3389/frsc.2024.1372918
Edited by:
Daniel Oviedo, University College London, United KingdomReviewed by:
Hassan Abdel-Salam, Beirut Arab University, LebanonElżbieta Macioszek, Silesian University of Technology, Poland
Copyright © 2024 ElDeeb, Abd EL-Baky and Masoumi. This is an open-access article distributed under the terms of the Creative Commons Attribution License (CC BY). The use, distribution or reproduction in other forums is permitted, provided the original author(s) and the copyright owner(s) are credited and that the original publication in this journal is cited, in accordance with accepted academic practice. No use, distribution or reproduction is permitted which does not comply with these terms.
*Correspondence: Sally ElDeeb, sally.eldeeb@aast.edu