Near Real-Time Processing Chain for MSG SEVIRI Data for Free and Immediate Earth Monitoring Capabilities
 José A. Sobrino*
  Yves Julien*
- Global Change Unit, Image Processing Laboratory, University of Valencia, Valencia, Spain
Although numerous instruments are continuously observing our planet, the general public has a low access to these data, either being provided with a delay, or needing some scientific background to exploit them. Our objective here is to bridge this gap, by using the data we receive from our MSG-SEVIRI (Meteosat Second Generation—Spinning Enhanced Visible InfraRed Imager) station, by processing them to retrieve accurate characteristics of the surface, and uploading them within 5 min of image completion on a dedicated webpage, updated with every new data. For half our planet, we provide in real time a specifically designed quickook and surface temperature every 15 min, with an accuracy similar to the one achieved in previous works. We also provide every 15 min the hotspots detected using a validated approach. Once a day, we provide vegetation greenness [Normalized Difference Vegetation Index (NDVI)] for the 12:00 UTC acquisition, corresponding to the best illumination case, as well as anomalies for NDVI and surface temperature. These parameters are provided freely as full resolution images, readily understandable for the end-user, in three different languages (English, Spanish and French): https://www.uv.es/iplsat. These data, along with short time lapse videos, can be used for educational, scientific and communication purposes.
Introduction
Remote sensing platforms are providing the scientific community as well as the wider public with a wealth of data, which are available, sometimes freely, for download to interested public. Examples of such data repositories for visible and infrared data are the Moderate Resolution Imaging Spectroradiometer (MODIS) and Visible Infrared Imaging Radiometer Suite (VIIRS) archive (LAADS DAAC, 2021), the Long-Term Data Record (LTDR) for National Oceanic and Atmospheric Administration—Advanced Very High Resolution Radiometer (NOAA-AVHRR) archive (Pedelty et al., 2007), the Landsat archive (USGS, 2021), the Sentinel archive (Copernicus, 2021), or the Land Surface Analysis—Satellite Application Facility network (LSA-SAF) archive for Meteosat Second Generation—Spinning Enhanced Visible InfraRed Imager (MSG-SEVIRI) data (LSA-SAF, 2021).
However, a scientific background is highly recommended to deal with such data. Although the data can usually be opened with common software, basic knowledge of the physics at stake between the sensor and the ground is needed, and basic skills of image processing are needed for a good visualization of the data.
Another characteristic of these data is that there is a latency (usually from a few hours to several days) between image acquisition and image availability. Therefore, public interested in visualizing the present aspect of our planet must make do with outdated data, with the notable exception of the live webcam from the International Space Station (ISS) station (ISS, 2021). This is not a drawback for slow-changing characteristics such as vegetation growth, but it is for cloud presence or temperature assessments.
In Europe, the general public is familiar with the MSG platform, at least through glimpses of the data it provides for weather forecast. However, the LSA-SAF project has shown that the MSG data, and more specifically the SEVIRI instrument, provide numerous additional applications, through a long list of biophysical parameters (LSA-SAF, 2021). However, as mentioned above, these parameters are available after a lapse of time ranging from a few hours to a few days.
Using the MSG-SEVIRI data we receive at our premises, we bridge here the above-mentioned gaps, by providing—within 5 min of image completion—accurate basic biophysical characteristics (vegetation, surface temperature, quicklook, hotspots, anomalies) as images readily understandable for the general public, through a dedicated webpage updated every 15 min. This paper updates and completes the MSG-SEVIRI processing chain described in Julien et al. (2015a). More specifically, the objectives of this paper are the following:
- to describe the data we receive at our MSG-SEVIRI station and the applied basic pre-processing steps (Instantaneous Parameters section)
- to present the algorithms we use for real time estimation of various parameters along with their errors (Multitemporal parameters section)
- to describe the approach we implemented for anomaly estimation, which also allows for quick cloud masking [Case study: Llutxent fire event (2018/08/06—2018/08/09 section)]
- to show the usefulness of such data for a case study, dealing with a fire event in eastern Spain in August 2018 (Discussion and Conclusion section).
- to discuss these results and present the webpage where they are displayed in real time (Conflict of Interest section).
Data and Pre-Processing
MSG Data
In 2007, the Global Change Unit of the University of Valencia acquired a full reception system for MSG-SEVIRI data, that it operates continuously since. The MSG-SEVIRI data used in this study were acquired using a direct broadcast High Resolution Picture Transmissions (HRPT) system, which consists of a parabolic dish, a Personal Computer with the hardware and software to decode L-band data and a set of storage devices to save all the received SEVIRI data. Received data amount to 96 images per day for each channel due to the 15 min temporal resolution of SEVIRI, resulting in storage needs of 1 TB per month. Missing data, due mainly to maintenance operations, were retrieved from EUMETSAT data center as HRIT raw files, and then processed following the same scheme as the data retrieved from our station. Reprocessing of our complete MSG-SEVIRI archive from January 2007 up to present has already been carried out following the approaches described hereafter.
Pre-Processing
MSG-SEVIRI data are received by our station as digital counts, which we convert to radiances using the gain and offset values provided in the associated metadata. Visible (Vis06) and Near-infrared (Vis08) data are then converted to reflectances by normalization of the received radiances with incoming solar radiation. These reflectances are then corrected atmospherically using a basic implementation of the Simplified Method for the Atmospheric Correction (SMAC) of satellite measurements in the solar spectrum (Rahman and Dedieu, 1994). As a compromise between atmospheric correction accuracy and instantaneous processing of the received data, we opted for standard input values for SMAC software. The corresponding parameters are the following (standard value in parentheses): atmosphere type (continental), atmospheric pressure (1,013 hPa), aerosol optical thickness (0.05), and ozone concentration (0.33 atm cm). In addition to these parameters, SMAC software needs a total amount of atmospheric water vapor, which we retrieve directly from pixel data (see below). By using standard values, the SMAC parameters may be slightly over—or under-estimated, although the resulting error is generally lower than the error resulting from the use of the top of the atmosphere values. Finally, for thermal infra-red channels (for example IR108 and IR120), brightness temperatures (TB108 and TB120, respectively) are estimated by inverting Planck’s law.
Instantaneous Parameters
Normalized Difference Vegetation Index (NDVI)
Normalized Difference Vegetation Index values are retrieved from red (Vis06) and near-infrared (Vis08) atmospherically corrected reflectances as described in Tucker (1979). Figure 1 shows an example of NDVI map.
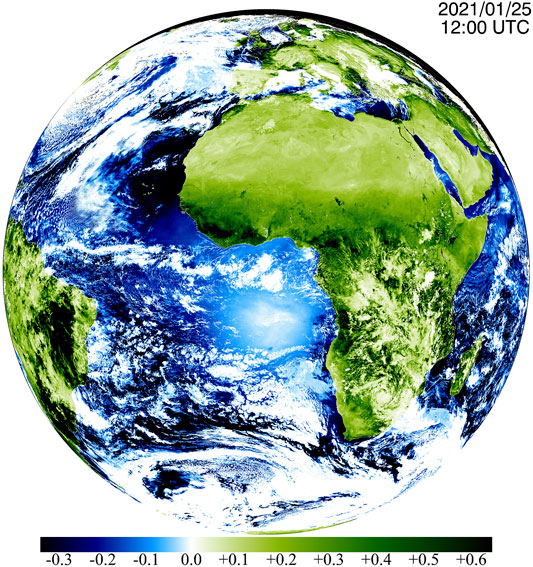
FIGURE 1. NDVI map for January 25, 2021 at 13:30 UTC. Sea appears in blue, clouds in white, and dense vegetation in dark green.
Sea Surface Temperature (SST)
Sea Surface Temperatures are estimated from TB108 and TB120 brightness temperatures, as well as Viewing Zenith Angle (VZA), as presented in Sobrino et al. (2020):
This algorithm is based on the split-window equation, and has been thoroughly validated through comparison with buoy data (Sobrino et al., 2020). This comparison has been carried out using daily data from 12 buoys located around the Iberian Peninsula from 2015 to 2018. This validation resulted in Root Mean Square Error (RMSE) values of 0.67 K. More details on this validation can be found in Sobrino et al. (2020). An example of SST map is presented in Figure 2, where SST is combined with LST. To improve the interpretability of the data, continent outline is overlaid in black on the data.
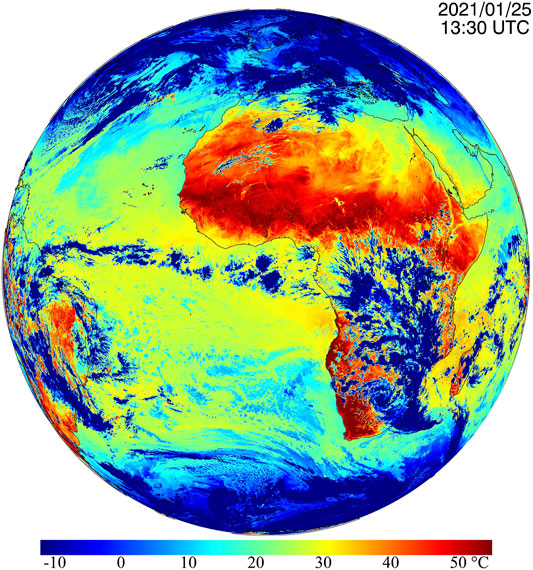
FIGURE 2. SST and LST map for January 25, 2021 at 13:30 UTC. Lower temperatures appear in blue (ice, clouds), while higher temperatures appear in red (deserts). Continental outlines appear in black.
Land Surface Temperature (LST)
Land Surface Temperatures are estimated from TB108 and TB120 brightness temperatures, as well as Viewing Zenith Angle (VZA), and using intermediate parameters such as total amount of atmospheric water vapor (WV), average emissivity (ε) and spectral emissivity difference (Δε) as estimated below:
This algorithm is also based on the split-window equation, and has been validated using two different approaches. The first one was a direct comparison with in situ data measured at 4 permanent stations in Spain, between the years 2015 and 2018. This validation resulted in RMSE values of 1.5 K (Sobrino et al., 2020). The second validation approach was to compare our LST product with a similar product from Land Surface Analysis—Satellite Application Facility (LSA-SAF) over the whole SEVIRI disk for four full days spanning the whole year 2017. This comparison showed a good agreement for vegetated areas, and acceptable for arid areas, within the error requirements for LST products (Sobrino et al., 2020). An example of LST map is presented in Figure 2, where LST is combined with SST. To improve the interpretability of the data, continent outline is overlaid in black on the data.
Water Vapor (WV)
The total amount of atmospheric water vapor is retrieved from WV062 band data as well as brightness temperatures TB108 and TB120 (Sobrino et al., 2020):
A previous study has shown that a similar approach provides total amount of atmospheric water vapor values with an RMSE of the order of 1 g cm−2 when comparing with in situ radiosonde data (Julien et al., 2015b).
Emissivity
Emissivities are estimated following the standard NDVI threshold method (Sobrino et al., 2008), based on pixel-by-pixel maximum NDVI values over the last 24 h. These emissivities, expressed as ε108 and ε120, correspond to SEVIRI infrared IR108 and IR120 spectral bands centered at 10.8 and 12.0 μm, respectively, and are estimated differently depending on the Fraction of Vegetation Cover (FVC) within a given pixel, as described in Table 1. FVC is estimated as a function of NDVI value as expressed hereafter.
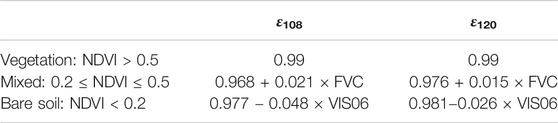
TABLE 1. MSG-SEVIRI equations for emissivity estimation.
Finally, emissivities are summarized as average emissivities and spectral emissivity difference:
For operative purposes, emissivities are estimated from a running composite of NDVI values, where only cloud-free (see cloud-mask section below) values are updated daily. These daily composite images are archived for eventual reprocessing.
Quicklook
The MSG-SEVIRI instrument does not acquire any data in the blue nor green wavelengths. Therefore, to present the MSG-SEVIRI acquired data as the human eye would see it, some approximations need to be carried out. We chose here a method based on the one developed by Reuter and Pfeifer (2011). Their approach relies on the assumption that by using information from neighboring wavelengths, we can simulate the data corresponding to the red, green and blue (RGB) channels we need for a human-eye like quicklook. To that end, they created a Look Up Table to match VIS06, VIS08, and IR016 data to the needed red, green and blue information. Here, we use a similar concept, although we used MODIS instrument—which captures red, green and blue data - to determine equations to synthesize RGB images. To that end, we downloaded MODIS MOD09CMG data (Vermote, 2015) for 2016 DOYs 1, 92, 183, and 275, corresponding respectively to the 1st of January, April, July and October of 2016. We selected this product due to its comparable footprint with SEVIRI sensor, and these dates to span the entire calendar year. We then selected the 12:00 UTC SEVIRI acquisitions corresponding to the same dates, and proceeded to match first SEVIRI red (VIS06), near infrared (VIS08) and middle infrared (IR016) to MODIS corresponding bands (1, 2, and 6, respectively), and then used MODIS data from bands 1, 2, and 6 to synthesize MODIS data for RGB bands 1, 4, and 3. The following equations were obtained by using all available cloud-free pixels in MODIS and MSG-SEVIRI data for all 4 dates.
By applying equations these five equations to MSG-SEVIRI data, we can build an instantaneous RGB synthetic image similar to what a human eye would see. Such RGB synthetic image is presented in Figure 3. Note that to avoid terminator effects (increased reflection from the atmosphere around sunset and sunrise), SST and LST values are translated to gray scale (minimum value: −10°C, black; maximum value: +50°C, white) for pixels with SZA values above 80°. To facilitate the interpretation of the image, continental outlines have been overlaid in black for the gray scale part of the image (areas not illuminated by the Sun).
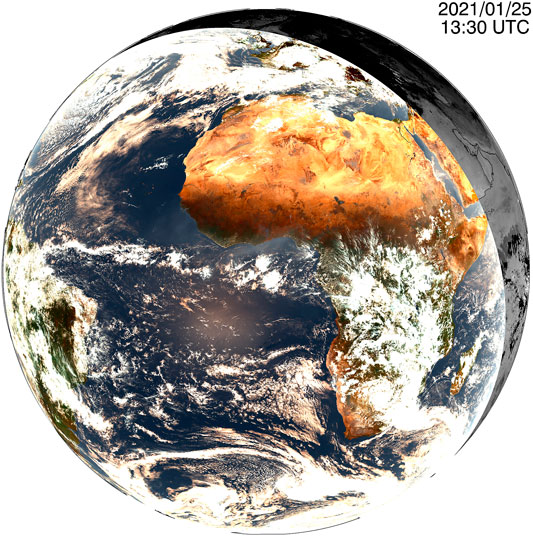
FIGURE 3. RGB quicklook for January 25, 2021 at 13:30 UTC. Colors have been designed to match what a human eye would be seeing from space. See text for details.
Hotspot Detection
The contextual algorithm by Calle et al. (2006) for hotspot detection consists in comparing, for each pixel, the retrieved brightness temperature to threshold values estimated from neighboring pixels statistics, and this regarding middle infrared band as well as the difference between middle and thermal infrared brightness temperatures. All the specifics of this approach can be found in Calle et al. (2006). This is the algorithm we have implemented at the Global Change unit of the University of Valencia, running for SEVIRI full disk within 1 min of image completion, every 15 min. To avoid false detections, pixels identified as cloudy by our cloud mask approach (see below) were not considered. Additionally, for all detected hotspots, we solved the Dozier equations (Dozier, 1981) to retrieve fire temperature and area. Only the hotspots with realistic fire temperature and area (fire temperature above 400K, fire area between 0 and 80% of the pixel) are considered as valid, the hotspots failing Dozier resolution being discarded as false positives. Figure 4 presents these hotspots for January 26, 2021 at 11:15 UTC. Most of the detections are located in Sahel, and correspond to agricultural practices.
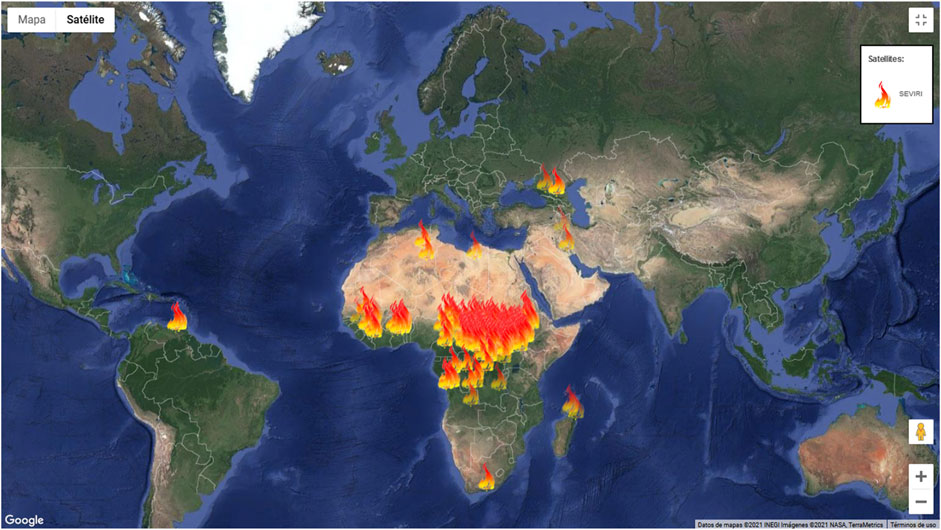
FIGURE 4. Detected hotspots for January 26, 2021 at 11:15 UTC. See text for details.
MSG-SEVIRI derived hotspot validation is difficult due to the large footprint of MSG-SEVIRI pixels (at least three by 3 km). However, some comparison can be carried out with external fire detection services. We used here the Fire Information for Resource Management System (FIRMS) email alerts for Spain over the period ranging from August 3 to 10, 2018 provided by NASA (NASA, 2021) from MODIS and VIIRS data. The European Forest Fire Information System [(EFFIS), EFFIS 2021] website could also be used to this end, although it would lead to similar results since the sensors and hotspot detection algorithms are similar. The chosen period covers a large fire event in the area of Gandia (Spain), which lasted from August 6 to 9, 2018. 95% of the hotspots detected from MSG-SEVIRI data as presented above match FIRMS alerts. More than half of the remaining 5% correspond to consecutive detections during less than an hour in two agricultural area and a forested area. 2% of the MSG-SEVIRI derived hotspots correspond to single or non-consecutive detections. Therefore, the commission error is lower than 2%. These false detections can happen for specific sun-target-sensor geometries (especially on metallic roofs with high reflectance) and cities surrounded by dense vegetation in summer (urban heat island effect). As for the omission error, it cannot be assessed due to the lower sensitivity of the MSG-SEVIRI in comparison to MODIS and VIIRS sensors, and the lack of geolocated national firefighting activities for this period.
Multitemporal Parameters
Anomalies are useful for the assessment of the state of a parameter in regard of its past variations. Here, we estimated anomalies for both NDVI and Sea and Land Surface Temperature (SLST, as combined SST and LST map) for the 12:00 UTC data, which is the time corresponding to a full illumination of the MSG-SEVIRI disk, using NDVI and SLST data from 2007 to 2016. To that end, we tested two methods (ALICE, and Inter-Quartile Range), which we also applied to quick cloud masking.
ALICE Method
The so-called Absolutely Local Index of Change of Environment (ALICE) method (Tramutoli, 1998; Tramutoli, 2007; Filizzola et al., 2017) consists in the identification of anomalous signal by quantification of signal deviation from its monthly mean as a function of its monthly standard deviation. This is equivalent to the standardization of the signal, so that its mean is 0 and its standard deviation is 1, using the monthly statistics corresponding to the current month. In order to retrieve valid surface statistics, we need to estimate them from cloud-free observations. To that end, we downloaded EUMETSAT Cloud Masks (CLM, Eumetsat, 2007; Eumetsat, 2010) from 2007 to 2016 for 12:00 UTC. We then estimated for each month the averages and standard deviation of cloud-free observations for each pixel, for NDVI and SLST parameters. Instantaneous anomalies are then estimated by subtracting from the 12:00 UTC cloud-masked parameter (whether NDVI or SLST) the corresponding monthly cloud-free average, and then dividing by the corresponding monthly cloud-free standard deviation. The cloud masking procedure we implemented for instantaneous anomaly estimation is detailed below. For cloud-contaminated pixels, the cloud-free anomaly values from the previous day are retained.
Inter-Quartile Range Method
Since remaining cloud and atmospheric effects may influence the retrieval of averages and standard deviation values, we also used the Inter-Quartile Range (IQR) method (Upton and Cook, 1996) to estimate the moments for the ALICE method. Monthly cloud-free averages are thus replaced by monthly cloud-free median values, and standard deviations by the IQR, the difference between the values corresponding to 75 and 25% of the ordered cloud-free observations for a given month over the 2007–2016 period. This IQR has to be divided by 1.349 to be statistically equivalent to the standard deviation in the case of a normal distribution. This approach showed better results than the traditional average and standard deviation estimation, by removing obvious spatial discontinuities due to sensor malfunction or cloud masking errors. Therefore, this is the approach we applied here. Figure 5 shows an example of NDVI and SLST anomaly maps.
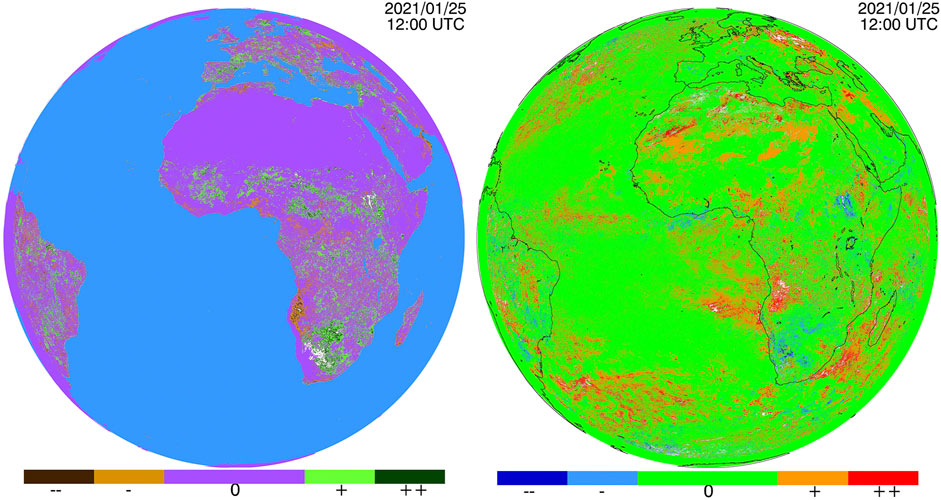
FIGURE 5. Anomaly maps for January 25, 2021 at 12:00 UTC for NDVI (left) and SLST (right). Scaling is between −3 and −2 standard deviations (σ) around the monthly mean (−−), −2 and −1 σ (−), −1 and +1 σ (0), +1 and +2 σ (+), and +2 and +3 σ (++), respectively. Continental outlines appear in black.
Application to Cloud Detection
The One-channel Cloudy-radiance-detection Approach (OCA) algorithm (Cuomo et al., 2004) was used here, based on the ALICE indices based on Vis06 and Ir108 SEVIRI bands, with the same implementation than the ALICE and IQR methods above for the estimation of NDVI and SLST anomalies. To that end, we used all cloud-free 12:00 UTC observations from 2007 to 2016. Then, we used our received Vis06 and Ir108 data from year 2017 to identify cloudy pixels, and downloaded 12:00 UTC EUMETSAT Cloud Masks (CLM, Eumetsat, 2007; Eumetsat, 2010) for year 2017 for accuracy assessment. We identified as cloudy all pixels for which either the Ir108 value is more than 3 monthly standard deviations below its monthly mean, or if the Vis06 value is above three monthly standard deviations above its monthly mean. We finally estimated kappa and overall accuracy values to assess the quality of our cloud masks, and to determine if the IQR method led to better cloud masking than the traditional ALICE method.
To validate our method for cloud masking, we retrieved the statistics on which our cloud mask is based during the period 2007–2016, and we applied it to year 2017 data. We used two approaches based on the OCA method: usual average and standard deviation estimation, and IQR-based moment estimation. We compared the resulting cloud masks to EUMETSAT CLM data from year 2017, by estimating kappa and overall accuracy statistics, averaging the results over space and time (Figure 6 left and right, respectively). We see that all retrieved statistics are stable throughout the year, with kappa values around 0.8, and overall accuracies of the order of 90%. The IQR-based moment estimation method performs slightly better than usual average and standard deviation estimation method, although the resulting statistics maps have a better spatial homogeneity (not shown) due to the lesser influence of outliers. As regards kappa and overall accuracy spatial distribution, they follow a similar pattern, with lower values for cloud prone areas (along the Equator, Antarctica), and for areas where the number of valid Eumetsat CLM data is reduced (outer portion of the disk). Since the Derrien and Le Gléau (2005) algorithm includes several external dependencies, which increase the complexity of the algorithm as well as processing time, we decided to implement our rough cloud mask for operative purposes.
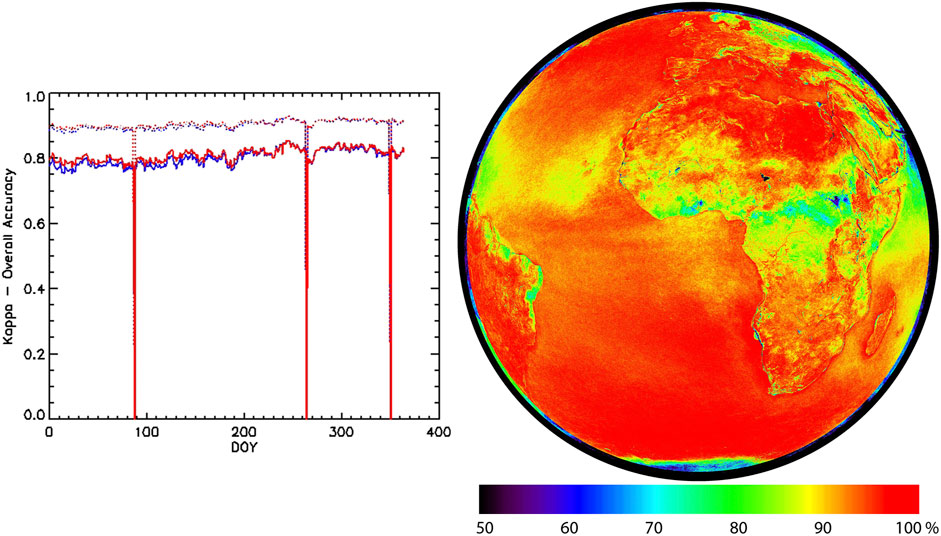
FIGURE 6. Left: Kappa (continuous line) and Overall Accuracy (dotted) values for IQR-based cloud mask (in red), and for usual moment-based cloud mask (blue) throughout 2017. Right: 2017 Overall Accuracy yearly averaged values for our cloud mask (IQR-based OCA).
Case Study: Llutxent Fire Event (2018/08/06—2018/08/09)
To illustrate the usefulness of the data processing flow and the dedicated webpage described above, we explored the behavior of the above-mentioned parameters for the Llutxent fire event, which took place in eastern Spain, at the beginning of August 2018. The fire was ignited by lightning, around 2:00 AM (local hour) on August 6, 2018, occurring an especially hot day (average air temperature above 28°C, more than 3°C above 30 years mean), with wind speeds of 50 km/h. The burnt area associated to this fire event is 2,952.6 ha (Espurna, 2018). The fire was finally extinguished on August 12, 2018 (Alloza et al., 2018), although it was declared under control on August 9, 2018. The vegetation burnt was mostly shrubs and trees (96%), with 64% of the burnt area being under protection regime (Alloza et al., 2018).
Figure 7 shows a subset of the ESA-CCI (European Space Agency—Climate Change Initiative; ESA-CCI, 2021) land cover reprojected to SEVIRI spatial resolution (using a pixel majority criterium), indicating the location of the Llutxent fire event. Figure 8 shows the same subsets of the NDVI and NDVI anomaly images for the previous months (since January 2018) at 12:00 (UTC—Coordinated Universal Time) for selected dates corresponding to cloud-free observations. Little change can be observed for the fire event area as regards NDVI values (top panel). However, NDVI anomalies do present changes, from lower than usual NDVI values (z-score below -2) in January 2018 to higher than usual NDVI values (z-score above +1) in March-April 2018, followed by usual values between June and August 2018. This implies that during the spring of 2018, vegetation growth was higher than usual, leading to an increase of available fuel during summer, when the hydric stress of the vegetation was higher.
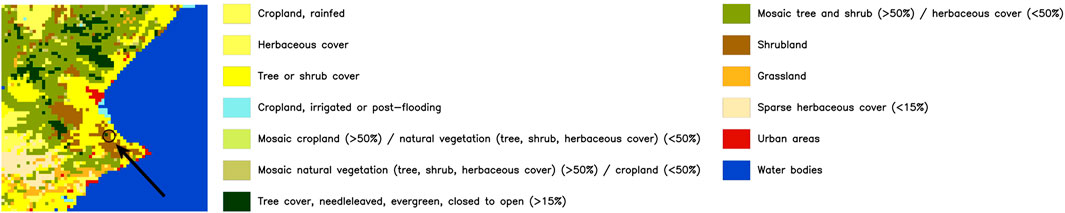
FIGURE 7. Subset of the European Space Agency Climate Change Initiative Land Cover classification for eastern Spain. Location of the Llutxent fire event is indicated by the black arrow.
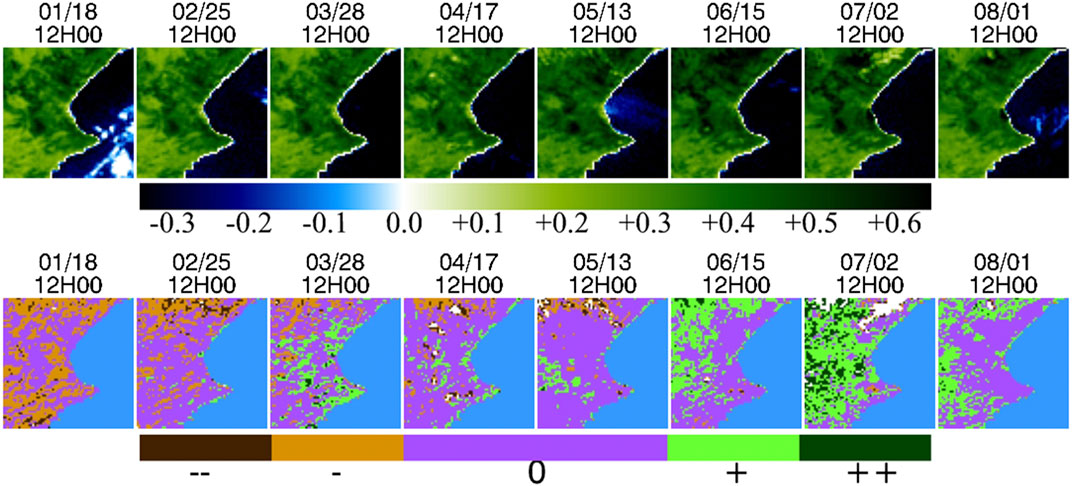
FIGURE 8. Top: NDVI subsets around the Llutxent fire event from January to August 2018 for cloud-free observations. Bottom: NDVI anomaly subsets around the Llutxent fire event from January to August 2018 for cloud-free observations. −−, −, 0, + and ++ correspond to z-score below −2, −1, +1, +2, and above +2, respectively.
Figure 9 presents the subsets of RGB, SLST and SLST anomaly images at 12:00 (UTC) from August 1 to 10, 2018, corresponding to the days before and at the start of the Llutxent fire event. No distinguishable change can be evidenced from the RGB subsets, except for the diffuse fire plume for August 7 and 8, running northeast from the fire location. As regards SLST values, we see that the surface temperatures were high (around 50°C) until August 6, decreasing progressively to more usual values (30°C) on August 10. This is emphasized by the SLST anomaly, reaching z-scores up to +2 and above for 4 out of 6 days until August 6 for most of the area. Therefore, hydric stress of the vegetation was extreme during this period, favoring the conditions for fire events. The electric storms during the night between August 5 and 6 provided the spark for the Llutxent fire event (as well as another 10 fire events—Espurna, 2018).
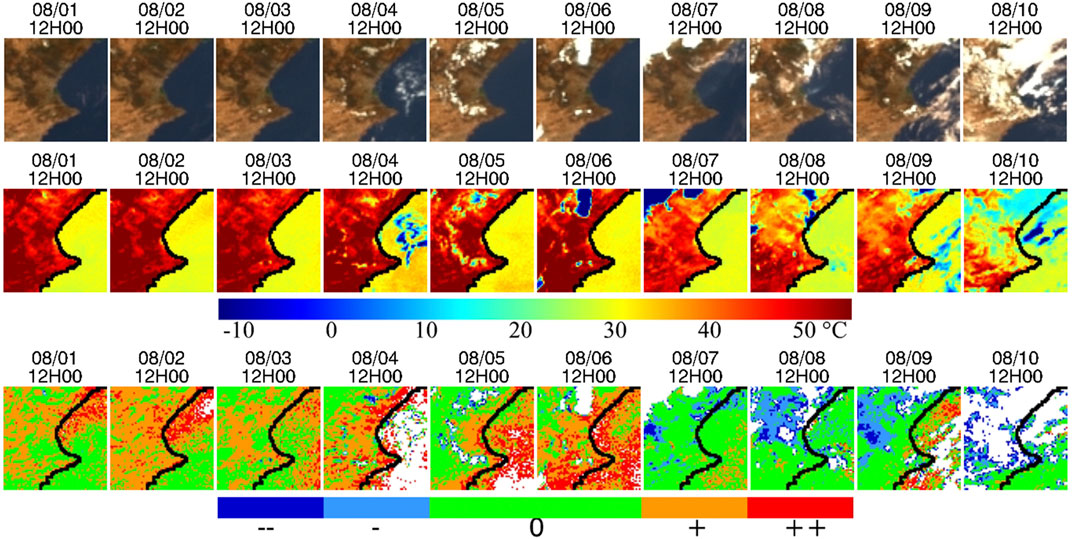
FIGURE 9. Top: RGB subsets around the Llutxent fire event for early August 2018 for cloud-free observations. Middle: SLST subsets around the Llutxent fire event for early August 2018 for cloud-free observations. Bottom: SLST anomaly subsets around the Llutxent fire event for early August 2018 for cloud-free observations. −−, −, 0, + and ++ correspond to z-score below −2, −1, +1, +2, and above +2, respectively.
Figure 10 presents the complete set of hotspots detected with the approach described above (109 in total), describing the images for which the pixels presented in Table 2 were identified as hotspots. Overall, seven pixels were identified as recurrent hotspots, with pixel number 4 showing the highest number of detections, as well as the longer time span. The first detection occurred for the 14:45 (UTC) image on August 6, 2018, corresponding to the data retrieved at 17:00 (local time) at our premises. The last detection occurred for the 15:00 UTC image on August 8, 2018, corresponding to the data retrieved at 17:15 (local time). This time span is considerably shorter than the extent of the fire event presented before, as expected from the coarse spatial resolution of SEVIRI sensor. Two pixels (numbers 3 and 4) concentrate 76% of the detections (Table 2) and most detections occurred at night and in the afternoon. The entire sequence of hotspot detection can be viewed in a time lapse video, accessible here: https://www.youtube.com/watch?v=Q9-jlEQEbSs (last accessed March 24, 2021).
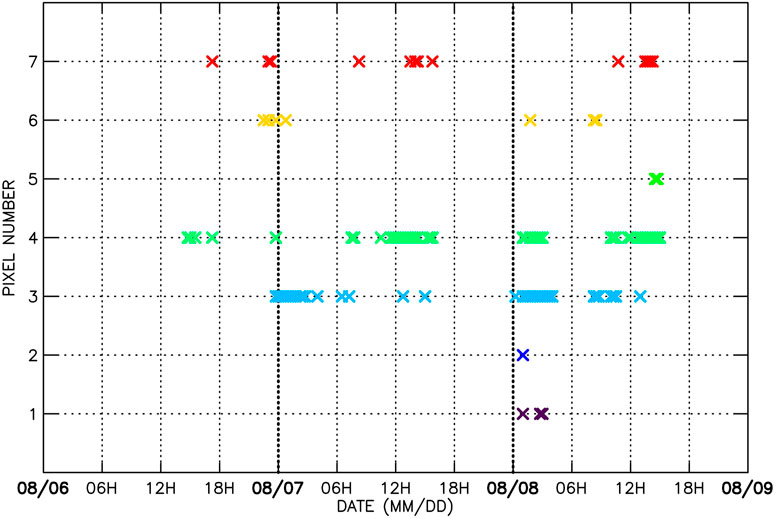
FIGURE 10. Timeline of the detected hotspots (described in Table 2) for the Llutxent fire event between August 6 to 9, 2018.
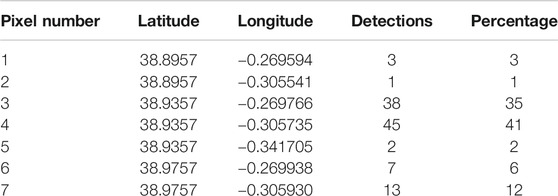
TABLE 2. Coordinates for detected hotspots during the Llutxent fire event and detection distribution between pixels.
Discussion and Conclusion
The algorithms presented above allow for a near-real time estimation of numerous biophysical parameters, as well as hotspot detection. More specifically, SST and LST parameters are provided with an accuracy similar to the ones provided by previous methods (Romaguera and Sobrino, 2006; Atitar and Sobrino, 2009; Freitas et al., 2010), with an RMSE of 0.67 K and 1.5 K respectively, and compiled in a single Sea and Land Surface Temperature (SLST) image. Our instantaneous cloud mask approach shows an adequate level of accuracy for our internal uses (masks for anomaly displays, hotspot detection, emissivity estimation), and provide us with a rapid assessment of cloud-free pixels, with no external dependencies. As for the hotspot detection, considering the difficult task of thorough validation at the considered scale, the partial validation we carried out is satisfactory, with a false alarm rate below 2%, mainly due to highly reflective surfaces and urban heat island effect. This false alarm rate could be improved by filtering the detections depending on such characteristics.
The algorithms described above have been implemented in our premises on a dedicated station, which allows to retrieve this complete set of parameters within 5 min of image completion. This implementation updates the MSG-SEVIRI processing chain described in Julien et al. (2015a), so that our whole MSG-SEVIRI archive has been reprocessed accordingly. Selected parameters (NDVI, SLST) are archived in a dedicated server, and available for download freely (provided registration at http://ceosspain.lpi.uv.es/home/), following the architecture described in Sevilla et al. (2015). A dedicated webpage has been designed to provide the wider public with these data (https://www.uv.es/iplsat). This webpage is available in three languages (English, Spanish and French), and presents the last available SLST data, along with the last available quicklook (updated every 15 min). NDVI data are also available for the 12:00 UTC image, corresponding to the acquisition with the least amount of shaded area. As for NDVI and SLST anomalies, they are also presented on a daily basis, using the 12:00 UTC acquisition. Finally, detected hotspots are presented on a Google map background, for the past 6 h for the whole SEVIRI disk, and the past 24 h for Europe, and updated with each new acquisition (every 15 min). We plan to update this service when Meteosat Third Generation (MTG) Flexible Combined Imager (FCI) data becomes available—scheduled for 2022. This dedicated webpage allows anybody, with or without scientific background, to follow the evolution of the parameters mentioned above for half of our planet. We used the Llutxent fire event of August 2018 to illustrate how the data presented in this webpage can be of interest for monitoring the surface of our planet. Additionally, short video animations based on the parameters mentioned above have been developed, and are accessible from the same webpage. These animations show for example the eclipse events of November 3, 2013 (quicklooks), or the correspondence between quicklooks and temperature images. These data are available freely, without any previous registration, to the general public, and can have numerous applications for educational, scientific and communication purposes.
Data Availability Statement
The datasets presented in this study can be found in online repositories. The names of the repository/repositories and accession number(s) can be found below: https://www.uv.es/iplsat; http://ceosspain.lpi.uv.es/home/.
Author Contributions
All authors listed have made a substantial, direct, and intellectual contribution to the work and approved it for publication.
Funding
This work was supported by the Spanish Ministerio de Ciencia, Innovación y Universidades (TIRSAT, project ESP 2017-85770-R).
Conflict of Interest
The authors declare that the research was conducted in the absence of any commercial or financial relationships that could be construed as a potential conflict of interest.
Acknowledgments
The authors also thank all the members of the Global Change Unit of the University of Valencia since 2007 for their help in the monitoring of our MSG-SEVIRI station, and EUMETSAT for providing backup MSG-SEVIRI data.
References
Alloza, J. A., Santana, V. M., Valdecantos, A., and Vallejo, V. R. (2018). Informe elaborado por el CEAM sobre el incendio forestal de Llutxent 2018, Conselleria de Agricultura, Medio Ambiente, Cambio Climático y Desarrollo Rural. D.G. Prevención de Incendios .Available at: https://www.google.com/url?sa=t&rct=j&q=&esrc=s&source=web&cd=&ved=2ahUKEwiLsuHrjMnvAhXLNcAKHbNsAoYQFjAAegQIARAD&url=http%3A%2F%2Fwww.agroambient.gva.es%2Fdocuments%2F162905929%2F163822469%2FInforme%2Belaborado%2Bpor%2Bel%2BCEAM%2Bsobre%2Bel%2Bincendio%2Bforestal%2Bde%2BLlutxent%2B%2B2018%2F40db3cbc-62e4-4f21-b044-c261b3facfcd&usg=AOvVaw2NuRz3K-K_RrTJi3Fo86CI (last accessed March 24, 2021).
Atitar, M., and Sobrino, J. A. (2009). A Split-Window Algorithm for Estimating LST from Meteosat 9 Data: Test and Comparison with Data and MODIS LSTs. IEEE Geosci. Remote Sensing Lett. 6 (1), 122–126. doi:10.1109/lgrs.2008.2006410
Calle, A., Casanova, J. L., and Romo, A. (2006). Fire Detection and Monitoring Using MSG Spinning Enhanced Visible and Infrared Imager (SEVIRI) Data. J. Geophys. Res. 111 (G3), G04S06. doi:10.1029/2005jg000116
Copernicus (2021). Open Access Data. Available at: https://scihub.copernicus.eu/ (last accessed January 27, 2021).
Cuomo, V., Filizzola, C., Pergola, N., Pietrapertosa, C., and Tramutoli, V. (2004). A Self-Sufficient Approach for GERB Cloudy Radiance Detection. Atmos. Res. 72 (1–4), 39–56. (Special Issue on “Clouds and Radiation”). doi:10.1016/j.atmosres.2004.03.030
Derrien, M., and Le Gléau, H. (2005). MSG/SEVIRI cloud mask and type from SAFNWC. Int. J. Remote Sens. 26 (21), 4707–4732. doi:10.1080/01431160500166128
Dozier, J. (1981). A Method for Satellite Identification of Surface Temperature Fields of Subpixel Resolution. Remote Sensing Environ. 11, 221–229. doi:10.1016/0034-4257(81)90021-3
EFFIS (2021). European Forest Fire Information System Current Situation. Available at: https://effis.jrc.ec.europa.eu/apps/effis_current_situation/index.html (last accessed March 24, 2021).
ESA-CCI (2021). European Space Agency Climate Change Initiative. Available at: http://maps.elie.ucl.ac.be/CCI/viewer/index.php (last accessed March 24, 2021).
Espurna (2018). Boletín informativo de Prevención de Incendios Espurna, numero 111, Agosto 2018Unitat Tècnica UT-902. Generalitat Valenciana: Servicio de Prevención de Incendios Forestales.
EUMETSAT (2007). Cloud Detection for MSG - Algorithm Theoretical Basis Document. Doc N. EUM/MET/REP/07/0132.Issue: v2, (Date: 14 November 2007).
EUMETSAT (2010). CloudMask Factsheet. Doc N. EUM/OPS/DOC/09/5164. Issue:v1, (Date: October 6, 2010).
Filizzola, C., Corrado, R., Marchese, F., Mazzeo, G., Paciello, R., Pergola, N., et al. (2017). RST-FIRES, an Exportable Algorithm for Early-Fire Detection and Monitoring: Description, Implementation, and Field Validation in the Case of the MSG-SEVIRI Sensor. Remote Sensing Environ. 192, e2–e25. doi:10.1016/j.rse.2017.01.019
Freitas, S. C., Trigo, I. F., Bioucas-Dias, J. M., and Gottsche, F. (2010). Quantifying the Uncertainty of Land Surface Temperature Retrievals from SEVIRI/Meteosat. IEEE Trans. Geosciences Remote Sensing 48 (1), 523–534. doi:10.1109/tgrs.2009.2027697https://doi.org/10.1109/TGRS.2009.2027697
ISS (2021). ISS High Definition Live Streaming Video of the Earth (HDEV). Available at: https://eol.jsc.nasa.gov/ESRS/HDEV/ (last accessed January 27, 2021).
Julien, Y., Sobrino, J. A., and Sòria, G. (2015a). Retrieving and Broadcasting Near-Real-Time Biophysical Parameters from MODIS and SEVIRI Receiving Stations at the Global Change Unit of the University of Valencia. Int. J. Remote Sensing 36, 5273–5288. doi:10.1080/01431161.2015.1040134
Julien, Y., Sobrino, J. A., Mattar, C., and Jiménez-Muñoz, J.-C. (2015b). Near Real-Time Estimation of Water Vapor Column from MSG SEVIRI Thermal Infrared Bands: Implications for Land Surface Temperature Retrieval. IEEE Trans. Geosci. Remote Sensing 53 (8), 4231–4237. doi:10.1109/tgrs.2015.2393378
LAADS DAAC (2021). Available at: https://ladsweb.modaps.eosdis.nasa.gov/ (last accessed January 27, 2021).
LSA-SAF (2021). LSA-SAF Catalogue. Available at: https://landsaf.ipma.pt/en/data/catalogue/ (last accessed January 27, 2021).
NASA (2021). NASA | LANCE | FIRMS. Available at: https://firms.modaps.eosdis.nasa.gov/ (last accessed January 27, 2021).
Pedelty, J., Devadiga, S., Masuoka, E., Brown, M., Pinzon, J., Tucker, C., et al. (2007). Generating a Long-Term Land Data Record from the AVHRR and MODIS Instruments. Int. Geosci. Remote Sensing Symp. (Igarss), 1021–1025. doi:10.1109/IGARSS.2007.4422974
Rahman, H., and Dedieu, G. (1994). SMAC: a Simplified Method for the Atmospheric Correction of Satellite Measurements in the Solar Spectrum. Int. J. Remote Sensing 15 (1), 123–143. doi:10.1080/01431169408954055
Reuter, M., and Pfeifer, S. (2011). Moments from Space Captured by MSG SEVIRI. Int. J. Remote Sensing 32 (14), 4131–4140. doi:10.1080/01431161.2011.566288
Romaguera, M., Sobrino, J. A., and Olesen, F. S. (2006). Estimation of Sea Surface Temperature from SEVIRI Data: Algorithm Testing and Comparison with AVHRR Products. Int. J. Remote Sensing 27, 5081–5086. doi:10.1080/01431160500165674
Olesen, J., Julien, Y., Sória, G., Sobrino, J. A., and Plaza, A. (2015). New Geo-Portal for MODIS/SEVIRI Image Products with Geolocation-Based Retrieval Functionality. J. Appl. Remote Sens 9 (1), 096079. doi:10.1117/1.JRS.9.096079
Sobrino, J. A., Jiménez-Muñoz, J. C., Soria, G., Romaguera, M., Guanter, L., Moreno, J., et al. (2008). Land Surface Emissivity Retrieval from Different VNIR and TIR Sensors. IEEE Trans. Geosci. Remote Sensing 46 (2), 316–327. doi:10.1109/tgrs.2007.904834https://doi.org/10.1109/TGRS.2007.904834
Sobrino, J. A., Julien, Y., Jiménez-Muñoz, J.-C., Skokovic, D., and Sòria, G. (2020). Near Real-Time Estimation of Sea and Land Surface Temperature for MSG SEVIRI Sensors. Int. J. Appl. Earth Observation Geoinformation 89, 102096. doi:10.1016/j.jag.2020.102096
Tramutoli, V. (1998). Robust AVHRR Techniques (RAT) for Environmental Monitoring: Theory and Applications, Earth Surface Remote Sensing II. Proc. SPIE 3496, 101–113.
Tramutoli, V. (2007). Robust Satellite Techniques (RST) for Natural and Environmental Hazards Monitoring and Mitigation: Theory and Applications. Proc. Multitemp. doi:10.1109/multitemp.2007.4293057http://dx.doi.org/10.1109/MULTITEMP.2007.4293057
Tucker, C. J. (1979). Red and Photographic Infrared Linear Combinations for Monitoring Vegetation. Remote Sensing Environ. 8 (2), 127–150. doi:10.1016/0034-4257(79)90013-0
Upton, G., and Cook, I. (1996). Understanding Statistics, Oxford: University Press. 55.
USGS (2021). Landsat Data Access. Available at: https://www.usgs.gov/core-science-systems/nli/landsat/landsat-data-access?qt-science_support_page_related_con=0#qt-science_support_page_related_con (last accessed January 27, 2021).
Keywords: temperature, NDVI, anomaly, quicklook, SST, LST
Citation: Sobrino JA and Julien Y (2021) Near Real-Time Processing Chain for MSG SEVIRI Data for Free and Immediate Earth Monitoring Capabilities. Front. Remote Sens. 2:666516. doi: 10.3389/frsen.2021.666516
Received: 10 February 2021; Accepted: 06 April 2021;
Published: 04 May 2021.
Edited by:
Benjamin Bechtel, Ruhr University Bochum, GermanyReviewed by:
Panagiotis Sismanidis, Ruhr University Bochum, GermanyKlemen Zakšek, University of Hamburg, Germany
Copyright © 2021 Sobrino and Julien. This is an open-access article distributed under the terms of the Creative Commons Attribution License (CC BY). The use, distribution or reproduction in other forums is permitted, provided the original author(s) and the copyright owner(s) are credited and that the original publication in this journal is cited, in accordance with accepted academic practice. No use, distribution or reproduction is permitted which does not comply with these terms.
*Correspondence: Yves Julien, yves.julien@uv.es; José A. Sobrino, sobrino@uv.es