 Jiuyi Zhang
 Yong Meng Sua1
 Yongxiang Hu
- 1Department of Physics and Center for Quantum Science and Engineering, Stevens Institute of Technology, Hoboken, NJ, United States
- 2NASA Langley Research Center, Hampton, VA, United States
Oxygen A-band measurements can provide important information about cloud top height, cloud physical and optical thickness, and surface atmospheric pressure. So far, O2 A-band measurements are typically made with spectrometers at a spectral resolution of 40 p.m. (such as in the OCO-2 satellite) or a coarser resolution. This paper reports a new CubeSat measurement concept with higher spectral resolution over the O2 A-band using integrated photonic circuits and solar photon counting techniques. An integrated Micro-ring filter (MRR) chip with 10 p.m. resonant linewidth with an extinction ratio of 25 dB or higher is designed, fabricated, and used for precise measurements of the atmospheric oxygen A-band absorption line-shapes around 770 nm. With solar-photon counting and using a narrow-band filter made of an integrated, fast-swept MRR on lithium niobate on insulator (LNOI), we have demonstrated a high-resolution measurement of the O2 A-band absorption spectrum, exhibiting good agreement with the HITRAN database.
1 Introduction
There are significant potential scientific benefits of O2 A-band multi-angle measurements. For example, they can accurately measure cloud properties such as cloud top height and cloud physical thickness (Fischer and Grassl, 1991; Min and Harrison, 1999; Koelemeijer et al., 2001; Cornet et al., 2010; Schuessler et al., 2014; Yang et al., 2021), surface atmospheric pressure (Barton and Scott, 1986; Vanbauce et al., 1998; Tran and Hartmann, 2008; Fischer et al., 2009), aerosol properties (van Diedenhoven et al., 2005; Hollstein and Fischer, 2014; Nanda et al., 2018; Davis and Kalashnikova, 2019; Gao et al., 2019; Remer et al., 2019), and chlorophyll fluorescence (Perez-Priego et al., 2005; Frankenberg et al., 2011; RayChaudhuri, 2012; Sanders and de Haan, 2013). These and other scientific benefits have been demonstrated from O2 A-band measurements from satellites, such as POLDER (POLarization and Directionality of the Earth’s Reflectances), SCIAMACHY (The SCanning Imaging Absorption spectroMeter for Atmospheric CartograpHY), and OCO-2 (Orbiting Carbon Observatory-2).
Until now, O2 A-band measurements have not been demonstrated from instruments on CubeSats. In this study, we demonstrate an innovative photonic integrated circuit concept that potentially supports high spectral resolution (0.01 nm) for O2 A-band measurements suitable for CubeSats missions. Compared with grating spectrometer system equipped with satellites (i.e OCO-3), our 10 p.m. linewidth integrated MRR filter perform more than 25 dB suppression of photons in off-resonance wavelengths. This device highlights the potential applications of integrated photonics in satellite-based remote sensing systems for high detection sensitivity, superior resolution, and significantly reduced size, weight, and power (SWaP). Therefore, our vision is to be able to launch tens of CubeSats that carry these new O2 A-band instruments to provide high spatial and temporal resolution measurements of aerosols, clouds, ocean and land surfaces.
2 Methodology
2.1 Study region description
This paper reports an interdisciplinary study between remote sensing and integrated photonic circuit. We use an integrated lithium niobate Micro-ring filter (MRR) chip, as shown in Figure 1, to measure the atmospheric oxygen A-band absorption lineshape around 770 nm. Lithium niobate on insulator (LNOI) is our study’s chosen photonic integrated circuit (PIC) platform due to its excellent optical properties in many aspects. Notably, its outstanding electro-optic (Zhang et al., 2019) and efficient thermo-optic effects (Liu et al., 2020), wide transparent window ranging from ultraviolet (UV) to mid-infrared (mid-IR) (Zhu et al., 2021), high thermal-optical stability (Qi and Li, 2020), and low propagation and insertion losses are ideal for the development of tunable ultra narrow-linewidth MRR filters for sensing of various gas species or even the sun-induced-fluorescence through Fraunhofer lines (Zhang et al., 2021). Utilizing the single photon sensitive photon counting technique has proven to be successful for remote sensing applications in many previous works (Ai et al., 2016).
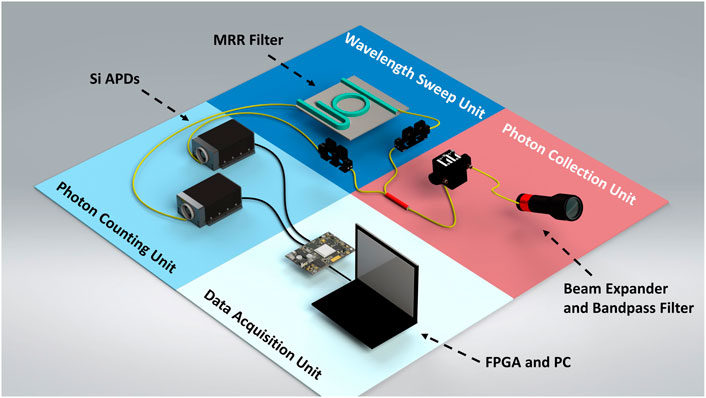
FIGURE 1. Illustration of the atmospheric O2 A-band absorption spectroscopy with solar photon counting and LNOI MRR filter.
2.2 Device design and fabrication
Our system consists of four units: solar photon collection unit, MRR filter’s wavelength sweeping unit, photon counting unit, and data acquisition unit. In the photon collection unit, a beam expander collects solar photons and is coupled into a single-mode fiber via a fiber collimation lens. A tunable chip-integrated ultra-narrow filter fabricated on a thin-film lithium niobate insulator (LNOI) is a core device for filtering photons in different wavelengths (Zhang et al., 2021). Figure 2A shows the size of our PIC chip, with the integrated MRR with 40 μm radius shown in Figure 2B. Two silicon avalanche photon detectors (Si APDs, Excelitas SPCM-AQRH-13) in the photon counting unit with high quantum efficiency (65%) and low dark counts (500 Hz), are used to measure the solar photon counts from the MRR filter. In the data acquisition unit, a field-programmable-gate-array (FPGA, Xilinx Zynq-7000) is introduced as the central processor to record the photon counting and wavelengths to retrieve the atmospheric oxygen absorption spectrum. Figure 2A shows size of a single MRR filter nanophotonic chip, with the integrated MRR with 40 μm radius shown in Figure 2B. With the integrated lithium niobate nanophotonic chip, the commercial available Si APDs, and the FPGA, our system are greatly portable for outdoor and airborne missions.
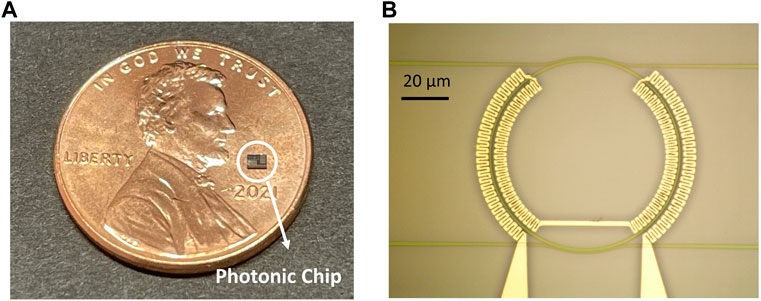
FIGURE 2. (A) The size comparison between our photonic integrated micro-ring filter circuit chip with a U.S. Penny. (B) Microscopic image of MRR filter.
A tunable Micro-ring resonator (MRR) filter with ultra-narrow full-width at half maximum (FWHM) is a powerful tool for measuring the photon counting (Zhang et al., 2021), as shown in Figure 3A. The MRR filter is fabricated as an add-drop micro-ring resonator with an integrated platinum micro-heater with 10-nm titanium and 100-nm platinum deposited on the top of the silica cladding from a commercial 300-nm thin film of X-cut LiNbO3 shown in Figure 2B. When the light of resonance wavelength passes through an input-output waveguide, it builds up in intensity due to constructive interference, and it outputs to the add-drop waveguide to generate periodical Lorentzian-shaped spectra (Bogaerts et al., 2012), as Figure 4A. The light of the on-resonance wavelength is coupled out from PIC, and the light of the off-resonance wavelength is not. A resonance-tunable add-drop spectrum shown in Figure 3B is an ultra-narrow spectral window for measuring the solar photons and retrieving the atmospheric oxygen absorption lineshape. The thin-film waveguide is shallowly etched by 180 nm for the waveguide while leaving a 120 nm slab across the chip to reduce propagation loss and ensure the narrow linewidth (Desiatov et al., 2019). To excite only the fundamental TE mode in the MRR while suppressing all other high-order guided modes, the top widths of the MRR and waveguides are 0.48 μm and 0.28 μm, respectively, designed to fulfill the phase-matching condition for the single mode coupling (Hosseini et al., 2010).
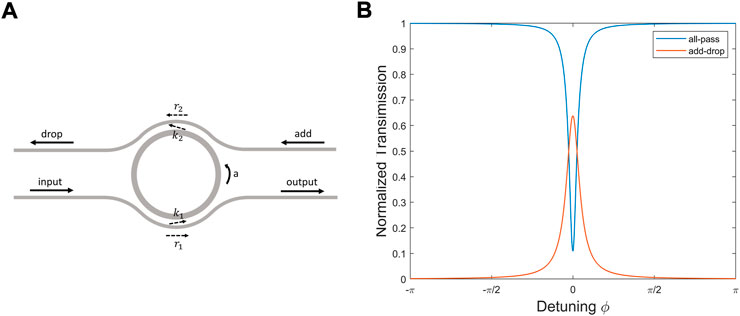
FIGURE 3. (A) The illustration of add-drop micro-ring resonator filter structure. (B) The simulated output spectra of all-pass and add-drop port from the micro-ring resonator.
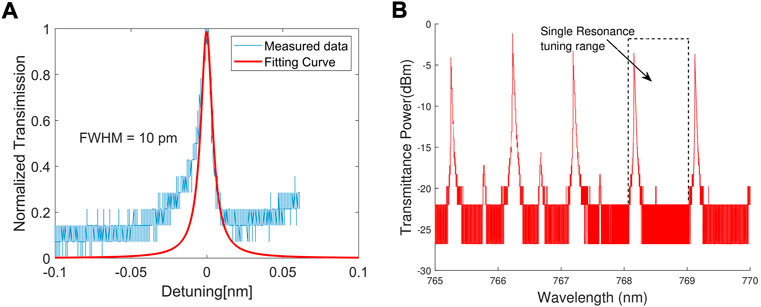
FIGURE 4. (A) The measured transmission spectrum and its fitting curve of the LNOI MRR filter. (B) The measured MRR filter transmission spectrum and an example of a single resonance tuning range.
Thermal-induced change in the effective refractive index of a mode has been used as a resonance frequency tuning method in micro-cavities (Liu et al., 2020). The resonance wavelength is rapidly swept by applying varying bias voltages on the integrated platinum micro-heater by changing the local temperature of the MRR. The thermal tunability of wavelength is verified by comparing its direct laser transmission measurement, shown in Figure 5A. The resonance wavelength in the calibrated MRR filter is applied to measure the spectrum of sunlight passing through the atmosphere. This configuration can also allow us to measure the potassium (K) I solar Fraunhofer line near 770 nm to observe the sun-induced chlorophyll fluorescence (SIF) of vegetation from space. (Joiner et al., 2011).
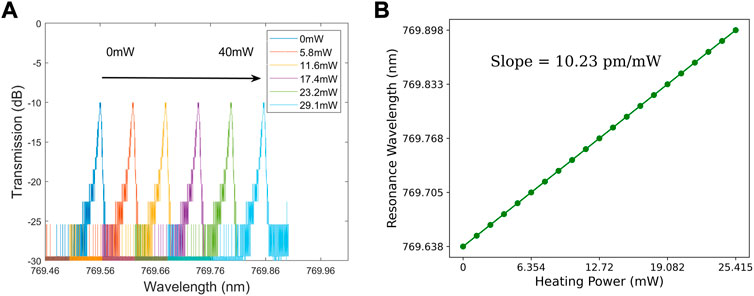
FIGURE 5. (A) The MRR filter transmission spectrum red shifted by the applied electric power. (B) The thermo-optical calibration data and their linear fitting.
To retrieve the oxygen absorption spectrum within hundreds of picometres and without multi-resonance ambiguity, the MRR filter’s radius is designed equal to 40 μm, to achieve the 1 nm free spectral range (FSR) around 770 nm. As Figure 4B shows, to make a 1 nm bandwidth single resonance tuning range. However, the small size of the MRR filter decreases the effective length of the integrated platinum heater wire and weakens the thermal tunability. To deal with this problem, a zigzag-shaped platinum micro-heater was engineered circular around the MRR filter inner and otter, as shown in Figure 2B for 1) prolong the effective length of the micro-heater to increase the resistance, and 2) reduces light absorption due to metal deposition directly on top of the waveguides. This design not only enhances the thermal-optical tunability but also narrows the linewidth of MRR. In the future, a scalable solution can be implemented using cascaded micro-ring resonators and high-end long-pass filters (Guo et al., 2016) to realize the real integrated on-chip filter on a single photonic chip Boeck et al. (2010). Also prospective is the integration of single-photon detector on the same chip, for which NbN superconducting nanowire single-photon detectors have been recently demonstrated on thin-film lithium niobate Sayem et al. (2020); Colangelo et al. (2020). By these advances, the presently demonstrated technique could lead to impactful applications in multiple areas of space borne remote sensing.
3 Measurements and results
We calibrate the MRR filter with a tunable laser (New Focus, TLB-6700). The atmospheric absorption spectrum between 760 to 770 nm is simulated using the HITRAN 2020 (high-resolution transmission molecular absorption) database (Gordon et al., 2022). We use an ultra-narrow bandpass filter (Alluxa 769.89-1 OD7) to define a ±1 nm spectral window with 769.89 nm center wavelength to detect an Oxygen doublet line shape between 769.72 nm to 770 nm. To characterize the MRR, an electric current is applied to the micro-heater from an external power supply (GPD-4303S, Instek), whose power is increased from 24 mW to 38.4 mW at a 0.8 mW interval. Figure 5A shows the MRR spectrum in different wavelengths by tuning the applied electric power from 0 mW to 29.1 mW. The fitting results are shown in Figures 5A,B linear redshift of the filter’s center wavelength from 769.72 nm to 770 nm at a 13 p.m. step size is measured. This good linearity is the key to the proposed spectroscopic measurement. Currently, the coarser thermal tuning step size of the MRR is limited by the tunable laser used for its’ characterization. Finer tune step size can be achieved using a narrow linewidth tunable laser system with higher resolution.
The experimental setup for measuring the atmospheric O2 absorption lineshape is outlined in Figure 6. It consists of a free-space-to-fiber beam reducer (Thorlabs-GBE10-C) to collect the solar irradiation into a multi-mode fiber (50-micron diameter) spliced into a single-mode fiber. A bandpass filter blocks the transmitted solar radiation to a ±0.6 nm spectral window centered at 769.89 nm. A polarizer is introduced to couple the polarized solar photons into the single-mode MRR filter. The polarized light splits into two channels with a 99:1 coupler, with 99% of the light coupled into the MRR filter on the LNOI chip and the remaining 1% directly into the reference channel Si APD. This configuration allows us to account for the photon count variation in real-time due to the fluctuations in the fiber coupling and the dynamic atmosphere attenuation induced by, for example, cloud coverage, solar zenith angle, or atmospheric scattering. The MRR filter’s output is fiber-coupled into the signal channel Si APD to count the photon numbers while the filter is swept from 769.72 nm to 770 nm. A FPGA is employed as the central processor for tuning the center wavelength of the MRR filter by varying the electric heating power on the Pt micro-heater and acquiring synchronized photon counting data from the two Si APDs channels. Table 1 lists the parameters of each part of the system.
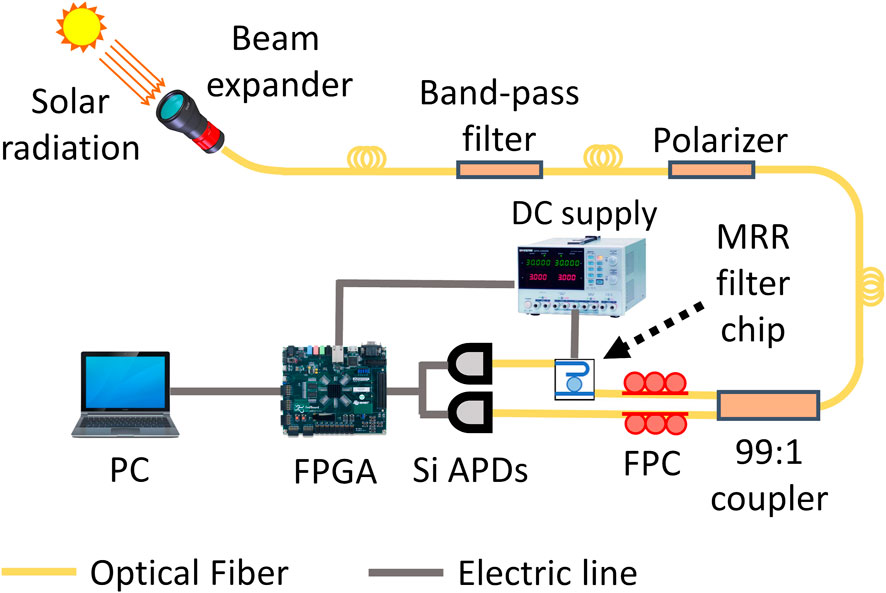
FIGURE 6. The experimental setup of atmospheric O2 spectroscopic measurement system.
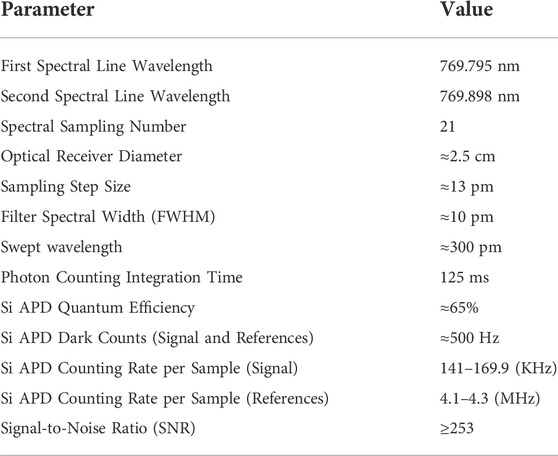
TABLE 1. A galance of the system parameters.
The integration time of photon counting per sample point is 125 ms in the current system, rendering the total data acquisition time around 2.6 s. Here, an adequate integration time is crucial to attaining statistical significance by suppressing the Poissonian noise with single-photon counts. This ensures the signal-to-noise ratio (SNR),
We plot the normalized photon counts to retrieve the atmospheric O2 absorption spectrum. The result is shown in Figure 7 along with the calculated dry-air O2 absorption spectrum from the HITRAN 2020 (temperature: 296 K, pressure: 1 atm). An good agreement is seen, both on the absorption linewidth and depth. Specifically, the measured linewidth between two absorption line is about 104.5 p.m., compared with 102 p.m. as extracted from the HITRAN database. This small discrepancy is within the error caused by the 10 p.m. resolution of the MRR filter. The depth extinction is 0.906 by fitting the measurement results with a Lorentzian function, which agrees with the HITRAN database value of 0.901, too. The solar photon counting rate of the signal channel is equal to 141 kHz at 769.795 nm. The maximum photon counting rate outside these doublet absorption lines is equal to 169.9 kHz. The photon counting rate from the reference channel fluctuates between 4.1 to 4.3 MHz during the data-acquiring time. The dark counts for signal and reference Si APDs equal 500 Hz, much lower than the detection photon counts. Benefiting from the ultra-low noise of our system, only several tens of thousands of photon counts were needed per spectral point to retrieve the fine lineshape of the atmospheric O2 band around 769.795 nm and 769.898 nm. Also, atmospheric solar photons around 770 nm are much more than mid-inferred wavelengths (i.e., 1,570 nm); therefore, the solar photon counting of visible light has a higher photon counts rate to obtain better SNR in remote sensing.
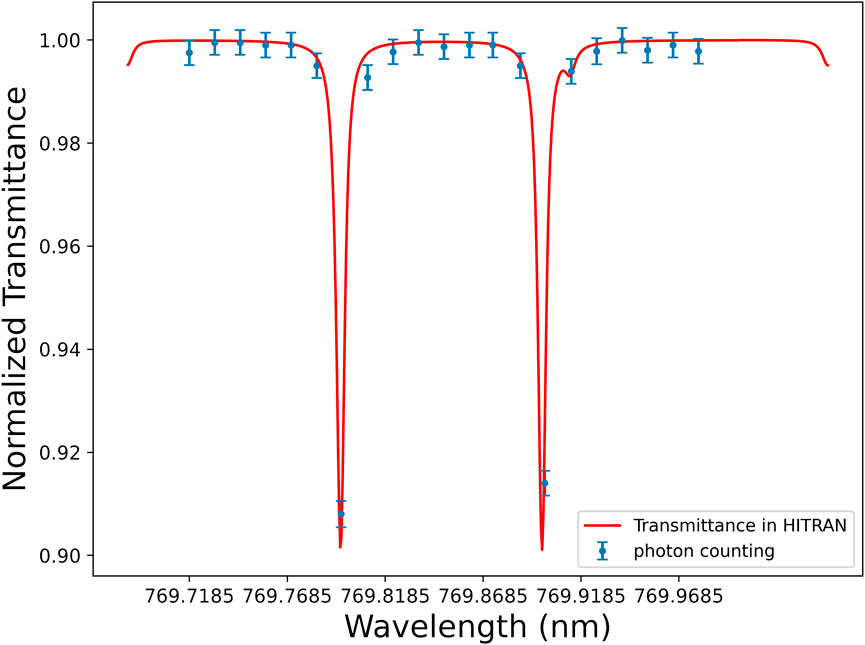
FIGURE 7. The solar photon counts through the atmosphere around the oxygen absorption spectrum doublet lineshape between 769.72 nm to 770 nm, and the simulated transmittance using HITRAN 2020 database.
4 Conclusion and outlooks
Our results show that the combined LNOI-based integrated photonics and single-photon detection promise photon-efficient remote sensing. With two channeled photon counts simultaneously recorded in the Si APD channel, we could acquire the visible absorption spectrum with high resolution and accuracy amid the imperfections in sunlight couplings and dynamic atmospheric conditions without adaptive optics. The present spectroscopy can prove helpful in pervasive deployments in satellite, airborne, and wide-field missions with fast scanning, single-photon sensitive, high resolution, and ultra-low detection noise. Real-time, dynamic monitoring of the atmospheric O2 concentration can be realized by using dual MRR filters on a single nanophotonic chip, with one tuned into the absorption line (i.e., on-line) and the other off (i.e., off-line) while recording the ratio of their photon counts using Si APDs. Also, a similar system can be applied to monitoring the sun-induced fluorescence of vegetation using two-dual MRR filter sets, with one centered at the oxygen B-band (i.e., 687 nm) and another one at the oxygen A-band (i.e., 760 nm), to maximize the detectability of fluorescence photons through the deepest solar Fraunhofer lines of O2 (Cendrero et al., 2019). This approach is similar to the IPDA lidar but without restriction in laser wavelength. Moreover, space-borne spatial and temporal monitoring and measurement of aerosols, clouds, ocean, and land surfaces are possible by leveraging the photonics chip’s scalability and broadband nature of solar radiation.
Our new system highlights the potential of adopting integrated photonics and single-photon counting in remote sensing systems for high detection sensitivity, superior resolution, and significantly reduced device size and weight. However, to be compatible with the current remote sensing spectral measurements and provide more precise spectroscopic results, we are looking forward to the data training from current ground-based and airborne databases in the future.
Data availability statement
The raw data supporting the conclusions of this article will be made available by the authors, without undue reservation.
Author contributions
JZ is the first author who designed, fabricated, tested the device and finished the experiment, and collected all data and contributed most part in the paper writing. YS is the second author who helped JZ to build the experimental setup and also contributed to the paper writing. YH is the third and corresponding author who contributed to innovative research ideas. JR is the fourth author who helped JZ to build the experimental setup. Y-PH is the corresponding author and principal investigator in this project.
Funding
This study was supported by the NASA Langley Research Center’s IRAD program Grant (No. 80NSSC19K1618).
Acknowledgments
We acknowledge ASRC nanofabrication facility at CUNY for device fabrication.
Conflict of interest
The authors declare that the research was conducted in the absence of any commercial or financial relationships that could be construed as a potential conflict of interest.
Publisher’s note
All claims expressed in this article are solely those of the authors and do not necessarily represent those of their affiliated organizations, or those of the publisher, the editors and the reviewers. Any product that may be evaluated in this article, or claim that may be made by its manufacturer, is not guaranteed or endorsed by the publisher.
References
Ai, X., Pérez-Serrano, A., Quatrevalet, M., Nock, R. W., Dahnoun, N., Ehret, G., et al. (2016). Analysis of a random modulation single photon counting differential absorption lidar system for space-borne atmospheric CO_2 sensing. Opt. Express 24, 21119–21133. doi:10.1364/OE.24.021119
Barton, I. J., and Scott, J. C. (1986). Remote measurement of surface pressure using absorption in the oxygen a-band. Appl. Opt. 25, 3502–3507. doi:10.1364/AO.25.003502
Boeck, R., Jaeger, N. A. F., Rouger, N., and Chrostowski, L. (2010). Series-coupled silicon racetrack resonators and the vernier effect: Theory and measurement. Opt. Express 18, 25151–25157. doi:10.1364/OE.18.025151
Bogaerts, W., De Heyn, P., Van Vaerenbergh, T., De Vos, K., Kumar Selvaraja, S., Claes, T., et al. (2012). Silicon microring resonators. Laser Phot. Rev. 6, 47–73. doi:10.1002/lpor.201100017
Cendrero, M., Wieneke, S., Damm, A., Alonso, L., Pinto, F., Moreno, J., et al. (2019). Sun-induced chlorophyll fluorescence iii: Benchmarking retrieval methods and sensor characteristics for proximal sensing. Remote Sens. 11, 962. doi:10.3390/rs11080962
Cornet, C., Thieuleux, F., Ferlay, N., Davis, A. B., Dubuisson, P., Ducos, F., et al. (2010). Toward new inferences about cloud structures from multidirectional measurements in the oxygen a band: Middle-of-cloud pressure and cloud geometrical thickness from polder-3/parasol. J. Appl. Meteorol. Climatol. 49, 2492–2507. doi:10.1175/2010jamc2550.1
Colangelo, M., Desiatov, B., Zhu, D., Holzgrafe, J., Medeiros, O., Loncar, M., et al. (2020). Superconducting nanowire single-photon detector on thin- film lithium niobate photonic waveguide. In Conference on Lasers and Electro-Optics (Optica Publishing Group), OSA Technical Digest. doi:10.1364/CLEO_SI.2020.SM4O.4
Davis, A. B., and Kalashnikova, O. V. (2019). Aerosol layer height over water via oxygen A-band observations from space: A tutorial. Springer Series in Light Scattering, 133–166. book section Chapter 4. doi:10.1007/978-3-030-03445-0_4
Desiatov, B., Shams-Ansari, A., Zhang, M., Wang, C., and Lončar, M. (2019). Ultra-low-loss integrated visible photonics using thin-film lithium niobate. Optica 6, 380. doi:10.1364/optica.6.000380
Fischer, J., and Grassl, H. (1991). Detection of cloud-top height from backscattered radiances within the oxygen A band. Part 1: Theoretical study. J. Appl. Meteor. 30, 1245–1259. doi:10.1175/1520-0450(1991)030⟨1245:DOCTHF⟩2.0.CO;2
Fischer, J., Preusker, R., and Lindstrot, R. (2009). The retrieval of land surface pressure from meris measurements in the oxygen a band. J. Atmos. Ocean. Technol. 26, 1367–1377. doi:10.1175/2009jtecha1212.1
Frankenberg, C., Butz, A., and Toon, G. C. (2011). Disentangling chlorophyll fluorescence from atmospheric scattering effects in o2a-band spectra of reflected sun-light. Geophys. Res. Lett. 38. doi:10.1029/2010gl045896
Gao, M., Zhai, P.-W., Yang, Y., and Hu, Y. (2019). Cloud remote sensing with epic/dscovr observations: A sensitivity study with radiative transfer simulations. J. Quantitative Spectrosc. Radiat. Transf. 230, 56–60. doi:10.1016/j.jqsrt.2019.03.022
Gordon, I. E., Rothman, L. S., Hargreaves, R. J., Hashemi, R., Karlovets, E. V., Skinner, F. M., et al. (2022). The hitran2020 molecular spectroscopic database. J. Quantitative Spectrosc. Radiat. Transf. 277, 107949. doi:10.1016/j.jqsrt.2021.107949
Guo, X., Zou, C. L., and Tang, H. X. (2016). 70 db long-pass filter on a nanophotonic chip. Opt. Express 24, 21167–21176. doi:10.1364/OE.24.021167
He, L., Zhang, M., Shams-Ansari, A., Zhu, R., Wang, C., and Marko, L. (2019). Low-loss fiber-to-chip interface for lithium niobate photonic integrated circuits. Opt. Lett. 44, 2314–2317. doi:10.1364/OL.44.002314
Hollstein, A., and Fischer, J. (2014). Retrieving aerosol height from the oxygen a band: A fast forward operator and sensitivity study concerning spectral resolution, instrumental noise, and surface inhomogeneity. Atmos. Meas. Tech. 7, 1429–1441. doi:10.5194/amt-7-1429-2014
Hosseini, E. S., Yegnanarayanan, S., Atabaki, A. H., Soltani, M., and Adibi, A. (2010). Systematic design and fabrication of high-q single-mode pulley-coupled planar silicon nitride microdisk resonators at visible wavelengths. Opt. Express 18, 2127–2136. doi:10.1364/OE.18.002127
Joiner, J., Yoshida, Y., Vasilkov, A. P., Yoshida, Y., Corp, L. A., and Middleton, E. M. (2011). First observations of global and seasonal terrestrial chlorophyll fluorescence from space. Biogeosciences 8, 637–651. doi:10.5194/bg-8-637-2011
Koelemeijer, R. B. A., Stammes, P., Hovenier, J. W., and de Haan, J. F. (2001). A fast method for retrieval of cloud parameters using oxygen a band measurements from the global ozone monitoring experiment. J. Geophys. Res. 106, 3475–3490. doi:10.1029/2000jd900657
Li, Y., Lan, T., Li, J., and Wang, Z. (2020). High-efficiency edge-coupling based on lithium niobate on an insulator wire waveguide. Appl. Opt. 59, 6694–6701. doi:10.1364/AO.395897
Liu, X., Ying, P., Zhong, X., Xu, J., Han, Y., Yu, S., et al. (2020). Highly efficient thermo-optic tunable micro-ring resonator based on an lnoi platform. Opt. Lett. 45, 6318–6321. doi:10.1364/OL.410192
Min, Q., and Harrison, L. (1999). Joint statistics of photon pathlength and cloud optical depth. Geophys. Res. Lett. 26, 1425–1428. doi:10.1029/1999gl900246
Nanda, S., de Graaf, M., Sneep, M., de Haan, J. F., Stammes, P., Sanders, A. F. J., et al. (2018). Error sources in the retrieval of aerosol information over bright surfaces from satellite measurements in the oxygen a band. Atmos. Meas. Tech. 11, 161–175. doi:10.5194/amt-11-161-2018
Perez-Priego, O., Zarco-Tejada, P. J., Miller, J. R., Sepulcre-Canto, G., and Fereres, E. (2005). Detection of water stress in orchard trees with a high-resolution spectrometer through chlorophyll fluorescence in-filling of the o/sub 2/-a band. IEEE Trans. Geosci. Remote Sens. 43, 2860–2869. doi:10.1109/tgrs.2005.857906
Qi, Y., and Li, Y. (2020). Integrated lithium niobate photonics. Nanophotonics 9, 1287–1320. doi:10.1515/nanoph-2020-0013
Quatrevalet, M., Ai, X., Pérez-Serrano, A., Adamiec, P., Barbero, J., Fix, A., et al. (2017). Atmospheric co2 sensing with a random modulation continuous wave integrated path differential absorption lidar. IEEE J. Sel. Top. Quantum Electron. 23, 157–167. doi:10.1109/JSTQE.2016.2619325
RayChaudhuri, B. (2012). Remote sensing of solar-induced chlorophyll fluorescence at atmospheric oxygen absorption band around 760 nm and simulation of that absorption in laboratory. IEEE Trans. Geosci. Remote Sens. 50, 3908–3914. doi:10.1109/tgrs.2012.2185503
Remer, L. A., Davis, A. B., Mattoo, S., Levy, R. C., Kalashnikova, O. V., Coddington, O., et al. (2019). Retrieving aerosol characteristics from the pace mission, part 1: Ocean color instrument. Front. Earth Sci. (Lausanne). 7, 152. doi:10.3389/feart.2019
Sanders, A. F. J., and de Haan, J. F. (2013). Retrieval of aerosol parameters from the oxygen a band in the presence of chlorophyll fluorescence. Atmos. Meas. Tech. 6, 2725–2740. doi:10.5194/amt-6-2725-2013
Sayem, A. A., Cheng, R., Wang, S., and Tang, H. X. (2020). Lithium-niobate-on-insulator waveguide-integrated superconducting nanowire single-photon detectors. Appl. Phys. Lett. 116, 151102. doi:10.1063/1.5142852
Schuessler, O., Loyola Rodriguez, D. G., Doicu, A., and Spurr, R. (2014). Information Content in the Oxygen <inline-formula> <tex-math notation=TeX>$A$</tex-math></inline-formula>-Band for the Retrieval of Macrophysical Cloud Parameters. IEEE Trans. Geosci. Remote Sens. 52, 3246–3255. doi:10.1109/tgrs.2013.2271986
Tran, H., and Hartmann, J. M. (2008). An improved o2a band absorption model and its consequences for retrievals of photon paths and surface pressures. J. Geophys. Res. 113, D18104. doi:10.1029/2008jd010011
van Diedenhoven, B., Hasekamp, O. P., and Aben, I. (2005). Surface pressure retrieval from SCIAMACHY measurements in the O&lt;sub&gt;2&lt;/sub&gt; A band: Validation of the measurements and sensitivity on aerosols. Atmos. Chem. Phys. 5, 2109–2120. doi:10.5194/acp-5-2109-2005
Vanbauce, C., Buriez, J. C., Parol, F., Bonnel, B., Sèze, G., and Couvert, P. (1998). Apparent pressure derived from adeos-polder observations in the oxygen a-band over ocean. Geophys. Res. Lett. 25, 3159–3162. doi:10.1029/98gl02324
Yang, J., Li, S., Gong, W., Min, Q., Mao, F., and Pan, Z. (2021). A fast cloud geometrical thickness retrieval algorithm for single-layer marine liquid clouds using oco-2 oxygen a-band measurements. Remote Sens. Environ. 256, 112305. doi:10.1016/j.rse.2021.112305
Zhang, J., Sua, Y. M., Chen, J.-Y., Ramanathan, J., Tang, C., Li, Z., et al. (2021). Carbon-dioxide absorption spectroscopy with solar photon counting and integrated lithium niobate micro-ring resonator. Appl. Phys. Lett. 118, 171103. doi:10.1063/5.0045869
Zhang, M., Buscaino, B., Wang, C., Shams-Ansari, A., Reimer, C., Zhu, R., et al. (2019). Broadband electro-optic frequency comb generation in a lithium niobate microring resonator. Nature 568, 373–377. doi:10.1038/s41586-019-1008-7
Keywords: photonic integrated circuits, remote sensing, oxygen absorption spectrum, oxygen A-band, solar photon counting, thin film lithium niobate, cubesat
Citation: Zhang J, Sua YM, Hu Y, Ramanathan J and Huang Y-P (2022) Oxygen A-band absorption spectroscopy with solar photon counting and lithium niobate nanophotonic circuits. Front. Remote Sens. 3:1064244. doi: 10.3389/frsen.2022.1064244
Received: 08 October 2022; Accepted: 07 November 2022;
Published: 18 November 2022.
Edited by:
Xiaoguang Xu, University of Maryland, Baltimore County, United StatesReviewed by:
Weizhen Hou, Harvard University, United StatesMyungje Choi, University of Maryland, Baltimore County, United States
Copyright © 2022 Zhang, Sua, Hu, Ramanathan and Huang. This is an open-access article distributed under the terms of the Creative Commons Attribution License (CC BY). The use, distribution or reproduction in other forums is permitted, provided the original author(s) and the copyright owner(s) are credited and that the original publication in this journal is cited, in accordance with accepted academic practice. No use, distribution or reproduction is permitted which does not comply with these terms.
*Correspondence: Yongxiang Hu, eW9uZ3hpYW5nLmh1LTFAbmFzYS5nb3Y=; Yu-Ping Huang, eXVwaW5nLmh1YW5nQHN0ZXZlbnMuZWR1