Comparisons of Multi Resolution Based AI Training Data and Algorithms Using Remote Sensing Focus on Landcover
 Seong-Hyeok Lee1
  Moung-Jin Lee2*
- 1Division for Environmental Planning, Korea Environment Institute, Sejong, South Korea
- 2Center for Environmental Data Strategy, Korea Environment Institute, Sejong, South Korea
The purpose of this study was to construct artificial intelligence (AI) training datasets based on multi-resolution remote sensing and analyze the results through learning algorithms in an attempt to apply machine learning efficiently to (quasi) real-time changing landcover data. Multi-resolution datasets of landcover at 0.51- and 10-m resolution were constructed from aerial and satellite images obtained from the Sentinel-2 mission. Aerial image data (a total of 49,700 data sets) and satellite image data (300 data sets) were constructed to achieve 50,000 multi-resolution datasets. In addition, raw data were compiled as metadata in JavaScript Objection Notation format for use as reference material. To minimize data errors, a two-step verification process was performed consisting of data refinement and data annotation to improve the quality of the machine learning datasets. SegNet, U-Net, and DeeplabV3+ algorithms were applied to the datasets; the results showed accuracy levels of 71.5%, 77.8%, and 76.3% for aerial image datasets and 88.4%, 91.4%, and 85.8% for satellite image datasets, respectively. Of the landcover categories, the forest category had the highest accuracy. The landcover datasets for AI training constructed in this study provide a helpful reference in the field of landcover classification and change detection using AI. Specifically, the datasets for AI training are applicable to large-scale landcover studies, including those targeting the entirety of Korea.
Introduction
With urbanization and the increasing frequency of natural disasters, it has become increasingly important to collect accurate spatiotemporal data efficiently on changes in landcover to enable (quasi) real-time monitoring of such changes and set up the opportunity for risk mitigation (El-Masri and Tipple, 2002; Wulder et al., 2008). Remote sensing has been used in a variety of ways to monitor changes in landcover, and the resolution of satellite imagery has steadily improved (Herold et al., 2003; Rogan and Chen, 2004). In addition to satellite data, other sources such as aerial imagery, unmanned aerial vehicle imagery, and point clouds are also being used for this purpose (Rau et al., 2015; Ahmed et al., 2017).
To monitor continuously changing landcover efficiently, there has recently been a shift from research methods focused on increasing classification accuracy to an automated research method that analyzes a large amount of remotely sensed data (DeFries and Chan, 2000). To this end, various machine learning, deep learning, and artificial intelligence (AI) algorithms are being utilized (Rogan et al., 2008; Karpatne et al., 2016; Kussul et al., 2017). In particular, deep learning algorithms based on convolutional neural networks (CNNs) have demonstrated higher performance than machine learning algorithms (Kussul et al., 2017; Guidici and Clark, 2017; Rußwurm and Körner, 2017).
Deep learning methods process large datasets by identifying features in the data at various levels, enabling high-speed analysis and enhanced functionality in data applications (Najafabadi et al., 2015). In the field of computer vision, detected objects of the same category (e.g., people and clothes) are divided into various shapes and patterns (Felzenszwalb et al., 2010). This has led to the emergence of a large number of datasets with object classification and detection fields, such as ImageNet (Lin et al., 2014). An important type of CNN algorithm involves semantic segmentation, which classifies images at the pixel level (Long et al., 2015) and enables high detection accuracy in the remote sensing field; examples of such models include fully convolutional networks, U-Net, ResNet, and DeeplabV3+ (Wang et al., 2020). In particular, for supervised machine learning, large high-quality datasets play an important role in the performance of CNN-based algorithms (Helber et al., 2019).
There are many different types of AI training datasets for the development of machine learning algorithms (Mohamadou et al., 2020). Pascal VOC is a collection of datasets for object detection and classification tasks and has been used to evaluate algorithm performance in various studies and competitions (Everingham et al., 2010; Everingham et al., 2015; Noh et al., 2015). Microsoft COCO (Lin et al., 2014) is a large-scale dataset of approximately 330,000 images that has been used for object detection and segmentation (Common Objects in Context, 2021). In addition, there are datasets such as Cityscape, featuring images captured from in-vehicle sensors used for autonomous driving (Cordts et al., 2016; Zhang et al., 2017; The City Scapes Dataset, 2021).
There are also many remote-sensing datasets, such as aerial image collections that classify means of transportation, such as cars and ships, into objects (Xia et al., 2018; Azimi et al., 2021), as well as datasets of thermal or infrared imagery for object detection and tracking (Bondi et al., 2020). An example of an AI dataset for landcover is the Landcover. ai website that provides orthophotos at 0.25 and 0.5 m per pixel resolution covering Poland (Boguszewski et al., 2021). Skyscapes is an aerial image dataset compiled by the German Aerospace Center that includes various categories, such as buildings and roads (Azimi et al., 2019).
More recently, there has been a focus on increasing the predictive accuracy of multi-resolution remote sensing data. This involves accurately constructing outer boundaries and categories of training data, which entails considerable time and effort (Luo et al., 2018). In addition, in fields that require (quasi) real-time analysis, such as landcover studies in areas undergoing rapid change due to natural disasters and human activities, fast construction of training data is the main goal, with precision as a secondary objective (Choi et al., 2017; Avilés-Cruz et al., 2019).
Therefore, in this study, we present an approach for constructing a landcover dataset that combines multi-resolution remote sensing annotation data using a combination of annotation techniques, verification processes to build precise datasets, and dataset analyses via algorithm application.
Figure 1 shows a flowchart of our research. First, aerial and satellite images at spatial resolutions of 0.51 and 10 m, respectively, were compiled into a high-quality multi-resolution dataset to create a precise landcover AI dataset. By processing the multi-resolution data simultaneously, we were able to construct a large-scale dataset with high precision.
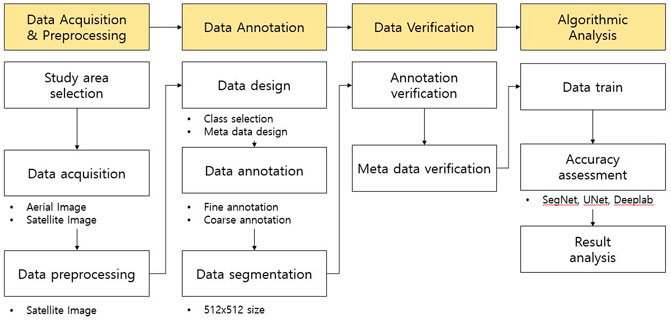
FIGURE 1. Flow chart in this study.
Metadata in JavaScript Objection Notation (JSON) format was then constructed, in addition to the image dataset. Information on data for reference purposes was added to AI data (e.g., raw image type, spatial information format (vectors, shapefiles), and the widths and heights of data points).
Next, a separate inspection process was carried out to reduce errors in the constructed dataset. Refined data were checked for incomplete processing, and classification errors were checked with respect to the annotation results to minimize errors for better reliability.
Finally, the SegNet, U-Net, and DeeplabV3+ algorithms, commonly used in semantic segmentation and landcover applications, were applied to the dataset, and the results were analyzed.
Study Area and Construction Datasets for the AI Training Methodology
AI Training Datasets Status in Korea
The dataset constructed in this study is officially provided by AI Hub in Korea (AI Hub in Korea, 2021). The AI Hub is an AI-driven integration platform made available to the public to support the AI infrastructure required for the development of AI technology, products, and services. Training data provided by AI Hub include a total of eight major categories and 43 subcategories, including text data, such as laws and patents; Korea’s unique image data, such as Korean landmark images and Korean facial images; traffic-related image data, such as images of vehicles driving on roads and people walking on sidewalks; and human motion and disease diagnosis images. Landcover information is classified as environmental data in this platform, and includes 53,300 data points (AI Hub in Korea, 2021).
Study Area and Data Acquisition
The metropolitan area of Korea, including the capital city of Seoul, was selected to collect raw data for dataset construction (Figure 2). The study area included the Gyeong-gi-do region surrounding Seoul, adjacent to the coastline to the west and Gangwon-do to the east, with Seoul located at the center. It is a large area of 10,185 km2, which is about 10% of the country (Gyeonggi Province in Korea, 2021). The subdivided landcover map of the study area (scale of 1:5,000) consisted of 4,109 map sheets (EGIS, 2021).

FIGURE 2. Study area in this study.
Aerial and satellite imagery were used to construct datasets. Aerial images taken in 2018, produced and distributed by the National Geographical Information Service (NGII), were obtained. For satellite imagery, Sentinel-2 images provided by the European Space Agency were acquired to construct datasets with images captured in 2019–2020 without clouds or snow. The spatial resolutions of the aerial and Sentinel-2 imagery were 0.51 and 10 m, respectively (Table 1). Table 1 A, B, and C of the satellite image lists the indices indicating the grade of the image cloud, as follows: A is no cloud, B is an image with less than 10% cloud, and C is an image with less than 25% cloud.
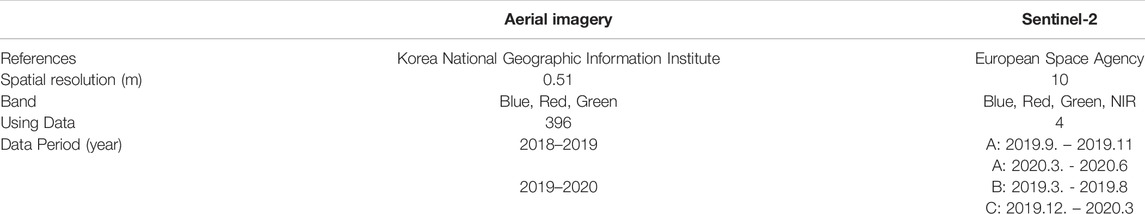
TABLE 1. Original aerial and satellite image acquisition information.
Specifically, each band was converted into a GeoTIFF format using QGIS software, and the red, green, blue, and near-infrared (NIR) bands were layer-stacked. The image information used in this study is shown in Table 1. A total of 396 aerial images and four satellite images were acquired to construct datasets, using aerial and satellite images with fine and coarse annotations.
Training Datasets Annotation
The dataset annotation process involved selecting target areas corresponding to 393 map sheets, based on the digital map sheet at a 1:5,000 scale provided by the NGII. A three-step annotation process was performed of the selected target area. First, the object classes and metadata were designed. Second, the classification and format of annotations for each object item of an image were defined to construct the annotations. Third, training data were built based on the defined annotations. The classification items and annotation standards were derived from the subdivided landcover map and urban ecological map (Biotope Map) provided by the Ministry of Environment. Landcover classification studies were also referenced (Lee et al., 2020; Lee and Lee, 2020; Korea National Law Information Center, 2021).
For the classification items of aerial imagery, we selected and annotated eight categories (Table 2) commonly used in AI classification that included buildings, roads, and parking lots. Five categories were selected for the satellite imagery. Each object was assigned a specific code number, such as 10 for buildings and 20 for parking lots.
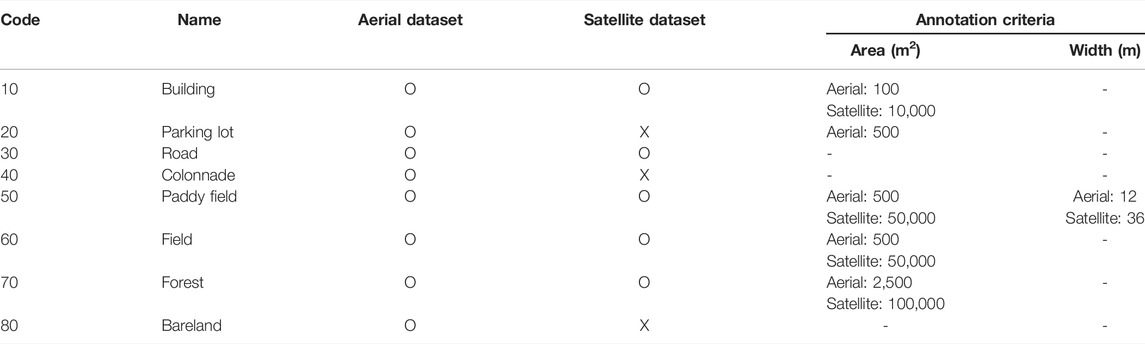
TABLE 2. Difference between classification catagories of aerial image and satellite image.
Image annotation was performed to demarcate the boundaries of objects to be classified. Fine annotation was conducted using QGIS open-source software for precise annotation. Coarse annotation was carried out in a similar way using QGIS.
Classification criteria for image annotation were based on the guidelines for the preparation of subdivided landcover maps in Korea (Korea National Law Information Center, 2021). Object items were classified as follows. Roads were required to have linear widths of 12 m or more. Areas of more than 100 m2 were classified as buildings; more than 500 m2 as parking lots, paddy fields, or bare land; and more than 2,500 m2 as forest. Even if an object did not meet the criteria, items that could be clearly distinguished in the image were classified. In addition, items that could not be identified due to shadows were excluded from classification, as well as those with unclear boundaries or properties. Because the satellite imagery had a lower spatial resolution than the aerial imagery, objects such as roads with a linear width of 36 m or more, buildings with an area of 10,000 m2, paddy fields/fields of 50,000 m2, and forests of 100,000 m2 or more were annotated (Table 2).
Based on the common annotation classification criteria for aerial and satellite imagery, buildings included apartment complexes and factories; greenhouses, buildings under construction, solar panels, or structures with green roofs were excluded. For the parking lot category, the annotation was carried out as described, with the exception of access roads and unpaved parking lots without parking lines. In the road category, intersections were annotated separately according to their direction. In the colonnade category, a colonnade of trees, lined up in parallel, was annotated, and cases that were not clearly distinguished from the surroundings were excluded. Paddy fields refer to rice cultivation areas; in the field category, orchards and greenhouse cultivation areas were excluded. For the forest category, non-forest items such as deforested areas and cemeteries in the forest were excluded from annotation. Finally, for the bare land category, as an artificially created area, mining areas were also excluded. All items that did not fall under the classified categories were treated as non-target sites.
Given the difference in resolution of aerial and satellite imagery, parking lots, colonnades (street trees), and bare lands were not classified from satellite imagery. Notably, the classification criteria, even for the same item, can differ for the two types of images. As for the building category of aerial imagery, all buildings that could be categorized were classified. For satellite imagery, apartment buildings were classified into complexes, and detached houses and multiplex housing were classified into blocks. Items in other categories were classified based on the same criteria. An example of the annotation results is shown in Figure 3.
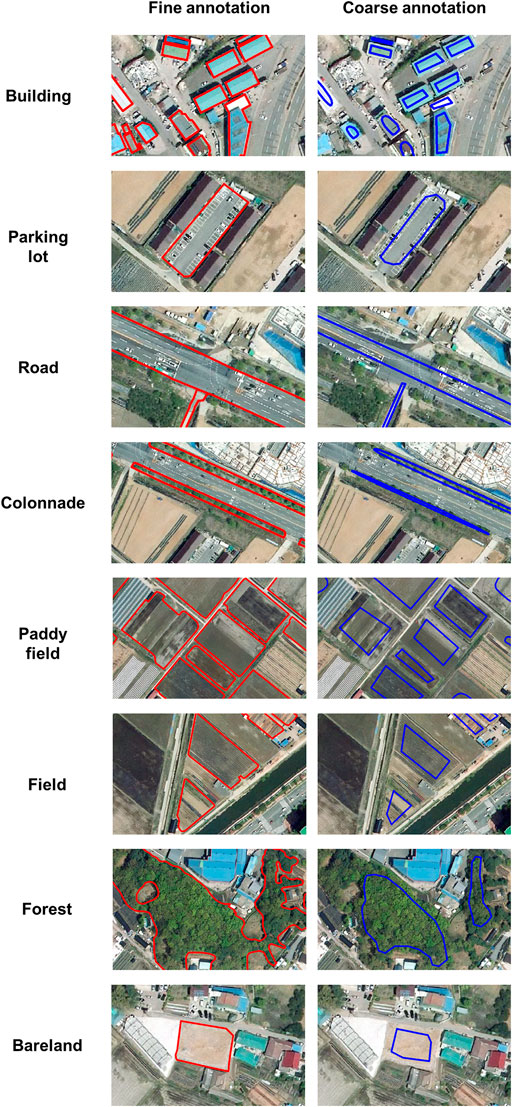
FIGURE 3. Example of data annotation for each classes.
In this study, the construction of learning data was divided into fine and coarse constructions. Fine construction involves annotating the outer boundary of the classification object as precisely as possible (Figure 3). Coarse construction schematically annotates only representative characteristics of an object (Figure 3). The AI training datasets constructed in this study included both fine and coarse annotations.
All annotated data were constructed into images of 512 × 512 pixels, and original images were segmented by applying a 25% overlap rate. The dataset for AI training consisted of raw images, annotated images, and metadata in JSON format. The annotation datasets were saved using the tagged image file format (TIFF), and annotated images were constructed using an 8-bit grayscale format. The metadata in JSON format contained information about the data, such as the raw image names and the widths and heights of data points (Figure 4).
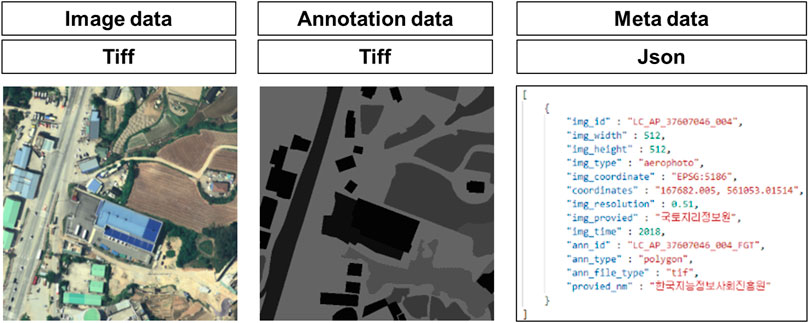
FIGURE 4. Example of constructed dataset.
Metadata were composed of three items: image information, annotation, and the data provider, with nine, three, and one sub-item/s, respectively (Table 3). Image information included information such as the image file name, length and width, the type of the original image, image resolution, and provider. For the coordinates, a sub-item, the coordinate system and upper-left coordinates were provided in the metadata; however, this information was not included in the TIFF format images related to the national security of South Korea. In addition, the captured time of original images was also provided in the image information. Annotation information included annotation identifiers, such as file names, annotation type, and file type. Information on the provider of the datasets was also specified in the metadata.
TABLE 3. Information contained in metadata in json format.
Training Datasets Verification
The quality of the constructed dataset was inspected to ensure high precision. Data quality inspection was carried out by dividing it into refined data inspection and annotation data inspection. First, refined data were assessed by considering the red, green, blue, and NIR bands of refined satellite data. If an error was identified, then the image was refined again and resolved through a second inspection of the refined product.
Annotation data were assessed as follows. Once annotation was complete, but before the image dataset was constructed into grayscale format, a first inspection was performed. The landcover dataset for AI training was inspected simultaneously. If any errors were found, an error report including the image file name, error type, and error location was prepared. Data with errors and the error report were sent back to training data personnel for correction. Thus, the objectivity and homogeneity of the dataset were secured through cross-validation.
Next, the errors were classified into three categories: unclassified, over-classified, and misclassified (Figure 5). An unclassified error refers to a case in which an object that should be annotated is not. Overclassification occurs when a non-target object is included in the annotation of the target object. Misclassification corresponds to an error in which the annotation class is set incorrectly. Figure 5 shows examples of the three error types. After the first inspection was complete, the image dataset was constructed as a 512 × 512 pixel image, and the metadata created in the form of name/value pairs were checked for missing data to confirm whether information was correctly written for each item. An error log was prepared and managed in the same way as the annotation data inspection. Metadata in which errors were found were also corrected.
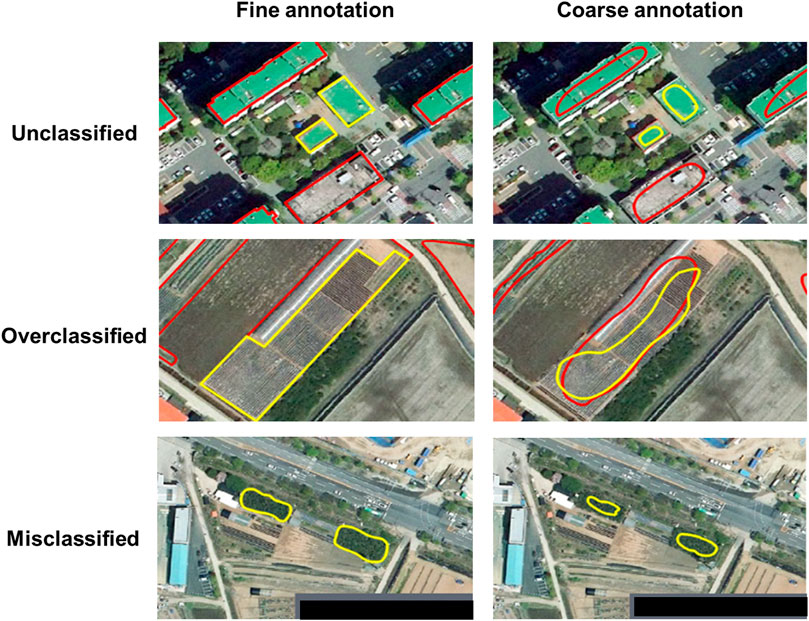
FIGURE 5. Examples of Fine and Coarse annotation error types. The red line is the annotation status, and the yellow line is the annotation that needs to be added or modified.
As for the dataset completed up to the data inspection stage, a total of 49,700 aerial image datasets were finally constructed, along with 300 satellite image datasets. The detailed construction amount for each image is shown in Table 4. All data sets in Table 4 were used for the learning algorithm.
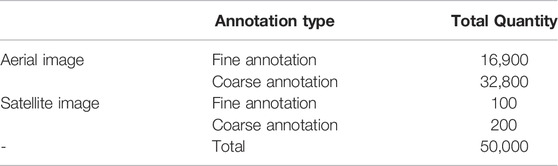
TABLE 4. The amount of data set finally constructed in this study.
Algorithm Application Results
Various algorithms related to semantic segmentation have been published until recently. SegNet and U-Net algorithms are representative semantic segmentation algorithms that were first announced in 2015 and 2017, respectively, and are still presented in various versions. In addition, the DeeplabV3+ algorithm is a recent network published in 2018 (Ronneberger et al., 2015; Badrinarayanan et al., 2017; Chen et al., 2018). In this study, machine learning and performance evaluation were conducted using SegNet, U-Net, and DeeplabV3+ algorithms. All of the three algorithms were developed based on the FCN algorithm. The three algorithms selected in this study have showed superior performance compared to other algorithms in the FCN series (Garcia-Garcia et al., 2017; Guo et al., 2018; Zhang J. et al., 2019; Asgari Taghanaki et al., 2021). Furthermore, the performance of all of the three algorithms has been verified through various studies in the field of remote sensing and computer vision (Lin et al., 2020; Weng et al., 2020). In this study, since learning data for land cover was built with multiple resolutions, the latest stable and reliable algorithms were used.
The training data were learned by splitting the composition of training and validation/testing data at a ratio of 8:2. The ratio referred to related previous studies; the ratio commonly used in previous studies including Helber et al., 2019 and Friedl et al., 2000 was 8:2 (Shirzadi et al., 2018; Chakraborty et al., 2021; Saha et al., 2021). Also, previous studies were referenced because there were practical limitations depending on the research environment and time in verifying them at various ratios.
The hyperparameters for machine learning algorithms were equally applied to aerial imagery, satellite imagery, and the three algorithms. In addition, machine learning was conducted in an environment equipped with 11 GB of GPU memory or more. The machine was trained for 800 training epochs, using a batch size of 10, considering the hardware performance of the computer (Table 5). The learning rate was set to 1 × 10⁻⁶, and the remaining parameters were set as the default values of the individual algorithms.
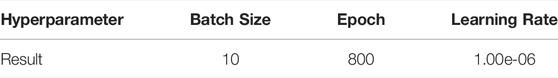
TABLE 5. Hyperparameter value for train algorithms.
The aerial dataset results are shown in Table 6. U-Net had the highest overall accuracy, of about 77.8%, followed by DeeplabV3+ at 76.3% and SegNet at about 71.5%. However, there was a difference between algorithms in terms of the categories showing the highest accuracy. U-Net showed the highest accuracy for buildings, roads, and paddy fields, whereas SegNet produced the highest accuracy for parking lots and bare land (about 20% higher accuracy than the other two algorithms). The DeeplabV3+ algorithm had the highest accuracy for the forest category. For the non-target category, U-Net yielded the highest accuracy.
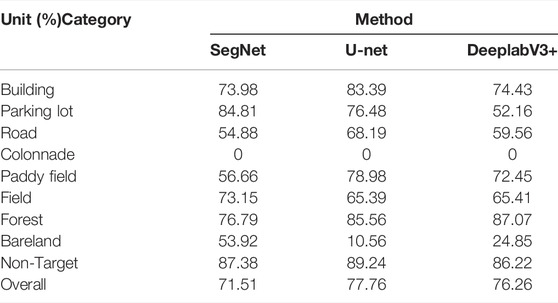
TABLE 6. Aerial image dataset algorithm pixel accuracy of each category.
Figure 6 shows an example image of the test results produced by each algorithm. DeeplabV3+ segmented forests were the most similar to the annotation data, as the algorithm had the highest pixel accuracy for that category. For the parking lot category, in which the SegNet algorithm yielded the highest accuracy, the algorithm identified parking lots that did not meet the area standard. For paddy fields, the U-Net algorithm displayed the most error-free segmentation.
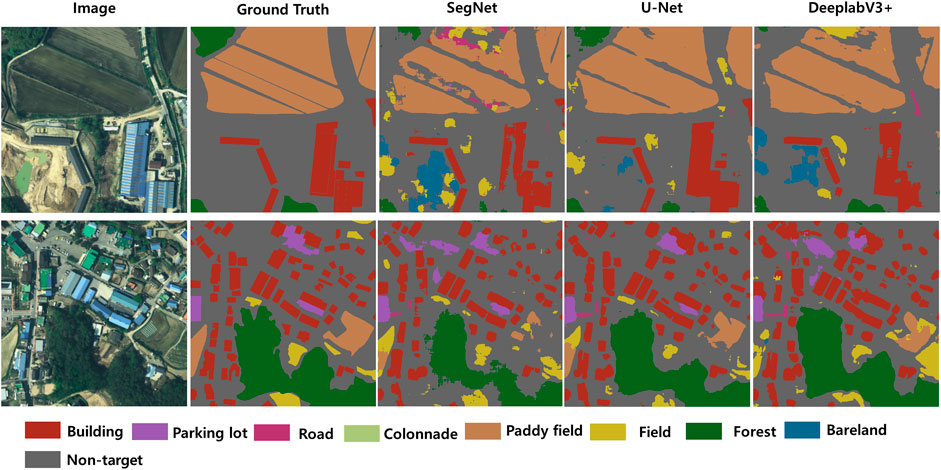
FIGURE 6. Result aerial image of SegNet, U-Net and DeeplabV3+ algorithms.
The results of machine learning obtained by applying the satellite imagery to each algorithm are shown in Table 7; the overall pixel accuracy was highest for U-Net at 91.4%, followed by SegNet at 88.4% and DeeplabV3+ at 85.8%. Thus, in general, the results were about 10% higher in accuracy compared to that of aerial imagery. However, unlike the aerial image results, the satellite imagery results had low accuracy in categories other than forest. In particular, in the case of the field item, it was difficult to classify it because it had a shape similar to that of a forest and had a more irregular shape than that of the Paddy Field. This is attributable to the relatively large number of forest items in the dataset, as well as the many differences from aerial images in the quantity of the entire dataset. It is expected that this result could be improved by applying techniques such as data augmentation and by constructing additional datasets.
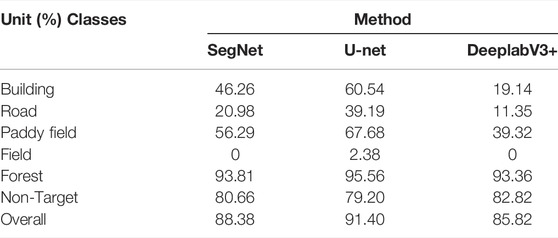
TABLE 7. Satellite image dataset algorithm pixel accuracy of each classes.
The images resulting from the application of the three algorithms to satellite imagery are shown in Figure 7. As the overall pixel accuracy was high, the segmented boundaries were considered to be more accurate than the aerial imagery. However, the DeeplabV3+ algorithm was found to require additional datasets and reinforcement training. For the U-Net and SegNet algorithms, paddy fields and buildings were clearly segmented compared to the annotations.
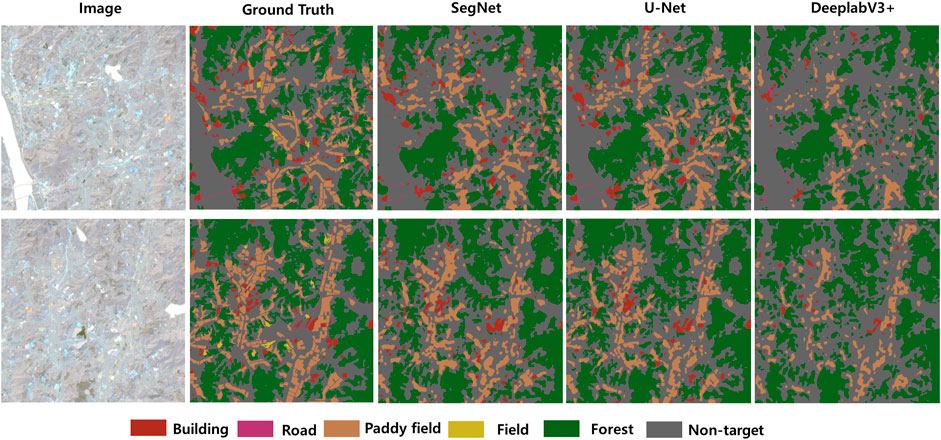
FIGURE 7. Result satellite image of SegNet, U-Net and DeeplabV3+ algorithms.
Discussion
In this study, effective AI training data were constructed using multi-resolution datasets with various spatial resolutions, combined with aerial and satellite imagery with spatial resolutions of 0.51 and 10 m, respectively. A total of 396 aerial images were utilized to construct 47,000 AI training data, while 14 satellite images were used to build 300 AI training data. Using this training data, we examined the possibility of analyzing (quasi-) real-time environmental changes for landcover change prediction purposes. In addition, metadata in JSON format that can applied directly in AI algorithms provided by Zenodo and GitHub were prepared for all classified landcover category objects (a total of 50,000).
The data were used to construct a large-scale dataset with high precision. In addition, raw data were compiled as metadata reference material. To minimize error, a two-step verification process was performed of refined data and annotated data to improve the quality of the machine learning datasets. In this study, errors were classified into three categories: unclassification, overclassification, and misclassification. Unclassification is an error in which the object to be annotated is not annotated. Overclassification is an error wherby objects to be annotated are annotated beyond their boundary. Misclassification is an error in which annotated objects are mislabeled. All of these errors were corrected through the three-step error verification process. Each step error was reduced, with the first step accounting for about 11.4% (1,111,799) of all data, the second step accounting for about 1.58% (156,978) of all data, and the third step accounting for about 0.04% (15,062) of all data.
Finally, SegNet, U-Net, and DeeplabV3+ algorithms were applied to the datasets and the results were analyzed; these algorithms showed accuracy levels of 71.5%, 77.8%, and 76.3%, respectively, for aerial images and 88.4%, 91.4%, and 85.8% for satellite images. The learning results using U-net showed high accuracy overall for both aerial and satellite imagery. Of the object categories classified using the three algorithms, the highest classification accuracy was found for forests (93.81%, 95.56% and 93.36%, respectively).
The overall accuracy of the algorithms yielded significant results, but low accuracy for the colonnade category was found. This result is due to the fact that a colonnade of street trees occupies a more limited area than other categories. If the area is increased in the future, higher classification performance is expected.
Notably, this study is a pilot study for building AI training data for applications involving AI algorithms. In the future, we expect that our approach can be applied to various AI algorithms. This will enable analyses of appropriate training data and optimal algorithms for individual landcover items. Furthermore, if a new semantic segmentation-based AI algorithm is developed, it will be possible to increase the classification accuracy of landcover items with a smaller area by applying the AI training data of this study to the algorithm.
Conclusion
This study constructed multi-resolution AI learning data to analyze efficiently and predict (quasi-) real-time environmental changes caused by various development projects. Raw data included both satellite (from the Sentinel-2 mission) and aerial imagery. Additionally, a multi-resolution dataset was created so that AI training data could be utilized at various spatial resolutions.
Our approach has three advantages compared to other methods. First, our landcover datasets for AI training were built using data of different resolutions. In this way, improved high-resolution datasets were presented from existing MODIS-based multi-resolution landcover datasets with spatial resolutions of 30 m (Yu et al., 2014). Datasets were constructed such that various spatial resolutions could be used to classify the same landcover items. In addition, the multi-resolution datasets, the product of this study, can be utilized by selecting a resolution suitable for various fields of application, such as landcover classification and land use changes.
Second, the landcover datasets were analyzed with respect to their practicality and accuracy in landcover classification, using three common CNN-based AI algorithms: SegNet, U-Net, and DeeplabV3+. The results showed accuracy levels of 71.5%, 77.8%, and 76.3% for aerial image datasets and 88.4%, 91.4%, and 85.8% for satellite image datasets, respectively. Thus, the landcover datasets for AI training constructed in this study provide a helpful reference for classification and change detection.
In addition, the same land cover classification item was classified with multi-spatial resolution images, and the accuracy of the algorithms applied to each classification item was analyzed. Based on this, for aerial images with a high spatial resolution, U-net classified buildings with the highest accuracy (83.39%), while SegNet classified roads with an accuracy of 84.31%. With regard to the classification of forests, SegNet, U-Net, and DeeplabV3+ all showed an accuracy of 93% or more for satellite images with relatively low spatial resolution. These results can be used as basic data for selecting an appropriate spatial resolution and algorithm for each classification in the future. They are also considered to provide an important basis for utilizing the findings of this study.
This study achieved the research results of determining the data suitability of each landcover item through the construction of AI training data and the application of the data to training algorithms. However, our approach has two limitations. First, AI training data for the whole of Korea were not established. Therefore, at present, the representativeness of the training data for each landcover item is still insufficient. Second, additional research is required to select appropriate AI training data and algorithms for each landcover item in the future. The results of this study were analyzed to be suitable for some items, such as forests, which showed an accuracy of about 90% or more.
We expect that our data will be a useful reference for AI landcover classification and change detection, currently an active research area (Kussul et al., 2016; Lyu et al., 2016; Zhang C. et al., 2019; Sefrin et al., 2020; Zhang et al., 2020). In addition, if a landcover dataset for AI learning is built for the whole of Korea in the future, our work will be useful for various environmental studies, beyond classification and change detection. In addition, AI training datasets are expected to be increasingly relevant in the future; the findings of this study should provide a useful reference to this end.
Data Availability Statement
The Aerial data used here are available from the Korea NGII (National Geographic Information Institute).
Author Contributions
S-HL and M-JL conceived and designed the experiments. S-HL performed data collection and processing. S-HL and M-JL analyzed the data. S-HL drafted the manuscript. S-HL and M-JL revised the manuscript. All authors contributed to this manuscript and approved the final version. The English in this document has been checked by at least two professional editors, both native speakers of English. For a certificate, please see: http://www.textcheck.com/certificate/3Fbu4C.
Funding
This research was conducted at Korea Environment Institute (KEI) with support from project “The Application technology and system of satellite image radar in the environmental” by Korea Environment Industry & Technology Institute (KEITI), and funded by Korea Ministry of Environment (MOE) (2019002650001, 2021-206(R)) and This research was also supported by a grant The Basic Science Research Program through the National Research Foundation of Korea (NRF) funded by the Ministry of Education (NRF-2018R1D1A1B07041203, 2022-034(R).
Conflict of Interest
The authors declare that the research was conducted in the absence of any commercial or financial relationships that could be construed as a potential conflict of interest.
Publisher’s Note
All claims expressed in this article are solely those of the authors and do not necessarily represent those of their affiliated organizations, or those of the publisher, the editors and the reviewers. Any product that may be evaluated in this article, or claim that may be made by its manufacturer, is not guaranteed or endorsed by the publisher.
References
Ahmed, O. S., Shemrock, A., Chabot, D., Dillon, C., Williams, G., Wasson, R., et al. (2017). Hierarchical Land Cover and Vegetation Classification Using Multispectral Data Acquired from an Unmanned Aerial Vehicle. Int. J. Remote Sensing. 38, 2037–2052. doi:10.1080/01431161.2017.1294781
AI Hub in Korea (2021). AI Hub in Korea. Available at: https://www.aihub.or.kr/(Accessed June 8, 2021).
Asgari Taghanaki, S., Abhishek, K., Cohen, J. P., Cohen-Adad, J., and Hamarneh, G. (2021). Deep Semantic Segmentation of Natural and Medical Images: A Review. Artif. Intell. Rev. 54 (1), 137–178. doi:10.1007/s10462-020-09854-1
Avilés-Cruz, C., Ferreyra-Ramírez, A., Zúñiga-López, A., and Villegas-Cortéz, J. (2019). Coarse-Fine Convolutional Deep-Learning Strategy for Human Activity Recognition. Sensors. 19, 1556. doi:10.3390/s19071556
Azimi, S. M., Bahmanyar, R., Henry, C., and Kurz, F. (2021). “EAGLE: Large-Scale Vehicle Detection Dataset in Real-World Scenarios Using Aerial Imagery,” in 2020 25th International Conference on Pattern Recognition (ICPR), 6920–6927. doi:10.1109/ICPR48806.2021.9412353
Azimi, S. M., Henry, C., Sommer, L., Schumann, A., and Vig, E. (2019). “SkyScapes Fine-Grained Semantic Understanding of Aerial Scenes,” in Proceedings of the IEEE/CVF International Conference on Computer Vision (ICCV), 7393–7403. Available at: https://openaccess.thecvf.com/content_ICCV_2019/html/Azimi_SkyScapes__Fine-Grained_Semantic_Understanding_of_Aerial_Scenes_ICCV_2019_paper.html (Accessed October 22, 2021).
Badrinarayanan, V., Kendall, A., and Cipolla, R. (2017). SegNet: A Deep Convolutional Encoder-Decoder Architecture for Image Segmentation. IEEE Trans. Pattern Anal. Mach. Intell. 39, 2481–2495. doi:10.1109/TPAMI.2016.2644615
Boguszewski, A., Batorski, D., Ziemba-Jankowska, N., Dziedzic, T., and Zambrzycka, A. (2021). LandCover.ai: Dataset for Automatic Mapping of Buildings, Woodlands, Water and Roads from Aerial Imagery. arXiv:2005.02264 [cs]. Available at: http://arxiv.org/abs/2005.02264 (Accessed October 22, 2021).
Bondi, E., Jain, R., Aggrawal, P., Anand, S., Hannaford, R., Kapoor, A., et al. (2020). “BIRDSAI: A Dataset for Detection and Tracking in Aerial Thermal Infrared Videos,” in Proceedings of the IEEE/CVF Winter Conference on Applications of Computer Vision (WACV), 1747–1756. Available at: https://openaccess.thecvf.com/content_WACV_2020/html/Bondi_BIRDSAI_A_Dataset_for_Detection_and_Tracking_in_Aerial_Thermal_WACV_2020_paper.html (Accessed October 22, 2021).
Chakraborty, S., Agarwal, N., and Roy, M. (2021). “A Deep Semi-supervised Approach for Multi-Label Land-Cover Classification under Scarcity of Labelled Images,” in Soft Computing for Problem Solving. Editors A. Tiwari, K. Ahuja, A. Yadav, J. C. Bansal, K. Deep, and A. K. Nagar (Springer), 1–12. doi:10.1007/978-981-16-2712-5_1
Chen, L.-C., Zhu, Y., Papandreou, G., Schroff, F., and Adam, H. (2018). “Encoder-Decoder with Atrous Separable Convolution for Semantic Image Segmentation,” in Proceedings of the European Conference on Computer Vision (ECCV), 801–818. Available at: https://openaccess.thecvf.com/content_ECCV_2018/html/Liang-Chieh_Chen_Encoder-Decoder_with_Atrous_ECCV_2018_paper.html (Accessed October 22, 2021).
Choi, E., Hewlett, D., Uszkoreit, J., Polosukhin, I., Lacoste, A., and Berant, J. (2017). “Coarse-to-Fine Question Answering for Long Documents,” in Proceedings of the 55th Annual Meeting of the Association for Computational Linguistics (Volume 1: Long Papers) (Vancouver, Canada: Association for Computational Linguistics), 209–220. doi:10.18653/v1/P17-1020
Common Objects in Context (2021). Common Objects in Context. Available at: https://cocodataset.org/(accessed June 15, 2021).
Cordts, M., Omran, M., Ramos, S., Rehfeld, T., Enzweiler, M., Benenson, R., et al. (2016). “The Cityscapes Dataset for Semantic Urban Scene Understanding,” in Proceedings of the IEEE Conference on Computer Vision and Pattern Recognition (CVPR), 3213–3223. Available at: https://openaccess.thecvf.com/content_cvpr_2016/html/Cordts_The_Cityscapes_Dataset_CVPR_2016_paper.html (Accessed October 22, 2021).
DeFries, R., and Chan, J. C.-W. (2000). Multiple Criteria for Evaluating Machine Learning Algorithms for Land Cover Classification from Satellite Data. Remote Sensing Environ. 74, 503–515. doi:10.1016/S0034-4257(00)00142-5
El-Masri, S., and Tipple, G. (2002). Natural Disaster, Mitigation and Sustainability: The Case of Developing Countries. Int. Plann. Stud. 7, 157–175. doi:10.1080/13563470220132236
Everingham, M., Eslami, S. M. A., Van Gool, L., Williams, C. K. I., Winn, J., and Zisserman, A. (2015). The Pascal Visual Object Classes Challenge: A Retrospective. Int. J. Comput. Vis. 111, 98–136. doi:10.1007/s11263-014-0733-5
Everingham, M., Van Gool, L., Williams, C. K. I., Winn, J., and Zisserman, A. (2010). The Pascal Visual Object Classes (VOC) Challenge. Int. J. Comput. Vis. 88, 303–338. doi:10.1007/s11263-009-0275-4
Felzenszwalb, P. F., Girshick, R. B., Mcallester, D., and Ramanan, D. (2010). Object Detection with Discriminatively Trained Part-Based Models. IEEE Trans. Pattern Anal. Mach. Intell. 32, 1627–1645. doi:10.1109/TPAMI.2009.167
Friedl, M. A., Woodcock, C., Gopal, S., Muchoney, D., Strahler, A. H., and Barker-Schaaf, C. (2000). A Note on Procedures Used for Accuracy Assessment in Land Cover Maps Derived from AVHRR Data. Int. J. Remote Sensing 21 (5), 1073–1077. doi:10.1080/014311600210434
Garcia-Garcia, A., Orts-Escolano, S., Oprea, S., Villena-Martinez, V., and Garcia-Rodriguez, J. (2017). A Review on Deep Learning Techniques Applied to Semantic Segmentation. arXiv preprint arXiv:1704.06857.
Guidici, D., and Clark, M. (2017). One-Dimensional Convolutional Neural Network Land-Cover Classification of Multi-Seasonal Hyperspectral Imagery in the San Francisco Bay Area, California. Remote Sensing. 9, 629. doi:10.3390/rs9060629
Guo, Y., Liu, Y., Georgiou, T., and Lew, M. S. (2018). A Review of Semantic Segmentation Using Deep Neural Networks. Int. J. Multimed Info Retr. 7 (2), 87–93. doi:10.1007/s13735-017-0141-z
Gyeonggi Province in Korea (2021). Gyeonggi Province in Korea. Available at: https://www.gg.go.kr/(accessed on June 15, 2021).
Helber, P., Bischke, B., Dengel, A., and Borth, D. (2019). EuroSAT: A Novel Dataset and Deep Learning Benchmark for Land Use and Land Cover Classification. IEEE J. Sel. Top. Appl. Earth Observations Remote Sensing. 12, 2217–2226. doi:10.1109/JSTARS.2019.2918242
Herold, M., Goldstein, N. C., and Clarke, K. C. (2003). The Spatiotemporal Form of Urban Growth: Measurement, Analysis and Modeling. Remote Sensing Environ. 86, 286–302. doi:10.1016/S0034-4257(03)00075-0
Karpatne, A., Jiang, Z., Vatsavai, R. R., Shekhar, S., and Kumar, V. (2016). Monitoring Land-Cover Changes: A Machine-Learning Perspective. IEEE Geosci. Remote Sens. Mag. 4, 8–21. doi:10.1109/MGRS.2016.2528038
Korea Environmental Geospatial Information Service (2021). Korea Environmental Geospatial Information Service. Available at: https://egis.me.go.kr/main.do.
Korea National Law Information Center (2021). Korea National Law Information Center. Available at: https://www.law.go.kr/LSW/admRulLsInfoP.do?admRulSeq=2100000176310 (accessed on June 21, 2021).
Kussul, N., Lavreniuk, M., Skakun, S., and Shelestov, A. (2017). Deep Learning Classification of Land Cover and Crop Types Using Remote Sensing Data. IEEE Geosci. Remote Sensing Lett. 14, 778–782. doi:10.1109/LGRS.2017.2681128
Kussul, N. N., Lavreniuk, N. S., Shelestov, A. Y., Yailymov, B. Y., and Butko, I. N. (2016). Land Cover Changes Analysis Based on Deep Machine Learning Technique. J. Automat Inf. Scien. 48, 42–54. doi:10.1615/JAutomatInfScien.v48.i5.40
Lee, S.-H., Han, K.-J., Lee, K., Lee, K.-J., Oh, K.-Y., and Lee, M.-J. (2020). Classification of Landscape Affected by Deforestation Using High-Resolution Remote Sensing Data and Deep-Learning Techniques. Remote Sensing. 12, 3372. doi:10.3390/rs12203372
Lee, S.-H., and Lee, M. (2020). A Study on Deep Learning Optimization by Land Cover Classification Item Using Satellite Imagery. Korean J. Remote Sensing 36, 1591–1604. doi:10.7780/kjrs.2020.36.6.2.9
Lin, T.-Y., Maire, M., Belongie, S., Hays, J., Perona, P., Ramanan, D., et al. (2014). “Microsoft COCO: Common Objects in Context,” in Computer Vision – ECCV 2014 Lecture Notes in Computer Science. Editors D. Fleet, T. Pajdla, B. Schiele, and T. Tuytelaars (Cham: Springer International Publishing), 740–755. doi:10.1007/978-3-319-10602-1_48
Lin, Y., Xu, D., Wang, N., Shi, Z., and Chen, Q. (2020). Road Extraction From Very-High-Resolution Remote Sensing Images via a Nested SE-Deeplab Model. Remote Sensing 12 (18), 2985. doi:10.3390/rs12182985
Long, J., Shelhamer, E., and Darrell, T. (2015). “Fully Convolutional Networks for Semantic Segmentation,” in Proceedings of the IEEE Conference on Computer Vision and Pattern Recognition (CVPR), 3431–3440. Available at: https://openaccess.thecvf.com/content_cvpr_2015/html/Long_Fully_Convolutional_Networks_2015_CVPR_paper.html (Accessed October 22, 2021).
Luo, Y., Wang, Z., Huang, Z., Yang, Y., and Zhao, C. (2018). “Coarse-to-Fine Annotation Enrichment for Semantic Segmentation Learning,” in Proceedings of the 27th ACM International Conference on Information and Knowledge Management CIKM ’18 (New York, NY, USA: Association for Computing Machinery), 237–246. doi:10.1145/3269206.3271672
Lyu, H., Lu, H., and Mou, L. (2016). Learning a Transferable Change Rule from a Recurrent Neural Network for Land Cover Change Detection. Remote Sensing. 8, 506. doi:10.3390/rs8060506
Mohamadou, Y., Halidou, A., and Kapen, P. T. (2020). A Review of Mathematical Modeling, Artificial Intelligence and Datasets Used in the Study, Prediction and Management of COVID-19. Appl. Intell. 50, 3913–3925. doi:10.1007/s10489-020-01770-9
Najafabadi, M. M., Villanustre, F., Khoshgoftaar, T. M., Seliya, N., Wald, R., and Muharemagic, E. (2015). Deep Learning Applications and Challenges in Big Data Analytics. J. Big Data. 2, 1. doi:10.1186/s40537-014-0007-7
Noh, H., Hong, S., and Han, B. (2015). “Learning Deconvolution Network for Semantic Segmentation,” in Proceedings of the IEEE International Conference on Computer Vision (ICCV), 1520–1528. Available at: https://openaccess.thecvf.com/content_iccv_2015/html/Noh_Learning_Deconvolution_Network_ICCV_2015_paper.html (Accessed October 22, 2021).
Rau, J.-Y., Jhan, J.-P., and Hsu, Y.-C. (2015). Analysis of Oblique Aerial Images for Land Cover and Point Cloud Classification in an Urban Environment. IEEE Trans. Geosci. Remote Sensing. 53, 1304–1319. doi:10.1109/TGRS.2014.2337658
Rogan, J., and Chen, D. (2004). Remote Sensing Technology for Mapping and Monitoring Land-Cover and Land-Use Change. Prog. Plann. 61, 301–325. doi:10.1016/S0305-9006(03)00066-7
Rogan, J., Franklin, J., Stow, D., Miller, J., Woodcock, C., and Roberts, D. (2008). Mapping Land-Cover Modifications over Large Areas: A Comparison of Machine Learning Algorithms. Remote Sensing Environ. 112, 2272–2283. doi:10.1016/j.rse.2007.10.004
Ronneberger, O., Fischer, P., and Brox, T. (2015). “U-net: Convolutional Networks for Biomedical Image Segmentation,” in Medical Image Computing and Computer-Assisted Intervention – MICCAI 2015 Lecture Notes in Computer Science. Editors N. Navab, J. Hornegger, W. M. Wells, and A. F. Frangi (Cham: Springer International Publishing), 234–241. doi:10.1007/978-3-319-24574-4_28
Rußwurm, M., and Körner, M. (2017). Multi-Temporal Land Cover Classification With Long Short-Term Memory Neural Networks. Int. Arch. Photogramm. Remote Sens. Spat. Inf. Sci. XLII-1/W, 551–558. doi:10.5194/isprs-archives-XLII-1-W1-551-2017
Saha, S., Roy, J., Pradhan, B., and Hembram, T. K. (2021). Hybrid Ensemble Machine Learning Approaches for Landslide Susceptibility Mapping Using Different Sampling Ratios at East Sikkim Himalayan, India. Adv. Space Res. 68 (7), 2819–2840. doi:10.1016/j.asr.2021.05.018
Sefrin, O., Riese, F. M., and Keller, S. (2020). Deep Learning for Land Cover Change Detection. Remote Sensing. 13, 78. doi:10.3390/rs13010078
Shirzadi, A., Soliamani, K., Habibnejhad, M., Kavian, A., Chapi, K., Shahabi, H., et al. (2018). Novel GIS Based Machine Learning Algorithms for Shallow Landslide Susceptibility Mapping. Sensors. 18 (11), 3777. doi:10.3390/s18113777
The City Scapes Dataset (2021). City Scapes Dataset. Available at: https://www.cityscapes-dataset.com/(accessed June 16, 2021).
Wang, M., Zhang, H., Sun, W., Li, S., Wang, F., and Yang, G. (2020). A Coarse-To-Fine Deep Learning Based Land Use Change Detection Method for High-Resolution Remote Sensing Images. Remote Sensing. 12, 1933. doi:10.3390/rs12121933
Weng, L., Xu, Y., Xia, M., Zhang, Y., Liu, J., Xu, Y., et al. (2020). Water Areas Segmentation From Remote Sensing Images Using a Separable Residual SegNet Network. ISPRS Int. J. Geo-Inf. 9 (4) 256. doi:10.3390/ijgi9040256
Wulder, M. A., White, J. C., Goward, S. N., Masek, J. G., Irons, J. R., Herold, M., et al. (2008). Landsat Continuity: Issues and Opportunities for Land Cover Monitoring. Remote Sensing Environ. 112, 955–969. doi:10.1016/j.rse.2007.07.004
Xia, G. S., Bai, X., Ding, J., Zhu, Z., Belongie, S., Luo, J., et al. (2018). “DOTA: A Large-Scale Dataset for Object Detection in Aerial Images,” in Proceedings of the IEEE Conference on Computer Vision and Pattern Recognition (CVPR), 3974–3983. Available at: https://openaccess.thecvf.com/content_cvpr_2018/html/Xia_DOTA_A_Large-Scale_CVPR_2018_paper.html [Accessed October 22, 2021].doi:10.1109/cvpr.2018.00418
Yu, L., Wang, J., Li, X., Li, C., Zhao, Y., and Gong, P. (2014). A Multi-Resolution Global Land Cover Dataset through Multisource Data Aggregation. Sci. China Earth Sci. 57, 2317–2329. doi:10.1007/s11430-014-4919-z
Zhang, C., Harrison, P. A., Pan, X., Li, H., Sargent, I., and Atkinson, P. M. (2020). Scale Sequence Joint Deep Learning (SS-JDL) for Land Use and Land Cover Classification. Remote Sensing Environ. 237, 111593. doi:10.1016/j.rse.2019.111593
Zhang, C., Sargent, I., Pan, X., Li, H., Gardiner, A., Hare, J., et al. (2019). Joint Deep Learning for Land Cover and Land Use Classification. Remote Sensing Environ. 221, 173–187. doi:10.1016/j.rse.2018.11.014
Zhang, J., Zhao, X., Chen, Z., and Lu, Z. (2019). A Review of Deep Learning-Based Semantic Segmentation for point Cloud. IEEE Access. 7, 179118–179133. doi:10.1109/access.2019.2958671
Zhang, S., Benenson, R., and Schiele, B. (2017). “CityPersons: A Diverse Dataset for Pedestrian Detection,” in Proceedings of the IEEE Conference on Computer Vision and Pattern Recognition (CVPR), 3213–3221. Available at:. doi:10.1109/cvpr.2017.474https://openaccess.thecvf.com/content_cvpr_2017/html/Zhang_CityPersons_A_Diverse_CVPR_2017_paper.html (Accessed October 22, 2021).
Keywords: landcover, AI, training datasets, annotation, machine learning
Citation: Lee S-H and Lee M-J (2022) Comparisons of Multi Resolution Based AI Training Data and Algorithms Using Remote Sensing Focus on Landcover. Front. Remote Sens. 3:832753. doi: 10.3389/frsen.2022.832753
Received: 10 December 2021; Accepted: 08 April 2022;
Published: 09 May 2022.
Edited by:
Cláudia Maria Almeida, National Institute of Space Research (INPE), BrazilCopyright © 2022 Lee and Lee. This is an open-access article distributed under the terms of the Creative Commons Attribution License (CC BY). The use, distribution or reproduction in other forums is permitted, provided the original author(s) and the copyright owner(s) are credited and that the original publication in this journal is cited, in accordance with accepted academic practice. No use, distribution or reproduction is permitted which does not comply with these terms.
*Correspondence: Moung-Jin Lee, leemj@kei.re.kr