Genesis and Evolution of NASA’s Satellite Ocean Color Program
 Charles R. McClain
 Bryan A. Franz
 P. Jeremy Werdell
- 1Former Member of the Ocean Ecology Laboratory, NASA Goddard Space Flight Center, Greenbelt, MD, United States
- 2Ocean Ecology Laboratory, NASA Goddard Space Flight Center, Greenbelt, MD, United States
We recount, based on our involvements in NASA ocean color flight projects, the chronology of technical challenges, lessons learned, and key developments over the past 40 + years of NASA satellite ocean color, beginning with the Nimbus-7/Coastal Zone Color Scanner, that have led to the upcoming Plankton, Aerosol, Cloud, ocean Ecosystem (PACE) mission. Topics include the evolution of 1) satellite ocean color and field bio-optical data access, 2) satellite sensor capabilities, i.e., CZCS to PACE’s hyperspectral Ocean Color Imager, OCI, 3) atmospheric corrections, 4) pre- and post-launch sensor characterization and calibration, 5) bio-optical algorithms, 6) in situ-derived radiometry and photosynthetic pigment data measurement quality, and 7) applications of hyperspectral satellite observations.
Introduction
This article was submitted at the request of the guest editor of this special issue of Frontiers in Remote Sensing, Dr. Robert Frouin, who thought it would be useful to the community for us to document our experiences and perspectives per our involvements in NASA’s ocean color missions beginning with the Nimbus-7 Coastal Zone Color Scanner (CZCS) launched in October 1978 and extending through the upcoming Plankton, Aerosol, Cloud, ocean Ecosystem (PACE) mission scheduled to launch in January 2024. Thus, our account will be limited primarily to activities conducted at NASA Goddard Space Flight Center, e.g., experiences with the Sea-viewing Wide Field-of-View Sensor (SeaWiFS) and preparation for PACE, and intentionally reads much like a memoir. Over the past 40 + years, there have been numerous advances and refinements in the technologies, methodologies and algorithms and we will highlight many. Acker (2015) also provides a detailed description of the NASA ocean color program up through the initial phases of the National Polar-orbiting Environmental Satellite System (NPOESS) Preparatory Project (later renamed to the Suomi National Polar-orbiting Partnership (SNPP)) that incorporated the first Visible-Infrared Imaging Radiometer Suite (VIIRS). In addition, the basic concepts of ocean color are discussed by a number of chapter authors in Zibordi et al. (2014), as well as in Werdell and McClain (2019). Mobley et al. (2016) provides a useful accompanying reference for the atmospheric correction processes and terminology we will discuss. Finally, there have been complementary and useful airborne sensors that we will not discuss, but one of note is the Airborne Oceanic Lidar (AOL, e.g., Hoge et al., 1988) that operated out of the NASA Wallops Flight Facility (WFF) for many years. We will not endeavor to recount the multitude of advances in ocean science that have resulted from these missions. In our reflections, being somewhat personal, we will refer to ourselves in the text as CM, BF, and JW, for Charles “Chuck” McClain, Bryan Franz, and Jeremy Werdell.
NASA’s entry into Earth remote sensing began in the 1960s with programs such as TIROS (Television Infrared Observation Satellite) and Nimbus, which were primarily focused on meteorology. In 1970, a paper was published in Science (Clarke et al., 1970) showing airborne measurements of ocean reflectance spectra over the open ocean and coastal waters at various altitudes. This paper underscored the feasibility of estimating near surface concentrations of the photosynthetic pigment chlorophyll-a (chla; mg m−3) remotely, but also highlighted an increase with altitude in upwelling radiance due to atmospheric scattering. There was a small but active community in the U.S. focused on marine optics, e.g., the Scripps Visibility Laboratory, as well as a sizable ocean biology/ecology community that could support and benefit from an “ocean color” satellite mission. Subsequently, engineers at the NASA Goddard Space Flight Center, under the direction of Warren Hovis, built the U-2 Ocean Color Scanner (OCS), a CZCS prototype. When the solicitation for sensors for Nimbus-G (denoted -7 after the successful launch) was released, Hovis proposed the CZCS (Hovis, 1981). There were eight sensors on Nimbus-7, the CZCS being the only ocean sensor. Our involvement began in the spring of 1978 when CM was hired at GSFC to assist with a Space Shuttle-borne ocean color experiment (OCE), which was one of three earth-viewing sensors included in the first Shuttle scientific payload (OSTA-1, 1981).
The Coastal Zone Color Scanner (1978–1986)
All NASA satellite ocean color sensors are “whiskbroom” scanners, i.e., they incorporate a cross-track scanning mechanisms as opposed to “pushbroom” designs, such as the European Space Agency’s (ESA) Medium Resolution Imaging Spectrometer (MERIS), that use arrays of detectors distributed across the orbit track to sample a fixed view (swath) of the earth along the satellite orbit. The various NASA whiskbroom implementations differ somewhat in that some sample only one line of pixels per scan across the satellite track, e.g., CZCS, while others use multiple detectors to sample multiple lines each scan, e.g., the Moderate resolution Imaging Spectroradiometer (MODIS). There are advantages and disadvantages to each as discussed in McClain et al. (2014).
The CZCS was a six band radiometer built by Ball Brothers with wavelengths centered on 443, 520, 550, 670, 750 nm, and an infrared band at 11.5 μm. Note that the 750 nm channel had a bandwidth of 100 nm and straddled the O2 A-band absorption line. Data was digitized at 8 bits (256 counts). The scanning mechanism utilized a rotating mirror with a scan rate of ∼8 Hz. With an orbital altitude of 955 km, this yielded a ground resolution at nadir of 825 m. The scan mirror could be tilted up to ±20° in 2° increments to avoid Sun glint, though ultimately only the two extreme tilts were used after early analysis by the Nimbus Experiment Team. It was well known that Rayleigh radiance due to scattering by air molecules is highly polarized, which complicates the atmospheric correction process and requires accurate characterization of the instrument polarization sensitivity during prelaunch testing. To mitigate this issue, the instrument design incorporated a depolarizer. Prelaunch polarization sensitivities at these tilt angles are unavailable, but were as high as ∼3% at 443 nm for ±10° tilts. The swath at nadir viewing was 1,636 km and the equatorial crossing time was noon.
The CZCS Nimbus Experiment Team (NET) was selected to provide scientific support of the CZCS mission, including the development of the processing algorithms for atmospheric correction and bio-optical data product retrievals. Data were archived at GSFC, with selected scenes processed to geophysical ocean color products. Pausing for a moment and in brief, atmospheric correction refers to the process of removing atmospheric contributions from the instrument-observed spectral top-of-atmosphere radiances (Lt(λ); mW cm−2 μm−1 sr−1) to derive water-leaving radiances (Lw(λ); mW cm−2 μm−1 sr−1) and/or remote-sensing reflectances (Rrs(λ), sr−1) (Mobley et al., 2016). Gordon et al. (1983) describes the groundbreaking atmospheric correction and photosynthetic pigment (chla + phaeophytin) concentration retrieval algorithms applied to CZCS. The pigment algorithm used ratios of water-leaving radiances (Lw (443)/Lw (550)) and Lw (520)/Lw (550)) statistically correlated using in situ measurements against coincident pigment concentrations, with a lower threshold boundary on Lw (443) that triggered a switch to the other ratio. One other key data product was the downwelling diffuse attenuation coefficient at 490 nm, Kd (490) (m−1), which also exploited in situ-derived empirical relationships using radiance ratios (Austin and Petzold, 1981).
There was much doubt within the atmospheric sciences community that the Gordon atmospheric correction method would work or that the atmospheric corrections from a satellite could be sufficiently accurate to allow quantitative estimates of ocean constituents such as chla. One of the first independent validations of the CZCS algorithms appears in McClain et al. (1984), where a comparison of in situ chla values collected across a Gulf Stream upwelling frontal eddy by Jim Yoder were almost perfectly matched by the CZCS-derived values over a range of ∼0.1–8 mg m−3. Years later, Robert Fraser at GSFC used his radiative transfer code on a CZCS scene and retrieved virtually the same results as the Gordon algorithm (Fraser et al., 1997). Gordon (2021) recounts the development and validation of his methodologies.
One early challenge in working with the CZCS data was a significant temporal degradation in radiometric sensitivities, which initially limited meaningful ocean color retrievals to the early years of the mission, until vicarious methods of temporal calibration were established (Evans and Gordon, 1994). Another issue was sensor “ringing” off bright targets. One early study (McClain et al., 1988) using a 1-year time series 1979) of three zones constituting the US South Atlantic Bight (Cape Canaveral to Cape Hatteras) required areas affected by ringing to be manually masked. Later, algorithms such as Mueller (1988) were developed to identify affected pixels and apply a mask. McClain and Yeh (1994) provides a comparison of ringing mask algorithms.
As a further complication, there were no formal plans or budget to process all the data to derived products or to distribute the data to the research community because the sensors on Nimbus-7 were considered proof-of-concept. Furthermore, few institutions had the hardware and software to process the imagery, with a notable exception being the University of Miami. As a result of a collaboration with colleagues at Skidaway Institute of Oceanography in Savannah, Georgia, CM received seed funding from the Department of Energy to develop CZCS data processing software. This was the advent of SEAPAK (McClain et al., 1989), which eventually included ∼200 processing and analysis functions with a menu-driven user interface. A number of guest investigators visited GSFC to use the system, including Vittorio Barale, Gene Feldman, Karl Banse, Jim Yoder, Joji Ishizaka and Frank Muller-Karger, all of whom remained active in the NASA program and international ocean color programs. NASA HQ ocean biology program managers continued the support of SEAPAK until it was superseded by the SeaWiFS Data Analysis System (SeaDAS) (Baith et al., 2001).
In the early 1980s, Wayne Esaias took a position at NASA HQ as the lead for ocean biology in Stan Wilson’s oceans branch. While at HQ, he began promoting the idea of a CZCS follow-on. After 2 years at HQ, he came to GSFC. It was clear to him that a follow-on mission would require community support and that the CZCS data needed to be available to the community. He persuaded the Nimbus Project Office at GSFC to support the effort to process the entire data archive. There was much pessimism that it could be done, as the archive contained over 30,000 9-track tapes. Nonetheless, a partnership with Robert (Bob) Evans (U. of Miami) was arranged and Gene Feldman was hired at GSFC having just received his PhD. A clone of the Miami processing system with their software was installed at GSFC along with an optical disk system. Feldman handled the transfer of the 9-track tapes to optical disk and the level-2 and -3 processing. The time-dependent vicarious calibration correction developed by Evans and Howard Gordon was based on the clear-water radiance concept (Gordon and Clark, 1981). CM managed the data quality control, i.e., the elimination of scenes with too much cloud cover, ringing, etc. This was done manually by inspecting daily composites of the imagery. The reprocessing effort took roughly 4 years (Esaias et al., 1986; Feldman et al., 1989; McClain et al., 1993). The entire archive was now out of the warehouse and available from GSFC on optical platters!
During this time, Jim Yoder cycled into NASA HQ as the Ocean Biology Program manager. He inquired if SEAPAK could be ported to a PC. The answer was “yes”, provided access to an appropriate imaging card was available. By that time, disk drives had adequate capacity, and interfaces to external devices, such as tape drives and optical disks, were available. Benchmark tests were performed at GSFC using an Intel 386-based system with a Weitek math accelerator chip versus a Digital Electronics Corporation MicroVAX-II mini-computer. The PC easily out-performed the micro-VAX in processing CZCS scenes. Thus, PC-SEAPAK (McClain et al., 1992) was developed and made publicly available to the research community, greatly reducing the cost of a processing system to a few thousand dollars rather than tens of thousands of dollars.
In 1994, a special CZCS issue of the Journal of Geophysical Research, Oceans (Volume 94) was published, with many papers contributed by the now burgeoning satellite ocean color research community. Following this initial success, the CZCS data processing has been continuously refined (e.g., Gregg et al., 2002; Antoine et al., 2005; Werdell et al., 2007), with geophysical products updated periodically by the GSFC group and made available along with data from a number of follow-on ocean color sensors, as discussed below.
SeaWiFS (1997–2010)
In this section, we focus in particular on the first half of the SeaWiFS experience, namely 1990–2003. With the release of the CZCS data and the advent of the National Science Foundation’s Joint Ocean Flux Study (JGOFS), the arguments for a CZCS follow-on became compelling. By 1990, NASA’s Earth Observing System (EOS) had been approved, including MODIS sensors on both the Terra and Aqua platforms. The instrument teams for the numerous sensors on the EOS platforms had also been selected, including the MODIS Oceans Team, who were responsible for processing algorithms, postlaunch calibration, and product validation support. The MODIS sensors, however, would not be launched for a number of years, leaving the research community in limbo and JGOFS without satellite ocean color coverage. The Ocean Biology Program managers during this time, particularly Jim Yoder, Marlin Lewis, and Greg Mitchell, continued to advocate for a CZCS follow-on mission. Finally, NASA HQ agreed to fund a fixed price data buy from a private company wherein NASA would have “insight”, but not “oversight”. NASA GSFC would establish a Project Office and be responsible for negotiating the contract and would handle calibration and validation (“Cal/Val”) and data processing, archival, and distribution to approved researchers.
An open-competition request for proposals was released and the bid from Orbital Sciences Corporation (OSC) was selected. NASA would pay incrementally during the prelaunch phase, upon completion of specific milestones in the system’s development, with a final payment upon post-launch data acceptance. The mission was scoped for 5 years with an expected launch in August 1993, roughly 27 months after the signing of the contract, which was a very ambitious schedule! In addition to on-board recording and downlink of the global data at reduced resolution, the mission would also include an L-band transmitter that enabled real-time, full resolution data collection by appropriately-configured ground stations, as the satellite passed over. The contract allowed for a specified number of these high resolution picture transmission (HRPT) ground systems to be allocated by the Project Office, where overpass data could be downloaded and decrypted with decryption keys provided by OSC via the Project, and with the condition that all data collected would be provided to the Project.
OSC built the SeaSTAR spacecraft in-house, but contracted with Hughes Santa Barbara Research Center (SBRC) to design and build SeaWiFS. SBRC allowed the Project Office (primarily Robert (Bob) Barnes who represented GSFC) to observe the instrument build. The lead optical engineer, Alan Holmes of SBRC, chose a rotating telescope rather than a rotating mirror. This design includes a half-angle mirror that rotates at one-half the speed of the telescope and keeps the light aligned on the focal planes at all scan angles. The rotating telescope has a number of benefits including minimizing polarization effects at different angles of light incidence onto the mirror, reduction in straylight entering the optical train, and reduction in contamination exposure. To improve SNR, he incorporated four detectors per band aligned in the cross-track direction that facilitated a time-delay integration (TDI) scheme. In this scheme, a ground pixel is observed by each of the four detectors at slightly different times as the telescope scans, and the signals are summed. To allow quantification of bright targets, such as sediment-dominated coastal waters, glint, and adjacent clouds, while also maintaining high sensitivity at low signal levels over open ocean waters, one of the four detectors was configured with a much higher saturation radiance (reduced radiometric gain), giving each band a bilinear response with signal level. The sensor also included a depolarizer that reduced polarization sensitivity to ∼0.25%. The band set was 412, 443, 490, 510, 555, 670, 765 and 865 nm. The 765 and 865 nm bands were specifically included for ocean color atmospheric correction. Like CZCS, the 765 nm band straddled the O2 A-band absorption line, thus requiring a correction to be developed (Ding and Gordon, 1995). The out-of-band response at some wavelengths was significant, which required development of out-of-band corrections (Gordon, 1995; Mobley et al., 2016). The sensor design and performance characteristics are summarized in Barnes et al. (1994a,b). The final radiometric calibration of SeaWiFS was conducted by Carol Johnson of the National Institute of Standards and Technology (NIST, Johnson et al., 1999).
The SeaWIFS scan rate was ∼6 Hz and the orbit was at 705 km, yielding a nadir resolution of ∼1.1 km with a swath-width at nadir of 2,875 km (1,285 pixels). The equatorial crossing time was approximately noon, but the orbit was not maintained and the crossing time eventually drifted to later in the afternoon, reaching approximately 2 p.m. by the end of extended mission life. The data was broadcast real-time at full resolution (referred to as local area coverage or LAC), but the flight data recorder was not large enough to hold the complete record of full-resolution data between downlink opportunities (twice daily via S-band at GSFC and WFF), so the recorded data was subsampled every fourth pixel and line and limited to a swath width of 1,500 km (248 pixels; global area coverage or GAC). The data was digitized at 12 bits, but stored (and transmitted) at 10 bits (1,024 counts). Thus, the GAC data volume stored onboard the spacecraft was reduced by approximately a factor of 20, which allowed collection of global observations while also leaving additional storage for limited LAC data recording over critical calibration and validation sites.
The SeaWiFS Project Office was established at GSFC. Key personnel were Robert (Bob) Kirk (Project Manager), Mary Cleave (Deputy Project Manager), Wayne Esaias (Project Scientist), Bob Barnes (Instrument Scientist), Stanford (Stan) Hooker (Field Program Manager), Gene Feldman (Data System Manager), CM (Calibration and Validation Manager), Watson Gregg (Mission Operations Manager) and Charles Vermillon (Ground System Manager). Roles evolved over time. Eventually, Cleave became the Project Manager, CM assumed the Project Scientist responsibilities, and Feldman took charge of the ground systems in addition to the data system. After launch and data acceptance, Cleave moved on to NASA HQ and CM became Project Manager. Also, Gregg moved to the Global Modeling and Assimilation Office (GMAO) at GSFC and Frederick (Fred) Patt took the mission operations slot.
During the prelaunch phase, the SeaWiFS Project Office staffed up, mostly with on-site support contract personnel, including Fred Patt and co-author BF. It was a scramble to prepare for a 1993 launch as there was no existing infrastructure, except the remnants of the CZCS reprocessing system, with few staff in place. Despite this, the Project Office’s goal was to distribute science quality data products within a day of acquisition. Fortunately, the main Project Office elements, e.g., data processing, Cal/Val, mission operations and ground systems, had fixed budgets and the freedom to direct those funds as needed to meet mission goals, without direct oversight by GSFC or HQ management.
Problems with the spacecraft (SeaSTAR) and launch vehicle (Pegesus-XL) eventually led to a 4-year launch delay. In retrospect, this bought the Project Office much needed time to prepare for the mission. There were many within NASA and in the aerospace industry who opposed the fixed fee data buy concept. The numerous schedule slips raised a constant concern of mission cancellation. As a result, Cleave contacted Mike Griffin at OSC, which ultimately resulted in a change in the OSC project management. The replacement, John McCarthy, turned the OSC program around. Cleave also persuaded Dan Golden, the NASA Administrator at the time, to not cancel the mission because of the launch delays.
Progress in the data system and Cal/Val programs developed rapidly. The guidance from NASA HQ was that the Project should rely on the MODIS Oceans Team as much as possible, as there would not be an analogous SeaWiFS Ocean Team assembled. The processing system moved from DEC VAX systems to RISC (reduced instruction set computers) systems from Silicon Graphics Incorporated (SGI) and eventually to clusters of linux-based PCs. Prelaunch testing of the data system was facilitated using simulated data (Gregg et al., 1993). The initial processing code was provided by Bob Evans, a MODIS Oceans Team member. The University of Miami code was the basis for what became the multi-sensor Level-1 to Level-2 code, L2GEN, as developed and implemented by BF and still used today for all NASA ocean color data processing. The data system incorporated a commercial database management software package that was employed to track the data from ingest from the ground system, through the various processing steps, to data archival and distribution, and to manage the allocation of disk storage and computing resources. Advances in the technology allowed for algorithm testing and reprocessings to occur simultaneously with on-going operations, which ultimately was realized as a huge benefit. Indeed, periodic data reprocessings have repeatedly been shown to be necessary as updates to bio-optical and atmospheric corrections are developed, data products are added, and sensor degradation progresses. BF managed updates to the processing codes, testing, and reprocessing activities.
As for the Cal/Val program, sensor-specific atmospheric correction and bio-optical algorithms needed to be developed, quality control procedures needed to be defined, and ancillary data sources (e.g., meteorological data and ozone concentrations) needed to be identified and routinely acquired. Howard Gordon, a MODIS Ocean Team member, was funded to provide the atmospheric correction algorithm (Gordon and Wang, 1994). After launch, Menghua Wang joined the SeaWiFS Project Office. The Gordon and Wang algorithm assumed the ocean was black (negligible reflectance) at 765 and 865 nm–colloquially dubbed “the black pixel assumption”—which is not the case in turbid water. Initially, the approach of Siegel et al. (2000) was implemented to correct for this, followed by the approach of Bailey et al. (2003) that employed the bio-optical model of Gould and Arnone (1998), both of which were later superseded by Bailey et al. (2010). A wind speed dependent Sun glint mask based on Cox and Munk (1954) (Wang and Bailey, 2000) and a white-cap reflectance correction based on Koepke (1984) were also implemented, as well as the ocean bidirectional reflectance algorithm of Morel et al. (2002). Much later in the mission, a NO2 correction was included (Ahmad et al., 2007) and the aerosol models and look-up tables were updated (Ahmad et al., 2010) using the vector radiative transfer code of Ahmad and Fraser (1982) based on the work of Dave (1972). Mobley et al. (2016) provides a modern description of SeaWiFS atmospheric correction.
The initial bio-optical science data product set included spectral ocean remote sensing reflectances, chla and Kd (490). This product suite expanded over time and the retrieval algorithms have continued to evolve. Examples of additional early products included concentrations of particulate organic carbon (POC; mg m−3; Stramski et al., 2008) and particulate inorganic carbon (PIC; μM L−1; Balch et al., 2005), spectral inherent optical properties (IOPs; m−1; e.g., absorption coefficients for phytoplankton and non-algal particles (NAP) plus colored dissolved organic matter (CDOM), and backscattering coefficients for particles; see Werdell et al., 2018 and references therein), and daily photosynthetically available radiation (PAR; Einstein/m2/day; Frouin et al., 2002). To arrive at the at-launch chla algorithm, CM hosted several open community workshops. As a result of these gatherings, it became clear that several quality assurance activities were required: 1) the establishment of rigorous, community consensus optical data collection and analysis protocols, 2) verification of radiometer (inter-)calibrations, 3) validation of photosynthetic pigment analyses, and 4) the development of a common repository for quality-controlled bio-optical data. These concerns lead to: 1) the publication of field and laboratory data collection protocols (Mueller and Austin, 1992), 2) the SeaWiFS Intercalibration Round-Robins (SIRREX, e.g. Zibordi et al., 2002) and the SeaWiFS Data Analysis Round-Robins (DARR, e.g., Siegel et al., 1995), 3) the SeaWiFS HPLC Analysis Round-Robin Experiments (SeaHARRE, e.g. Hooker et al., 2000), and 4) the SeaWiFS Bio-optical Data Archive and Storage System (SeaBASS; https://seabass.gsfc.nasa.gov; e.g., Hooker et al., 1994; Werdell and Bailey, 2002).
Within the SeaWiFS Project Office, Stan Hooker deployed on numerous field campaigns including at the Acqua Alta Oceanographic Tower (Hooker et al., 1999) and the British Atlantic Meridional Transect (AMT, e.g., Robins et al., 1996) cruises. He also collaborated with Satlantic Inc. and Biospherical Instruments Inc. on a variety of field radiometer designs. In parallel, NIST was funded to develop both the SeaWiFS Quality Monitor (SQM, Johnson B. C. et al., 1998) for evaluating the stability of radiometers in the field and the SeaWiFS Transfer Radiometer (SXR, Johnson B. C. et al., 1998) to support SIRREX. All of these instrument-related activities are documented in either the SeaWiFS Technical Memorandum series available on the NASA Ocean Color website (https://oceancolor.gsfc.nasa.gov/) or in the refereed literature. To further increase the inventory and availability of field and laboratory data within SeaBASS, Project funding was also provided to Kendall (Ken) Carder (a member of the MODIS Oceans Team), Greg Mitchell, and David (Dave) Siegel for the collection of field data. Finally, to settle the matter of what chla algorithm would be used at-launch, a workshop hosted by Dave Siegel at the University of California Santa Barbara was held. The outcome of this workshop resulted in the SeaWiFS Bio-optical Algorithm Mini-workshop dataset (SeaBAM; https://seabass.gsfc.nasa.gov/seabam/), the SeaWiFS at-launch chla algorithm, and the maximum-band ratio concept for ocean color retrievals (O’Reilly et al., 1998).
In the wake of the CZCS degradation experience, Dennis Clark had proposed to EOS to develop a highly accurate and traceable optical mooring, the Marine Optical Buoy (MOBY), off Lanai, Hawaii where clear water and atmospheric conditions would be most suitable for vicarious calibration of MODIS and other ocean color satellites (Clark et al., 1997; Gordon et al., 1997). The mooring would house a hyperspectral radiometer so the band passes of any ocean color sensor could be matched. CM augmented Clark’s budget to help facilitate MOBY’s deployment before the SeaWiFS launch. A test deployment was conducted in 1996, a year before the SeaWiFS launch.
While MOBY could provide an on-orbit adjustment to the prelaunch SeaWiFS calibration, it was deemed unsuitable for tracking temporal changes in sensor sensitivity. Imaging the moon had been suggested by Howard Gordon (Gordon, 1987). Because the only sensor on SeaSTAR was SeaWiFS, orbital maneuvers such as pitching the spacecraft 360° to scan the moon were possible. Use of the moon for tracking on-orbit sensor stability had never been tried before, so there was some trepidation about doing it. However, no specific technical or operational issues prohibiting the maneuver could be identified. Thus, lunar imaging was conducted each month at phase angles of plus and minus 7°, the first satellite mission to do so. Note that the lunar adjustments are relative to the initial measurements collected shortly after operational data collection began and the initial analysis is provided in Barnes et al. (2001). Unlike the CZCS, SeaWiFS experienced the greatest degradation in the red bands (up to ∼20%), while the CZCS degradation was greatest in the blue (∼40%). The initial vicarious calibration required over 30 clear sky SeaWiFS-MOBY match-ups for the adjustment coefficients to converge (Franz et al., 2007). As a result of the efficacies of both the lunar and vicarious calibration approaches, these methods have been employed on all subsequent NASA ocean color missions. Eplee and Bailey (2014) summarize both the vicarious and lunar calibration methods and results.
One of the objectives of the SeaWiFS Project was to enable and educate the user community. This took several forms including open workshops, the SeaWiFS Prelaunch and Postlaunch Technical Memorandum Series, and SeaDAS, to name only a few. With regard to SeaDAS, it was motivated by the community’s positive response to PC-SEAPAK. CM approached Bob Kirk about acquiring funding for a SeaWiFS distributed processing system, but the SeaWiFS Project’s budget had already been fixed with HQ. CM then approached Frank Muller-Karger who was the Ocean Biology Program manager at that time. He agreed to support the transition of PC-SEAPAK to SeaDAS, provided the new system used a commercial software package for the user interface and supporting analysis routines. Karen Baith and Gary Fu (lead developer of PC-SEAPAK) handled porting the SeaWiFS processing code into that environment. It should be noted that SeaDAS includes the full source code for all processing steps required to convert raw satellite data to derived ocean color products. This open-source model has provided the research community direct insight into the algorithms employed in NASA’s standard processing, and facilitated the development of a robust algorithm development community. Several training workshops were held to familiarize the community with the package. In 2000, CM turned SeaDAS and SeaWiFS project management over to Gene Feldman. The package has since been ported to a variety of platforms, including linux-based PCs and Macintosh systems, so an affordable analysis capability is available to all researchers. SeaDAS received the NASA Software of the Year award in 2003. The SeaDAS interface has since evolved and is now developed as a series of plugins to the European Space Agency’s Sentinel Application Platform (SNAP, https://step.esa.int/main/download/snap-download/), thus leveraging complementary international efforts and providing the community with a common tool for ocean color data visualization and analyses.
The Pegasus-XL launch from a Lockheed L-1011 in August 1997 was flawless. Once on orbit, there was much fine tuning to be done, resulting in reprocessings as described in Volumes 9, 10 and 11 of the SeaWiFS Postlaunch Technical Memorandum series. Also, Fred Patt helped OCS to fine tune the SeaStar attitude control system (Bilanow and Patt 2004), which improved geolocation of ground pixels and stabilization of the spacecraft after sensor tilt and lunar imaging operations.
SeaSTAR and SeaWiFS had been designed for a 5-years mission life, but the systems worked perfectly for 13 years until communications with the spacecraft finally failed in 2010. In 2004, an overview of the SeaWiFS Project (McClain et al., 2004) and a number of SeaWiFS-based articles were published in a two-volume set of Deep Sea Research II. A review of science results can be found in McClain (2009).
Because of the 5-years design life, a second SeaWiFS-like mission, EOS Color, was included in the EOS manifest. Fortuitously, there was a second SeaWiFS at SBRC. CM was to be the Project Scientist. Bob Kirk and CM scoped the mission costs and explored a ride on the next Landsat that was being managed at GSFC. The Landsat project manager and project scientist were enthusiastic, but HQ was concerned that adding it to the payload would delay launch. With the SeaWiFS launch slip, there would be no coverage gap with MODIS, so EOS Color was cancelled. This led to the Sensor Intercalibration and Merger for Biological and Interdisciplinary Ocean Studies (SIMBIOS) project.
SIMBIOS (1997–2003)
With the cancellation of EOS Color in 1995, the focus shifted to formulating an alternative ocean project. The line-up of upcoming global missions with ocean color capabilities included the Ocean Color and Temperature Sensor (OCTS, Japan), SeaWiFS, MODIS/Terra, MODIS/Aqua, MERIS (European Space Agency), and the Global Imager (GLI, Japan). While the missions were staggered in time, multiple data streams would be simultaneous. The community began to acknowledge the need for a program to facilitate collaboration and consistency in data products and the possibility of a continuous global time series.
CM, having been the EOS Color Project Scientist, was given the task by GSFC management of drafting a proposal and promoting the program to HQ (the proposal was later published in McClain et al. (2002)). Robert Harris, the head of Earth Sciences at HQ at the time, directed CM to get the funds from the EOS program. Robert Price, the EOS Project Manager at GSFC, ultimately agreed to fund it. The new Project Office would be co-located with the SeaWiFS Project Office. In 1996, CM brought Jim Mueller (San Diego State U.) to GSFC for 2 years to help organize the program. Tasks included purchasing hardware for a shared field equipment pool (radiometers, Sun photometers, a micropulse lidar, etc.). Simultaneously, HQ released a solicitation for proposals for the SIMBIOS Science Team and handled the selections. The team would have a 3-years tenure (noting that it was expanded by a second 3-years Science Team from 2000 to 2003). CM insisted that team members would be under contracts, not grants, to ensure receipt of deliverables. The contracts would be handled by the new SIMBIOS Project Office at GSFC. Proposals from the international community were welcomed, although no NASA funds would be provided. After the SeaWiFS launch, the Cal/Val budget tapered off and many of the functions were picked up under the SIMBIOS Project.
Concurrent with the initial phases of SIMBIOS was the formation of the International Ocean-Colour Coordinating Group (IOCCG; https://ioccg.org), with the goal to bring together the various international space agencies and research institutions now working in ocean color, to consolidate the state of knowledge, establish standards, and promote the science and its applications around the world. The creation of the IOCCG was led by Robert Frouin, who was at NASA HQ at the time, and its first Chairman was Trevor Platt of the Bedford Institute of Oceanography, who steered a successful and enduring course. Among its accomplishments is the IOCCG Report Series, which documents well the state of the art on a variety of topics germane to satellite remote sensing of ocean biogeochemistry.
Within the SIMBIOS Project Office, support contractor staffing got underway. Giulietta Fargion was brought onboard to assist with Science Team contract monitoring and essentially served as the Deputy Project Manager. BF led the standardization and generalization of the atmospheric correction and bio-optical algorithms and extended the processing code (L2GEN) to support the international missions. JW was hired and he and Sean Bailey were assigned to SeaBASS (Werdell et al., 2003) and to manage the instrument pool. Gerhard Meister was initially assigned to visit various US and international calibration labs to verify calibration sources and techniques (Meister et al., 2003). Kirk Knobelspiesse handled the processing of handheld Sun photometer data collected from ships. Christophe Pietras installed CIMEL Sun photometers at 12 coastal Aerosol Robotic Network (AERONET; https://aeronet.gsfc.nasa.gov/) sites in collaboration with the AERONET group at GSFC (Holben et al., 1998). Ewa Kwiatkowska and Alice Isaacman served as data analysts.
The SIMBIOS Project Office held annual Science Team meetings and published an annual technical memorandum summarizing the program’s accomplishments with individual chapters by each science team member, e.g. Fargion and McClain (2003). The members of the staff worked closely with scientists and flight projects in Europe, Japan, Korea, India and Taiwan. For instance, BF and Gerhard Meister gained membership on the MERIS Quality Working Group and the Second generation Global Imager (SGLI, Japanese Aerospace Exploration Agency or JAXA) Science Team. An arrangement with ESA regarding access to MERIS data for data quality and algorithm evaluations was established. Comparisons of data products from different ocean color sensors were conducted, e.g., Wang et al. (2002). Five updates to the ocean optics protocols were published, the first being in 2000 and the fourth in 2004 (e.g., Mueller et al., 2004). The scope of the protocols expanded with each revision and incorporated chapters by members of the ocean color community. Today, the protocols and the NASA community pigment analyses are managed by the Field Support Group at GSFC under the direction of Antonio Mannino and are hosted online by the IOCCG. SeaBASS nearly quadrupled in data volume under SIMBIOS, raising the total number of archived field campaigns and files to well over 1,000 and 40,000, respectively. A high quality bio-optical data subset of SeaBASS holdings, the NASA bio-Optical Marine Algorithm Dataset (NOMAD), was provided to the community to replace SeaBAM (Werdell and Bailey, 2005) for use in satellite data product validation and algorithm development activities. NOMAD formed the source of all updates to the standard chla and Kd (490) algorithms until the most recent 2022 mission reprocessings, when it was ultimately replaced by Valente et al. (2019), which includes NOMAD as well as many more recent dataset assemblies (see also O’Reilly and Werdell 2019).
Finally, at the invitation of JAXA, the SIMBIOS project reprocessed the OCTS data set using SeaWiFS algorithms. ADEOS-I had been launched in 1996, but failed shortly before SeaWiFS launched. Its coverage had spanned the early phase of the 1997–1998 El Niño. Today, OCTS and MERIS data products are still available via the NASA Ocean Color website, and are periodically updated using the same algorithms, data formats, and access mechanisms that are applied to the NASA ocean color missions.
The EOS Terra spacecraft carrying the MODIS sensor was launched in December 1999 and the Aqua spacecraft with the second MODIS followed in May 2002. In 2003, NASA HQ decided not to solicit a third SIMBIOS science team and terminated the program, wanting efforts to focus on MODIS Terra and Aqua. At the same time, HQ recompeted the EOS Instrument Teams for the first time and released a solicitation for a SNPP/VIIRS instrument team. As a result of these competitions, CM was asked by NASA HQ to be the leader of both the MODIS and VIIRS Ocean Teams. Responsibility for MODIS ocean color processing and distribution was also transferred from the University of Miami to the facilities of the SeaWiFS/SIMBIOS Project Offices under Gene Feldman with support from the EOS Data and Information System (EOSDIS). This consolidation of ocean color discipline processing established what is now known as the NASA Ocean Biology Processing Group (OBPG) at GSFC.
It was also about this time that one of our summer interns in 1997, and a former graduate student of Jim Yoder, Paula Bontempi, began her 18-years tenure as the NASA Program Manager for the Ocean Biology and Biogeochemistry (OBB) Program. This was the first time HQ had hired a full-time civil servant for this position, and was a recognition of the established growth and importance of the ocean color program at NASA.
MODIS (1999-Present)
The MODIS sensor was scoped to support atmospheric (aerosol and cloud), terrestrial, and ocean research. The MODIS Principal Investigator was Vince Salomonson, who also served as the Director of the GSFC Earth Sciences Directorate. MODIS has 36 spectral bands ranging from 412 nm to 14.3 μm with resolutions of 250, 500 and 1 km, depending on the band. The primary ocean color bands are 412, 443, 488, 531, 547, 667, 678, 748 and 869 nm, at 1 km resolution. The 678 nm band was specifically for the measurement of chla fluorescence, and was the first attempt to observe passive fluorescence of phytoplankton chla from space. The swath width is 2,330 km. The MODIS scan rate is 0.34 rps (both mirror sides are used) with the 1 km bands having 10 separate detectors distributed along track, thus allowing for a slower scan rate and more time to “collect” photons. The downside of having 10 separate detectors is that it produces striping in the imagery due to slight differences in detector calibrations. The data is digitized at 12 bits (4,096 counts). Both Aqua and Terra fly at an altitude of 705 km with equatorial crossing times of 1:30 p.m. and 10:30 a.m., respectively. The swath width is 2,330 km. MODIS does not tilt, nor does it have a depolarizer. In effect, it is an ocean color capable sensor, but is not fully optimized for ocean color measurements. Much coverage is lost at low latitudes due to Sun glint, on the order of >10 M km2 (depending on season) of ocean every 2 days relative to a similar instrument that tilts ±20o (Patt, 2018). The polarization sensitivity is as much as 5.4% at 412 nm, but it was characterized in prelaunch testing and thus a correction could be developed. Gordon et al. (1997) outlined the polarization sensitivity correction for MODIS. The primary on-orbit calibration tracking uses a solar diffuser with a solar diffuser stability monitor. Finally, while monthly lunar calibration maneuvers were not originally planned, it was determined that spacecraft roll maneuvers at about a 55° lunar phase angle would not impact any of the other instruments on Terra or Aqua, so monthly lunar views were approved for tracking changes in radiometric sensitivity of MODIS. Notably, the two NIR bands of MODIS at 748 and 869 nm, designed for atmospheric correction over ocean, were configured with a relatively low saturation radiance (high radiometric gain) to maximize sensitivity (SNR) over dark ocean waters (Salomonson et al., 1989). Unfortunately, this also resulted in saturation of those bands on the moon (as well as over very bright coastal waters), and thus the onboard temporal calibration of those NIR bands rely on the solar diffuser measurements alone.
When first comparing the SeaWiFS and MODIS time series, the global mean seasonal chla cycles were found to have similar amplitudes, but the phasings were offset somewhat. CM asked Gerhard Meister to look into a possible problem with the MODIS polarization correction, and this investigation revealed that there was a misunderstanding of the test coordinate system that led to an incorrect implementation in the processing code. Once that problem was corrected, the MODIS/Aqua and SeaWiFS time series were in phase (Meister, et al., 2005). However, trends remained in the MODIS/Terra time series that did not agree with SeaWiFS and MODIS/Aqua. Franz et al. (2008) established that a substantial difference in the reflectivity of the two mirror sides, attributed to damage done in prelaunch characterization, resulted in large temporal changes in the cross-track response and polarization sensitivity with scan angle that could not be resolved through the on-orbit solar and lunar calibration measurements. Following on that work, an approach was successfully developed to derive and correct for these temporal changes in the instrument based on global cross-calibration with SeaWiFS ocean color measurements, thus enabling the use of MODIS/Terra for ocean color applications (Kwiatkowska et al., 2008).
The standard atmospheric correction algorithm applied by NASA to MODIS is effectively identical to that of SeaWiFS, after adjusting for the differences in spectral band centers and spectral response (Franz et al., 2005). The bio-optical algorithms are also effectively identical, with the notable exception that MODIS does not have a 510 nm band that is used in the SeaWIFS chla algorithm to improve algorithm performance in higher chlorophyll waters (O’Reilly et al., 1998; Hu et al., 2012). MODIS does, however, add the aforementioned 678 nm band for observing chla fluorescence line height (FLH), and thus brings a new bio-optical product to the ocean color product suite. Early airborne studies by Borstad et al. (1987) inspired Mark Abbott to propose FLH in response to the initial MODIS team solicitation. Behrenfeld et al. (2009) later used the FLH product to infer changes in phytoplankton physiology associated with reduced availability of nutrients required for photosynthesis. MODIS also includes several shortwave infrared (SWIR) bands in atmospheric windows longward of 1000-nm. Although not designed for ocean color applications, Gao et al. (2000) and Wang and Shi (2005) showed that the SWIR bands, in a spectral regime where the ocean reflectance can be considered negligible even in highly turbid waters, could provide a viable alternative to the NIR bands to improve atmospheric aerosol corrections in such waters. In effect, SWIR-based retrievals of ocean color in turbid waters showed reduced bias relative to ground truth, but with much higher noise than NIR-based retrievals due to the very low signal-to-noise ratios (SNR) at typical ocean signal levels (Franz et al., 2006; Wang 2007; Werdell et al., 2010).
Following on the heels of CM, who retired in 2013, BF assumed the role of ocean team leader for the MODIS Science Team and continues to lead the maintenance and refinement of the atmospheric correction algorithm.
VIIRS (2011-Present)
VIIRS on the SNPP spacecraft gives rise to another important stage in the evolution of NASA’s satellite ocean color program, as it represents a transition from a research focus to combined research and applications focus. Like MODIS, SNPP VIIRS was meant to support research in multiple science disciplines, but also routine NOAA and Department of Defense applications. The SNPP mission was to be developed and launched by NASA, but would be operated by NOAA. Initially, the program was managed by the joint U.S. Air Force–NOAA Integrated Program Office (IPO), but was eventually turned over to NASA to manage. When NASA HQ solicited proposals for a SNPP/VIIRS science team in 2003, VIIRS had already been designed and was being fabricated by Raytheon Corporation under contract from Northrop-Grumman Corporation, the SNPP prime contractor. The design is a hybrid between SeaWiFS and MODIS, i.e., VIIRS has a rotating telescope, but MODIS-like detector arrays with 16 detectors. The seven ocean bands are 410, 443, 486, 551, 671,745 and 862 nm. The sensor also includes SWIR bands similar to MODIS, but again those bands were not designed for ocean color applications. To support ocean color as well as terrestrial and atmospheric applications, several of the VIIRS bands were designed to measure at both a high and a low radiometric gain, including the NIR band at 862 nm, but not the NIR band at 745 nm. SNPP is at an altitude of 834 km and the ocean band resolution is 750 m, requiring a scan rate of 0.55 rps. The swath width is 3,060 km, and the equatorial crossing time is the same as MODIS on Aqua at 1:30 p.m. Like MODIS, VIIRS does not tilt and it does not have a depolarizer. The polarization sensitivities range from ∼6.4% at 412 nm to less than 2.5% at 672, 745 and 862 nm. Note that SNPP was launched as the first of five satellites under what is now known as the Joint Polar Satellite System (JPSS) Program. As a core instrument for JPSS, a second VIIRS was launched on JPSS-1 (later renamed to NOAA-20) in 2017. Three additional VIIRS will be launched on JPSS-2, -3, and -4 in 2022, 2028, and 2032, respectively.
One of the first issues the Ocean Team raised was a need for lunar calibrations. Like Terra and Aqua, the system was not designed with that in mind, but would rely on a solar diffuser and stability monitor similar to MODIS. There was much resistance to spacecraft maneuvers from the operational side of the program, but Fred Patt and Jim Butler, the SNPP Calibration Scientist, demonstrated that the required maneuvers would not impact the other instruments or cause a loss of data. The necessary roll maneuvers were approved allowing monthly lunar views at ∼51° phase angle, to track the temporal calibration of VIIRS. Unfortunately, the single-gain 745-nm channel saturates on the moon, so the temporal calibration of that band relies on solar diffuser measurements. Kevin Turpie was brought in to help track the VIIRS development and testing as there were issues with the engineering test unit, e.g., optical crosstalk in the focal planes. This turned out to be a full-time job. For instance, the MODIS Calibration Support Team (MCST) reviewed much of the VIIRS prelaunch test data and published numerous technical reports on the results, and the oceans staff at GSFC reviewed those reports before release. The purpose was to have the best possible understanding of the sensor. There were many delays in the SNPP program resulting in nearly a 5-year launch slip. SNPP was launched in October 2011, so VIIRS and SeaWiFS did not overlap, but fortunately there is substantial overlap with MODIS on both Terra and Aqua.
Within NASA, the plan for SNPP was to have an EOSDIS-like data system, with centralized data acquisition, processing, archival, and distribution for all disciplines and data products. Mary Cleave (who was now serving as the Associate Administrator of the NASA Science Mission Directorate) felt that a more distributed system, where processing and distribution were handled by systems and teams like SeaWiFS, would be more cost effective and responsive to the user communities. She asked CM and Gene Feldman to represent that “discipline processing” scenario. The discussions were rather contentious, but ultimately discipline processing won out. The OBPG was initially assigned as the Product Evaluation and Analysis Tools Element (PEATE) for the ocean science discipline, with the task to support the SNPP Science Team in evaluation of the operational ocean color products that NOAA would produce, and to assess if they could meet the needs of NASA research. A major aspect of that work was the global comparison of NOAA SNPP VIIRS ocean color products with NASA’s existing MODIS ocean color time-series, to assess relative quality and continuity (Turpie et al., 2013). At the same time, BF and the OBPG team also adapted L2GEN to support VIIRS ocean color. Results from these studies demonstrated that standardized algorithms, calibration techniques, and processing methods were necessary to produce a consistent global ocean color time-series spanning the MODIS and VIIRS eras (Turpie et al., 2013). Following the PEATE phase, NASA HQ solicited proposals for NASA Science Investigation-led Processing Systems (SIPS) for VIIRS, and OBPG was awarded the VIIRS Ocean SIPS role under leadership of Gene Feldman and BF. Following CM, Kevin Turpie assumed the role of SNPP Ocean Team Leader during the postlaunch evaluation phase of the mission. The VIIRS and MODIS Science Teams were later combined, with BF serving as the Ocean Team Leader.
Where We Are Today
It is now 44 years since the launch of CZCS, and the NASA ocean color program has amassed a wealth of data on the bio-optical properties of the global oceans. All data is made freely available in a standardized format and through a common distribution system (the NASA Ocean Biology Distributed Active Archive Center (OB.DAAC)) that is specifically focused to serve the international ocean color science and applications community, and all science processing software and algorithms are distributed as open source through the SeaDAS software package, with user friendly tools for display and analysis. Beginning with SeaWiFS and including data from MODIS and VIIRS, there is now a continuous global ocean color time series spanning nearly 25 years, with sufficient quality and continuity to assess changes in ocean bio-optical properties on global to regional spatial scales and decadal timescales. This was achieved through robust instrument designs and thorough prelaunch characterization, rigorous on-orbit calibrations including use of lunar observations to track and correct for changes in radiometric response, a common vicarious calibration approach using high-quality ground truth measurements to minimize retrieval bias, and standardized science software and algorithms and ancillary data sources to ensure consistency in the atmospheric correction process and derived biogeochemical products (Franz et al., 2005; Franz et al., 2012).
In Figures 1–3, we show examples of this achievement. Figure 1 shows annual mean chlorophyll concentrations for different years spanning 4 decades, as retrieved from CZCS, SeaWiFS, MODIS, and VIIRS using common algorithms and calibration methods. These images demonstrate our ability to observe the global distribution of marine phytoplankton, and track changes in that distribution over time. Recalling that CZCS was a technology demonstration mission that was not configured for global daily measurements, the annual mean for CZCS (Figure 1A) suffers greatly from sampling biases, but this mission was the first to demonstrate the capability to measure ocean biology from space and to reveal the true scale and interconnected nature of marine phytoplankton blooms that inspired all future ocean color missions. In Figure 2, we show a similar series of images, but for the same year (2020), and for two MODIS instruments and two VIIRS instruments. These images provide a visual demonstration of the level of consistency that the NASA ocean color program has achieved from four different sensors and two different sensor designs, and thus provides confidence in our ability to track changes in the global distribution of marine phytoplankton from mission to mission. Finally, Figure 3 shows a monthly mean time-series and deseasonalized anomaly derived from SeaWiFS, MODIS, and VIIRS, for a spatial region covering much of the global oceans (as reproduced from Franz et al., 2017). Superimposed on Figure 3B is the Multivariate ENSO Index (MEI, Wolter and Timlin, 1998), which has been inverted and scaled to match the dynamic range of the chlorophyll anomaly. Figures 3A,B demonstrate our ability to observe changes in the seasonal cycles of phytoplankton blooms on multi-decadal timescales, and to track the ocean’s biological response to major climatic events (Behrenfeld at el. 2006; Franz et al., 2017).
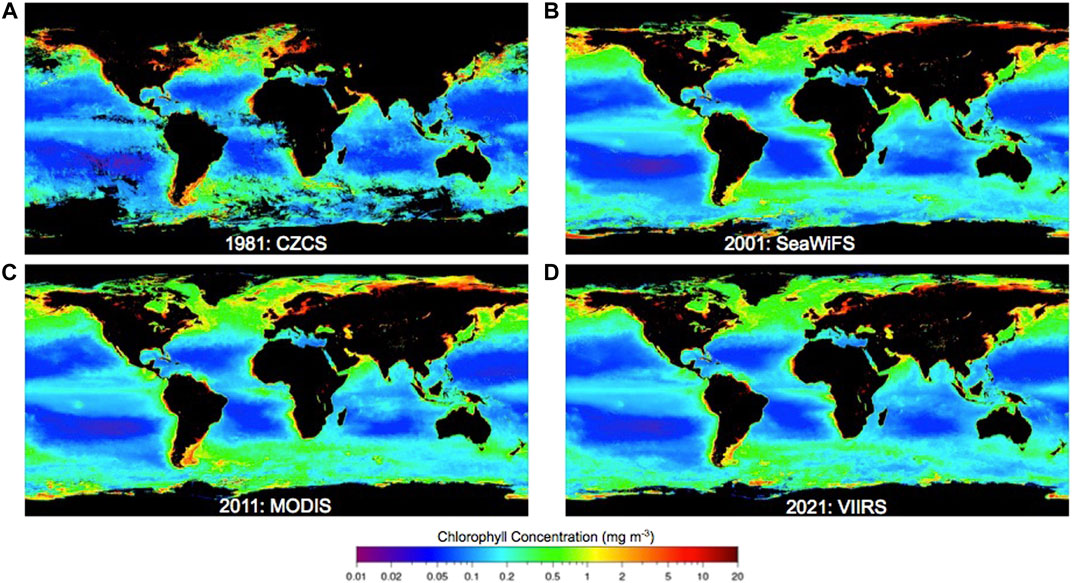
FIGURE 1. Global annual average chla composites derived from CZCS, SeaWiFS, MODIS, and VIIRS sensors for years 1981 (A), 2001 (B), 2011 (C), and 2021 (D), respectively.
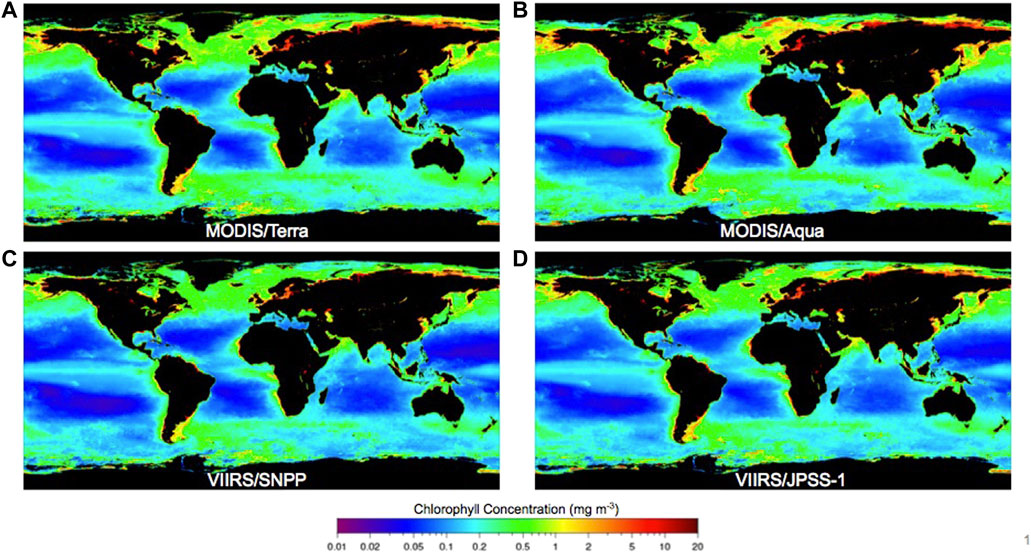
FIGURE 2. Global annual average chla composites derived from Terra/MODIS (A), Aqua/MODIS (B), SNPP/VIIRS (C), and JPSS-1/VIIRS (D) for the year 2020.
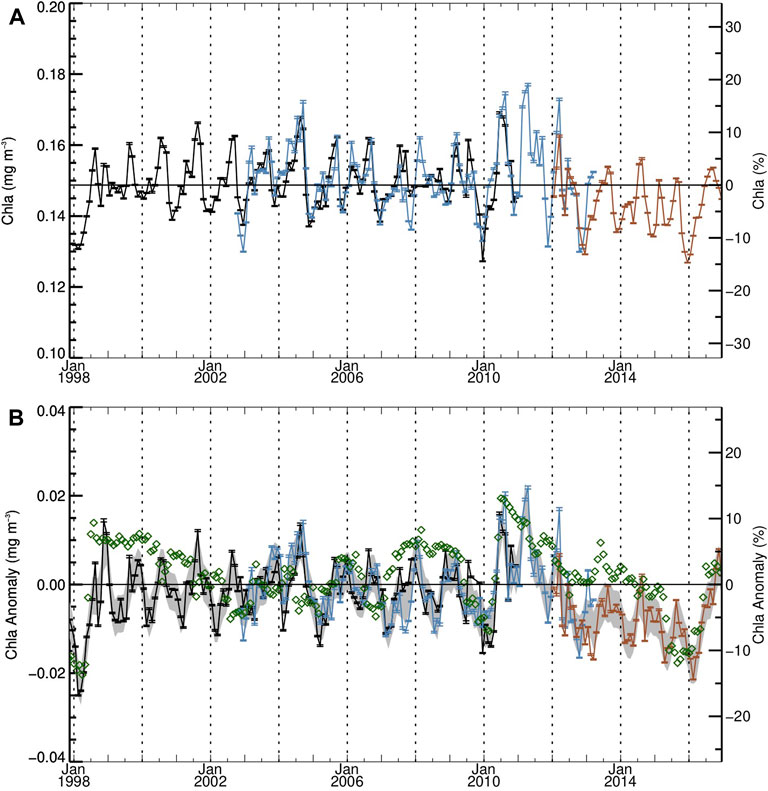
FIGURE 3. Nineteen-year multi-mission time series of monthly mean chla, averaged over the global deep oceans (greater than 1000-m depth) between latitudes of ± 40°, spanning years 1998 through 2016. Data from SeaWiFS is in black, Aqua/MODIS in blue, SNPP/VIIRS in brown. Panel A shows the absolute value of chla trends, while Panel B shows the de-seasonalized anomaly of chla after subtraction of the mean seasonal cycle. The green diamonds in Panel B show the Multivariate ENSO Index (MEI, Wolter and Timlin, 1998), inverted and scaled to match the dynamic range of the chla anamolies.
Through NASA’s satellite ocean color program and the corresponding growth of international ocean color programs that followed the success of CZCS, we have greatly expanded our knowledge and understanding of the global distribution of marine phytoplankton and their response to environmental changes, as well as the role of the ocean in global net primary productivity and the global carbon cycle. Yet, these successes also revealed and stimulated scientific questions and applications that cannot currently be addressed with heritage, multispectral instrumentation. Broadly speaking, pursuing these advanced aquatic science questions will require new, high precision, well characterized radiometric instruments with high signal-to-noise measurements and expanded spectral capabilities that allow for improved assessment of phytoplankton communities and aquatic biogeochemistry, as well as more accurate atmospheric correction across a wider dynamic range of optical conditions (e.g., IOCCG 2012; McClain et al., 2014; Palacios et al., 2015; Groom et al., 2019; Brewin et al., 2021). This should include higher precision SWIR bands, specifically tuned for ocean color atmospheric correction, and additional spectral bands in the ultraviolet, to enable advanced atmospheric correction methods and improve data quality in turbid coastal and inland waters or under absorbing aerosol conditions that challenge the current standard atmospheric correction algorithm (Frouin et al., 2019; Ibrahim et al., 2019). Most emerging approaches to evaluate phytoplankton physiology and community composition require hyperspectral measurements of at least 5 nm sampling and resolution (Lee et al., 2007; Vandermuelen et al., 2017). In addition, accurate, well-sampled radiometric retrievals across the chlorophyll fluorescence region provide important information on phytoplankton nutrient stress, as well as additional assessments of phytoplankton pigments in optically complex waters (Behrenfeld et al., 2009; Palacios et al., 2015). Frouin et al. (2019) further present this topic, as well as provide reviews of hyperspectral remote sensing of ocean color and the benefits of finely-sampled radiometric retrievals for multiple aspects of atmospheric correction. Beyond hyperspectral capabilities, some science objectives include the collection of ocean color-quality radiometric measurements in the ultraviolet region. Measurements from 350 to 400 nm provide essential–and currently unavailable–information for estimating the spectral shape characteristics of CDOM absorption (e.g., its slope) and for separating CDOM absorption from phytoplankton absorption. Considering all of the above, the SeaWiFS-MODIS-VIIRS era opened our eyes to new global aquatic biological and biogeochemical phenomena and the time is right to move into the era of global hyperspectral ocean color remote sensing. Doing so will open new horizons to further our understanding of phytoplankton community composition, chlorophyll-a to carbon ratios, biogeochemical processes, carbon export, and more. Fortunately, preparations for such a mission have been underway since 2000.
PACE
In 2000, Mary Cleave requested that GSFC formulate an agency-wide interdisciplinary (land, atmosphere, oceans) carbon cycle research program. The study was to include satellite missions, field and validation studies, algorithm development, modeling, etc. and include cost estimates on all elements of the program. CM, Forrest Hall (terrestrial sciences) and Jan Gervin (engineering) led the study. All NASA centers, members of the university community and other government agencies, e.g., the National Science Foundation, the US Geological Survey and the Environmental Protection Agency, were invited to participate. Three workshops and a number of instrument design and mission design studies were held. In the summer of 2001, the results were presented to HQ and the NASA Administrator (Dan Golden) combined the program with a supercomputing initiative and submitted it to the Office of Management and Budget (OMB). OMB was favorable to supporting the initiative, but the events of 11 September 2001 precluded it going forward.
Subsequently, Mike Behrenfeld and CM decided to move forward with an advanced ocean color mission proposal to an upcoming Earth Pathfinder solicitation. GSFC provided resources for a proposal, an instrument team was formed, and an instrument design study was conducted. The team identified over 25 spectral bands that, after the design study, were considered too many for a SeaWiFS-like optical train. The solicitation was never released. Nonetheless, GSFC continued to support further design studies. At the suggestion of Alan Holmes, the design shifted from a multi-channel filter radiometer to a hyperspectral grating spectrometer. Rather than discrete detectors, the instrument would have two gratings and charge-coupled devices (CCD) to span the ultraviolet (UV), visible and near-infrard (NIR). The CCDs could support TDI, greatly improving SNR. In 2008, GSFC provided funds to start bread-boarding the “blue” (335–590 nm) optical train, and in 2009 GSFC received funding under the NASA Instrument Incubator Program (IIP) to build the Ocean Radiometer for Carbon Assessment (ORCA) prototype, complete with a depolarizer, a rotating telescope/half angle mirror assembly and the two grating/CCD spectrographs. As part of the IIP, a working group was formed to develop sensor performance requirements (Meister et al., 2011). Also, in 2011, an IOCCG working group developed requirements for ocean color satellite missions (IOCCG, 2012). In 2011, an additional 3-years of funding was received to complete the prototype. The final implementation successfully demonstrated synchronization of the rotating telescope/half angle mirror (6 Hz) and the CCD readouts at a TDI of 16 (McClain et al., 2012). The design also satisfied all other performance requirements such as polarization sensitivity and image quality.
In 2005, simultaneous with the ORCA development, Mike Behrenfeld, CM and Jay Herman (an atmospheric scientist at GSFC) proposed an ocean radiometer, a polarimeter and an aerosol lidar mission to the National Academy of Sciences (NAS) Decadal Survey solicitation for mission concepts in support of NASA and NOAA (National Research Council, 2007). Also, during this time, Paula Bontempi convened a small working group to outline future NASA missions for ocean biogeochemistry (NASA Ocean Biology and Biogeochemistry Working Group, 2007) that included an advanced ocean color mission. In 2007, the Aerosol, Cloud and Ecosystems (ACE) mission was recommended by NAS and would include an ocean color radiometer with SWIR bands for aerosols and clouds, a polarimeter, an aerosol lidar and a dual-frequency cloud radar. ACE would follow up on the successes of MODIS, and the Cloudsat and CALIPSO (Cloud-Aerosol Lidar and Infrared Pathfinder Satellite Observation) missions as well as replace the aerosol polarimeter lost in the Glory mission launch failure. In 2008, HQ formed an ACE study team composed of atmospheric and ocean representatives to refine the requirements and sensor concepts and funded instrument and mission design studies. CM and Mike Behrenfeld served as the Ocean Team leads. During the ACE deliberations, it was suggested that the two passive sensors, i.e., the ocean radiometer and the polarimeter, be launched early as the technologies were more mature. That mission was called Pre-ACE. In 2011, HQ released a solicitation for a Pre-ACE mission Science Definition Team (SDT) with representation from the aerosol, cloud, ocean and land communities. CM, BF, and JW were selected as members of the SDT Oceans Team, as was Mike Behrenfeld. Carlos Del Castillo of the Johns Hopkins Applied Physics Laboratory (currently Ocean Ecology Laboratory chief at GSFC) chaired the formulation team. The final report was released in 2012 (PACE Science Definition Team, 2018). The first PACE Science Team was assembled in mid-2014, despite it not yet having been realized as a real mission. Still, the Science Team deliberately focused on core algorithm development for a PACE-like mission and, perhaps more importantly, on improved integration of the oceans and atmospheres communities (Boss and Remer 2018). With regards to the latter, this Science Team collaboratively produced a review paper on retrieval of aquatic IOPs (Werdell et al., 2018) and a collection of manuscripts in Frontiers in Earth Science (https://www.frontiersin.org/research-topics/7637/from-the-satellite-to-the-earths-surface-studies-relevant-to-nasas-plankton-aerosol-cloud-ocean-ecos).
In December 2014, HQ assigned the Plankton, Aerosol, Cloud, ocean Ecosystem (PACE renamed) mission to GSFC (Werdell et al., 2019). In February 2015, JW became the PACE Project Scientist, with Antonio Mannino and Brian Cairns assigned as Deputy Project Scientists for Oceans and Atmospheres, respectively. The PACE Project Office was rapidly assembled at GSFC, inclusive of the Project Science Office and its Science Data Segment, (SDS) managed by BF with support from Sean Bailey and Fred Patt. Per HQ direction, GSFC maintains responsibility for overall mission management (e.g., budget and schedule), safety and mission assurance, acquisition (and eventually development) of the spacecraft, acquisition of the launch vehicle, integration and testing of all mission elements, mission operations and ground systems, development of the ocean color instrument (OCI), day-to-day scientific guidance related to mission formulation and execution, and science data processing. NASA HQ specifically assigned science data processing to the OBPG, within which resides the PACE SDS, to further foster the agency’s discipline processing strategy elaborated upon previously. HQ also directed GSFC to consider additional, alternative ocean color sensor designs to ORCA. Design studies were conducted and, ultimately, it was decided that an ORCA-like sensor best met the performance requirements (CM and Mike Behrenfeld were not involved in this process).
Scheduled for launch in January 2024, the PACE satellite observatory consists of three instruments, a hyperspectral imaging radiometer (OCI) and two multispectral, multiangle polarimeters, with the latter described in detail elsewhere. Briefly, the polarimeters include the Spectro-polarimeter for Planetary Exploration (SPEXone), in development by a Netherlands-based consortium consisting of the Space Research Organization of the Netherlands (SRON) and Airbus Defence and Space Netherlands (Hasekamp et al., 2019), and the Hyper Angular Research Polarimeter (HARP2), in development by the Earth and Space Institute at the University of Maryland Baltimore County (Martins et al., 2018). Despite not being discussed in detail here, these polarimeters should not only advance atmospheric studies, but also have potential to revolutionize retrievals of aquatic optical and biogeochemical properties (e.g., Loisel et al., 2008; Ibrahim et al., 2012; Zhai et al., 2017; Gao et al., 2018, to name only a few).
The OCI has two slit grating, hyperspectral spectrographs that continuously span the ultraviolet (320 nm) to orange and orange to near infrared (890 nm) spectral regions. Data from the CCDs will be nominally read out every 2.5 nm at 5 nm resolution and report a total of 228 bands. Additional fiber coupled band detectors will collect measurements at seven discrete shortwave infrared (SWIR) bands centered on 940, 1,038, 1,250, 1,378, 1,615, 2,130, and 2,260 nm, six of which are at similar wavelengths to those on MODIS and VIIRS to support atmospheric data product generation. The OCI data is digitized at 16 bits. Thus, at every pixel, there are 235 spectral values, which, at 16 bits, sums to ∼15.4 megabits. The value for the CZCS was 1,536 bits, so the ratio of CZCS/OCI data rates is > 10,000!
Like SeaWiFS, OCI will perform a tilt maneuver every orbit at approximately the subsolar point to avoid Sun glint reflected off the ocean looking 20o north (fore) in the northern hemisphere and 20o south (aft) in the southern hemisphere, which maximizes the number of ocean science pixels retrieved. The OCI telescope will scan from west to east at a rotation rate of 5.77 Hz, acquiring Earth view data at ∼1 km2 at nadir and an angular range of ±56.5o, which results in a ground swath width of 2,663 km. With its 676.5 km sun-synchronous orbit and 13:00 local equator crossing time, OCI realizes 1-day global coverage from its full swath and 2-day global coverage at sensor zenith angles up to 60° beyond which the performance of the atmospheric correction is degraded.
The OCI optical design follows that of SeaWiFS and the ORCA prototype, with a rotating telescope, half angle mirror, and depolarizer (required to reduce polarization sensitivity to <1%, the specified upper limit). The spectral resolution of the two spectrographs is 5 nm, with spectral steps configurable in 0.625 nm increments from 0.625 to 5 nm). As mentioned, the at-launch configuration will provide 2.5 nm spectral steps from 340 to 890 m, with potential for additional finite 1.25 nm steps through the phytoplankton fluorescence and O2A/B spectral regions if data rates allow. Like SeaWiFS, OCI also uses TDI to increase its SNR. Its instantaneous field of view is a 16 km × 1 km rectangle on the ground, with the longer dimension in the scan direction. The CCD readout rate is synchronized with the telescope rotation such that the radiance from a 1 km × 1 km area is read successively 16 times to achieve TDI of 16:1. The same principle is used for the longer discrete bands, but the TDI varies from 2:1–8:1 for the SWIR.
Since PACE must support cloud and atmosphere science as well as ocean color, a key driver in the OCI design was to maximize SNR at low signal levels over open oceans while also supporting a very high dynamic range to avoid saturation over very bright targets. This was effectively achieved by maximizing the radiometric gain and capturing the data with 16-bits of precision (before TDI). However, as studying phytoplankton fluorescence requires radiances with very high SNRs (Behrenfeld et al., 2009), the high end of the dynamic range for bands from 660 to 715 nm is reduced to ∼40% of the maximum cloud radiance, which results in a boost in SNR. The 1,038 nm band is treated similarly to increase its SNR for use in ocean color atmospheric correction. The NASA missions to date have been designed for global open ocean science, e.g., through their spatial resolutions and spectral band selections. Coastal and more optically complex waters significantly influenced by terrestrial runoff and sediment resuspension have imposed additional challenges with respect to the accuracy of derived products like chla. While PACE retains the “coarse” resolution of a global mission, we expect its hyperspectral data ranging from the UV through the NIR will support the development and application of more robust bio-optical algorithms for optically complex waters that can be tailored regionally.
Finally, OCI will perform lunar calibrations twice every month at lunar phase angles of ±7o, and solar calibrations daily and monthly, and the high dynamic range ensures that no bands will saturate when viewing the moon (including those in the fluorescence region). Its solar calibration assembly consists of three diffusers–two bright solar and one dim solar diffuser. One bright diffuser will be measured daily to track short term gain variations, whereas the second bright diffuser will be measured monthly to determine degradation of the daily bright diffuser. The dim solar diffusor will be used to verify and track the linearity of the OCI readout electronics using special charge accumulation modes of the CCDs. The latter was not possible for heritage sensors.
Other Missions and Future Possibilities
We have focused this paper on NASA’s global ocean color missions, but there have been other ocean color missions that should be mentioned. One such mission is SeaHawk (Jeffrey et al., 2018), a nanosat mission supported by Gene Feldman and the OBPG that demonstrates the utility of regional-scale satellite ocean color measurements from low-cost spacebone platforms. The HawkEye sensor on SeaHAWK was designed and built by Alan Holmes, and includes a SeaWiFS-like suite of spectral bands. The mission provides a limited number of high resolution scenes (75–150 m; swath = 250–400 km) each day. SeaHawk was launched in December 2018 and continues to be operational, with ocean color products produced by OBPG and distributed from the OB. DAAC. A significant milestone in the evolution of satellite ocean color was the launch of the Hyperspectral Imager for the Coastal Ocean (HICO) sensor that was developed by the United States Naval Research Laboratory and operated from the International Space Station from 2009 to 2014 (Lucke et al., 2011). HICO was the first spaceborne hyperspectral instrument optimized for ocean color. It had a spectral range from 353 to 1,080 nm and a spatial resolution of 90m, and collected approximately 2000 images per year of size 50 km × 200 km over user-selected targets. After the HICO mission ended, the OBPG was asked to assume responsibility for the stewardship of the data and low-level processing software. The HICO data has served as a valuable proxy for PACE OCI data and PACE algorithm development and testing, and has facilitated the extension of the NASA ocean color algorithms to the hyperspectral regime (Ibrahim et al., 2018). The OBPG utilizes this capability to produce and maintain a standard suite of ocean color products from HICO that are now distributed by the OB. DAAC. Another important paradigm is geostationary ocean color. The first geostationary ocean color mission, the Korean Geostationary Ocean Color Mission (GOCI; Cho et al., 2010), was launched in 2010 and operated until early 2018, demonstrated the utility of sampling coastal ocean regions multiple times a day, to observe diurnal variability and coastal processes, and to minimize cloud losses. NASA is following up with the Geosynchonous Littoral Imaging and Monitoring Radiometer (GLIMR; https://eos.unh.edu/glimr/about) that is scheduled for launch in 2026, with the OBPG serving as the Science Data Segment for the mission. Finally, in the NASA Ocean Biology and Biogeochemistry Working Group report mentioned above, an ocean lidar was recommended. Subsequently, Behrenfeld et al. (2013) demonstrated the feasibility of retrieving useful ocean biogeochemical data from the NASA CALIPSO lidar that was not optimized for ocean applications. An ocean lidar could collect data at all times of day and latitudes, with vertical depth resolution, and would be an invaluable addition to the global measurement suite.
Conclusion
In this review, we have described the progression of NASA’s ocean color missions and the evolution of sensor technology, processing algorithms and data products. This progression began with the six-band (four useful for ocean color) CZCS and has advanced to the hyperspectal PACE mission. In terms of sensor performance, we provide Table 1, which summarizes a few of the primary sensor attributes. There are many performance requirements as outlined in Meister et al. (2011) that drive sensor design and engineering. In our discussion, we’ve highlighted digitization for these missions (from 8 to 16 bits) as an example of improved technology that has accommodated more demanding performance requirements. SNR is another such metric. In surveying the literature for the SNRs of these missions, we found it difficult to compare values because there are no common input radiance values used in prelaunch testing. The signal depends on ground pixel size, scan rate, bandwidth, detector quantum efficiency, etc. For example, CZCS and SeaWiFS nominal bandwidths were 20 nm (excluding the aerosol correction bands) while MODIS ocean bandwidths were generally 10 nm. This, however, does not fully explain the differences in the input radiances. Hu et al. (2012) provide a comparison based on a set of standard Ltyp values, although that analysis does not include VIIRS. Per Hu et al. (2012), the MODIS SNRs are ∼7–12 times those of the CZCS and ∼2 to 5 times those of SeaWiFS. Sources of information on SNRs include Williams, et al. (1985), Barnes et al. (1994a), Angal et al. (2015) and Cao et al. (2017) for the CZCS, SeaWiFS, MODIS and VIIRS, respectively. SNR estimates from the OCI engineering test unit (ETU) show that OCI exceeds mission requirements, defined somewhat by heritage instrument performance, at all wavelengths even by as much as a factor ∼2 in the blue portion of the spectrum.
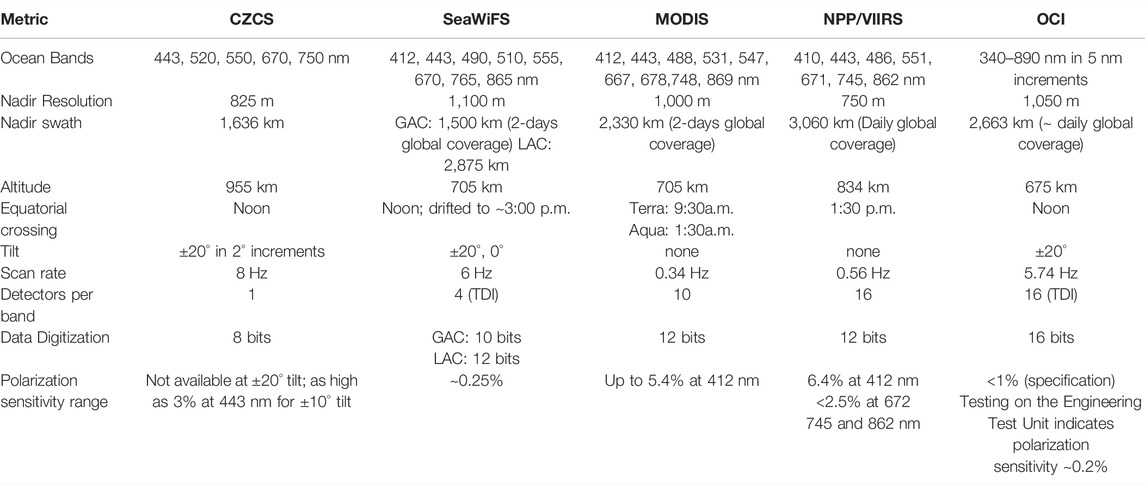
TABLE 1. NASA satellite ocean color missions and sensor metrics.
As mentioned previously, there are trade-offs in sensor design. MODIS and VIIRS were designed to support multiple science communities that, for ocean color applications, compromised coverage and data quality, e.g., no instrument tilt and no depolarization optics. Sensor designs have also varied in how SNR was achieved. MODIS and VIIRS incorporated multiple detectors aligned in the along-track direction so as to slow the scan rate, but in doing so introduce along-track striping in their ocean color imagery due to slight differences in detector calibration. Striping is a type of noise that is not accounted for in the SNR characterizations. SeaWiFS aligned detectors in the cross-track direction to allow TDI with no striping, but at a faster scan rate which introduces more wear on bearings and requires an additional mechanism, i.e., the half-angle mirror rotating at exactly half that of the primary mirror.
The original CZCS biochemical data products were pheophytin + chlorophll-a and Kd (490). The PACE mission data products include an array of optical and biogeophysical products with the promise of more as the community works with global hyperspectral data for the first time. With regard to data access, NASA has led the way making all data, including instrument calibration information, freely available online in near realtime. Also, much effort has been invested in making technical information on the sensors, algorithms, etc. available through the ocean color websites (https//oceancolor.gsfc.nasa.gov and https://pace.gsfc.nasa.gov), technical memoranda and peer-reviewed papers. The development and maintenance of SeaDAS, SeaBASS and measurement protocols have greatly enabled the user community in utilizing the satellite data, developing biogeochemical algorithms and validating data products. The scientific applications of the data from these missions is evidenced by the vast pool of scientific literature dedicated to satellite ocean color. The Nimbus Experiment Team could not have imagined the future growth and scientific influence of the NASA program that was born from their pioneering work in satellite ocean color.
Author Contributions
CM the lead author, worked at NASA GSFC for over 35 years in the NASA ocean color program and was involved in all the missions discussed in this article. He wrote much of the text and incorporated edits and sections contributed by the co-authors. BF has been involved in the NASA ocean color program since the prelaunch phase of the SeaWiFS mission. He developed much of the ocean color processing software and managed the multi-mission data reprocessing efforts within the OBPG, and is now serving as the Science Data Segment Manager for the PACE mission. Aside from many edits and comments to the main text, he wrote the sections related to data processing. JW has been involved in the NASA ocean color program beginning with SIMBIOS and has been the lead on field data archival and quality control and bio-optical algorithms. He is the Project Scientist for the PACE mission and drafted much of the discussion on that mission in addition to many edits and comments on the main text.
Funding
Support for this work was provided by the NASA Plankton, Aerosol, Cloud, ocean Ecosystem (PACE) Project.
Conflict of Interest
The authors declare that the research was conducted in the absence of any commercial or financial relationships that could be construed as a potential conflict of interest.
Publisher’s Note
All claims expressed in this article are solely those of the authors and do not necessarily represent those of their affiliated organizations, or those of the publisher, the editors and the reviewers. Any product that may be evaluated in this article, or claim that may be made by its manufacturer, is not guaranteed or endorsed by the publisher.
Acknowledgments
Many people have made significant contributions to the furtherance of NASA’s satellite biogeochemistry program and we apologize to those whom we have not given credit in this brief chronology. Many individuals have worked at GSFC as members of the ocean color staff and made invaluable contributions. Also, we do want to recognize those who have served as the ocean biology and biogeochemistry program managers at NASA HQ. They have been the primary advocates for the program at HQ, on Capitol Hill and internationally and have defined and supported the program’s science objectives through routine solicitations for proposals. They also supported the teams for SIMBIOS, MODIS, VIIRS and PACE. As mentioned earlier, until 2003, that position was held by members of the community on 2-year appointments usually through agreements with their academic institutions. They are Ken Carder, Wayne Esaias, Curt Davis, Jim Yoder, Marlon Lewis, Greg Mitchell, Frank Muller-Karger, Robert Frouin, Janet Campbell, John Mara, Chuck Trees, Paula Bontempi and Laura Lorenzoni. Finally, we would like to thank the guest editor of this special volume, Robert Frouin, for the invitation to submit this article.
References
Acker, J. G. (2015). The Color of the Atmosphere with the Ocean below: A History of NASA’s Ocean Color Missions. CreateSpace Independent Publishing Platform, 372.
Ahmad, Z., Franz, B. A., McClain, C. R., Kwiatkowska, E. J., Werdell, J., Shettle, E. P., et al. (2010). New Aerosol Models for the Retrieval of Aerosol Optical Thickness and Normalized Water-Leaving Radiances from the SeaWiFS and MODIS Sensors over Coastal Regions and Open Oceans. Appl. Opt. 49 (29), 5545–5560. doi:10.1364/ao.49.005545
Ahmad, Z., and Fraser, R. (1982). An Iterative Radiative Transfer Code for Ocean-Atmosphere Systems. J. Atmos. Sci. 32 (1), 656–665. doi:10.1175/1520-0469
Ahmad, Z., McClain, C. R., Herman, J. R., Franz, B. A., Kwiatkowska, E. J., Robinson, W. D., et al. (2007). Atmospheric Correction for NO2 Absorption in Retrieving Water-Leaving Reflectances from the SeaWiFS and MODIS Measurements. Appl. Opt. 46 (26), 6504–6512. doi:10.1364/ao.46.006504
Angal, A., Xiong, X., Sun, J., and Geng, X. (2015). On-orbit Noise Characterization of MODIS Reflective Solar Bands. J. Appl. Remote Sens. 9 (1), 4092. doi:10.1117/1.jrs.9.094092
Antoine, D., Morel, A., Gordon, H. R., Banzon, V. F., and Evans, R. H. (2005). Bridging Ocean Color Observations of the 1980s and 2000s in Search of Long-Term Trends. J. Geophys. Res. 110, C06009. doi:10.1029/2004JC002620
Austin, R. W., and Petzold, T. J. (1981). “The Determination of the Diffuse Attenuation Coefficient of Sea Water Using the Coastal Zone Color Scanner,” in Oceanography from Space. Editor J. F. R. Gower (New York: Springer), 239–256. doi:10.1007/978-1-4613-3315-9_29
Bailey, S. W., Franz, B. A., and Werdell, P. J. (2010). Estimation of Near-Infrared Water-Leaving Reflectance for Satellite Ocean Color Data Processing. Opt. Express 18 (7), 7521–7527. doi:10.1364/oe.18.007521
Bailey, S. W., Robinson, W. D., and Franz, B. A. (2003). “Modifications to the SeaWiFS NIR Correction,” in NASA Tech. Memo. 2003-206892. Editors S. B. Hooker, and E. R. Firestone (Greenbelt, Maryland: NASA Goddard Space Flight Center), 22, 26
Baith, K., Lindsay, R., Fu, G., and McClain, C. R. (2001). SeaDAS: A Data Analysis System for Ocean Color Satellite Sensors. Eos, Trans. Am. Geophys. Union. 82, 202. doi:10.1029/01eo00109
Balch, W. M., Gordon, H. R., Bowler, B. C., Drapeau, D. T., and Booth, E. S. (2005). Calcium Carbonate Measurements in the Surface Global Ocean Based on Moderate-Resolution Imaging Spectroradiometer Data. J. Geophys. Res. 110, C07001. doi:10.1029/2004JC002560
Barnes, R. A., Barnes, W. L., Esaias, W. E., and McClain, C. R. (1994a). Prelaunch Acceptance Report for the SeaWiFS Radiometer, NASA Tech. Memo. 104566. Editors S. B. Hooker, E. R. Firestone, and J. G. Acker (Greenbelt, Maryland: NASA Goddard Space Flight Center), 22, 32.
Barnes, R. A., Eplee, R. E., Schmidt, G. M., Patt, F. S., and McClain, C. R. (2001). Calibration of SeaWiFS I Direct Techniques. Appl. Opt. 40 (36), 6682–6700. doi:10.1364/ao.40.006682
Barnes, R. A., Holmes, A. W., Barnes, W. L., Esaias, W. E., and McClain, C. R. (1994b). SeaWiFS Prelaunch Radiometric Calibration and Spectral Characterization, NASA Tech. Memo. 104566. Editors S. B. Hooker, E. R. Firestone, and J. G. Acker (Greenbelt, Maryland: NASA Goddard Space Flight Center), 23, 55.
Behrenfeld, M. J., Hu, Y., Hostetler, C. A., Dall'Olmo, G., Rodier, S. D., Hair, J. W., et al. (2013). Space-based Lidar Measurements of Global Ocean Carbon Stocks. Geophys. Res. Lett. 40, 4355–4360. doi:10.1002/grl.50816
Behrenfeld, M. J., O’Malley, R. T., Siegel, D. A., McClain, C. R., Sarmiento, J. L., Feldman, G. C., et al. (2006). Climate-driven Trends in Contemporary Ocean Productivity. Nature 444, 752–755. doi:10.1038/nature05317
Behrenfeld, M. J., Westberry, T. K., Boss, E. S., O'Malley, R. T., Siegel, D. A., Wiggert, J. D., et al. (2009). Satellite-detected Fluorescence Reveals Global Physiology of Ocean Phytoplankton. Biogeosciences 6, 779–794. doi:10.5194/bg-6-779-2009
Bilanow, S., and Patt, F. S. (2004). “Pointing Performance for the SeaWiFS Mission,” in NASA Tech. Memo. Editors S. B. Hooker, and E. R. Firestone (Greenbelt, Maryland: NASA Goddard Space Flight Center), 28, 63.
Borstad, G. A., Edel, H. R., Gower, J. F. R., and Hollinger, A. B. (1987). Analysis of Test and Flight Data from the Fluorescence Line Imager. Can. Spec. Pub. Fish. Aquat. Sci. 83, 37. https://publications.gc.ca/collections/collection_2016/mpo-dfo/Fs41-31-83-eng.pdf.
Boss, E., and Remer, L. A. (2018). A Novel Approach to a Satellite Mission’s Science Team, 99. EOS, Trans. Am. Geophys. Union. doi:10.1029/2018eo092639
Brewin, R. J. W., Sathyendranath, S., Platt, T., Bouman, H., Ciavatta, S., Dall'Olmo, G., et al. (2021). Sensing the Ocean Biological Carbon Pump from Space: A Review of Capabilities, Concepts, Research Gaps and Future Developments. Earth-Science Rev. 217, 103604. doi:10.1016/j.earscirev.2021.103604
Cao, C., et al. (2017). Visible Infrared Imaging Radiometer (VIIRS) Sensor Data Record (SDR) User’s Guide, Version 1.3, 142. NOAA Technical Report NESDIS, 51.
Cho, S., Ahn, Y.-H., Ryu, J.-H., Kang, G.-S., and Youn, H.-S. (2010). Development of Geostationary Ocean Color Imager (GOCI). Korean J. Remote Sens. 26 (2), 157. doi:10.7780/kjrs.2010.26.2.157
Clark, D. K., Gordon, H. R., Voss, K. J., Ge, Y., Broenkow, W., and Trees, C. (1997). Validation of Atmospheric Correction over the Oceans. J. Geophys. Res. 102, 17209–17217. doi:10.1029/96jd03345
Clarke, G. L., Ewing, G. C., and Lorenzen, C. J. (1970). Spectra of Backscattered Light from the Sea Obtained from Aircraft as a Measure of Chlorophyll Concentration. Science 167, 1119–1121. doi:10.1126/science.167.3921.1119
Cox, C., and Munk, W. (1954). Measurement of the Roughness of the Sea Surface from Photographs of the Sun's Glitter. J. Opt. Soc. Am. 44 (11), 838–850. doi:10.1364/josa.44.000838
Dave, J. V. (1972). “Development of Programs for Computing Characteristics of Ultraviolet Radiation,”. Technical Report in Vector Case. Program V (Gaithersburg, Maryland: IBM Federal Systems Division.).
Ding, K., and Gordon, H. R. (1995). Analysis of the Influence of O2A-band Absorption on Atmospheric Correction of Ocean-Color Imagery. Appl. Opt. 34, 2068–2080. doi:10.1364/ao.34.002068
Eplee, R. E., and Bailey, S. W. (2014). “On Orbit Calibration of Ocean Color Reflective Solar Bands,” in Optical Radiometry for Oceans Climate Measurements. Editors C. Donlon, A. Parr, and G. Zibordi (Elsevier Press), 121–152. doi:10.1016/b978-0-12-417011-7.00006-4
Esaias, W. E., Feldman, G. C., McClain, C. R., and Elrod, J. A. (1986). Monthly Satellite-Derived Phytoplankton Pigment Distribution for the North Atlantic Ocean Basin. Eos Trans. AGU 67 (44), 835–837. doi:10.1029/eo067i044p00835
Evans, R. H., and Gordon, H. R. (1994). Coastal Zone Color Scanner "system Calibration": A Retrospective Examination. J. Geophys. Res. 99 (C4), 7293–7307. doi:10.1029/93jc02151
Fargion, G., and McClain, C. R. (2003). SIMBIOS Project 2002 Annual Report, NASA/TM-2003-211622. Greenbelt, Maryland: NASA Goddard Space Flight Center, 157.
Feldman, G., Kuring, N., Ng, C., Esaias, W., McClain, C., Elrod, J., et al. (1989). Ocean Color: Availability of the Global Data Set. Eos Trans. AGU 70 (23), 634. doi:10.1029/89eo00184
Franz, B. A., Bailey, S. W., Meister, G., and Werdell, P. J. (2012). Quality and Consistency of the NASA Ocean Color Data Record. Proc. Ocean. Opt. XXI, 21. doi:10.13140/2.1.2960.4169
Franz, B. A., Bailey, S. W., Werdell, P. J., and McClain, C. R. (2007). Sensor-independent Approach to the Vicarious Calibration of Satellite Ocean Color Radiometry. Appl. Opt. 46 (22), 5068–5082. doi:10.1364/ao.46.005068
Franz, B. A., Behrenfeld, M. J., Siegel, D. A., and Signorini, S. (2017). Global Ocean Phytoplankton, in State of the Climate in 2016. Bull. Am. Meteoro. Soc. 98 (8), S87. doi:10.1175/2017BAMSStateoftheClimate.1
Franz, B. A., Kwiatkowska, E. J., Meister, G., and McClain, C. R. (2008). Moderate Resolution Imaging Spectroradiometer on Terra: Limitations for Ocean Color Applications. J. Appl. Remote Sens. 2, 1–17. doi:10.1117/1.2957964
Franz, B. A., Werdell, P. J., Meister, G., Kwiatkowska, E. J., Bailey, S. W., Ahmad, Z., et al. (2006). MODIS Land Bands for Ocean Remote Sensing Applications. Proc. Ocean. Opt. XVIII, 9
Franz, B., et al. (2005). The Continuity of Ocean Color Measurements from SeaWiFS to MODIS, 5882. San Diego, California: Proc SPIE Int Soc Opt Eng, 304
Fraser, R. S., Mattoo, S., Yeh, E. n., and McClain, C. R. (1997). Algorithm for Atmospheric and Glint Corrections of Satellite Measurements of Ocean Pigment. J. Geophys. Res. 102 (D1417), 107118–107217. doi:10.1029/97jd00357
Frouin, R., Franz, B. A., and Werdell, P. J. (2002). “The SeaWiFS PAR Product,” in Algorithm Updates for the Fourth SeaWiFS Data Reprocessing, NASA Tech. Memo. 2003-206892, Volume 22. Editors S. B. Hooker, and E. R. Firestone (Greenbelt, Maryland: NASA Goddard Space Flight Center), 46
Frouin, R. J., Franz, B. A., Ibrahim, A., Knobelspiesse, K., Ahmad, Z., Cairns, B., et al. (2019). Atmospheric Correction of Satellite Ocean-Color Imagery during the PACE Era. Front. Earth Sci. 7, 145. doi:10.3389/feart.2019.00145
Gao, B.-C., Montes, M. J., Ahmad, Z., and Davis, C. O. (2000). Atmospheric Correction Algorithm for Hyperspectral Remote Sensing of Ocean Color from Space. Appl. Opt. 39, 887–896. doi:10.1364/ao.39.000887
Gao, M., Zhai, P.-W., Franz, B., Hu, Y., Knobelspiesse, K., Werdell, P. J., et al. (2018). Retrieval of Aerosol Properties and Water-Leaving Reflectance from Multi-Angular Polarimetric Measurements over Coastal Waters. Opt. Express 26, 8968–8989. doi:10.1364/oe.26.008968
Gordon, H. R. (1995). Remote Sensing of Ocean Color: a Methodology for Dealing with Broad Spectral Bands and Significant Out-Of-Band Response. Appl. Opt. 34 (8363–8), 8363–8374. doi:10.1364/AO.34.008363
Gordon, H. R. (1987). Calibration Requirements and Methodology for Remote Sensors Viewing the Ocean in the Visible. Remote Sens. Environ. 22, 103–126. doi:10.1016/0034-4257(87)90029-0
Gordon, H. R., Clark, D. K., Brown, J. W., Brown, O. B., Evans, R. H., and Broenkow, W. W. (1983). Phytoplankton Pigment Concentrations in the Middle Atlantic Bight: Comparison of Ship Determinations and CZCS Estimates. Appl. Opt. 22, 20–36. doi:10.1364/ao.22.000020
Gordon, H. R., and Clark, D. K. (1981). Clear Water Radiances for Atmospheric Correction of Coastal Zone Color Scanner Imagery. Appl. Opt. 20, 4175–4180. doi:10.1364/ao.20.004175
Gordon, H. R., Du, T., and Zhang, T. (1997). Atmospheric Correction of Ocean Color Sensors: Analysis of the Effects of Residual Instrument Polarization Sensitivity. Appl. Opt. 36, 6938–6948. doi:10.1364/ao.36.006938
Gordon, H. R. (2021). Evolution of Ocean Color Atmospheric Correction: 1970-2005. Remote Sens. 13, 5051. doi:10.3390/rs13245051
Gordon, H. R. (1998). In Orbit Calibration Strategy for Ocean Color Sensors. Remote Sens. Environ. 63, 265–278. doi:10.1016/S0034-4257(97)00163-6
Gordon, H. R., and Wang, M. (1994). Retrieval of Water-Leaving Radiance and Aerosol Optical Thickness over the Oceans with SeaWiFS: A Preliminary Algorithm. Appl. Opt. 33, 443–452. doi:10.1364/ao.33.000443
Gould, R. W., and Arnone, R. A. (1998). Remote Sensing Estimates of Inherent Optical Properties in a Coastal Environment. Rem. Sens. Environ. 61 (2), 290
Gregg, W. W., Conkright, M. E., O’Reilly, J. E., Patt, F. S., WangYoder, M. H. J. A., Yoder, J. A., et al. (2002). NOAA-NASA Coastal Zone Color Scanner Reanalysis Effort. Appl. Opt. 41, 1615–1628. doi:10.1364/ao.41.001615
Gregg, W. W., Patt, F. S., and Woodward, R. H. (1993). “The Simulated SeaWiFS Data Set, Version 2,” in NASA Tech. Memo. Editors S. B. Hooker, and E. R. Firestone (Greenbelt, Maryland: NASA Goddard Space Flight Center), 15, 42.
Groom, S., Sathyendranath, S., Ban, Y., Bernard, S., Brewin, R., Brotas, V., et al. (2019). Satellite Ocean Colour: Current Status and Future Perspective. Front. Mar. Sci. 6 (485), 485. doi:10.3389/fmars.2019.00485
Hasekamp, O. P., Fu, G., Rusli, S. P., Wu, L., Di Noia, A., Brugh, J. a. d., et al. (2019). Aerosol Measurements by SPEXone on the NASA PACE Mission: Expected Retrieval Capabilities. J. Quantitative Spectrosc. Radiat. Transf. 227, 170–184. doi:10.1016/j.jqsrt.2019.02.006
Hoge, F. E., Wright, C. W., Krabill, W. B., Buntzen, R. R., Gilbert, G. D., Swift, R. N., et al. (1988). Airborne Lidar Detection of Subsurface Oceanic Scattering Layers. Appl. Opt. 27, 3969–3977. doi:10.1364/ao.27.003969
Holben, B. N., Eck, T. F., Slutsker, I., Tanré, D., Buis, J. P., Setzer, A., et al. (1998). AERONET-A Federated Instrument Network and Data Archive for Aerosol Characterization. Remote Sens. Environ. 66, 1–16. doi:10.1016/s0034-4257(98)00031-5
Hooker, S. B., Claustre, H., Ras, J., Van Heukelem, L., Berthon, J-F., Targa, C., et al. (2000). “The First SeaWiFS HPLC Analysis Round-Robin Experiment (SeaHARRE-1),” in NASA Tech. Memo. 2000--206892. Editors S. B. Hooker, and E. R. Firestone (Greenbelt, Maryland: NASA Goddard Space Flight Center), 14, 42
Hooker, S. B., McClain, C. R., Firestone, J. K., Westphal, T. L., Yeh, E.-n., and Ge, Y. (1994). The SeaWiFS Bio-Optical Archive and Storage System (SeaBASS), Part 1, NASA Tech. Memo. 104566. Editors S. B. Hooker, and E. R. Firestone (Greenbelt, Maryland: NASA Goddard Space Flight Center), 20, 37.
Hooker, S. B., Zibordi, G., Lazin, G., and McLean, S. (1999). The SeaBOARR-98 Field Campaign, NASA Tech. Memo. 206892. Editors S. B. Hooker, and E. R. Firestone (Greenbelt, Maryland: NASA Goddard Space Flight Center), 3, 40
Hovis, W. A. (1981). The Nimbus-7 Coastal Zone Color Scanner (CZCS) Program; Oceanography From Space, Springer-Link, J. F. R. Gower, ed., pp. 213–225.doi:10.1007/978-1-4613-3315-9_27
Hu, C., Feng, L., Lee, Z., Davis, C. O., Mannino, A., McClain, C. R., et al. (2012). Dynamic Range and Sensitivity Requirements of Satellite Ocean Color Sensors: Learning from the Past. Appl. Opt. 51, 6045–6062. doi:10.1364/ao.51.006045
Ibrahim, A., Franz, B. A., Ahmad, Z., and Bailey, S. W. (2019). Multiband Atmospheric Correction Algorithm for Ocean Color Retrievals. Front. Earth Sci. 7, 116. doi:10.3389/feart.2019.00116
Ibrahim, A., Franz, B., Ahmad, Z., Healy, R., Knobelspiesse, K., Gao, B.-C., et al. (2018). Atmospheric Correction for Hyperspectral Ocean Color Retrieval with Application to the Hyperspectral Imager for the Coastal Ocean (HICO). Remote Sens. Environ. 204, 60–75. doi:10.1016/j.rse.2017.10.041
Ibrahim, A., Gilerson, A., Harmel, T., Tonizzo, A., Chowdhary, J., and Ahmed, S. (2012). The Relationship between Upwelling Underwater Polarization and Attenuation/absorption Ratio. Opt. Express 20, 25662–25680. doi:10.1364/oe.20.025662
IOCCG (2012). “Mission Requirements for Future Ocean-Colour Sensors, Mission Requirements for Future Ocean-Colour Sensors,” in Reports of the International Ocean-Colour Coordinating Group, Number 13, IOCCG. Editors C. R. McClain, and G. Meister Dartmouth, Canada, 98.
Jeffrey, H., Gorter, H., Gow, A., Clark, C., Holmes, A., Herrin, C., et al. (2018). “SEAHAWK: A Nanosatellite Mission for Sustained Ocean Observation,” in Proc. 13th Reinventing Space Conference. Editor S. Hatton (Cham: Springer). doi:10.1007/978-3-319-32817-1_9
Johnson, B. C., Early, E. A., Eplee, R. E., Barnes, R. A., and Caffrey, R. T. (1999). “The 1997 Prelaunch Radiometric Calibration of SeaWiFS,” in NASA Tech. Memo. 1999-206892. Editors S. B. Hooker, and E. R. Firestone (Greenbelt, Maryland: NASA Goddard Space Flight Center), 4, 51.
Johnson, B. C., Fowler, J. B., and Cromer, C. L. (1998b). “The SeaWiFS Transfer Radiometer (SXR),” in NASA Tech. Memo 1998-206892. Editors S. B. Hooker, and E. R. Firestone (Greenbelt, Maryland: NASA Goddard Space Flight Center), 1, 58.
Johnson, B. C., ShawHooker, P.-S. S. B., Hooker, S. B., and Lynch, D. (1998a). Radiometric and Engineering Performance of the SeaWiFS Quality Monitor (SQM): a Portable Light Source for Field Radiometers. J. Atmos. Ocean. Technol. 15, 1008–1022. doi:10.1175/1520-0426(1998)015<1008:raepot>2.0.co;2
Koepke, P. (1984). Effective Reflectance of Oceanic Whitecaps. Appl. Opt. 23, 1816–1824. doi:10.1364/ao.23.001816
Kwiatkowska, E. J., Franz, B. A., Meister, G., McClain, C. R., and Xiong, X. (2008). Cross Calibration of Ocean-Color Bands from Moderate Resolution Imaging Spectroradiometer on Terra Platform. Appl. Opt. 47 (36), 6796–6810. doi:10.1364/ao.47.006796
Lee, Z., Carder, K., Arnone, R., and He, M. (2007). Determination of Primary Spectral Bands for Remote Sensing of Aquatic Environments. Sensors 7, 3428–3441. doi:10.3390/s7123428
Loisel, H., Duforet, L., Dessailly, D., Chami, M., and Dubuisson, P. (2008). Investigation of the Variations in the Water Leaving Polarized Reflectance from the POLDER Satellite Data over Two Biogeochemical Contrasted Oceanic Areas. Opt. Express 16, 12905–12918. doi:10.1364/oe.16.012905
Lucke, R. L., Corson, M., McGlothlin, N. R., Butcher, S. D., Wood, D. L., Korwan, D. R., et al. (2011). Hyperspectral Imager for the Coastal Ocean: Instrument Description and First Images. Appl. Opt. 50, 1501
Martins, J. V., Fernandez-Borda, R., McBride, B., Remer, L. A., and Barbosa, H. M. J. (2018). The HARP Hyperangular Imaging Polarimeter and the Need for Small Satellite Payloads with High Science Payoff for Earth Science Remote Sensing. Proc. IEEE Int. Geoscience Remote Sens. Symposium, IGARSS, 6304–6307. doi:10.1109/igarss.2018.8518823
McClain, C. R. (2009). A Decade of Satellite Ocean Color Observations. Annu. Rev. Mar. Sci. 1, 19–42. doi:10.1146/annurev.marine.010908.163650
McClain, C. R., Chen, J., Darzi, M., Firestone, J., and Endres, D. (1989). SEAPAK Users Guide, Version 1.0, NASA Tech. Memo. 100728. Greenbelt, Maryland: NASA Goddard Space Flight Center, 594.
McClain, C. R., Esaias, W., Feldman, G., Frouin, R., Gregg, W., and Hooker, S. (2002). The Proposal for the NASA Sensor Intercalibration and Merger for Biological and Interdisciplinary Oceanic Studies (SIMBIOS) Program, 1995. Greenbelt, Maryland: NASA Goddard Space Flight Center, 63
McClain, C. R., et al. (2012). The Ocean Radiometer for Carbon Assessment (ORCA): Development History within an Advanced Ocean Mission Concept, Science Objectives, Design Rationale, and Sensor Prototype Description. Greenbelt, Maryland: Goddard Space Flight Center, 55
McClain, C. R., Feldman, G. C., and Hooker, S. B. (2004). An Overview of the SeaWiFS Project and Strategies for Producing a Climate Research Quality Global Ocean Bio-Optical Time Series. Deep-Sea Res. II 51 (1-3), 5–42. doi:10.1016/j.dsr2.2003.11.001
McClain, C. R., Feldman, G., and Esaias, W. (1993). in Biological Oceanic Productivity, Atlas of Satellite Observations Related to Global Change. Editors R. Gurney, J. L. Foster, and C. L. Parkinson (New York: Cambridge University Press), 251470
McClain, C. R., Fu, G., Darzi, M., and Firestone, J. K. (1992). PC-SEAPAK User's Guide, Version 4.0, NASA Tech. Memo. 104557. Greenbelt, MD: NASA Goddard Space Flight Center, 408.
McClain, C. R., Meister, G., and Monosmith, B. (2014). “Satellite Ocean Color Sensor Design Concepts and Performance Requirements,” in Optical Radiometry for Oceans Climate Measurements. Editors C. Donlon, A. Parr, and G. Zibordi (Elsevier Press), 73–119. doi:10.1016/b978-0-12-417011-7.00005-2
McClain, C. R., Pietrafesa, L. J., and Yoder, J. A. (1984). Observations of Gulf Stream-Induced and Wind-Driven Upwelling in the Georgia Bight Using Ocean Color and Infrared Imagery. J. Geophys. Res. 89 (C3), 3705–3723. doi:10.1029/jc089ic03p03705
McClain, C. R., and Yeh, Y-n. (1994). “CZCS Ringing Mask Comparison,” in NASA Tech. Memo. 104566. Editors S. B. Hooker, and E. R. Firestone (Greenbelt, Maryland: NASA Goddard Space Flight Center), 13, 43
McClain, C. R., Yoder, J. A., Atkinson, L. P., Blanton, J. O., Lee, T. N., Singer, J. J., et al. (1988). Variability of Surface Pigment Concentrations in the South Atlantic Bight. J. Geophys. Res. 93 (C910), 675697–675710. doi:10.1029/jc093ic09p10675
Meister, G., Abel, P., Barnes, R., Cooper, J., Davis, C., Fargion, G., et al. (2003). Comparison of Spectral Radiance Calibrations at Oceanographic and Atmospheric Research Laboratories. Metrologia 40, S93–S96. doi:10.1088/0026-1394/40/1/321
Meister, G., et al. (2011). Requirements for an Advanced Ocean Radiometer. Greenbelt, Maryland: NASA Goddard Space Flight Center, 37
Meister, G., Kwiatkowska, E. J., Franz, B. A., Patt, F. S., Feldman, G. C., and McClain, C. R. (2005). Moderate-Resolution Imaging Spectroradiometer Ocean Color Polarization Correction. Appl. Opt. 44 (26), 5524–5535. doi:10.1364/ao.44.005524
Mobley, C. D., Werdell, J., Franz, B., Ahmad, Z., and Bailey, S. (2016). Atmospheric Correction for Satellite Ocean Color Radiometry. Greenbelt, Maryland: NASA Goddard Space Flight Center, 73
Morel, A., Antoine, D., and Gentili, B. (2002). Bidirectional Reflectance of Oceanic Waters: Accounting for Raman Emission and Varying Particle Scattering Phase Function. Appl. Opt. 41 (30), 6289–6306. doi:10.1364/ao.41.006289
Mueller, J. L., and Austin, R. W. (1992). in Ocean Optics Protocols. NASA Tech. Memo. 104566. N. Editors S. B. Hooker, and E. R. Firestone (Greenbelt, Maryland: ASA Goddard Space Flight Center), 5, 43
Mueller, J. L., et al. (2004). “Ocean Optics Protocols for Satellite Ocean Color Sensor Validation, Revision 5,” in Volume VI: Special Topics in Ocean Optics Protocols, Part 2, NASA/TM-2004-211621. Editors J. L. Mueller, G. S. Fargion, and C. R. McClain (Greenbelt, Maryland: NASA Goddard Space Flight Center), 35.
Mueller, J. L. (1988). Nimbus-7 CZCS: Electronic Overshoot Due to Cloud Reflectance. Appl. Opt. 27 (3), 438–440. doi:10.1364/ao.27.000438
NASA Ocean Biology and Biogeochemistry Working Group (2007). Earth’s Living Ocean. The Unseen World, 74.
National Research Council (2007). Earth Science and Applications from Space: National Imperatives for the Next Decade and beyond. Washington, DC: The National Academies Press. doi:10.17226/11820
O'Reilly, J. E., and Werdell, P. J. (2019). Chlorophyll Algorithms for Ocean Color Sensors - OC4, OC5 & OC6. Remote Sens. Environ. 229, 32–47. doi:10.1016/j.rse.2019.04.021
O’Reilly, J. E., Maritorena, S., Mitchell, B. G., Siegel, D. A., Carder, K. L., Garver, S. A., et al. (1998). Ocean Color Chlorophyll Algorithms for SeaWiFS. J. Geophys. Res. 103 (C1124), 937953
PACE Science Definition Team (2018). “Pre-Aerosol, Clouds, and Ocean Ecosystem (PACE) Mission Science Definition Team Report,” in NASA Tech. Memo. 2018-219027/Vol. 2. Editors I. Cetinić, C. R. McClain, and P. J. Werdell (Greenbelt, MD: NASA Goddard Space Flight Space Center), 316.
Palacios, S. L., Kudela, R. M., Guild, L. S., Negrey, K. H., Torres-Perez, J., and Broughton, J. (2015). Remote Sensing of Phytoplankton Functional Types in the Coastal Ocean from the HyspIRI Preparatory Flight Campaign. Remote Sens. Environ. 167, 269–280. doi:10.1016/j.rse.2015.05.014
Patt, F. S. (2018). “Analysis of PACE OCI Coverage Loss from Glint and Tilt Change,” in PACE Technical Report Series, Volume 5: Mission Formulation Studies (NASA/TM-2018 – 2018-219027/Vol. 5). Editors I. Cetinić, C. R. McClain, and P. J. Werdell (GreenbeltMD: NASA Goddard Space Flight Space Center).
Robins, D. B., Bale, A. J., Moore, G. F., Rees, N. W., Hooker, S. B., Gallienne, C. P., et al. (1996). “AMT-1 Cruise Report and Preliminary Results,” in NASA Tech. Memo. 104566. Editors S. B. Hooker, and E. R. Firestone (Greenbelt, Maryland: NASA Goddard Space Flight Center), 35, 87.
Salomonson, V. V., Barnes, W. L., Maymon, P. W., Montgomery, H. E., and Ostrow, H. (1989). MODIS: Advanced Facility Instrument for Studies of the Earth as a System. IEEE Trans. Geosci. Remote Sens. 27 (2), 145–153. doi:10.1109/36.20292
Siegel, D. A., O'Brien, M. C., Sorensen, J. C., Konnoff, D. A., Brody, E. A., Mueller, J. L., et al. (1995). “Results of the SeaWiFS Data Analysis Round-Robin (DARR-94), July 1994,” in NASA Tech. Memo. 104566. Editors S. B. Hooker, and E. R. Firestone (Greenbelt, Maryland: NASA Goddard Space Flight Center), 26, 58.
Siegel, D. A., Wang, M., Maritorena, S., and Robinson, W. (2000). Atmospheric Correction of Satellite Ocean Color Imagery: the Black Pixel Assumption. Appl. Opt. 39, 3582–3591. doi:10.1364/ao.39.003582
Stramski, D., Reynolds, R. A., Babin, M., Kaczmarek, S., Lewis, M. R., Röttgers, R., et al. (2008). Relationships between the Surface Concentration of Particulate Organic Carbon and Optical Properties in the Eastern South Pacific and Eastern Atlantic Oceans. Biogeosciences 5, 171–201. doi:10.5194/bg-5-171-2008
Valente, A., et al. (2019). A Compilation of Global Bio-Optical In Situ Data for Ocean-Colour Satellite Applications – Version Two. Earth Sys. Sci. Data 11, 1037–1068. doi:10.5194/essd-11-1037-2019
Vandermeulen, R. A., Mannino, A., Neeley, A., Werdell, J., and Arnone, R. (2017). Determining the Optimal Spectral Sampling Frequency and Uncertainty Thresholds for Hyperspectral Remote Sensing of Ocean Color. Opt. Express. 25, A785–A797. doi:10.1364/OE.25.00A785
Wang, M., Isaacman, A., Franz, B. A., and McClain, C. R. (2002). Ocean-color Optical Property Data Derived from the Japanese Ocean Color and Temperature Scanner and the French Polarization and Directionality of the Earth's Reflectances: a Comparison Study. Appl. Opt. 41, 974–990. doi:10.1364/ao.41.000974
Wang, M. (2007). Remote Sensing of the Ocean Contributions from Ultraviolet to Near-Infrared Using the Shortwave Infrared Bands: Simulations. Appl. Opt. 46 (9), 1535–1547. doi:10.1364/ao.46.001535
Wang, M., and Shi, W. (2005). Estimation of Ocean Contribution at the MODIS Near-Infrared Wavelengths along the East Coast of the U.S.: Two Case Studies. Geophys. Res. Lett. 32, L13606. doi:10.1029/2005GL022917
Werdell, P. J., Bailey, S., Fargion, G., Pietras, C., Knobelspiesse, K., Feldman, G., et al. (2003). Unique Data Repository Facilitates Ocean Color Satellite Validation. Eos Trans. AGU 84 (38), 377. doi:10.1029/2003eo380001
Werdell, P. J., and Bailey, S. W. (2005). An Improved In-Situ Bio-Optical Data Set for Ocean Color Algorithm Development and Satellite Data Product Validation. Remote Sens. Environ. 98, 122–140. doi:10.1016/j.rse.2005.07.001
Werdell, P. J., Bailey, S. W., Franz, B. A., Morel, A., and McClain, C. R. (2007). On-orbit Vicarious Calibration of Ocean Color Sensors Using an Ocean Surface Reflectance Model. Appl. Opt. 46 (23), 5649–5666. doi:10.1364/ao.46.005649
Werdell, P. J., and Bailey, S. W. (2002). “The SeaWiFS Bio-Optical Archive and Storage System (SeaBASS) Current Architecture and Implementatio,” in NASA/TM-2002-211617. Editors G. S. Fargion, and C. R. McClain (Greenbelt, Maryland: NASA Goddard Space Flight Center), 45.
Werdell, P. J., Behrenfeld, M. J., Bontempi, P. S., Boss, E., Cairns, B., Davis, G. T., et al. (2019). The Plankton, Aerosol, Cloud, Ocean Ecosystem (PACE) Mission: Status, Science, Advances. Bull. Am. Meteorol. Soc. 100, 1775–1794. doi:10.1175/BAMS-D-18-0056.1
Werdell, P. J., Franz, B. A., and Bailey, S. W. (2010). Evaluation of Shortwave Infrared Atmospheric Correction for Ocean Color Remote Sensing of Chesapeake Bay. Remote Sens. Environ. 114, 10 2238–2247. doi:10.1016/j.rse.2010.04.027
Werdell, P. J., and McClain, C. R. (2019). Satellite Remote Sensing: Ocean Color, Encyclopedia Of Ocean Sciences. London: Elsevier, 444–455.
Werdell, P. J., McKinna, L. I. W., Boss, E., Ackleson, S. G., Craig, S. E., Gregg, W. W., et al. (2018). An Overview of Approaches and Challenges for Retrieving Marine Inherent Optical Properties from Ocean Color Remote Sensing. Prog. Oceanogr. 160, 186–212. doi:10.1016/j.pocean.2018.01.001
Williams, S. P., Szajna, E. F., and Hovis, W. A. (1985). Nimbus-7 Coastal Zone Color Scanner (CZCS) Level-2 Data Product Users’ Guide, NASA Technical Memorandum 86202. Greenbelt, MD: NASA Goddard Space Flight Center, 57.
Wolter, K., and Timlin, M. S. (1998). Measuring the Strength of ENSO Events: How Does 1997/98 Rank? Weather 53 (9), 315–324. doi:10.1002/j.1477-8696.1998.tb06408.x
Zhai, P.-W., Knobelspiesse, K., Ibrahim, A., Franz, B. A., Hu, Y., Gao, M., et al. (2017). Water-leaving Contribution to Polarized Radiation Field over Ocean. Opt. Express 25, A689–A708. doi:10.1364/oe.25.00a689
Zibordi, G., D'Alimonte, D., van der Linde, D., Berthon, J.-F., Hooker, S. B., Mueller, J. L., et al. (2002). The Eighth SeaWiFS Intercalibration Round-Robin Experiment (SIRREX-8). in NASA Tech. Memo. 2003--206892. Editors S. B. Hooker, and E. R. Firestone (Greenbelt, Maryland: NASA Goddard Space Flight Center), 21, 39.
Keywords: NASA satellite ocean color missions, bio-optical algorithms, atmospheric correction, satellite sensor calibration, global ocean chlorophyll-a time series, hyperspectral remote sensing
Citation: McClain CR, Franz BA and Werdell PJ (2022) Genesis and Evolution of NASA’s Satellite Ocean Color Program. Front. Remote Sens. 3:938006. doi: 10.3389/frsen.2022.938006
Received: 06 May 2022; Accepted: 14 June 2022;
Published: 05 July 2022.
Edited by:
Soo Chin Liew, National University of Singapore, SingaporeReviewed by:
Joji Ishizaka, Nagoya University, JapanBo-Cai Gao, United States Naval Research Laboratory, United States
Copyright © 2022 McClain, Franz and Werdell. This is an open-access article distributed under the terms of the Creative Commons Attribution License (CC BY). The use, distribution or reproduction in other forums is permitted, provided the original author(s) and the copyright owner(s) are credited and that the original publication in this journal is cited, in accordance with accepted academic practice. No use, distribution or reproduction is permitted which does not comply with these terms.
*Correspondence: Charles R. McClain, chuckmcclain@verizon.net