 Annamaria I. DeAngelis1*
 Sofie M. Van Parijs1
 Jack Barkowski2
 Simone Baumann-Pickering3
 Kourtney Burger4
 Genevieve E. Davis1
 John Joseph5
 Annebelle C. M. Kok3
 Anke Kügler6,7
 Marc Lammers6
 Tetyana Margolina5
 Nicole Pegg8
 Ally Rice3
 Timothy J. Rowell1
 John P. Ryan9
 Allison Stokoe10
 Eden Zang6
 Leila Hatch11
- 1Northeast Fisheries Science Center, National Marine Fisheries Service, National Oceanic and Atmospheric Administration, Woods Hole, MA, United States
- 2Moss Landing Marine Laboratories, Moss Landing, CA, United States
- 3Scripps Institution of Oceanography, University of California, San Diego, San Diego, CA, United States
- 4California State University Monterey Bay, Seaside, CA, United States
- 5Naval Postgraduate School, Monterey, CA, United States
- 6Hawaiian Islands Humpback Whale National Marine Sanctuary, Kīhei, HI, United States
- 7Hawaiʻi Institute of Marine Biology, University of Hawaiʻi, Kāneʻohe, HI, United States
- 8Harbor Branch Oceanographic Institute, Florida Atlantic University, Fort Pierce, FL, United States
- 9Monterey Bay Aquarium Research Institute, Moss Landing, CA, United States
- 10University of Southampton, Highfield, Southampton, United Kingdom
- 11Office of National Marine Sanctuaries, National Oceanic and Atmospheric Administration, Silver Spring, MD, United States
The United States of America’s Office of National Marine Sanctuaries (ONMS) hosts 15 National Marine Sanctuaries (NMS) and two Monuments in its waters. Charismatic marine megafauna, such as fin whales (Balaenoptera physalus), humpback whales (Megaptera novaeangliae), and various delphinid species frequent these areas, but little is known about their occupancy. As part of a national effort to better understand the soundscapes of NMS, 22 near-continuous passive acoustic bottom mounted recorders and one bottom-mounted cable hydrophone were analyzed within seven NMS (Stellwagen Bank, Gray’s Reef, Florida Keys, Olympic Coast, Monterey Bay, Channel Islands, and Hawaiian Islands Humpback Whale sanctuaries). The daily acoustic presence of humpback and fin whales across 2 years (November 2018–October 2020) and hourly presence of delphinids over 1 year (June 2019–May 2020) were analyzed. Humpback whales showed variability in their acoustic presence across NMS, but in general were mostly present January through May and September through December, and more scarce or fully absent June through August. Consecutive days of humpback whale vocalizations were greatest at sites HI01 and HI05 in the Hawaiian Islands Humpback Whale NMS and fewest at the Channel Islands NMS. Fin whales exhibited a similar seasonal pattern across the West Coast NMS and Stellwagen Bank NMS. Monterey Bay NMS had the greatest number of median consecutive presence of fin whales with fewest at Stellwagen Bank NMS. Delphinid acoustic presence varied throughout and within NMS, with sites at the Channel Islands and Hawaiʻi NMS showing the highest occupancy. All NMS showed distinct monthly delphinid acoustic presence with differences in detected hours between day versus night. Sixteen sites had medians of delphinid presence between one and three consecutive days, while three sites had 5 days or more of consecutive presence, and one site had no consecutive delphinid presence, showing clear variation in how long they occupied different NMS. Marine mammals utilized all NMS and showed a wide range of occupancy, emphasizing the importance of understanding species use across different NMS as biological areas for migration, breeding and foraging.
Introduction
Many marine mammal species are cosmopolitan in nature, with distributions ranging across the world’s oceans (e.g., Stern, 2009). They tend to show seasonal and temporal variability in their distribution and occupancy of different habitats, with their behavior reflecting variation in oceanographic conditions, breeding and food availability. The Office of National Marine Sanctuaries (ONMS) in the US manages a network of 15 national marine sanctuaries (NMS) and the Papahānaumokuākea and Rose Atoll marine national monuments. They are designated core areas of ecological and/or historical interest across different regions within the United States Exclusive Economic Zone (e.g., Brax, 2002; Wiley et al., 2013). These NMS often highlight areas of high productivity and species richness in addition to hosting varying anthropogenic activities. Understanding the species composition, occurrence and behavior within a NMS can allow for improved regional and coastal management of these areas. Looking at species movements across multiple NMS allows for a broader understanding of how each network of NMS provides value at different scales and time frames for marine mammal populations.
Baleen whales have some of the largest distributions out of all the marine mammals, covering large distances for the purposes of breeding and foraging (Bannister, 2009). Not all large whales migrate, and their decisions to remain in a rich feeding ground or undertake an energetic and risky migration varies between species, age, gender and condition (Corkeron and Connor, 1999). Humpback whales (Megaptera novaeangliae) and fin whales (Balaenoptera physalus) are two of the most widely distributed of the baleen whale species (Fleming and Jackson, 2011; Bettridge et al., 2015; Edwards et al., 2015) and often travel long distances between breeding and feeding areas (Stevick et al., 2011). The North Atlantic humpback whale ranges from breeding grounds in the Caribbean and Cape Verde Islands to feeding grounds off the eastern United States and Canadian seaboard, Iceland, Greenland, and Norway (Kennedy et al., 2014; Hayes et al., 2019; Davis et al., 2020). The migration of humpback whales to the Caribbean (in the North Atlantic) breeding grounds in winter months is well documented, however recent evidence shows not all individuals migrate, with year round acoustic presence occurring in regions spanning from the Mid-Atlantic to western Greenland (Davis et al., 2020), and some individuals remaining in the feeding grounds year round (Van Opzeeland et al., 2013; Magnúsdóttir et al., 2014; Hill et al., 2020). The North Pacific humpback whale range spans from the breeding grounds in the Marianas Archipelago, Hawaiʻi, Mexico, Central America, and Japan in the winter months, to the feeding grounds in Alaska, British Columbia, California, Oregon, and Washington in the summer months (Dawbin, 1966; Darling and McSweeney, 1985; Baker et al., 1986; Calambokidis et al., 2001; Calambokidis et al., 2008). The exact migration routes and number of stocks is still unclear, with whales from the different breeding grounds overlapping at the various feeding grounds (Calambokidis et al., 2001; Lagerquist et al., 2008). Additionally, there are differences in the timing of the migration based on sex and reproductive status of individuals (Craig et al., 2003). Fin whales also cover large distances, ranging from South Carolina to Greenland on the continental shelf of the western North Atlantic (Edwards et al., 2015; Davis et al., 2020), and in the North Pacific, from Asia and North America to the Bering Sea (Tomlin, 1967; Mizroch et al., 2009; Oleson et al., 2014). Fin whale acoustic occurrence on the shelf in the western North Atlantic is relatively persistent throughout the year, with a slight decrease in acoustic occurrence during summer months likely due to a change in acoustic behavior (Davis et al., 2020). It is possible not all fin whale populations undergo long migrations (Širović et al., 2015; Geijer et al., 2016). Studies of fin whale song patterns show synchronicity across the North Pacific ocean basin as opposed to migratory patterns (Oleson et al., 2014; Širović et al., 2017; Archer et al., 2020), and some individuals may reside throughout the spring and fall in areas such as the eastern Gulf of Alaska (Archer et al., 2020).
Baleen whales produce a plethora of low frequency underwater sounds for the purpose of communication, reproduction, foraging and socializing amongst others (Richardson et al., 1995; Rossing, 2014). Humpback whales produce complex songs that change annually (e.g. Payne and McVay, 1971; Payne and Webb, 1971; Winn and Winn, 1978; Payne and Payne, 1985) and have been recorded throughout their entire range and across seasons (e.g. Mattila et al., 1987; Clark and Clapham, 2004; Vu et al., 2012; Kowarski et al., 2018; Davis et al., 2020). Of the call types produced by fin whales, the 20 Hz pulse is the most common, occurring in pulse train sequences that vary spatially and temporally (Watkins et al., 1981; Morano et al., 2012; Oleson et al., 2014; Širović et al., 2017; Helble et al., 2020), with bouts lasting up to 32.5 h (Watkins et al., 1987; Morano et al., 2012). These are thought to be produced solely by males as a breeding display (Croll et al., 2002). The timing and presence of these species within a given area can provide information on their migration movements across latitudes, how much time they spend within a location within and between years, and when their presence is likely to occur. As demonstrated in Davis et al. (2020) and Kügler et al. (2020), although these signals are sex-specific (humpback whale song: Winn and Winn, 1978; fin whale 20 Hz pulses: Croll et al., 2002) it is still possible to capture large-scale distribution patterns for both sexes throughout the periods that use these known vocalizations.
Odontocetes similarly show a wide global distribution, and, within the relatively shallow NMS, members of the Delphinidae family tend to be common due to their coastal nature (e.g. Lammers, 2004; Heenehan et al., 2017). The Delphinidae are highly vociferous, able to emit a variety of whistles, clicks, burst pulses, buzzes, etc. (Lammers and Oswald, 2015; Jones et al., 2020). Whistles, burst pulses, and some forms of buzzes and clicks are thought to exhibit a social communication function (Herzing, 1996; Henderson et al., 2011), whereas clicks, specifically echolocation clicks and terminal buzzes are thought to be used in foraging (Au et al., 1974; Au et al., 1982; Au, 1993), although whistles can also be emitted less frequently or specific types are used during foraging to maintain group cohesion (Herzing, 1996; Acevedo-Gutiérrez and Stienessen, 2004). Little is known about the extent of delphinid presence within most of the NMS. Studies that included sanctuaries such as Stellwagen Bank, Olympic Coast, Monterey Bay, and Channel Islands NMS reported a higher presence of delphinids within the sanctuaries as opposed to surrounding waters (Forney, 2007; Silva et al., 2019b). For example at Stellwagen Bank NMS, studies using both PAM and visual surveys found delphinids such as Atlantic white-sided (Lagenorhynchus acutus) and common dolphins (Delphinus sp.) to be present mainly between the months of April through May and August through October than in the adjacent Massachusetts Bay waters (Silva et al., 2019b). Other sanctuaries such as the Hawaiian Islands Humpback Whale NMS contain important shallow water bays for spinner dolphins (Stenella longirostris), which use the bays during the day to rest before traveling offshore to forage (Heenehan et al., 2016).
Some studies have found that diel patterns exist for delphinid species such as the common dolphin in the Southern California Bight, with whistles occurring more during the day, and clicks occurring more at night (Wiggins et al., 2013; Simonis et al., 2017). In Massachusetts Bay and Stellwagen Bank the opposite was seen with likely Atlantic white-sided and/or common dolphins, with the fewest amount of whistles occurring around midday and peaks in whistle activity during the night (Silva et al., 2019b). Hawaiian spinner dolphins emit more whistles during the morning before their resting period then utilize echolocation clicks during the night for foraging on the deep scattering layer (Heenehan et al., 2016; McElligott and Lammers, 2021). The diversity in vocalization behavior and site usage observed in NMS highlights the potential importance of these areas for different aspects of the life history of numerous delphinid species.
Visual surveys have long been used for understanding species presence and distribution, however, these can be time consuming and are limited by weather conditions, availability of vessels and can be costly and challenging especially for remote sites (e.g., Van Parijs et al., 2009). Passive acoustic monitoring (PAM) provides an important supplement for collecting long-term information on species presence and provides robust data to explore multiple species’ simultaneous occurrence across seasons (e.g., Davis et al., 2020). PAM requires less effort than visual surveys, and recorders can be deployed for several months to years at a time, remotely collecting information on the acoustic presence of species (Van Parijs et al., 2009; Baumann-Pickering et al., 2016; Ryan et al., 2016). The presence and composition of acoustically active species is one of the great assets of PAM, since recordings allow for all acoustically active species to be detected in the data and can be revisited again as needed (e.g. Davis et al., 2020; Cohen et al., 2022). The breadth and utility of PAM was recently exemplified by the successful multi-year sampling of soundscapes within four NMS, one monument, and seven additional stations that stretched across the Pacific and Atlantic Oceans as well as the Gulf of Mexico (Haver et al., 2018; Haver et al., 2020).
In 2018, a 3 year large scale acoustic monitoring program, the National Oceanographic and Atmospheric Agency (NOAA)/Navy’s SanctSound project1, was created to monitor long term biological, anthropogenic, and abiotic contributors to soundscapes throughout the NMS network2. As part of this project, a total of 34 bottom-mounted passive acoustic recorders were stationed across seven NMS and one national monument, divided into three main regions: East Coast Region United States (US) - Stellwagen Bank National Marine Sanctuary (SBNMS), Gray’s Reef National Marine Sanctuary (GRNMS), Florida Keys National Marine Sanctuary (FKNMS); West Coast Region US - Olympic Coast National Marine Sanctuary (OCNMS), Monterey Bay National Marine Sanctuary (MBNMS), Channel Islands National Marine Sanctuary (CINMS) and Hawaiʻi Region US - Hawaiian Islands Humpback Whale National Marine Sanctuary (HIHWNMS), and the Papahānaumokuākea Marine National Monument (PMNM). In general, acoustic recorders were deployed at three to six recording sites within each NMS and recorded continuously between three to 5 months.
In this study, we focus on comparing the multi-year acoustic presence of humpback and fin whales as well as delphinids across seven NMS from the SanctSound project- SBNMS, GRNMS, FKNMS, OCNMS, MBNMS, CINMS, and HIHWNMS. We use patterned song notes and other social sounds produced by humpback whales (Payne and McVay, 1971; Stimpert et al., 2011), 20 Hz pulses produced by fin whales (Watkins et al., 1987), and whistles produced by members of the Delphinidae family (e.g. Lammers and Oswald, 2015) to denote their presence in these sanctuaries. We compare and construct the temporal activity of these species across all these protected areas to better understand how and when these species use different sites.
Materials and methods
Due to significant data gaps (see https://sanctsound.portal.axds.co/ for details), resulting primarily from constrained field work logistics during the COVID-19 pandemic, only 22 of the 34 sites in the SanctSound project were considered for use in this analysis (Table 1; Figure 1). The majority of the recorders were SoundTrap 300 or 500 series acoustic recorders (Ocean Instruments, Inc.) and were set to sample at 48 kHz with the high gain calibration. SoundTrap recorders have a flat frequency response (±3 dB) between 20 Hz and 60 kHz, providing an effective recording range for this study of 20 Hz–24 kHz (Table 1), although some frequency-dependent variations in sensitivity may exist (Wiggins and Morris, 2019). SoundTraps were attached 2–3 m above a fixed mooring either using an acoustic release with subsurface floats extending ∼ 6 m vertically into the water column or were mounted to a mooring through diver attachment. One instrument in MBNMS was a high frequency acoustic recording package (HARP, Wiggins and Hildebrand, 2007) 17 m off the seafloor, which consisted of a seafloor packaged mooring containing floats, two acoustic releases, weights, hydrophone, and recording system with internal storage. The HARP contained a lab-calibrated omnidirectional ITC 1042 hydrophone with a sampling rate of 200 kHz, resulting in an effective bandwidth of 10 Hz–100 kHz. The system response was intentionally not flat and was accounted for during analysis. Additionally, independent from the SanctSound project but occurring simultaneously and within MBNMS was an Ocean Sonics icListen HF hydrophone with a bandwidth of 10 Hz–200 kHz, connected to the Monterey Accelerated Research System (MARS) cabled observatory on the continental slope at 891 m depth. Data from MARS were streamed to shore and recorded using the Ocean Sonics Lucy software. Original 256 kHz recordings were decimated to 16 kHz (Zhang et al., 2022) for analyses presented here.
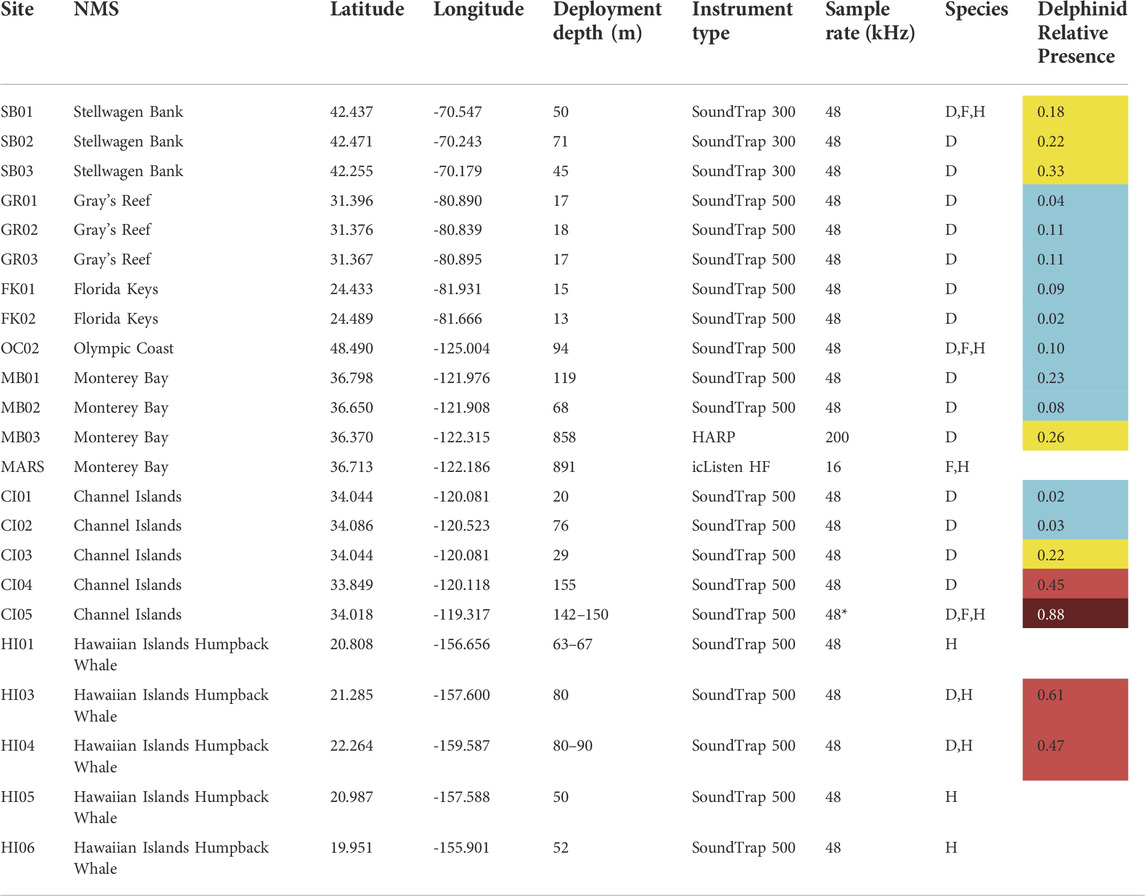
TABLE 1. Site name (Site) and the corresponding sanctuary (Sanctuary) for each instrument used in the study, along with the recording locations (Latitude and Longitude), depth of the recorder at that site (Deployment depth), the instrument type (Instrument type), sample rate (Sample rate), and what species were analyzed at that site (Species; D = delphinid, F = fin whale, H = humpback whale). All baleen whale analyses occurred from 1 November 2018 to 31 October 2020, and all delphinid analyses occurred from 1 June 2019 to 31 May 2020. If the site was used for delphinid analyses, the total hours present at a given site normalized by recording effort (Delphinid Relative Presence) is presented as a ratio from 0–1, and has been color coded based on “low” (blue), “medium” (yellow), “high” (red), and “very high” (dark red) categories. Sites that were not analyzed for delphinids are left as blank. NMS = National Marine Sanctuary. *Denotes that data collected from 1 November 2018 to 4 February 2019 were collected at a 96 kHz sampling rate.
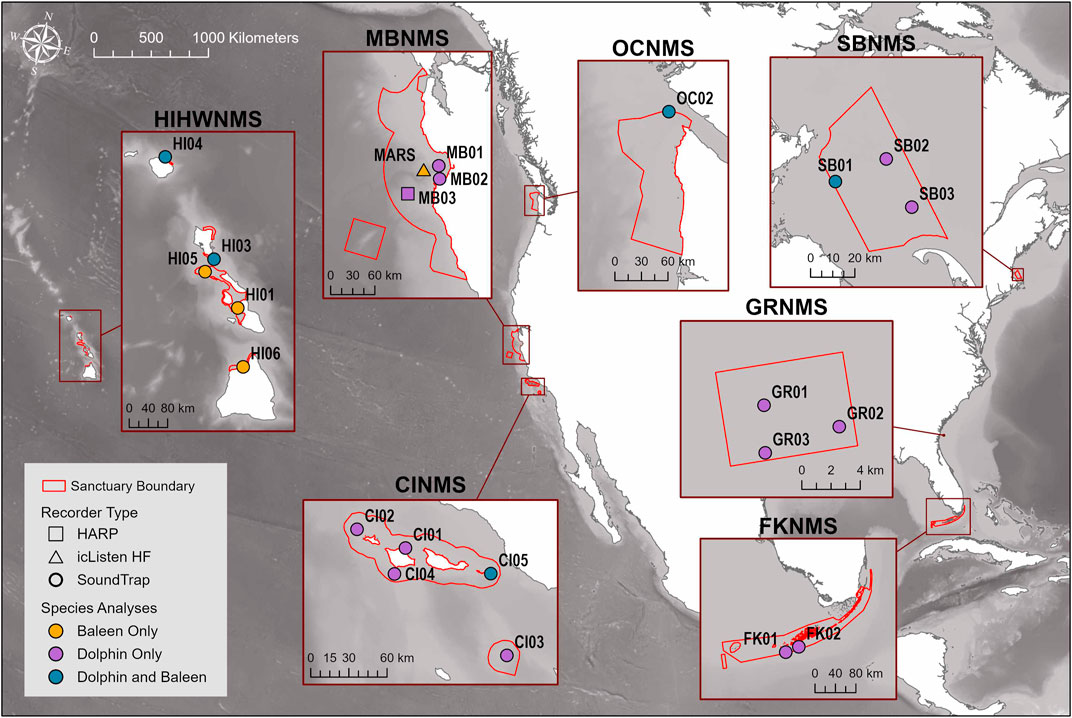
FIGURE 1. Map of the sites where passive acoustic recorders used in this study were stationed across seven NMS, divided into three main regions: East Coast Region United States (US) - Stellwagen Bank National Marine Sanctuary (SBNMS), Gray’s Reef National Marine Sanctuary (GRNMS), Florida Keys National Marine Sanctuary (FKNMS); West Coast Region US - Olympic Coast National Marine Sanctuary (OCNMS), Monterey Bay National Marine Sanctuary (MBNMS), Channel Islands National Marine Sanctuary (CINMS) and Hawaiʻi Region US - Hawaiian Islands Humpback Whale National Marine Sanctuary (HIHWNMS). Sites at each sanctuary are symbolized by both acoustic recorder instrument type and whether they were used for baleen whale and/or delphinid analyses. For the Hawaiian sites, the only baleen whale species that was analysed was humpback whale.
Detection and classification of humpback and fin whales
Baleen whale acoustic analyses were focused on the daily presence of humpback whale vocalizations (defined here as song and/or social sounds), and fin whale song. Due to the extensive propagation distances of their calls (Davis et al., 2020), only a single recording site was analyzed for each NMS, with the exception of the Hawaiʻi US region HIHWNMS where all sites were analyzed as they extended over much larger spatial scales and overlap between sites was of minimal concern (Table 1; Figure 1). There was the potential for acoustic overlap between sites HI03 and HI05 due to their relative proximity to each other (32 km), but due to data gaps, the spatial overlap was of minimal concern. Additional exceptions were in the East Coast US Region, humpback and fin whales were not examined at FKNMS and GRNMS recording sites due to their shallow coastal location, as well as fin whales for the five Hawaiʻi region recording sites. Therefore, a total of nine recording sites were analyzed for humpback whales and four recording sites were analyzed for fin whales from 1 November 2018 to 31 October 2020. Partial days due to deployment starts and ends or subsequent instrument issues were included in this analysis. A summary of the NMS included in this analysis can be found in Table 1. Each region was overseen by a separate regional research group, therefore slightly different approaches were taken for acoustic analysis due to the varying end goals of the overarching SanctSound project. However, all data output was comparable across regions at the resolution of the daily scale, as individual detections from the various detectors were reviewed in context within a longer spectrogram view.
For the East Coast region (SBNMS), analysis was conducted using a well described approach, the Low Frequency Detection and Classification System (LFDCS, Baumgartner and Mussoline, 2011), in which spectrograms were conditioned using a short-time Fourier transform. These spectrograms were overlaid with contours and matched to those stored in a user-defined call library. Contours were classified to a call type and assigned a Mahalanobis distance score. For humpback and fin whale call types, detections with a score of three or less were reviewed by an analyst (Baumgartner et al., 2013). Following the methods described in Davis et al. (2020), humpback whale song and social sounds were considered to be present if there were at least one true detection by the LFDCS amidst other humpback calls (minimum of three calls) within a 10-min period. For fin whales, a logistic regression was first applied such that only hours containing 29 or more detections were reviewed by an analyst (Davis et al., 2020). Of these hours, if at least one true detection occurred within four consecutive 20-Hz pulses, fin whales were marked as present for the hour. Only one confirmed hour per day was needed to denote fin daily presence.
For the Hawaiʻi US region HIHWNMS, and the West Coast US region MBNMS, a deep convolutional neural network (CNN) was used to detect humpback whale song (Allen et al., 2021). These were the only sanctuaries in which just humpback whale song was used to denote presence. The CNN transforms audio to spectrograms and then feeds the spectrograms into a neural network architecture originally developed for image classification. The ResNet-50 CNN, combined with per-channel energy normalization (PCEN), which reduces the amount of narrow band noise commonly attributed to vessel noise, was used to classify images in the spectrogram as either belonging to humpback whale song or not. The method examined 30 s of audio data at a time and marked in 1.1 s intervals the confidence score of signals within that time window. For HIHWNMS analyses, the mean score was calculated for each 30 s period and had to meet the threshold of 0.25 (out of 0 through 1) to be considered present for that 30 s period. One 30 s period had to meet the threshold to denote positive daily presence of humpback whales. For MBNMS analyses, manual examination revealed that during some periods of the year, sounds from gray whales and dolphins could result in moderately elevated scores (∼0.3–0.6); therefore a minimum threshold score of 0.7 was used throughout the time-series. For the full 2-year analysis period, model scores were plotted above manually examined spectrograms 1 hour at a time, and any manually confirmed detection of humpback song within a day resulted in definition of acoustic presence for that day.
For the West Coast US region sites (including the MARS site for fin whales), daily presence was processed manually by reviewing Long-Term Spectral Averages (LTSAs) which were computed and reviewed using Triton (version 1.93.20160524, Wiggins et al., 2010). Acoustic data were decimated to 4 kHz for humpbacks, and 2 kHz for fin whales prior to computing the LTSA. LTSAs for both species had an averaging of 1 Hz/5 s bins and were reviewed for the presence of humpback vocalizations and fin whale 20-Hz pulses using 1 h time windows. For humpbacks, frequencies between 0–2 kHz were scanned and signals were reviewed both visually and aurally to confirm presence. For fin whales, hourly median octave band sound pressure levels were calculated from pressure spectral density levels that were generated using a 1 Hz/1 s resolution. Hourly background noise levels in the 31.5 Hz octave band had to be less than 95 dB re 1 µPa to reliably see fin whale downsweeps and thus be examined for fin whale presence. Hours below that threshold were then scanned from 0–250 Hz and at least one pulse within an hour would lead to positive hourly presence. One hour of presence was needed to denote positive daily presence.
Detection and classification of delphinids
As each NMS hosts different members of the Delphinidae family and whistle classification remains challenging for many species, they were not classified to species level and were denoted simply as delphinid presence. Whistles were examined across 19 sites throughout all seven NMS within each of the three regions from 1 June 2019 to 31 May 2020 (see Table 1 for sites used in this analysis). All acoustic data were run through a Fast Fourier Transform (FFT) of 1,024 points with a hop size of 512 points within the PAMGuard 2.01.03 software (Gillespie et al., 2008). A simple whistle and moan detector (WMD) within PAMGuard was used to detect delphinid whistles. Since a range of delphinid species can occur within each NMS, the frequency that was examined for whistle presence was adjusted according to the expected species’ frequency ranges for each NMS. In the East Coast US region, Atlantic white-sided dolphins (Lagenorhynchus acutus) and pilot whales (Globicephala sp.) frequent SBNMS, thus the WMD was set to search for whistles from 1.5 to 22 kHz (e.g. Taruski, 1979; Steiner, 1981). At GRNMS and FKNMS the primary species expected is the bottlenose dolphin (Tursiops truncatus), but other species such as the Atlantic spotted dolphin (Stenella frontalis) can also be present, thus the frequency range was set to 4–18 kHz (e.g., Baron et al., 2008). In the West Coast US region, at OCNMS, MBNMS, and CINMS, Risso’s dolphins (Grampus griseus), Pacific white-sided dolphins (Lagenorhynchus obliquidens), and bottlenose dolphins are expected, thus the frequency range was set from 4 to 20 kHz (e.g. Corkeron and Van Parijs, 2001). In the Hawaiʻi US region, at HIHWNMS, members of the “blackfish” family such as pilot whales and false killer whales (Pseudorca crassidens), as well as bottlenose dolphins, pantropical spotted dolphins (Stenella attenuata), and spinner dolphins (Stenella longirostris) are expected (e.g., Lammers et al., 2003). Due to intensity and pervasive occurrence of humpback whale song in the Hawaiʻi US region, which extended into the delphinid frequency range, the WMD search range was restricted from 8 to 20 kHz to reduce the amount of false positives in the lower frequency ranges. This meant that the presence of the blackfish species was not fully represented in the analysis for HIHWNMS.
All individual detections of delphinid whistles were aggregated by hour and tabulated using the custom written graphical user interface (GUI) Marina3 within the Matlab software. This aggregated data was used to identify the hours to manually review in PAMGuard Viewer 2.01.03. Hours were viewed with a 20 s page window from 0–24 kHz with the detection contours visible. To be considered as containing delphinids, there had to be one or more confirmed detection of whistles within the hour.
Assessing temporal trends
All subsequent analyses were done using the statistical software R (version 4.1.2, R Development Core Team 2016). The data were compiled for each species using the tidyverse and lubridate packages and visualized using ggplot2. For baleen whales, fin whale song and humpback whale vocalization presence was aggregated into the number of days per week containing positive detection days normalized for the number of recording days. For delphinids, acoustic data were aggregated as hourly whistle presence. The amount of continuous time delphinid whistles were present, ‘delphinid occupancy of a recording site’, was evaluated for each NMS. A threshold of a minimum of 6 h (25% of the day) within 24 h was set as necessary for delphinid occupancy being ‘present’. These days were then tallied to determine the number of consecutive days of delphinid presence. In addition, each hour was assigned as either day or night based on sunrise and sunset times for each site’s coordinates using the suncalc package. To test for any diel patterns, a two-tailed proportional z-test was conducted at each site. Day presence (or night) was converted as a proportion of the number of true positive hours per month over the total effort per month at each site.
Results
Humpback whale vocalization presence and fin song presence
Humpback whale vocalizations were present at all seven NMS that were analyzed. In HIHWNMS, five recording sites (HI01–HI05) were restricted to record only during the humpback whale breeding season, and those sites show humpback daily presence near 100% (Figure 2A). Site HI06 covered an extended recording period that captured the end of the breeding season, likely contributing to the lower daily presence of humpback whales at that site (N = 140 days, 65.4%). For the remaining NMS, the fewest relative days of humpback whale vocalizations occurred in CINMS (52.1%, N = 232 days) and the greatest was OCNMS site OC02 (85.4%, N = 205 days) followed by MARS (82.8%, N = 586 days). SBNMS had relatively low humpback whale vocalization presence at 55.6% (N = 400 days). At SBNMS, humpback whale vocalizations were present year-round with highest presence from mid-November 2018 through mid-January 2019, March through April 2019 October 2019 through the beginning of January 2020, mid-March through mid-June 2020, and mid-July through the end of October 2020. (Figure 2A). At MBNMS humpback whale vocalizations were present for most of the study period, with an absence from late May through mid-August 2019. A similar pattern occurred in 2020, however there were multiple days with humpback acoustic presence during this time period. At CINMS, humpback whale vocalizations were present whenever there were recordings, with fewer detections from April through September 2019. Even though the HIHWNMS sites recorded only during the breeding season, sites HI04 and HI06 had relatively few days of median consecutive presence (6 days and 2 days respectively). HI01 and HI05 had 100% consecutive days of humpback whale vocalization presence. Across all other sanctuaries, MBNMS had the highest median number of consecutive days with humpback whale vocalizations present (N = 5 days) and the others had medians of 1 (CINMS) or 2Vdays (OCNMS and SBNMS). (Figure 3A).
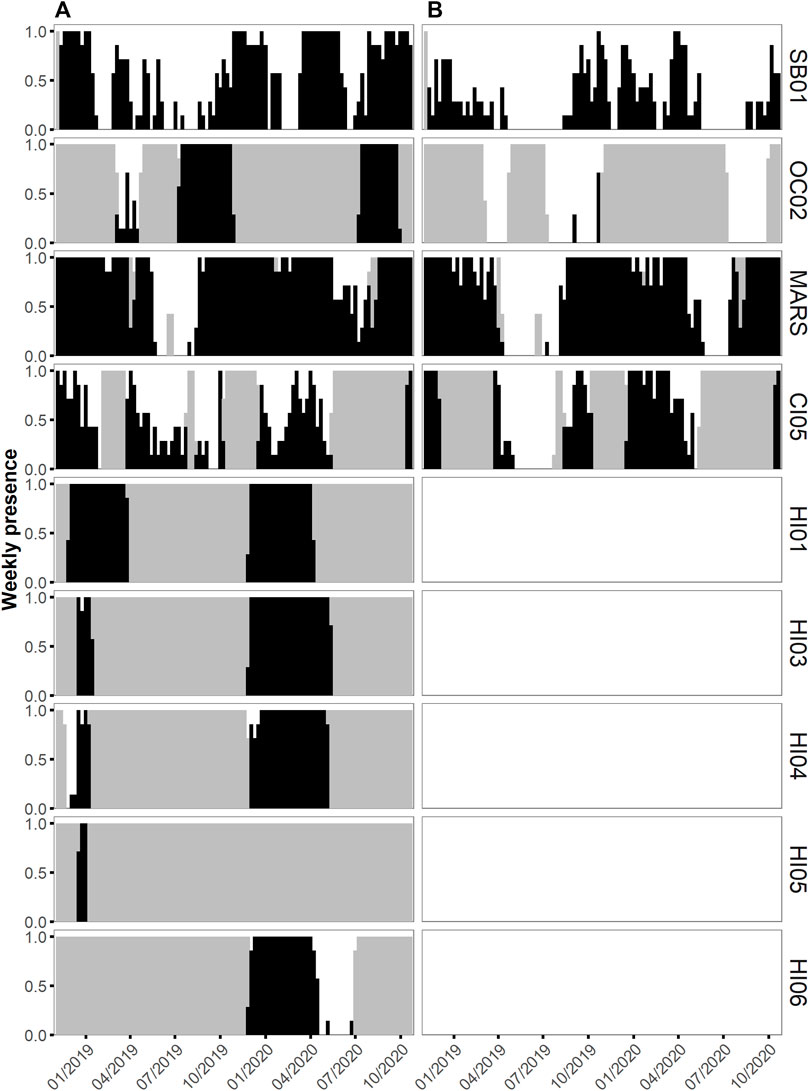
FIGURE 2. Weekly acoustic presence between 1 November 2018 to 31 October 2020 of humpback whale vocalizations (A) and fin whale 20 Hz pulses (B) as a ratio from 0 to 1 per chosen recording site within each National Marine Sanctuary within the East Coast US region (Stellwagen Bank NMS, site SB01), the West Coast US region (Olympic Coast NMS, site OC02; Monterey Bay NMS, site MARS; Channel Islands NMS, site CI05) and the Hawaiʻi US region (Hawaiian Islands Humpback Whale NMS, sites HI01, HI03, HI04, HI05 and HI06). Presence is denoted by black bars and days without data by grey bars. Fin whales were not analyzed at the Hawaiian sites.
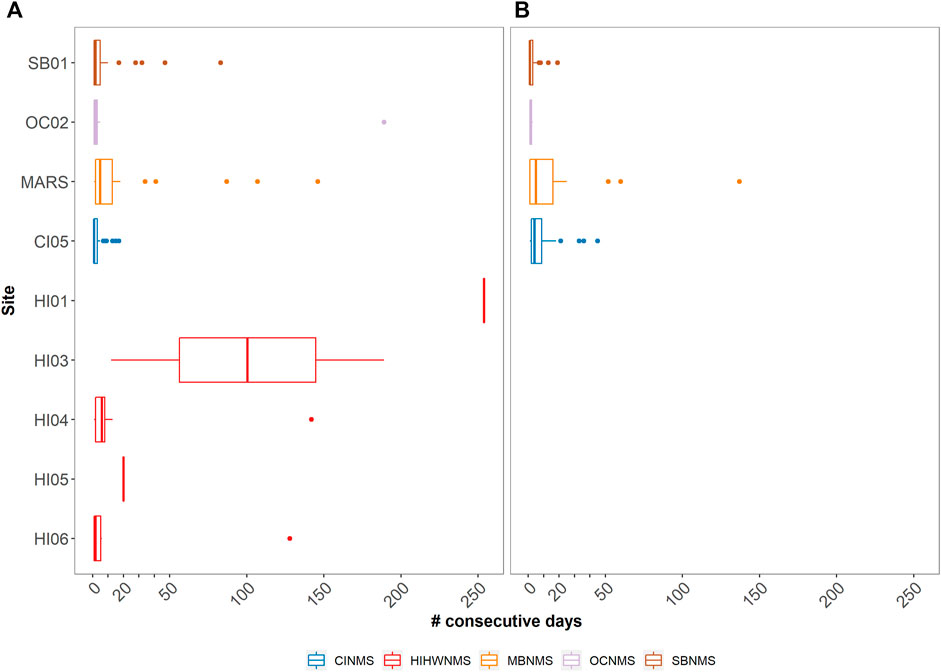
FIGURE 3. Boxplots showing the median and quartile values of acoustic presence as the number of consecutive days they were detected in each of the five sanctuaries analyzed (Stellwagen Bank NMS [SBNMS] = SB01, Olympic Coast NMS [OCNMS] = OC02, Monterey Bay NMS [MBNMS] = MARS, Channel Islands NMS [CINMS] = CI05, Hawaiian Islands Humpback Whale NMS [HIHWNMS] = HI01, HI03, HI04, HI05, HI06) for humpback (A) and fin whale (B) species.
Fin whale 20 Hz pulses were present at each of the four analyzed NMS; the East Coast US region SBNMS and West Coast US regions, CINMS, MBNMS and OCNMS (Figure 2B). When accounting for recording effort, the West Coast US Region showed both the least acoustic daily presence at OCNMS (OC02 2.9%, N = 7 days) and most acoustic daily presence at MBNMS (MARS 70.6%, N = 500 days), with 58.3% (N = 225 days) for CINMS (CI05) and 29.7% (N = 214 days) for East Coast US region SBNMS (SB01). Fin whale 20 Hz pulses were present between September and June in both years for all NMS with data gaps hampering a thorough seasonal understanding at OCNMS and CINMS recording sites (Figure 2B). When comparing MBNMS and SBNMS, fin whale 20 Hz pulses were present more consecutively at the former (median of five consecutive days, maximum of 137 days) than the latter (median of one consecutive day, maximum of 19 days). (Figure 3B).
Delphinid presence
Considering recording effort, the hours with most delphinid whistles present occurred at the West Coast US region, CINMS site CI05 (88.3%, N = 5,546 h) and the least at the East Coast US region, FKNMS site FK02 (1.7%, N = 76 h) (Figure 4). When viewing all sites relative to each other it is apparent that CI05 is an outlier with “very high” levels of delphinid acoustic presence. Other sites had levels of “high” delphinid acoustic presence ranging from 45–65%, “medium” levels from 18–34%, and “low” levels from 1–11% (Table 1). In general, HIHWNMS had high levels of delphinid presence, SBNMS and MBNMS medium levels, and GRNMS, FKNMS, and OCNMS low levels. Sites at CINMS were interesting in that they ranged from very high to low in terms of delphinid acoustic presence across the five sites (Figure 5). Sanctuaries such as GRNMS had more delphinid acoustic presence at the southern edge of the sanctuary, MBNMS had more detections offshore (MB03) and at the northern inshore site (MB01), and FKNMS had slightly more delphinid detections to the west (Figure 5). The other sanctuaries either had one site analyzed thus nothing could be said about the spatial distribution (OCNMS), or had similar levels of delphinid presence across all sites (SBNMS, HIHWNMS).
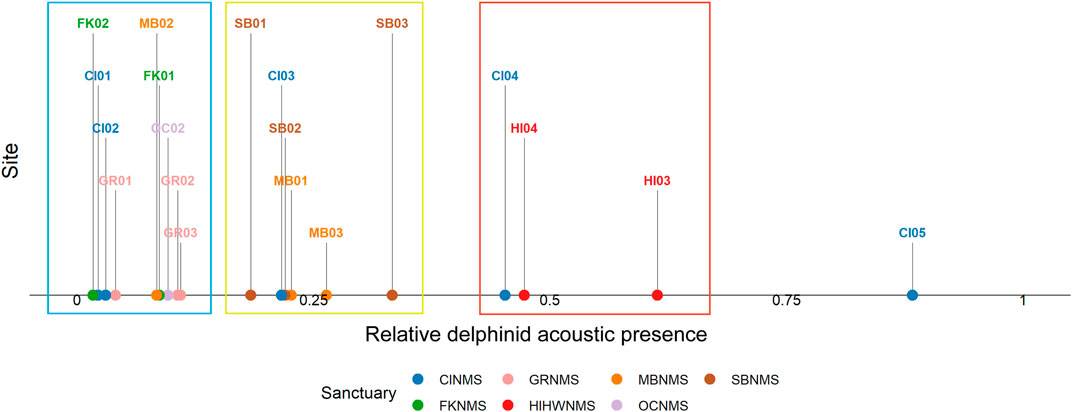
FIGURE 4. The ratio of hourly delphinid whistle presence normalized by recording effort (0–1) from 1 June 2019 to 31 May 2020 at each passive acoustic recording site across seven NMS, divided into three main regions: East Coast Region United States (US)—Stellwagen Bank National Marine Sanctuary (SBNMS), Gray’s Reef National Marine Sanctuary (GRNMS), Florida Keys National Marine Sanctuary (FKNMS); West Coast Region US - Olympic Coast National Marine Sanctuary (OCNMS), Monterey Bay National Marine Sanctuary (MBNMS), Channel Islands National Marine Sanctuary (CINMS) and Hawaiʻi Region US - Hawaiian Islands Humpback Whale National Marine Sanctuary (HIHWNMS). The sites with low ratios of delphinid acoustic presence are highlighted within the blue box, medium ratios within a yellow box, and high ratios in a red box. CI05 was an outlier compared to the other sites with a very high ratio of delphinid acoustic presence.
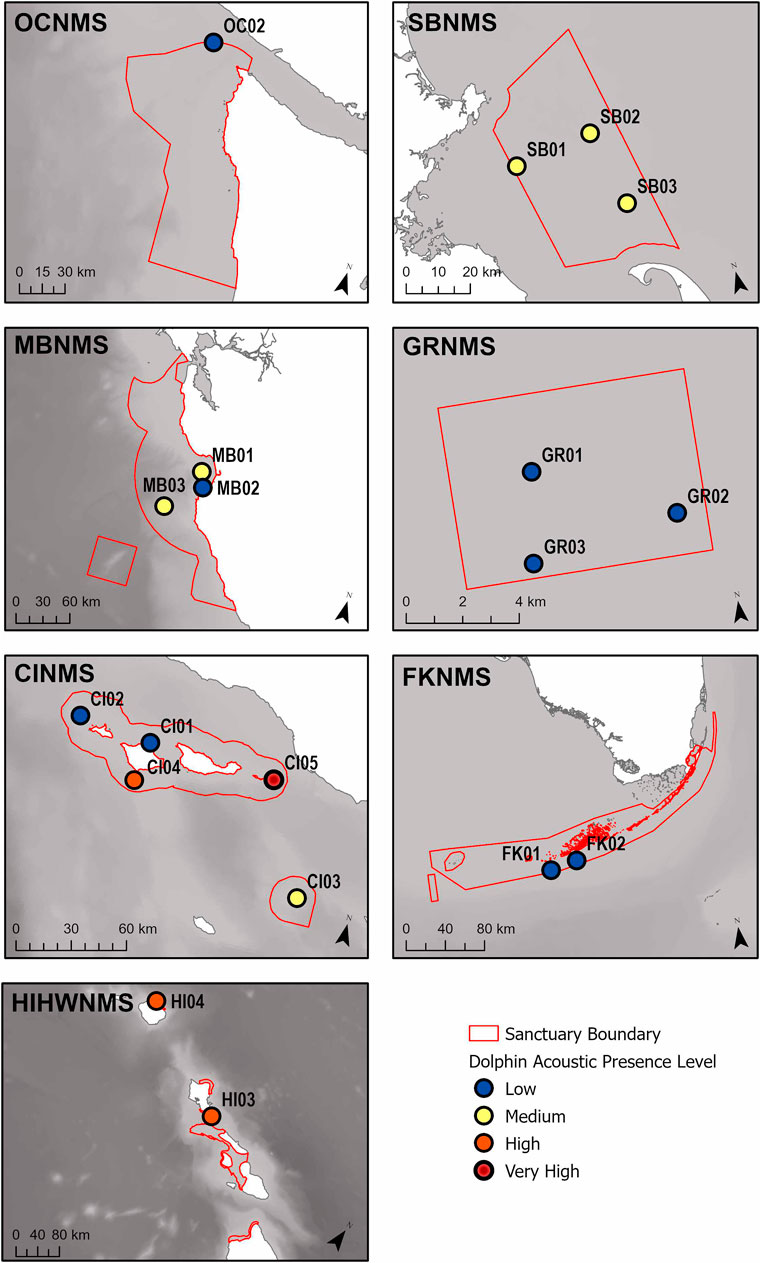
FIGURE 5. A map of the relative percent delphinid acoustic presence classified into four levels (low, medium, high, very high), for each recording site within each sanctuary. The sanctuaries represented are the Hawaiian Islands Humpback Whale National Marine Sanctuary (HIHWNMS), Olympic Coast National Marine Sanctuary (OCNMS), Monterey Bay National Marine Sanctuary (MBNMS), Channel Islands National Marine Sanctuary (CINMS), Stellwagen Bank National Marine Sanctuary (SBNMS), Gray’s Reef National Marine Sanctuary (GRNMS), and the Florida Keys National Marine Sanctuary (FKNMS), and are outlined in red.
In the West Coast US region, there was not enough data collected at OCNMS to analyze monthly patterns in delphinid acoustic presence (Figure 6). There were potentially inverse monthly patterns to delphinid acoustic presence within MBNMS at MB01 and MB03, with more hours containing delphinid detections in January through March and October through December at MB01 whereas at MB03 the months with the greater presence were from May through September. There is uncertainty in monthly delphinid acoustic presence for February and March at MB03 due to a data gap. MB02 did not have sufficient sampling between months to note any patterns. In CINMS, data gaps inhibited examining patterns at CI01- 03. CI04 had more delphinid acoustic hours present in months June through September, and CI05 had variable levels of monthly acoustic presence with no clear pattern. For the East Coast US region SBNMS had clear monthly patterns at all three sites, with months March through May containing the most hours of delphinid acoustic presence. At SB03 there was a secondary peak in activity from August through November that was less present at SB01 and SB02. In GRNMS it appeared that delphinids were acoustically present at low levels in all of the months, though data gaps inhibited further interpretation. No monthly patterns could be assessed at FKNMS due to the paucity of data. Monthly presence in the Hawaiʻi US region could not be assessed due to the sampling effort.
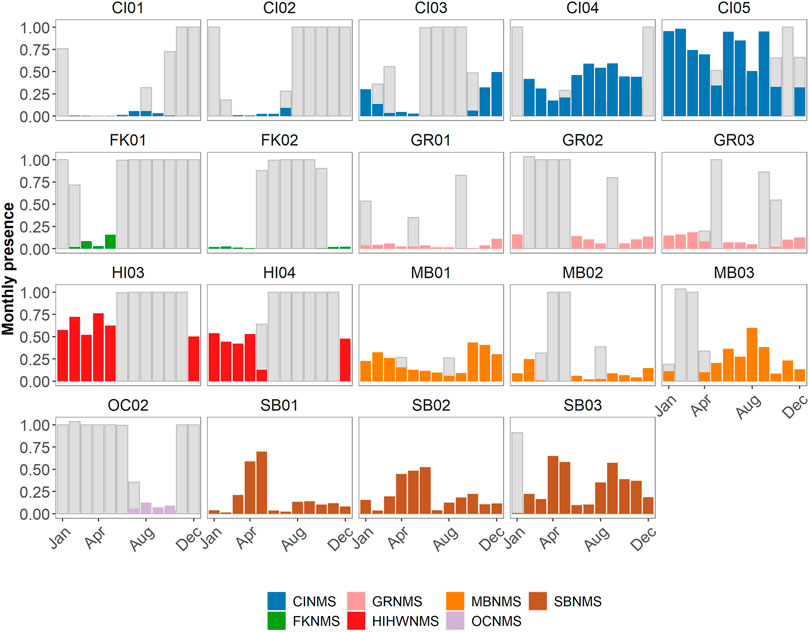
FIGURE 6. Monthly presence of delphinids at each site within a sanctuary expressed as a ratio (0–1) where the number of hours of positive presence are normalized by the number of hours in a month. These are then color coded by sanctuary (CINMS = Channel Islands National Marine Sanctuary, FKNMS = Florida Keys National Marine Sanctuary, GRNMS = Gray’s Reef National Marine Sanctuary, HIHWNMS = Hawaiian Islands Humpback Whale National Marine Sanctuary, MBNMS = Monterey Bay National Marine Sanctuary, OCNMS = Olympic Coast National Marine Sanctuary, SBNMS = Stellwagen Bank National Marine Sanctuary). The number of hours per month without data collection at each site are also normalized by the number of hours in a month and are represented as grey bars.
Delphinid acoustic occupancy at most sites contained median values between 1 and 3 days with only three sites containing median values greater than 3 days (HI04 median = 5 days, HI03 median = 17 days, CI05 median = 58 days) (Figure 7). West Coast US region sites CI01, CI02, MB02, OC02, and East Coast US region sites FK01, GR01, GR02, GR03 all exhibited brief occupancy, with delphinids being detected a maximum of five consecutive days or less at each given site (median values for all of these sites was 1 day). FK02 had no sequential days of delphinid acoustic presence. Similarly, these are also the sites classified as containing low levels of delphinid presence (Figure 4). Sites with medium levels of delphinid acoustic presence (SB01- 03, CI03, MB01, MB03) also contained low median number of consecutive days present (1–2 days), but had variable maximum number of consecutive days present (ranging from 14 to 32 days).
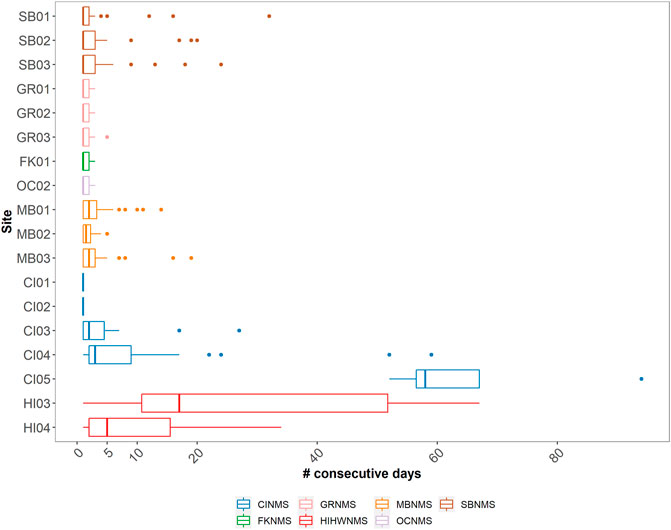
FIGURE 7. A boxplot showing the median and quartile values of the number of consecutive days delphinid whistles were present across 18 passive acoustic recording sites within seven NMS, divided into three main regions: East Coast Region United States (US) - Stellwagen Bank National Marine Sanctuary (SBNMS), Gray’s Reef National Marine Sanctuary (GRNMS), Florida Keys National Marine Sanctuary (FKNMS); West Coast Region US - Olympic Coast National Marine Sanctuary (OCNMS), Monterey Bay National Marine Sanctuary (MBNMS), Channel Islands National Marine Sanctuary (CINMS) and Hawaiʻi Region US - Hawaiian Islands Humpback Whale National Marine Sanctuary (HIHWNMS). FK02 is not shown as there were no consecutive days of delphinid acoustic presence at that site.
Sites exhibited different numbers of months of diel significance at p < 0.05 level (Figure 8). MB01 was the only site at which every month had a significant difference in the proportion of detected night versus day hours. Sites SB02, SB03, FK01, OC02, MB01, MB03, and CI03-CI05 all had >50% of months with significant diel differences (when considering recording effort). Sites GR01-GR03, MB02, CI01, HI03, and HI04 had <50% of months with significant diel differences (when considering recording effort). Sites CI02 and FK02 had no significant diel differences. There was no relationship between sites of low, medium, and high levels of relative delphinid acoustic presence (Figures 4, 5) and the number of months of significant diel differences (Figure 8).
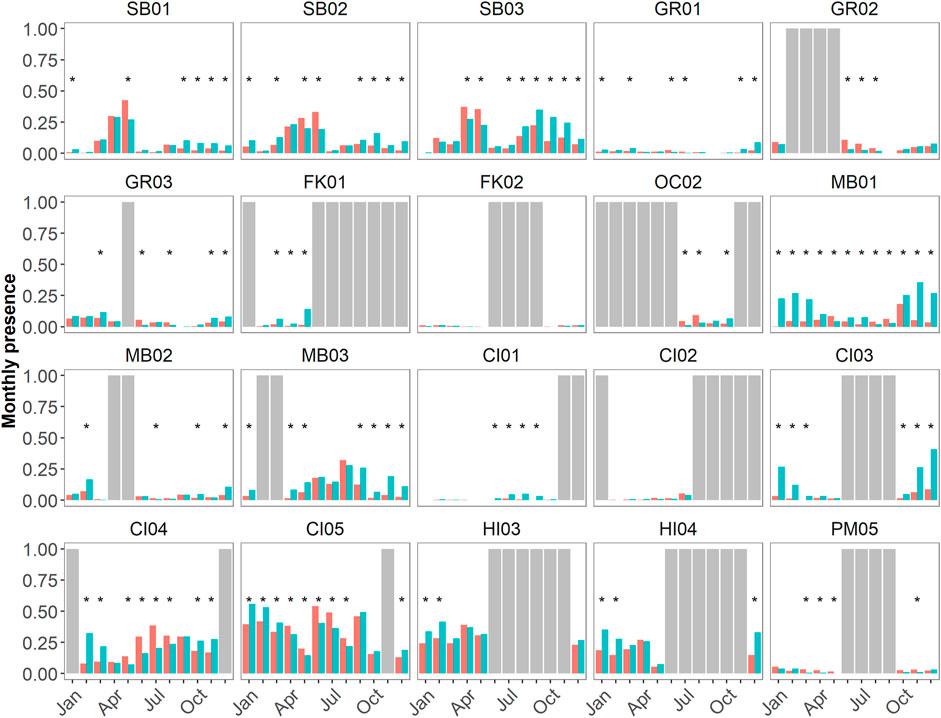
FIGURE 8. Diel proportional presence (as a ratio from 0–1) of hourly delphinid whistle presence from 1 June 2019 to 31 May 2020 across 19 passive acoustic recording sites within seven NMS, divided into three main regions: East Coast Region United States (US)—Stellwagen Bank National Marine Sanctuary (SBNMS), Gray's Reef National Marine Sanctuary (GRNMS), Florida Keys National Marine Sanctuary (FKNMS); West Coast Region US—Olympic Coast National Marine Sanctuary (OCNMS), Monterey Bay National Marine Sanctuary (MBNMS), Channel Islands National Marine Sanctuary (CINMS) and Hawaiʻi Region US—Hawaiian Islands Humpback Whale National Marine Sanctuary (HIHWNMS). The red bars represent daylight hours and teal bars represent night time hours (all hours are in UTC). Months in which a t-test for proportions revealed significant differences at p < 0.05 have an asterisk above the bars (*). Complete months in which no data was collected are shown as gray bars, partial months were included in this analysis.
Discussion
This study demonstrates that marine mammals were acoustically active within all the NMS analyzed in this study, being visited on a regular basis by all targeted species. Humpback and fin whales exhibited both seasonal and year round acoustic presence with variations in occupancy among NMS. Both Monterey Bay and Stellwagen Bank NMS showed the most prolific year-round acoustic presence based upon the data available in this study. Both of these NMS have previously been demonstrated to be key areas for these species not just during the migration period, but also throughout the rest of the year (e.g. Vu et al., 2012; Širović et al., 2017; Ryan et al., 2019; Davis et al., 2020). Previous studies using passive acoustic data from the western North Atlantic have shown that humpback whales are present year-round in the Gulf of Maine (Vu et al., 2012; Murray et al., 2014; Davis et al., 2020), and in winter months off the Scotian Shelf (Kowarski et al., 2018; Davis et al., 2020). This study shows that humpback whales are acoustically present year-round at SBNMS like what was previously found in Davis et al. (2020). In the Pacific, no clear migratory patterns were visible for the North Pacific humpback whale, lending support to previous findings that their migration is complex and consists of different stocks that may have individuals traveling to the same feeding grounds as those from other stocks (e.g., Baker et al., 1990; Baker et al., 1998; Calambokidis et al., 2001; Lagerquist et al., 2008). Fin whales showed similar acoustic seasonality as found in Oleson et al. (2014) in the Pacific, and Davis et al. (2020) in the Atlantic, with song present from September through June in both years. In the Pacific, MBNMS had a longer median consecutive number of days with fin whale song present than SBNMS in the Atlantic. This is probably more a function of hydrophone depth and location rather than actual presence; the MARS mooring in MBNMS was located in deeper water (891 m) than the SoundTrap in SBNMS (50 m) and thus more likely to have a larger detection range and situated more in preferred, deep water fin whale habitat (Rice et al., 2021).
From examining the occupancy of detected days with vocalizations emitted by humpback whales at the various sanctuaries, HIHWNMS had around 3 months of continuous acoustic daily presence at select sites, while the other NMS had less and more variable presence. The Hawaiian Islands are a known breeding ground for the North Pacific humpback whale (e.g., Norris, 1966; Calambokidis et al., 2001), and their consistent daily presence of vocalizations from December through April across all HIHWNMS sites clearly presents the importance of that sanctuary for breeding humpback whales.
Delphinids were acoustically present across all NMS for widely varying amounts of time. CINMS was the sanctuary that demonstrated the largest variability of delphinid acoustic activity ranging from very high to low across its five sites. The inshore and southwestern sites (CI03, 04 and 05) had the highest activity as compared to the northern sites (CI01 and 02). CI05 had the longest median occupancy in the entire study (58 days). HIHWNMS was another sanctuary with high delphinid whistling activity, with HI03 off of Oahu recording more hours of whistle presence than HI04 off of Kauai. These two sites also had the second (n = 17, HI03) and third (n = 5, HI04) longest median consecutive days of presence in the study, and are known to host resident populations of Hawaiian spinner dolphins and false killer whales (Lammers, 2004; Baird, 2013; Baird et al., 2013). As we did not attempt to differentiate between delphinid species, it is unclear whether these results are from a single species using an area, or multiple. Advancements in machine learning may help to differentiate between species in the future (e.g., Rankin et al., 2017; Frasier, 2021), but regardless, these two NMS are important areas for delphinids.
NMS with medium levels of delphinid whistle activity occurred at SBNMS and MBNMS. The southern site at SBNMS (SB03) had more hours of whistle presence than the other two sites further north and inshore. SB03 is in an area known as a biological feeding hotspot of activity for marine mammals and is frequently visited by whale watching vessels (e.g., Silva et al., 2019a). The acoustic seasonality of delphinids also aligned with what is known for this sanctuary, with more presence during the spring and fall months (Silva et al., 2019a; Silva et al., 2019b), and the continuous occurrence in this sanctuary was highly variable (ranging from 1 to 32 days), showcasing different usages of the sanctuary. MBNMS had more acoustic activity at sites MB01 (inshore) and MB03 (offshore) and the monthly presence at these two sites were inversely related. This could represent inshore/offshore movement of the delphinids within the sanctuary, or arrival and usage of the sanctuary by an offshore population of delphinids at MB03. Delphinid occupancy was also highly variable in this sanctuary, with 19 maximum consecutive days at MB03, also suggesting variable usage of the sanctuary.
OCNMS, FKNMS, and GRNMS all had relatively low levels of delphinid acoustic presence. However, little data was able to be collected at OCNMS, thus year-round acoustic presence of delphinids at this sanctuary could not be assessed accurately. The low relative score and low occupancy for delphinids in OCNMS aligns with previous work suggesting they are “accidental” occurrences and uncommon (Fangman and Roletto, 2001); however, more recordings are needed to completely support this. Little to nothing is known about delphinid presence at GRNMS and FKNMS. GRNMS is a sanctuary for the conservation of its “live bottom reef” hosting many invertebrate and fish species, and some studies have taken place examining North Atlantic right (Eubalaena glacialis) whale use of the sanctuary, but no studies have been conducted for delphinids (Fangman and Roletto, 2001). This study presents the first look at delphinid acoustic presence within GRNMS, and while delphinid activity was low, they were present year-round. The low amount of consecutive days present suggests that delphinids transit through this sanctuary. Delphinid acoustic presence occurred more at the southern sites in GRNMS (GR02 and GR03), which are stationed within a designated research area where no fishing or other activities are allowed. Little is known about the presence of delphinids along the Atlantic side of the FKNMS. McClellan et al. (2000) conducted opportunistic visual sightings for bottlenose dolphins within Florida Bay as well as along the oceanic side of the Florida Keys in the 1990s. They found no evidence for seasonal presence, and that more bottlenose dolphins occurred on the Atlantic side and in larger group numbers than within Florida Bay. We could not present results on the seasonality of dolphins at FKNMS due to data gaps, however the hourly acoustic presence presented here provides a recent account of delphinid presence. Delphinids did not occupy FK01 and FK02 for long and like GRNMS, suggest that during the recording period, this area of the sanctuary was used as a pathway to transit to other areas. Site selection in FKNMS was based on the conservation needs of groupers and coral and not necessarily delphinids. While FKNMS had a low delphinid acoustic presence score, this is more likely explained by hydrophone placement and is not necessarily indicative of sanctuary-wide use of delphinids.
Delphinid whistles did exhibit significant differences in diel presence at the various sanctuaries, with multiple months having significant differences between the proportion of night and day time hours with whistles present. The site with the greatest number of significant months was MB01 (all months), a site with medium level of delphinid acoustic presence, and the least was at HI03 (two out of 6 months), a site designated as having a high level of delphinid acoustic presence. In general, no relationship was found between the relative acoustic presence of delphinids and diel significance. This is most likely due to the analysis design. Neither whistle type nor quantity per hour were analyzed, which would help in distinguishing between behavioral states. Different species of delphinids may have different diel patterns and sanctuary usage and further analyses could explore that in the future (e.g., Hawaiian spinner dolphins and Pacific white-sided dolphins, Henderson et al., 2011; Heenehan et al., 2016).
The SanctSound project is unique in that it aimed to set standardized methodologies across species, sites, and sound metrics within the NMS network. This effort in standardization lends itself well in drawing broad scale patterns in marine mammal presence, as highlighted by the baleen whale species and delphinids examined in this study. Finer scale analyses will require further standardization of the baleen whale data. Sanctuaries are designated to conserve marine protected resources, and by standardizing analysis efforts, the presence of marine mammals within sanctuaries can be better cross-compared with recording sites outside of sanctuaries to provide relative presence metrics like those shown in Figure 4, which provide an easy to interpret visualization of site importance. Additionally, with the completion of the SanctSound project, future research using the full dataset can examine the relationships between marine mammal species (like in Davis et al., 2020), and can compare marine mammal presence with other marine species, and anthropogenic sources such as vessels, seal bombs, and echosounders. Using these data to develop standardized relative abundance estimates will require taking into account the listening range of each recorder within each species’ frequency band, and the background noise levels at each site. Both of these were also estimated as part of the SanctSound project. Combining all these analyses lends towards a holistic view of sanctuary usage across multiple years and large spatial scales. Comparable indicators provide a means to compare results across even larger scales and time periods, providing better understanding of the role that protected areas can play in managing wide-ranging populations.
Data availability statement
The datasets presented in this study can be found in online, publicly accessible repositories. The names of the repository/repositories can be found below: The marine mammal detection datasets analyzed for this study can be found in the SanctSound Data Portal https://sanctsound.portal.axds.co/ and the raw acoustic recording data can be found on NOAA’s National Centers for Environmental Information (NCEI) website https://doi.org/10.25921/saca-sp25. Passive acoustic monitoring data from the MARS cabled observatory are publicly available through AWS Open Data: https://registry.opendata.aws/pacific-sound/.
Author contributions
SVP, LH, and AID conceived the study. AID and SVP wrote the manuscript, AID and GED created figures. AID, JB, KB, GED, ACMK, ACMK, TM, NP, AR, JR, AS, and EZ analyzed the acoustic data, AID. conducted all subsequent analysis of the data. SVP, SB-P, JJ, and ML. oversaw acoustic analyses. TJR, JJ, ML, and EZ oversaw the field collection. All authors contributed to manuscript revision, read, and approved the submitted version.
Funding
This work was completed as part of the SanctSound project, which was a collaboration between NOAA and the U.S. Navy to better understand underwater sound within the National Marine Sanctuary System. The NSF funded installation and maintenance of the MARS cabled observatory through awards 0739828 and 1114794; JR was supported by the David and Lucile Packard Foundation through the Monterey Bay Aquarium Research Institute.
Acknowledgments
We would like to thank all personnel who worked to maintain recording instruments at each of the national marine sanctuaries. Thank you to Carrie Wall Bell and her team at NOAA’s National Centers for Environmental Information (NCEI) for the curation of the raw acoustic data from the SanctSound project and making these data publicly accessible.
Conflict of interest
The authors declare that the research was conducted in the absence of any commercial or financial relationships that could be construed as a potential conflict of interest.
Publisher’s note
All claims expressed in this article are solely those of the authors and do not necessarily represent those of their affiliated organizations, or those of the publisher, the editors and the reviewers. Any product that may be evaluated in this article, or claim that may be made by its manufacturer, is not guaranteed or endorsed by the publisher.
Footnotes
1https://sanctuaries.noaa.gov/science/monitoring/sound/
2https://sanctuaries.noaa.gov/
3https://github.com/NEFSC/READ-PSB-Marina
References
Acevedo-Gutiérrez, A., and Stienessen, S. C. (2004). Bottlenose dolphins (<I>Tursiops truncatus</I>) increase number of whistles when feeding. Aquat. Mamm. 30, 357–362. doi:10.1578/am.30.3.2004.357
Allen, A. N., Harvey, M., Harrell, L., Jansen, A., Merkens, K. P., Wall, C. C., et al. (2021). A convolutional neural network for automated detection of humpback whale song in a diverse, long-term passive acoustic dataset. Front. Mar. Sci. 8, 165. doi:10.3389/fmars.2021.607321
Archer, F. I., Rankin, S., Stafford, K. M., Castellote, M., and Delarue, J. (2020). Quantifying spatial and temporal variation of North Pacific fin whale (Balaenoptera physalus) acoustic behavior. Mar. Mam. Sci. 36, 224–245. doi:10.1111/mms.12640
Au, W. W., Floyd, R. W., Penner, R. H., and Murchison, A. E. (1974). Measurement of echolocation signals of the Atlantic bottlenose dolphin, Tursiops truncatus Montagu, in open waters. J. Acoust. Soc. Am. 56, 1280–1290. doi:10.1121/1.1903419
Au, W. W. L., Penner, R. H., and Kadane, J. (1982). Acoustic behavior of echolocating atlantic bottlenose dolphins. J. Acoust. Soc. Am. 71, 1269–1275. doi:10.1121/1.387733
Baird, R. (2013). Odontocete cetaceans around the main Hawaiian Islands: Habitat use and relative abundance from small-boat sighting surveys. Aquat. Mamm. 39, 253–269. doi:10.1578/AM.39.3.2013.253
Baird, R. W., Webster, D. L., Mahaffy, S. D., Schorr, G. S., Aschettino, J. M., and Gorgone, A. M. (2013). Movements and spatial use of odontocetes in the western main Hawaiian Islands: Results of a three- year study off O'ahu and kaua'i. WA: Olympia.
Baker, C. S., Herman, L. M., Perry, A., Lawton, W. S., Straley, J. M., Wolman, A. A., et al. (1986). Migratory movement and population structure of humpback whales (Megaptera novaeanglieae) in the central and eastern North Pacific. Mar. Ecol. Prog. Ser. 31, 105–119. doi:10.3354/meps031105
Baker, C. S., Medrano-Gonzalez, L., Calambokidis, J., Perry, A., Pichler, F., Rosenbaum, H., et al. (1998). Population structure of nuclear and mitochondrial DNA variation among humpback whales in the North Pacific. Mol. Ecol. 7, 695–707. doi:10.1046/j.1365-294x.1998.00384.x
Baker, C. S., Palumbi, S. R., Lambertsen, R. H., Weinrich, M. T., Calambokidis, J., and O'brien, S. J. (1990). Influence of seasonal migration on geographic distribution of mitochondrial DNA haplotypes in humpback whales. Nature 344, 238–240. doi:10.1038/344238a0
Bannister, J. L. (2009). “Baleen whales (mysticetes),” in Encyclopedia of marine mammals (London, United Kingdom: Elsevier).
Baron, S. C., Martinez, A., Garrison, L. P., and Keith, E. O. (2008). Differences in acoustic signals from delphinids in the Western North Atlantic and northern Gulf of Mexico. Mar. Mammal. Sci. 24, 42–56. doi:10.1111/j.1748-7692.2007.00168.x
Baumann-Pickering, S., Trickey, J. S., Wiggins, S. M., and Oleson, E. M. (2016). Odontocete occurrence in relation to changes in oceanography at a remote equatorial Pacific seamount. Mar. Mam. Sci. 32, 805–825. doi:10.1111/mms.12299
Baumgartner, M. F., Fratantoni, D. M., Hurst, T. P., Brown, M. W., Cole, T. V. N., Van Parijs, S. M., et al. (2013). Real-time reporting of baleen whale passive acoustic detections from ocean gliders. J. Acoust. Soc. Am. 134, 1814–1823. doi:10.1121/1.4816406
Baumgartner, M. F., and Mussoline, S. E. (2011). A generalized baleen whale call detection and classification system. J. Acoust. Soc. Am. 129, 2889–2902. doi:10.1121/1.3562166
Bettridge, S. O. M., Baker, C. S., Barlow, J., Clapham, P., Ford, M. J., Gouveia, D., et al. (2015). Status review of the humpback whale (megaptera novaeangliae) under the endangered species act. Technical Memorandum No. NOAA-TM-NMFS-SWFSC-540 (La Jolla, CA: Southwest Fisheries Science Center), 1–240.
Brax, J. (2002). Zoning the oceans: Using the national marine sanctuaries act and the antiquities act to establish marine protection areas and marine reserves in America. Ecol. LQ 29, 71.
Calambokidis, J., Falcone, E. A., Quinn, T. J., Burdin, A. M., Clapham, P. J., Ford, J. K., et al. (2008). Splash: Structure of populations, levels of abundance and status of humpback whales in the North Pacific. 57, Final report for Contract AB133F-03-RP-00078. Available at: https://cascadiaresearch.org/files/SPLASH-contract-Report-May08.pdf.
Calambokidis, J., Steiger, G. H., Straley, J. M., Herman, L. M., Cerchio, S., Salden, D. R., et al. (2001). Movements and population structure of humpback whales in the North Pacific. Mar. Mammal. Sci. 17, 769–794. doi:10.1111/j.1748-7692.2001.tb01298.x
Clark, C. W., and Clapham, P. J. (2004). Acoustic monitoring on a humpback whale (Megaptera novaeangliae) feeding ground shows continual singing into late spring. Proc. R. Soc. Lond. B 271, 1051–1057. doi:10.1098/rspb.2004.2699
Cohen, R. E., Frasier, K. E., Baumann-Pickering, S., Wiggins, S. M., Rafter, M. A., Baggett, L. M., et al. (2022). Identification of Western North Atlantic odontocete echolocation click types using machine learning and spatiotemporal correlates. PloS one 17, e0264988. doi:10.1371/journal.pone.0264988
Corkeron, P. J., and Connor, R. C. (1999). Why do baleen whales migrate? Mar. Mammal. Sci. 15, 1228–1245. doi:10.1111/j.1748-7692.1999.tb00887.x
Corkeron, P. J., and Van Parijs, S. M. (2001). Vocalizations of eastern Australian Risso's dolphins, <i>Grampus griseus</i>. Can. J. Zool. 79, 160–164. doi:10.1139/cjz-79-1-160
Craig, A. S., Herman, L. M., Gabriele, C. M., and Pack, A. A. (2003). Migratory timing of humpback whales (Megaptera novaeangliae) in the central North Pacific varies with age, sex and reproductive status. Behav. 140, 981–1001. doi:10.1163/156853903322589605
Croll, D. A., Clark, C. W., Acevedo, A., Tershy, B., Flores, S., Gedamke, J., et al. (2002). Only male fin whales sing loud songs. Nature 417, 809. doi:10.1038/417809a
Darling, J. D., and Mcsweeney, D. J. (1985). Observations on the migrations of North Pacific humpback whales (Megaptera novaeangliae). Can. J. Zool. 63, 308–314. doi:10.1139/z85-047
Davis, G. E., Baumgartner, M. F., Corkeron, P. J., Bell, J., Berchok, C., Bonnell, J. M., et al. (2020). Exploring movement patterns and changing distributions of baleen whales in the Western North Atlantic using a decade of passive acoustic data. Glob. Change Biol. 26, 4812–4840. doi:10.1111/gcb.15191
Dawbin, W. H. (1966). “The seasonal migratory cycle of humpback whales,” in Whales, dolphins, and porpoises. Editor K. S. NORRIS (University of California Press).
Edwards, E. F., Hall, C., Moore, T. J., Sheredy, C., and Redfern, J. V. (2015). Global distribution of fin whales Balaenoptera physalus in the post-whaling era (1980-2012). Mammal. Rev. 45, 197–214. doi:10.1111/mam.12048
Fangman, S., and Roletto, J. (2001). Workshop on marine mammal research & monitoring in the national marine sanctuaries, wailea, maui, Hawaii, 28 november 1999. Wailea, Maui, Hawaii: NOAA/National Ocean Service/Marine Sanctuaries Division.
Fleming, A., and Jackson, J. (2011). Global review of humpback whales (Megaptera Novaeangliae). Technical Memorandum No. NOAA-TM-NMFS-SWFSC-474 (La Jolla, CA: Southwest Fisheries Science Center), 1–209.
Forney, K. A. (2007). Preliminary estimates of cetacean abundance along the US west coast and within four National Marine Sanctuaries during 2005, 36. Technical Memorandum No. NOAA-TM-NMFS-SWFSC-406 (La Jolla, CA: Southwest Fisheries Science Center), 1–27.
Frasier, K. E. (2021). A machine learning pipeline for classification of cetacean echolocation clicks in large underwater acoustic datasets. PLoS Comput. Biol. 17, e1009613. doi:10.1371/journal.pcbi.1009613
Geijer, C. K. A., Notarbartolo Di Sciara, G., and Panigada, S. (2016). Mysticete migration revisited: Are mediterranean fin whales an anomaly? Mam. Rev. 46, 284–296. doi:10.1111/mam.12069
Gillespie, D., Gordon, J., Mchugh, R., Mclaren, D., Mellinger, D. K., Redmond, P., et al. (2008). “Pamguard: Semiautomated, open source software for real-time acoustic detection and localisation of cetaceans,” in Proceedings of the Institute of acoustics, 30.
Haver, S. M., Gedamke, J., Hatch, L. T., Dziak, R. P., Van Parijs, S., Mckenna, M. F., et al. (2018). Monitoring long-term soundscape trends in U.S. Waters: The NOAA/NPS ocean noise reference station network. Mar. Policy 90, 6–13. doi:10.1016/j.marpol.2018.01.023
Haver, S. M., Rand, Z., Hatch, L. T., Lipski, D., Dziak, R. P., Gedamke, J., et al. (2020). Seasonal trends and primary contributors to the low-frequency soundscape of the cordell Bank National marine sanctuary. J. Acoust. Soc. Am. 148, 845–858. doi:10.1121/10.0001726
Hayes, S. A., Josephson, E., Maze-Foley, K., and Rosel, P. E. (2019). US atlantic and Gulf of Mexico marine mammal stock assessments - 2018, 291. NOAA Tech Memo NMFS-NE, 258.
Heenehan, H. L., Tyne, J. A., Bejder, L., Van Parijs, S. M., and Johnston, D. W. (2016). Passive acoustic monitoring of coastally associated Hawaiian spinner dolphins, Stenella longirostris, ground-truthed through visual surveys. J. Acoust. Soc. Am. 140, 206–215. doi:10.1121/1.4955094
Heenehan, H. L., Van Parijs, S. M., Bejder, L., Tyne, J. A., and Johnston, D. W. (2017). Using acoustics to prioritize management decisions to protect coastal dolphins: A case study using Hawaiian spinner dolphins. Mar. Policy 75, 84–90. doi:10.1016/j.marpol.2016.10.015
Helble, T. A., Guazzo, R. A., Alongi, G. C., Martin, C. R., Martin, S. W., and Henderson, E. E. (2020). Fin whale song patterns shift over time in the central north Pacific. Front. Mar. Sci. 7. doi:10.3389/fmars.2020.587110
Henderson, E. E., Hildebrand, J. A., and Smith, M. H. (2011). Classification of behavior using vocalizations of Pacific white-sided dolphins (Lagenorhynchus obliquidens). J. Acoust. Soc. Am. 130, 557–567. doi:10.1121/1.3592213
Herzing, D. L. (1996). Vocalizations and associated underwater behavior of free-ranging Atlantic spotted dolphins, Stenella frontalis and bottlenose dolphins, Tursiops truncatus. Aquat. Mamm. 22, 61–80.
Hill, M. C., Bradford, A. L., Steel, D., Baker, C. S., Ligon, A. D., Ü, A. C., et al. (2020). Found: A missing breeding ground for endangered Western north Pacific humpback whales in the mariana Archipelago. Endang. Species Res. 41, 91–103. doi:10.3354/esr01010
Jones, B., Zapetis, M., Samuelson, M. M., and Ridgway, S. (2020). Sounds produced by bottlenose dolphins (Tursiops): A review of the defining characteristics and acoustic criteria of the dolphin vocal repertoire. Bioacoustics 29, 399–440. doi:10.1080/09524622.2019.1613265
Kennedy, A. S., Zerbini, A. N., Vasquez, O. V., Gandilhon, N., Clapham, P. J., and Adam, O. (2014). Local and migratory movements of humpback whales (Megaptera novaeangliae) satellite-tracked in the North Atlantic Ocean. Can. J. Zool. 92, 9–18. doi:10.1139/cjz-2013-0161
Kowarski, K., Evers, C., Moors-Murphy, H., Martin, B., and Denes, S. L. (2018). Singing through winter nights: Seasonal and diel occurrence of humpback whale (Megaptera novaeangliae) calls in and around the Gully MPA, offshore eastern Canada. Mar. Mam. Sci. 34, 169–189. doi:10.1111/mms.12447
Kügler, A., Lammers, M. O., Zang, E. J., Kaplan, M. B., and Mooney, T. A. (2020). Fluctuations in Hawaii’s humpback whale Megaptera novaeangliae population inferred from male song chorusing off Maui. Endang. Species Res. 43, 421–434. doi:10.3354/esr01080
Lagerquist, B. A., Mate, B. R., Ortega-Ortiz, J. G., Winsor, M., and Urbán-Ramirez, J. (2008). Migratory movements and surfacing rates of humpback whales (Megaptera novaeangliae) satellite tagged at Socorro Island, Mexico. Mar. Mammal Sci. 24, 815–830. doi:10.1111/j.1748-7692.2008.00217.x
Lammers, M. O., Au, W. W. L., and Herzing, D. L. (2003). The broadband social acoustic signaling behavior of spinner and spotted dolphins. J. Acoust. Soc. Am. 114, 1629–1639. doi:10.1121/1.1596173
Lammers, M. O. (2004). Occurrence and behavior of Hawaiian spinner dolphins <I> (Stenella longirostris)</I> along oahu's leeward and South shores. Aquat. Mamm. 30, 237–250. doi:10.1578/am.30.2.2004.237
Lammers, M. O., and Oswald, J. N. (2015). “Analyzing the acoustic communication of dolphins,” in Dolphin communication & cognition. Editors D. L. HERZING, and C. M. JOHNSON (Cambridge, MA: MIT Press).
Magnúsdóttir, E. E., Rasmussen, M. H., Lammers, M. O., and Svavarsson, J. (2014). Humpback whale songs during winter in subarctic waters. Polar Biol. 37, 427–433. doi:10.1007/s00300-014-1448-3
Mattila, D. K., Guinee, L. N., and Mayo, C. A. (1987). Humpback whale songs on a North Atlantic feeding ground. J. Mammal. 68, 880–883. doi:10.2307/1381574
Mcclellan, D. B., Browder, J., Tobias, J. L., Konoval, G. J., Heron, M. D., Bass, O. L., et al. (2000). Opportunistic sightings of bottlenose dolphin, Tursiops truncatus, along the southeast Florida coast and Florida Bay, 1992–1997.
Mcelligott, M. M., and Lammers, M. O. (2021). Investigating spinner dolphin (Stenella longirostris) occurrence and acoustic activity in the maui nui region. Front. Mar. Sci. 8. doi:10.3389/fmars.2021.703818
Mizroch, S. A., Rice, D. W., Zwiefelhofer, D., Waite, J., and Perryman, W. L. (2009). Distribution and movements of fin whales in the North Pacific ocean. Mammal. Rev. 39, 193–227. doi:10.1111/j.1365-2907.2009.00147.x
Morano, J. L., Salisbury, D. P., Rice, A. N., Conklin, K. L., Falk, K. L., and Clark, C. W. (2012). Seasonal and geographical patterns of fin whale song in the Western North Atlantic Ocean. J. Acoust. Soc. Am. 132, 1207–1212. doi:10.1121/1.4730890
Murray, A., Rice, A. N., and Clark, C. W. (2014). Extended seasonal occurrence of humpback whales in Massachusetts Bay. J. Mar. Biol. Ass. 94, 1117–1125. doi:10.1017/s0025315412001968
Oleson, E. M., Sirovic, A., Bayless, A. R., and Hildebrand, J. A. (2014). Synchronous seasonal change in fin whale song in the North Pacific. PLoS ONE 9, e115678. doi:10.1371/journal.pone.0115678
Payne, K., and Payne, R. (1985). Large scale changes over 19 years in songs of humpback whales in Bermuda. Z. für Tierpsychol. 68, 89–114. doi:10.1111/j.1439-0310.1985.tb00118.x
Payne, R. S., and Mcvay, S. (1971). Songs of humpback whales. Science 173, 585–597. doi:10.1126/science.173.3997.585
Payne, R., and Webb, D. (1971). Orientation by means of long range acoustic signaling in baleen whales. Ann. NY. Acad. Sci. 188, 110–141. doi:10.1111/j.1749-6632.1971.tb13093.x
Rankin, S., Archer, F., Keating, J. L., Oswald, J. N., Oswald, M., Curtis, A., et al. (2017). Acoustic classification of dolphins in the California Current using whistles, echolocation clicks, and burst pulses. Mar. Mam. Sci. 33, 520–540. doi:10.1111/mms.12381
Rice, A., Debich, A. J., Širović, A., Oleson, E. M., Trickey, J. S., Varga, L. M., et al. (2021). Cetacean occurrence offshore of Washington from long-term passive acoustic monitoring. Mar. Biol. 168, 136. doi:10.1007/s00227-021-03941-9
Richardson, W. J., Greene, C. R., Malme, C. I., and Thomson, D. H. (1995). Marine mammals and noise. San Diego: Academic Press.
Rossing, T. D. (2014). in Cetacean acoustics. Editor T. D. ROSSING (Springer-Verlag Berlin Heidelberg).
Ryan, J., Cline, D., Dawe, C., Mcgill, P., Zhang, Y., Joseph, J., et al. (2016). New passive acoustic monitoring in Monterey bay national marine sanctuary. OCEANS 2016 MTS/IEEE Monterey 19-23, 1–8.
Ryan, J. P., Cline, D. E., Joseph, J. E., Margolina, T., Santora, J. A., Kudela, R. M., et al. (2019). Humpback whale song occurrence reflects ecosystem variability in feeding and migratory habitat of the northeast Pacific. PLoS One 14, e0222456. doi:10.1371/journal.pone.0222456
Silva, T. L., Fay, G., Mooney, T. A., Robbins, J., Weinrich, M. T., Carson, C. D., et al. (2019a). Habitat use of toothed whales in a marine protected area based on point process models. Mar. Ecol. Prog. Ser. 609, 239–256. doi:10.3354/meps12820
Silva, T. L., Mooney, T. A., Sayigh, L. S., and Baumgartner, M. F. (2019b). Temporal and spatial distributions of delphinid species in Massachusetts Bay (USA) using passive acoustics from ocean gliders. Mar. Ecol. Prog. Ser. 631, 1–17. doi:10.3354/meps13180
Simonis, A. E., Roch, M. A., Bailey, B., Barlow, J., Clemesha, R. E., Iacobellis, S., et al. (2017). Lunar cycles affect common dolphin Delphinus delphis foraging in the Southern California Bight. Mar. Ecol. Prog. Ser. 577, 221–235. doi:10.3354/meps12247
Širović, A., Oleson, E. M., Buccowich, J., Rice, A., and Bayless, A. R. (2017). Fin whale song variability in southern California and the Gulf of California. Sci. Rep. 7, 10126. doi:10.1038/s41598-017-09979-4
Širović, A., Rice, A., Chou, E., Hildebrand, J. A., Wiggins, S. M., and Roch, M. A. (2015). Seven years of blue and fin whale call abundance in the Southern California Bight. Endang. Species Res. 28, 61–76. doi:10.3354/esr00676
Steiner, W. W. (1981). Species-specific differences in pure tonal whistle vocalizations of five Western North Atlantic dolphin species. Behav. Ecol. Sociobiol. 9, 241–246. doi:10.1007/BF00299878
Stevick, P. T., Neves, M. C., Johansen, F., Engel, M. H., Allen, J., Marcondes, M. C. C., et al. (2011). A quarter of a world away: Female humpback whale moves 10 000 km between breeding areas. Biol. Lett. 7, 299–302. doi:10.1098/rsbl.2010.0717
Stimpert, A. K., Au, W. W. L., Parks, S. E., Hurst, T., and Wiley, D. N. (2011). Common humpback whale (Megaptera novaeangliae) sound types for passive acoustic monitoring. J. Acoust. Soc. Am. 129, 476–482. doi:10.1121/1.3504708
Taruski, A. G. (1979). “The whistle repertoire of the North Atlantic pilot whale (Globicephala melaena) and its relationship to behavior and environment,” in Behavior of marine animals (Springer).
Tomlin, A. (1967). Mammals of the USSR and adjacent countries. 9. Cetacea. Israel Program Sci. Transl,
Van Opzeeland, I., Van Parijs, S., Kindermann, L., Burkhardt, E., and Boebel, O. (2013). Calling in the cold: Pervasive acoustic presence of humpback whales (Megaptera novaeangliae) in antarctic coastal waters. PLoS ONE 8, e73007–7. doi:10.1371/journal.pone.0073007
Van Parijs, S. M., Clark, C. W., Sousa-Lima, R. S., Parks, S. E., Rankin, S., Risch, D., et al. (2009). Management and research applications of real-time and archival passive acoustic sensors over varying temporal and spatial scales. Mar. Ecol. Prog. Ser. 395, 21–36. doi:10.3354/meps08123
Vu, E. T., Risch, D., Clark, C. W., Gaylord, S., Hatch, L. T., Thompson, M. A., et al. (2012). Humpback whale song occurs extensively on feeding grounds in the Western North Atlantic Ocean. Aquat. Biol. 14, 175–183. doi:10.3354/ab00390
Watkins, W. A., Moore, K. E., Wartzok, D., and Johnson, J. H. (1981). Radio tracking of finback (Balaenoptera physalus) and humpback (Megaptera novaeangliae) whales in Prince William Sound, Alaska. Deep Sea Res. Part A. Oceanogr. Res. Pap. 28, 577–588. doi:10.1016/0198-0149(81)90118-7
Watkins, W. A., Tyack, P. L., Moore, K. E., and Bird, J. E. (1987). The 20-Hz signals of finback whales (Balaenoptera physalus). J. Acoust. Soc. Am. 82, 1901–1912. doi:10.1121/1.395685
Wiggins, S. M., Frasier, K. E., Elizabeth Henderson, E., and Hildebrand, J. A. (2013). Tracking dolphin whistles using an autonomous acoustic recorder array. J. Acoust. Soc. Am. 133, 3813–3818. doi:10.1121/1.4802645
Wiggins, S. M., and Hildebrand, J. A. (2007). “High-frequency Acoustic Recording Package (HARP) for broad-band, long-term marine mammal monitoring,” in International symposium on underwater technology 2007 and international workshop on scientific use of submarine cables & related technologies 2007 (Tokyo, Japan: Institute of Electrical and Electronics Engineers), 551–557.
Wiggins, S. M., and Morris, M. A. (2019). “SoundTrap ST500 calibration at the transducer evaluation test center (TRANSDEC),” in Marine physical laboratory technical memorandum (San Diego, La Jolla, CA: Scripps Institution of Oceanography, University of California), 645.
Wiggins, S. M., Roch, M. A., and Hildebrand, J. A. (2010). TRITON software package: Analyzing large passive acoustic monitoring data sets using MATLAB. J. Acoust. Soc. Am.128, 2299–2299. doi:10.1121/1.3508074
Wiley, D., Hatch, L., Schwehr, K., Thompson, M., and Macdonald, C. (2013). Marine sanctuaries and marine planning. Coast Guard Proc. Mar. Saf. Secur. Counc. 70, 10–15.
Winn, H. E., and Winn, L. K. (1978). The song of the humpback whale Megaptera novaeangliae in the West Indies. Mar. Biol. 47, 97–114. doi:10.1007/bf00395631
Keywords: passive acoustic monitoring, marine sanctuaries, fin whale, humpback whale, delphinid. (Min.5-Max. 8)
Citation: DeAngelis AI, Van Parijs SM, Barkowski J, Baumann-Pickering S, Burger K, Davis GE, Joseph J, Kok ACM, Kügler A, Lammers M, Margolina T, Pegg N, Rice A, Rowell TJ, Ryan JP, Stokoe A, Zang E and Hatch L (2022) Exploring marine mammal presence across seven US national marine sanctuaries. Front. Remote Sens. 3:970401. doi: 10.3389/frsen.2022.970401
Received: 15 June 2022; Accepted: 23 November 2022;
Published: 12 December 2022.
Edited by:
Renata Sousa-Lima, Federal University of Rio Grande do Norte, BrazilReviewed by:
Robert McCauley, Curtin University, AustraliaKarolin Thomisch, Alfred Wegener Institute Helmholtz Centre for Polar and Marine Research (AWI), Germany
Copyright © 2022 DeAngelis, Van Parijs, Barkowski, Baumann-Pickering, Burger, Davis, Joseph, Kok, Kügler, Lammers, Margolina, Pegg, Rice, Rowell, Ryan, Stokoe, Zang and Hatch. This is an open-access article distributed under the terms of the Creative Commons Attribution License (CC BY). The use, distribution or reproduction in other forums is permitted, provided the original author(s) and the copyright owner(s) are credited and that the original publication in this journal is cited, in accordance with accepted academic practice. No use, distribution or reproduction is permitted which does not comply with these terms.
*Correspondence: Annamaria I. DeAngelis, YW5uYW1hcmlhLmRlYW5nZWxpc0Bub2FhLmdvdg==