Editorial: Our changing planet: Half-a-century landscape dynamics observed from space
 Garik Gutman
 Chris Justice
 Eric Vermote
- 1NASA Headquarters, Washington, DC, United States
- 2University of Maryland, College Park, MD, United States
- 3NASA Goddard Space Flight Center, Greenbelt, MD, United States
Editorial on the Research Topic
Editorial: Our changing planet: Half-a-century of landscape dynamics observed from space
This Research Topic called for papers using long-term time series of satellite observations to study land-surface changes around the World, providing new insights into regional changes in surface variables and landscape dynamics. The emphasis on time series was prompted by the celebration of 50 years of Landsat ‘moderate resolution’ observations, which began with the ERTS program in 1972. We also recognize the opportunity afforded by other sufficiently long records of land observations from multiple sensors. Long-term, global satellite observations allow researchers to quantify different aspects of land-cover change (See Figure 1). However, the volume of data involved in global multi-year, time-series analysis at moderate resolution was until recently computationally prohibitive. With easy access to the global archive and cloud computing, an exciting new generation of moderate resolution analyses is anticipated. Six papers, encompassing research on optical time-series data of day-time Landsat data, thermal IR data from AVHRR, and night-lights data from OLS and VIIRS, published in this Research Topic, are described below.
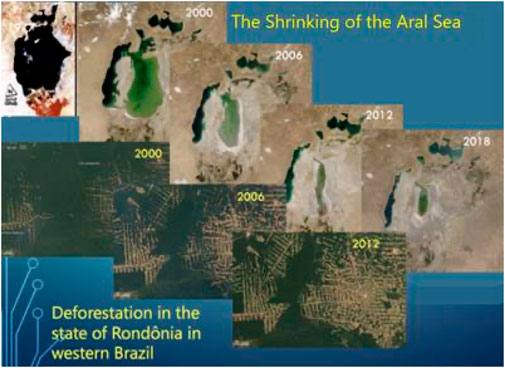
FIGURE 1. Title: Iconic examples of Landsat time series depicting land change (Source: earthobservatory.nasa.gov).
Potapov et al. focused on 20 years of global land-cover change based on 30-m Landsat data, quantifying changes in forest extent and height, cropland, built-up lands, surface water, and perennial snow and ice extent for the period 2000–2020. Validation of the derived maps, using a statistical sample of reference data revealed a relatively high user’s and producer’s accuracies above 85% for all land-cover and land-use categories, except for built-up lands. The study revealed dramatic changes in land cover and a few new findings, which bring into question some of the reported national statistics and the need for greater attention to sustainable land management practices, as well as the impact of climate change.
Friedl et al. used Landsat data for about the same period (2001–2020) as in Potapov et al. paper to compile annual maps of land cover for North America. The paper describes data sets and their algorithm, which uses temporal segmentation. Reference data sets were generated and used to assess the overall accuracy of the land-cover map for any given year, as well as the accuracy and uncertainty of land-cover change. The paper discusses the challenges in mapping associated with sub-pixel mixtures of land cover in regions with sparse or low stature vegetation such as temperate drylands and Arctic ecosystems.
Tyukavina et al. used Landsat data from 2001 to 2019 to generate the global 30 m map of annual forest loss due to fire. A sample-based unbiased estimator was used, enabling map-based area reporting and trend analysis. The study found an increasing global trend in forest loss due to fire driven by near-uniform increases across the tropics, subtropics and temperate Australia, and boreal Eurasia. The study has implications for increased forest loss associated with climate change and extreme weather events.
Zhang et al. looked at the variability in the Landsat record from 1985–2020, in the useable Collection 1, Tier 1 observations. Analysis using multiple filtering approaches showed the variability in the density and spatio-temporal distribution of usable Landsat pixels from the perspective of time-series analysis for land-change monitoring. Primary factors analyzed included the limited acquisition during the 1980s and 1990s, cloud and cloud shadow, sensor saturation and high Aerosol Optical Thickness. The study shows that filtering saturated and hazy pixels is helpful to reduce noise in the time series and that the atmospheric opacity band needs to be used with caution. The study provides guidance for those undertaking Landsat time-series analysis.
Julien and Sobrino explored the effect of orbital drift on Land Surface Temperature retrievals over different land covers, identifying a previously overlooked seasonal component. Orbital drift is a characteristic of the multi-satellite AVHRR long-term record. In this paper the authors develop and test an improved approach for correction. Their results indicate that operational correction is feasible.
Elvidge et al. provide a review of a long-term record of visible low light night-time observations acquired by the US Defense Mapping Satellite Program, which goes back to the 1970s. These have been used to generate 55 annual and over 600 monthly products of global night-time lights. The paper discusses the evolution of low light sensing and the limitations of the Operational Linescan System observations including the coarse spatial resolution, limited dynamic range and low saturation level, and the lack of inflight calibration. Examples of various applications of the data are given, and the significant improvements with the VIIRS Day/Night Band sensor for the identification of night-time lights are described. The data archive and products available are described and the future of low light sensing is discussed.
Having been involved in the development of long-term data records, the Editors understand the level of commitment and stewardship needed to create and maintain them. With an informed understanding of the strengths and limitations of these data sets and their validation, researchers now have the means to study changes and trends in global land surface variables and land cover. The length of the land data records from moderate and coarse resolution satellite data now allows for climate scale studies. We believe that this collection of papers has just scratched the surface of a much larger body of research on characterizing and using the long-term satellite records for land-surface monitoring.
Author contributions
All authors listed have made a substantial, direct, and intellectual contribution to the work and approved it for publication.
Conflict of interest
The authors declare that the research was conducted in the absence of any commercial or financial relationships that could be construed as a potential conflict of interest.
Publisher’s note
All claims expressed in this article are solely those of the authors and do not necessarily represent those of their affiliated organizations, or those of the publisher, the editors and the reviewers. Any product that may be evaluated in this article, or claim that may be made by its manufacturer, is not guaranteed or endorsed by the publisher.
Keywords: optical, remote sensing observations, long-term, time series, land-cover change
Citation: Gutman G, Justice C and Vermote E (2022) Editorial: Our changing planet: Half-a-century landscape dynamics observed from space. Front. Remote Sens. 3:998387. doi: 10.3389/frsen.2022.998387
Received: 19 July 2022; Accepted: 12 August 2022;
Published: 06 September 2022.
Edited and reviewed by:
Jane Southworth, University of Florida, United StatesCopyright © 2022 Gutman, Justice and Vermote. This is an open-access article distributed under the terms of the Creative Commons Attribution License (CC BY). The use, distribution or reproduction in other forums is permitted, provided the original author(s) and the copyright owner(s) are credited and that the original publication in this journal is cited, in accordance with accepted academic practice. No use, distribution or reproduction is permitted which does not comply with these terms.
*Correspondence: Garik Gutman, ggutman@nasa.gov