Remote mapping of leafy spurge (Euphorbia esula, L.) in Northwestern Colorado
 Chloe M. Mattilio
 Daniel R. Tekiela2
  Urszula Norton
- 1Department of Plant Sciences, University of Wyoming, Laramie, WY, United States
- 2United States Department of Agriculture, Invasive Plant and Pesticide Use Program, United States Forest Service, Lakewood, CO, United States
Leafy spurge (Euphorbia esula L.) has been introduced to the Yampa River in Northwestern Colorado for over 40 years and flood and runoff events transport leafy spurge propagules onto adjacent landscapes. The spread of leafy spurge beyond the river channels has yet to be mapped and recorded, and this research was conducted to map leafy spurge occurrence in the Yampa River Valley. Significant stakeholder mapping efforts took place in the summer of 2019–2021, leading to excellent spatial data on leafy spurge presence and absence along the main channel. In summer 2019, multispectral SPOT seven satellite imagery, stakeholder ground mapping efforts, and bright yellow-green leafy spurge bracts were used to interpret imagery, identify dense, unobscured patches of leafy spurge, and digitize them. Spectral signatures from training samples for leafy spurge and other land cover classes (generalized as “not leafy spurge”) were then used to train a Random Forest machine learning classification. In the summer of 2021, generated classification maps were compared to multispectral satellite imagery and stakeholder ground mapped leafy spurge presence. Mismatches were identified, and 271 validation locations were identified, navigated to, and evaluated for leafy spurge presence. Leafy spurge training samples were classified with 96% accuracy. Correctly classified leafy spurge locations had higher leafy spurge coverage and lower overstory canopy than missed leafy spurge locations. Leafy spurge growing beneath shrub canopy or growing as individual plants along the riverbanks were more likely to be missed. A frequency analysis for other plant species found at validation locations determined that smooth brome (Bromus inermis Leyss.), dandelion (Taraxacum officinale L.), and willow (Salix sp.) were most frequently misclassified as leafy spurge. In conclusion, multispectral satellite imagery was useful at remote detection of leafy spurge in open areas with dense leafy spurge coverage, but more work must be done for identification of sparse and diffuse leafy spurge infestations.
1 Introduction
Leafy spurge (Euphorbia esula L.) is a perennial invasive weedy species that has successfully established across a wide range of ecosystems and has a noxious weed designation in 22 US states (Goodwin et al., 2001). Leafy spurge is difficult to eradicate, despite heavy use of herbicides, targeted grazing, and various biocontrol agents (Goodwin et al., 2001). Leafy spurge is adapted to a wide range of growing conditions, including disturbed areas, rangelands, pastures, and river bottoms (Hyder et al., 2008).
With blue-green stems, linear leaves, small green flowers, and bright yellow bracts, mature leafy spurge is easily identifiable. Individual stems can produce over 200 seeds annually, which when mature, can be expelled up to 15 feet from the plant (St. John and Tilley, 2014). Seeds are small and buoyant, easily transported by water to areas downstream. Tissues contain a milky white sap that contains ingenol, which is released when plants are injured (Larry Leistritz, 2004). Once ingested, leafy spurge can be toxic to livestock, horses and wildlife, and result in significant economic losses to producers and other land users (Goodwin et al., 2001).
Remote sensing for leafy spurge mapping has been conducted since 1995, when leafy spurge was mapped with real color aerial imagery at Theodore Roosevelt National Park and found to be associated with high proximity to waterways (r2 = .98) (Anderson et al., 1996). Multispectral sensors, which record reflectance beyond the visible spectrum in 3–10 spectral bands, have been used in a mixed-grass prairie in North Dakota (Casady et al., 2006) Leafy spurge was mapped with 67% accuracy, with decreasing classification accuracy when grown with herbaceous vegetation (Casady et al., 2006).
Successful remote detection of leafy spurge depends on capturing spectral differences between leafy spurge and other land cover, and imagery with limited spectral bands can make identifying leafy spurge challenging (Hunt andParker Williams, 2006). In a heterogeneous landscape near Devil’s Tower National Monument Crook County, Wyoming, hyperspectral (remote sensing imagery consisting of hundreds to thousands of spectral wavelengths) classifications performed best in prairie vegetation, and better in bottomlands than uplands, which was caused by dense leafy spurge cover in riparian areas and longer periods of blooming in moist habitats (Williams and Raymond, 2002). In a study by Parker and Hunt. (2004), leafy spurge was well correlated with higher near infrared (NIR) reflectance, which is also known to be well correlated with dense vegetation cover. Leafy spurge was detected with 95% accuracy, and classification performed well in mixed-prairie and riparian vegetation than in forested areas (Williams and Raymond, 2002). In the sagebrush (Artemisia tridentata subsp. tridentata) steppe of Swan Valley, Idaho with 84%–94% accuracy (Glenn et al., 2005) and with 96%–99.5% accuracy at the mixed-grass prairie at Theodore Roosevelt National Park (O’Neill et al., 2000).
Leafy spurge has been spreading along the Yampa River main channel and constructed irrigation ditches for over 40 years (Yampa River Leafy Spurge Association, 2018; Turnage, 2021). The Yampa River flows for 250 river miles in Moffat and Routt Counties, Colorado, United States. Increased presence of leafy spurge in this area can be indicative of disturbance and large flooding events (Yampa River Leafy Spurge Project, 2018; Goodwin et al., 2001). The Yampa is one of the last free-flowing rivers in the Western United States, with seasonal flooding temporarily inundating sandbars and terraces away from the active river channel (Merritt and Cooper, 2000). Understanding the current extent of leafy spurge invasion with high spatial resolution is critical as its presence has already been observed beyond the riverbanks and floodplains, such as upland meadows, hillslopes and mountain ridges. High spatial resolution is a priority, as small satellite clusters of leafy spurge away from the main invasion are more likely to be effectively managed and to spread to new areas (Westbrooks, 2004). This project aimed to: 1) produce detailed maps of the current leafy spurge infestation along the Yampa River corridor with SPOT seven satellite remote sensing and 2), visit locations and validate leafy spurge presence or absence to describe classification performance.
2 Materials and methods
2.1 Study area
The Yampa River flows from the Flattops Wilderness to a confluence with the Green River deep inside of Dinosaur National Monument. The stretch of the Yampa River under investigation flows through the Moffat and the Routt Counties, between Hayden, Colorado, and Dinosaur National Monument (Figure 1). There, leafy spurge has already invaded riparian areas such as riverbanks and islands and is now advancing to uplands covered by juniper forests, sagebrush shrublands, grasslands, and agricultural fields. Figure 2.
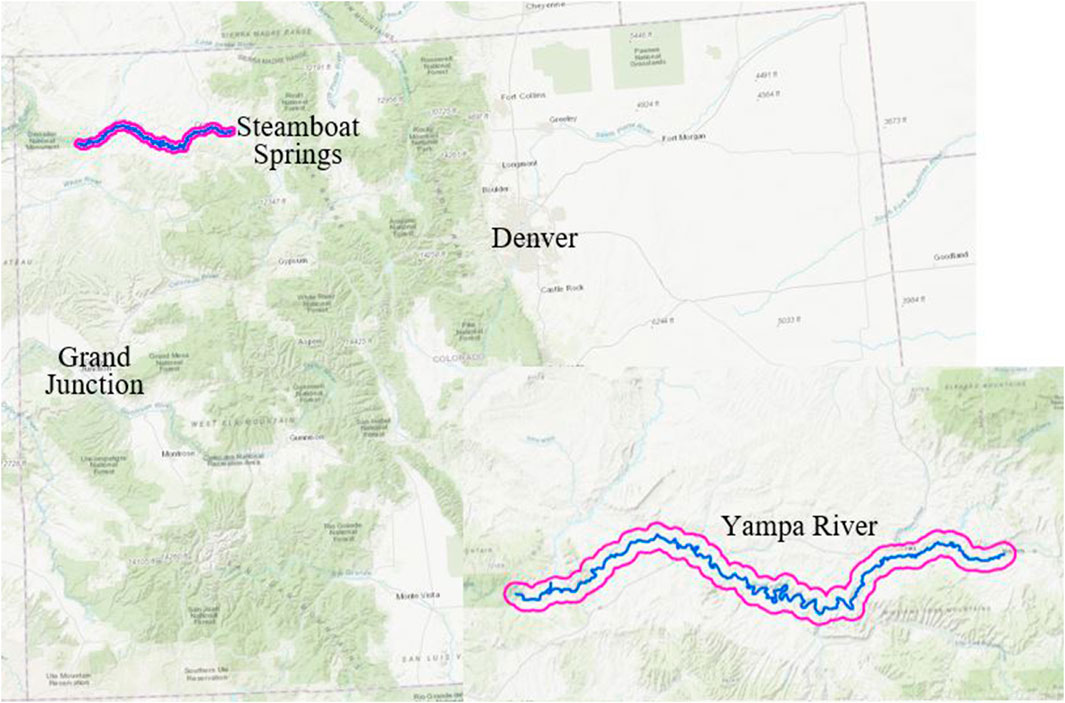
FIGURE 1. Map of the Yampa River study area, with location in Colorado (upper panel) and closer view of study area (lower panel) with satellite imagery extent buffered to 1.5 miles from river’s edge (pink).
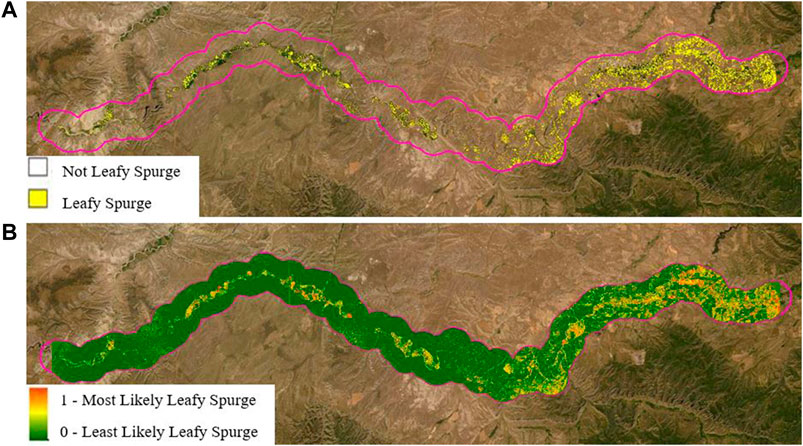
FIGURE 2. a and b. Random Forest classification predictions for imagery study area (magenta outline) for a binary classifier (A) and a probabilistic classifier (B). The binary map shows pixels not classified as leafy spurge as colorless (negatives) and pixels classified as leafy spurge in yellow (positives). The probabilistic model represents values from 0 to 1, for least likely to be leafy spurge in dark green and most likely to be leafy spurge in red.
2.2 Data collection
2.2.1 Ground mapping of leafy spurge
Ground mapping of leafy spurge took place during over three summers between 2019 and 2021, as water levels allowed each year. Mapping was conducted by stakeholder volunteers from the Yampa River Leafy Spurge Project (YRLSP) via water to map the extent of infestation along the Yampa’s main channel and beyond riverbanks. Coverage was extensive, with one or more observers scanning the riverbanks of the main channel for leafy spurge rafts to map the perimeter of the invasion to full extent or property lines where owners rejected mapping requests. During each stop, the location and presence of leafy spurge (density, abundance, and patch size), land characteristics, vegetation type and overstory canopy cover were recorded on location service enabled tablets equipped with Map It Fast (Agterra, 2017) (Table 1.a). All information was imported into a Geographic Information System (GIS) (ArcMap 10.5 (ESRI, 2018) and used for identification of leafy spurge presence visible in the imagery. These mapped polygons were not used directly as classification training samples, as the imagery represented one sample in time, leafy spurge growing beneath shrubs and trees, and leafy spurge infestations that were too small to be represented by tablet spatial accuracy and imagery spatial resolution.
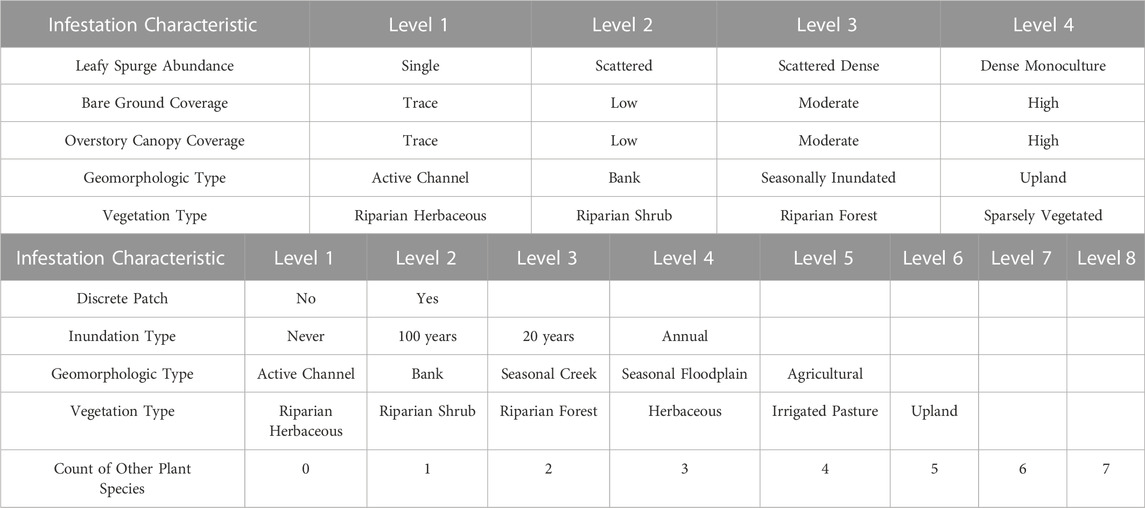
TABLE 1. a and b (top to bottom). Categorical infestation characteristics recorded and levels of each infestation characteristic from a. Ground mapped leafy spurge polygons and b. Validation leafy spurge locations.
2.2.2 Satellite imagery acquisition
YRLSP funds were acquired and budgeted to purchase one set of SPOT seven satellite imagery from early July of 2019 from L3Harris Geospatial (L3Harris Geospatial, 2019). The beginning of summer in 2019 was cool and wet, so this sampling represents the late peak bloom of 2019. The spatial extent of this satellite imagery and resulting classification covers the area from Hayden, Colorado to Cross Mountain within 1.5 miles of the Yampa River channel (Figure 1). The imagery consists of five spectral bands, one panchromatic (1.5 m × 1.5 m pixels, 450–745 nm) and four multispectral: red (625–695 nm), green (530–590 nm), blue (450–520 nm), and near infrared (NIR, 760–890 nm) (6 m × 6 m pixels). Multispectral imagery was resampled to approximately 4 m × 4 m pixels using the finer resolution panchromatic band in ArcMap to increase the spatial resolution and identify the smallest clusters of leafy spurge plants possible with this imagery set. Despite this resampling of pixels of the spectral imagery, pan-sharpened imagery showed spectral patterns that delineated land cover classes that were difficult to distinguish, like riparian hay meadows, sparse rangeland vegetation, and wetlands. Once pan-sharpened, band combinations and representation were experimented with to highlight contrasts between ground mapped leafy spurge polygons and other recognizable land cover classes.
2.3 Data analysis
2.3.1 Training and classification
One hundred and eight training polygons of unobscured leafy spurge were digitized based on interpretation of the YRLSP ground mapped leafy spurge presence in the imagery in ArcMap. Volunteer ground mapping work was essential for development of these training samples, as they covered the main channel comprehensively with locations and detailed descriptions of leafy spurge presence. In addition, 96 polygons were developed for other land cover classes within the study area (water, forage fields, other vegetation, roads, structures, bare ground, etc.) and combined to create a “not leafy spurge” dataset. These training polygons represent the leafy spurge invasion as of imagery collection in July of 2019, and were imported into Program R, where SPOT seven imagery spectral reflectance values (red, green, blue, and NIR) were extracted to train the classification algorithm for leafy spurge and not leafy spurge. The method used a machine learning technique known as Random Forest (Breiman and Cutler, 2001), from the random Forest package in Program R (Liaw and Wiener, 2002). For this classification, 101 trees were grown, and 20% of the training samples were reserved for an internal validation. Two classification maps were developed with both, binary classification of “leafy spurge” and “not leafy spurge” classes using a probabilistic scale from 0 (most likely to be not leafy spurge) to 1 (most likely to be leafy spurge).
An accuracy assessment of the binary leafy spurge classification was conducted using a confusion matrix of classified and digitized training data, and users’ accuracy, producer’s accuracy, and overall accuracy. The kappa coefficient for the classification accuracy was calculated. To investigate differences in reflectance for red, green, blue, and NIR bands, correctly and incorrectly classified ground mapped leafy spurge presence polygons were selected from the classification map, and reflectance values were extracted for all four spectral bands for each class. To test differences in reflectance for detected and missed leafy spurge polygons for each spectral band, a two-way analysis of variance (ANOVA) was conducted in Program R.
2.3.2 Validation
To better understand classification performance, ground validation was conducted by identifying 271 points of interest, especially suspected classification mismatches within the study area. These areas were identified and discussed in 2020 during multiple remote open table discussions with Yampa River stakeholders in who know the area well and conducted ground mapping efforts for the YRLSP. These locations were selected to cover a broad range of habitat types and areas with known leafy spurge infestations. Within these locations, four or more pixels of the same class were generalized to make polygons of the same class. To avoid GPS inaccuracies, validation points were placed within these polygon centroids. In June of 2021, these validation points were visited by floating the river and on foot with a handheld preprogrammed GPS unit. Selected locations were scattered at the Yampa River State Wildlife Area, through Craig, Colorado, in the Little Yampa Canyon, and through Axial Basin. In addition to confirming leafy spurge presence and absence, binary classification performance (correct or incorrect), geomorphologic type, vegetation type, count and identification of other species present, inundation frequency, leafy spurge cover, canopy cover, and bare ground were recorded (Table 1 b).
Binary and continuous classification maps were exported back to ArcMap where classification values were extracted from both, classification methods for leafy spurge presence polygons from Yampa River Leafy Spurge Project ground mapping and from 2021 validation points. Proportion of correctly identified leafy spurge polygons from the binary classification were calculated for each level of infestation characteristic (i.e. trace, low, moderate, and high for the overstory canopy cover infestation characteristic). Characteristics recorded were geomorphological features, vegetation type, leafy spurge cover and density; overstory canopy cover and the presence of bare ground (Table 1.a). Binary classification (leafy spurge vs. not leafy spurge) was fit to a logistic regression to determine the effect of infestation on classification accuracy from ground mapped data. The same approach was applied to the 2021 validation points, with proportional correct classification recorded for each level of infestation characteristic and binary classification. Results were fitted to a logistic regression model to determine which infestation characteristics (geomorphologic type, vegetation type, count of other species present, inundation frequency, proportional leafy spurge cover, proportional canopy cover, and proportional bare ground) affect classification accuracy within the validation dataset (Table 1 b).
3 Results
3.1 Imagery classification
Leafy spurge training samples were identified in the Random Forest classification of multispectral satellite imagery with an overall accuracy rate of 90.7%. The same classification resulted in a 95.4% class producer’s accuracy and 88% class user’s accuracy for leafy spurge (positive) (Table 2). The final accuracy metric calculated for the remote sensing classification was a coefficient of agreement, kappa (ranges from −1–1, with values close to 0 showing that the classification performed no better than random and one describing the data perfectly). Kappa was equal to 0.902, indicating that our remote sensing classification described our leafy spurge population samples well. Correctly classified leafy spurge spectral reflectance was not significantly different from missed leafy spurge reflectance for the red, green, and blue spectral bands, but was significantly higher for the NIR spectral band (p-value = 0.031) (Table 3).
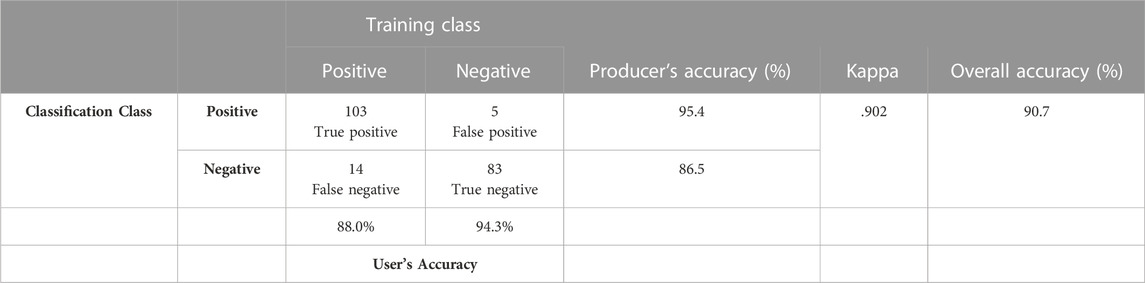
TABLE 2. Confusion matrix for Random Forest classification of imagery pixels as leafy spurge (positive) and not leafy spurge (negative) with training and validation samples correctly classified contributing to class and overall classification accuracy and misclassified other ground cover (false positives) and missed leafy spurge training samples (false negatives) and reducing class and overall classification accuracy.
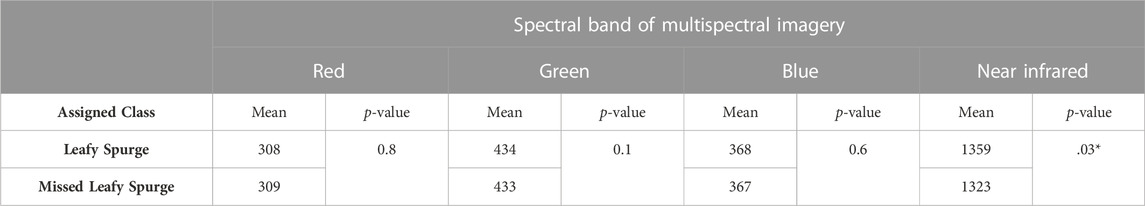
TABLE 3. Results table from t-test for differences between reflectance in each spectral band (red, green, blue, and NIR) for true positives (Leafy Spurge) and false negative (Missed Leafy Spurge) leafy spurge polygons. Values shown are mean reflectance (Mean) and p-values (p-value) testing the differences between the class means for each spectral band. p-values marked with * are significantly different.
Across a range of environmental and infestation conditions, the number of correctly mapped presence locations varied in the ground mapped dataset. Predictors that decreased correct classification likelihood of ground mapped leafy spurge polygons were single leafy spurge plant infestations (p-value = 0.011), leafy spurge located on riverbanks (p-value = 0.036), leafy spurge growing with shrubs (p-value = 0.021) and leafy spurge growing with trace amounts of bare ground (Table 4).
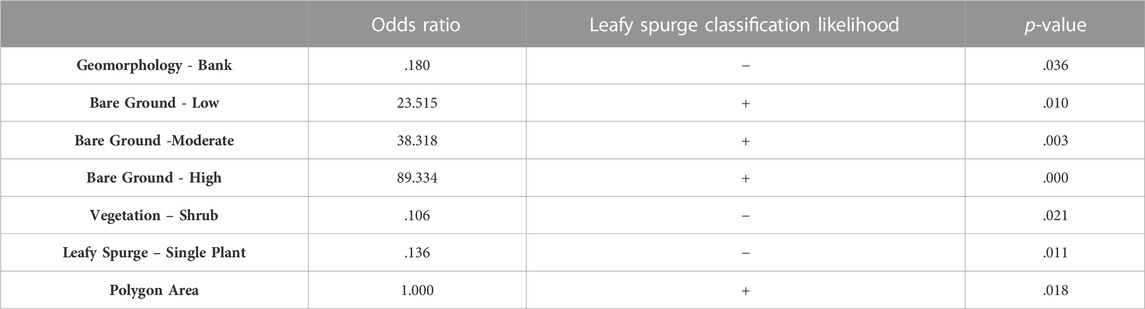
TABLE 4. Logistic regression output for statistically significant predictors of leafy spurge classification of ground mapped leafy spurge polygons with odds ratio (values < 1, decrease odds of correctly classifying leafy spurge, values > 1, increase odds of correctly classifying leafy spurge), impact on leafy spurge prediction rates, and p-values of logistic regression.
3.2 Classification validation
Much like the ground mapped leafy spurge dataset, the 271 ground validation points selected and visited represented a wide range of environmental and infestation conditions. Of these validation points that were classified as leafy spurge, 102 out of 190 were correctly classified (54% classification accuracy for leafy spurge). 190 out of 271 points were classified as leafy spurge (70%), 81 were classified as not leafy spurge (30%), and 159 out of the 271 total validation points were correctly classified (59% overall classification accuracy rate in the field). Successful classification of validation locations varied and predictors that increased likelihood of validation areas being correctly classified as leafy spurge are infestations that have higher leafy spurge percent cover (p-value = 5.8e-08) and infestations that have distinct boundaries, or discrete patches (p-value = 0.0480) (Table 5). Plant species that were misclassified as leafy spurge and growing alongside missed leafy spurge were smooth brome (Bromus inermis Leyss.), willows (Salix sp.), and dandelions (Taraxacum officinale L.) (Figure 3), while Sandberg bluegrass (Poa secunda J. Presl), western wheatgrass (Pascopyrum smithii Rydb.), poverty weed (Iva axillaris Pursh), dandelions, curlycup gumweed (Grindelia squarrosa Pursh.), tamarisk (Tamarix ramosissima L.), and whitetop (Lepidium draba L.) were misclassified as leafy spurge (Figure 4).

TABLE 5. Logistic regression output for statistically significant predictors of leafy spurge classification of validation locations of leafy spurge with odds ratio (values < 1, decrease odds of correctly classifying leafy spurge, values > 1, increase odds of correctly classifying leafy spurge), impact on leafy spurge prediction rates, and p-values of logistic regression.
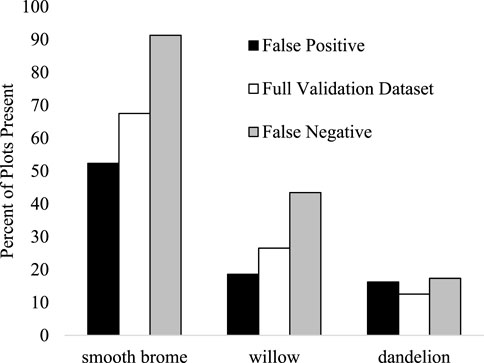
FIGURE 3. Results of frequency analysis of the three most mistaken species, smooth brome, willow, and dandelions, with their proportional presence in the full validation dataset (white), false positives (black, mistakenly classified as leafy spurge), and false negatives (grey, present with missed leafy spurge infestations).
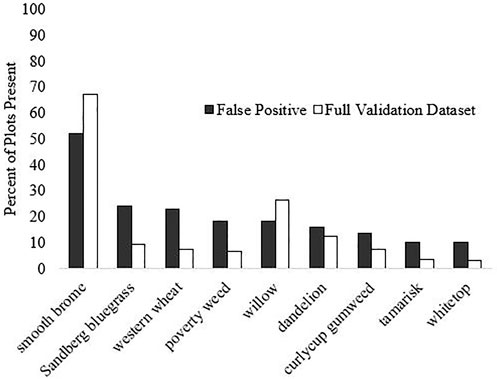
FIGURE 4. Results of frequency analysis of false positive plant species with their proportional presence in the full validation dataset (white) and false positives (black, mistakenly classified as leafy spurge).
4 Discussion
The classification method identified mapped leafy spurge training samples with 95.4% accuracy training and an overall classification accuracy of 90.7%. If mapping was to take place again however, satellite imagery with additional wavelengths of near infrared spectra may be useful, as SPOT seven imagery NIR only covers the 760–890 nm of the spectrum. Near infrared reflectance was the only spectral band that was significantly different between correctly identified and missed leafy spurge polygons, so more bands of varying wavelengths of near infrared may be useful in distinguishing leafy spurge’s unique spectral signature. Leafy spurge does seem to be spectrally identifiable within the narrow portion of the electromagnetic spectrum captured by multispectral satellite imagery products (Mitchell and Glenn, 2009). Our detection rates of leafy spurge varied, as infestations that consist of a single leafy spurge plant, leafy spurge growing with trace amounts of bare ground, leafy spurge growing on banks, and leafy spurge growing with riparian shrub vegetation cover types were more likely to be missed by our Random Forest imagery classification. This may be because the presence of a single leafy spurge population is much harder to detect with 1) somewhat limited spatial resolution (4 m × 4 m pixels), 2) changes to bank geomorphology caused by seasonal flooding during the period between satellite imagery collection and validation mapping, and 3), dense shrub cover obscuring leafy spurge invasions beneath their canopy. Overstory canopy coverage alone, however, was not a significant predictor of leafy spurge classification accuracy.
In other research projects where remote sensing was used to map leafy spurge, leafy spurge growing below overstory canopy coverage, leafy spurge on steep slopes, sparse leafy spurge populations, and small infestations of leafy spurge were missed (Anderson et al., 1996; Parker and Hunt, 2004; Glenn et al., 2005), aligning with our decreased detection accuracy of singly leafy spurge plants and leafy spurge growing below shrub and tree canopy. In contrast to our challenges of mapping leafy spurge in riparian areas of the Yampa River, detection accuracy of leafy spurge mapping in Crook County, Wyoming was improved when growing in riparian areas (Williams and Raymond, 2002; Parker and Hunt, 2004). Adding ancillary spatial data, like vegetation cover maps and distance to waterways may improve remote sensing classification results (Hunt et al., 2010; Dubovik et al., 2021). Additionally, the incorporation of citizen science data of dense, unobscured leafy spurge presence collected and submitted from within the study area could be incorporated, to increase training samples and obtain samples away from the Yampa River riparian zone (Vaz et al., 2019) but increasing the temporal resolution of the imagery with a times series of multiple imagery scenes through the leafy spurge bloom could.
One major limitation of this project is the difference between June 2021 validation mapping and satellite imagery data collection in July of 2019. Imagery procurement was limited by YRLSP budget, and 2021 SPOT seven satellite imagery purchase and classification would have been beneficial, as leafy spurge invasions may have advanced. If further remote sensing was to be conducted for mapping general leafy spurge invasion in the area, free coarser resolution multispectral imagery like Sentinel-2 (10 m × 10 m pixels) could be used. As leafy spurge is a deep-rooted perennial and a prolific seed producer (St. John and Tilley, 2014) and largely uncontrolled in the Yampa River Valley, leafy spurge populations away from the dynamic riverbanks are unlikely to decrease, excepting extreme environmental conditions, like drought. In experimental plots where herbicide was applied in the fall of 2019, treatments that controlled leafy spurge reproduction left woody stems which were recognizable during validation mapping in the summer of 2021, so some signs of past leafy spurge may be recognizable even if plants do not regrow from established roots. Additionally, our training samples were biased toward dense, large, and unobscured leafy spurge recognizable in multispectral imagery sets and may not represent the full range of leafy spurge infestation abundance, size, and habitat type.
Though the success rates of the validation mapping efforts were generally low (59% of validation locations were correctly classified), the validation locations were chosen based on anomalies in YRLSP members expert knowledge of the area or features and areas of interest from the classification prediction. For example, a series of validation points were set in a seasonal Yampa River tributary, to see if positively classified pixels as leafy spurge were true leafy spurge locations. Leafy spurge detection accuracy varies within the 190 leafy spurge positive presence locations within the dataset, as the Random Forest classification was more accurate at identifying leafy spurge populations growing as discrete patches rather than scattered populations. Discrete patches of leafy spurge and infestations with higher leafy spurge percent cover were more likely to be correctly classified by the Random Forest imagery classification. Casady et al. (2006) found that detected leafy spurge patches had higher average leafy spurge percent cover and higher average patch size, with infestations smaller than 200 m2 and 30% leafy spurge cover less likely to be identified (Casady et al., 2006). Dense populations with high leafy spurge cover may have more recognizable spectral signatures than sparse populations. Discrete boundaries of leafy spurge patches may be more identifiable, as scattered populations might share pixel space with other land cover types, though the number of additional species present at validation locations did not significantly influence classification accuracy of leafy spurge.
5 Conclusion
Satellite remote sensing appears to be a viable option for leafy spurge mapping on the Yampa River, but classification accuracy varies with leafy spurge infestation characteristics and environment. Small and/or sparse infestations of leafy spurge may go undetected, and detection rates decreased in areas with shrubs and overstory canopy coverage. Identification was most accurate when leafy spurge coverage was dense. Validation mapping suggests that leafy spurge is best identified when growing in discrete patches and when leafy spurge densities are higher.
If leafy spurge mapping was to be conducted again in the Yampa, a time series of imagery that represents early season and mid-season would be employed to try to differentiate leafy spurge from other vegetation, as suggested by Lake et al. in a heterogeneous Minnesota landscape (Lake et al., 2022). If left unmanaged, leafy spurge may become a much more prevalent invader in Moffat and Routt Counties, producing more propagules to spread through the Yampa, Green, and Colorado Rivers.
Data availability statement
The raw data supporting the conclusion of this article will be made available by the authors, without undue reservation.
Author contributions
All authors listed have made a substantial, direct, and intellectual contribution to the work and approved it for publication.
Funding
Funding for this work came from the Colorado Water Conservation Board Water Supply Reserve Fund through the Friends of the Yampa and the Y Cross Ranch Endowment. Publication costs were covered by the University of Wyoming Agricultural Experiment Station Hatch Fund.
Conflict of interest
The authors declare that the research was conducted in the absence of any commercial or financial relationships that could be construed as a potential conflict of interest.
Publisher’s note
All claims expressed in this article are solely those of the authors and do not necessarily represent those of their affiliated organizations, or those of the publisher, the editors and the reviewers. Any product that may be evaluated in this article, or claim that may be made by its manufacturer, is not guaranteed or endorsed by the publisher.
References
Anderson, G. L., Everitt, J. H., Escobar, D. E., Spencer, N. R., and Andrascik, R. J. (1996). Mapping leafy spurge (euphorbia esula) infestations using aerial photography and geographic information systems. Geocarto Int. 11 (1), 81–89. doi:10.1080/10106049609354526
Casady, G. M., Hanley, R. S., and Seelan, S. K. (2006). Detection of leafy spurge (Euphorbia esula) using multidate high-resolution satellite imagery. Weed Technol. 19 (02), 462–467. doi:10.1614/wt-03-182r1
Dubovik, O., Schuster, G. L., Xu, F., Hu, Y., Bösch, H., Landgraf, J., et al. (2021). Grand challenges in satellite remote sensing. Front. Remote Sens. 2, 1–10. doi:10.3389/frsen.2021.619818
Glenn, N. F., Mundt, J. T., Weber, K. T., Prather, T. S., Lass, L. W., and Pettingill, J. (2005). Hyperspectral data processing for repeat detection of small infestations of leafy spurge. Remote Sens. Environ. 95 (3), 399–412. doi:10.1016/j.rse.2005.01.003
Goodwin, K., Sheley, R., Nowierski, R., and Lym, R. (2001). Leafy spurge: Biology, ecology and management. AvaliableAt: http://store.msuextension.org/publications/AgandNaturalResources/EB0134.pdf.
Hunt, E. R., Gillham, J. H., and Daughtry, C. S. T. (2010). Improving potential geographic distribution models for invasive plants by remote sensing. Rangel. Ecol. Manag. 63 (5), 505–513. doi:10.2111/REM-D-09-00137.1
Hunt, E. R., and Parker Williams, A. E. (2006). Detection of flowering leafy spurge with satellite multispectral imagery published by: Society for range management detection of flowering leafy spurge with satellite multispectral imagery. Rangel. Ecol. Manag. 59 (5), 494–499. doi:10.2111/05-216R.1
Hyder, A., Leung, B., and Miao, Z. (2008). Integrating data, biology, and decision models for invasive species management: Application to leafy spurge (Euphorbia esula). Ecol. Soc. 13 (2), art12. doi:10.5751/ES-02485-130212
Lake, T. A., Runquist, R. D. B., and Moeller, D. A. (2022). Deep learning detects invasive plant species across complex landscapes using Worldview-2 and Planetscope satellite imagery. Remote Sens. Ecol. Conservation 8, 875–889. doi:10.1002/rse2.288
Larry Leistritz, F., Dean, A., and Hodur, N. M. (2004). Assessing the economic impact of invasive weeds: The case of leafy spurge (Euphorbia esula). Weed Technol. 18, 1392–1395. doi:10.1614/0890-037x(2004)018[1392:ateioi]2.0.co;2
Liaw, A., and Wiener, M. (2022). Classification and Regression by randomForest. R News 2 (3), 18–22. https://CRAN.R-project.org/doc/Rnews/.
Merritt, D. M., and Cooper, D. J. (2000). Riparian vegetation and channel change in response to river regulation: A comparative study of regulated and unregulated streams in the Green River basin, USA. River Res. Appl., 16, 543–564. doi:10.1002/1099-1646(200011/12)16:6<543::aid-rrr590>3.0.co;2-n
Mitchell, J. J., and Glenn, N. F. (2009). Leafy spurge (Euphorbia esula) classification performance using hyperspectral and multispectral sensors. Rangel. Ecol. Manag. 62 (1), 16–27. doi:10.2111/08-100
O’Neill, M., Ustin, S. L., Hager, S., and Root, R. (2000). “Mapping the distribution of leafy spurge at Theodore Roosevelt national Park using AVIRIS,” in Proceedings of the 9th JPL airborne earth sciences workshop (pp. 00-18) (Pasadena, California: NASA Jet Propulsion Laboratory).
Parker, A. E., and Hunt, E. R. (2004). Accuracy assessment for detection of leafy spurge with hyperspectral imagery. J. Range Manag. 57 (1), 106–112. doi:10.2111/1551-5028(2004)057[0106:aafdol]2.0.co;2
St. John, L., and Tilley, D. (2014). Plant Guide for Leafy spurge (Euphorbia esula). Aberdeen, Idaho: Natural Resources Conservation Service, Plant Materials Center 83210.
Turnage, M. B. (2021). An invasion problem: Leafy spurge and its management efforts in Dinosaur National Monument and the Greater Yampa River Area. Avaliable At: https://storymaps.arcgis.com/stories/998e931b97024734bf988db86e1fde61. Google Play https://play.google.com/store/apps/details?id=com.agterra.MapItFastandhl=en_USandgl=US.
Vaz, A. S., Alcaraz-Segura, D., Vicente, J. R., and Honrado, J. P. (2019). The many roles of remote sensing in invasion science. Front. Ecol. Evol. 7, 1–5. doi:10.3389/fevo.2019.00370
Westbrooks, R. G. (2004). New approaches for early detection and rapid response to invasive plants in the United States1. Weed Technol. Invasive Weed Symp. Weed Technol. 18, 1468–1471. doi:10.1614/0890-037x(2004)018[1468:nafeda]2.0.co;2
Williams, A. P., and Raymond, E. (2002). Estimation of leafy spurge cover from hyperspectral imagery using mixture tuned matched filtering. Avaliable At: www.elsevier.com/locate/rse.
Yampa River Leafy Spurge Project (2018). Who we are. Yampa River Leafy Spurge Project. Available at: https://www.yampariverleafyspurgeproject.com/who-we-are.
Keywords: invasive plant mapping, leafy spurge (Euphorbia esula L.), satellite remote sensing, validation mapping, rangeland management
Citation: Mattilio CM, Tekiela DR and Norton U (2023) Remote mapping of leafy spurge (Euphorbia esula, L.) in Northwestern Colorado. Front. Remote Sens. 4:1086085. doi: 10.3389/frsen.2023.1086085
Received: 01 November 2022; Accepted: 04 January 2023;
Published: 18 January 2023.
Edited by:
Jane Southworth, University of Florida, United StatesReviewed by:
Yu-Hsuan Tu, King Abdullah University of Science and Technology, Saudi ArabiaAlireza Sharifi, Shahid Rajaee Teacher Training University, Iran
Copyright © 2023 Mattilio, Tekiela and Norton. This is an open-access article distributed under the terms of the Creative Commons Attribution License (CC BY). The use, distribution or reproduction in other forums is permitted, provided the original author(s) and the copyright owner(s) are credited and that the original publication in this journal is cited, in accordance with accepted academic practice. No use, distribution or reproduction is permitted which does not comply with these terms.
*Correspondence: Chloe M. Mattilio, cmattili@uwyo.educhloe.mattilio@gmail.com