Characterizing spatial burn severity patterns of 2016 Chimney Tops 2 fire using multi-temporal Landsat and NEON LiDAR data
 Taejin Park1,2*
  Sunhui Sim3*
- 1Bay Area Environmental Research Institute, Moffett Field, CA, United States
- 2NASA Ames Research Center, Moffett Field, CA, United States
- 3Geoscience Department, University of North Alabama, Florence, AL, United States
The Chimney Tops 2 wildfire (CT2) in 2016 at Great Smoky Mountains National Park (GSMNP) was recorded as the largest fire in GSMNP history. Understanding spatial patterns of burn severity and its underlying controlling factors is essential for managing the forests affected and reducing future fire risks; however, this has not been well understood. Here, we formulated two research questions: 1) What were the most important factors characterizing the patterns of burn severity in the CT2 fire? 2) Were burn severity measures from passive and active optical remote sensing sensors providing consistent views of fire damage? To address these questions, we used multitemporal Landsat- and lidar-based burn severity measures, i.e., relativized differenced Normalized Burn Ratio (RdNBR) and relativized differenced Mean Tree Height (RdMTH). A random forest approach was used to identify key drivers in characterizing spatial variability of burn severity, and the partial dependence of each explanatory variable was further evaluated. We found that pre-fire vegetation structure and topography both play significant roles in characterizing heterogeneous mixed burn severity patterns in the CT2 fire. Mean tree height, elevation, and topographic position emerged as key factors in explaining burn severity variation. We observed generally consistent spatial patterns from Landsat- and lidar-based burn severity measures. However, vegetation type and structure-dependent relations between RdNBR and RdMTH caused locally inconsistent burn severity patterns, particularly in high RdNBR regions. Our study highlights the important roles of pre-fire vegetation structure and topography in understanding burn severity patterns and urges to integrate both spectral and structural changes to fully map and understand fire impacts on forest ecosystems.
1 Introduction
The Great Smoky Mountains National Park (GSMNP) is situated over the Southern Appalachians between Tennessee and North Carolina. This national park is one of the world’s most ecologically rich, diverse, and important protected areas (National Park Service, 2017). Mountainous terrain, complex topography, and rainy temperate climate create unique habitats for diverse flora and fauna (Whittaker, 1956; Jenkins, 2007). Fire in the mountains has been a dynamic and natural process that influences ecosystem function and the structural and compositional heterogeneity of the forests (Kelly et al., 2020). Yet, since the early 1900 s, fire suppression/prevention and changing climate have significantly increased the fire susceptibility of the forests (Cohen et al., 2007). During the last week of November 2016, a fire began on the Chimney Tops within the GSMNP (National Park Service, 2017). Due to accompanying drought and strong winds, the Chimney Tops 2 wildfire (hereafter, CT2) was recorded as the largest fire in the GSMNP history and caused significant environmental, social, and economic damage (Guthrie et al., 2017; National Park Service, 2017).
In addition to restoring the damaged GSMNP forests, understanding how fire modifies these forests is essential for managing the forests affected (e.g., devising restoration plans) and reducing future fire risks (e.g., prescribed burn) (Harris and Taylor, 2015; Schwartz et al., 2016). Recent advancements of remote sensing and its easier access have promoted various applications for fire monitoring and burn severity mapping (Szpakowski and Jensen, 2019). Temporarily frequent land surface observations from the earth-observing satellites (e.g., Landsat, Sentinel 2a, MODIS, VIIRS, etc.) can timely capture pre- and post-fire conditions and assess fire severity. For instance, Guindon et al. (2021) used historical Landsat data to quantify decades of burn severity over the entire country of Canada; Alonso-Gonzalez and Fernandez-Garcia (2021) quantified burn severity globally using both Aqua and Terra MODIS surface reflectance datasets. In addition to the passive optical sensors, light detection and ranging (lidar) onboard airborne or space-borne platforms can assess vertical forest structure and its change over large areas by providing high-resolution and consistent 3-dimensional measurements of ground and vegetation canopy (Kampe et al., 2010; Jung et al., 2011; Atkins et al., 2020; Park, 2020). For instance, Kane et al. (2015) used bi-temporal lidar observations to characterize mixed fire severity within the 2013 Rim fire, and Alonzo et al. (2017) quantified canopy and surface layer consumption in boreal forests using repeated lidar observations. These demonstrate that both passive and active remote sensing data together can provide unique and complementary information on fire severity as well as pre- and post-fire vegetation conditions.
Fires interact with the existing vegetation (i.e., fuels), topography, and weather conditions (Alexander et al., 2006; Birch et al., 2015; Harris and Taylor, 2015). Such interactions characterize fire behavior, burn severity patterns, and ultimately post-fire regeneration. For instance, depending on the level of burn severity, fires could maintain a vegetation type or mediate forest change (Pyne, 1996), or continuously reshape forest stands by restructuring individual trees and tree patches (Turner and Romme, 1994). Pre-fire forest structure, such as the size and arrangement of individual trees, is also a particularly important factor leading to patterns of fire spread and damage (Perry et al., 2011). Over many mixed forests like the GSMNP, fire severity exhibits a considerable spatial variation within a single fire event. However, the degree to which such mixed-severity fires are a result of existing vegetation (fuels), topography, and weather remains poorly understood. Particularly, quantifying the roles of the pre-fire vegetation conditions has been recognized as a research priority because fuel condition is one of factors that can be addressed by land management.
In this study, we aim to understand spatial variation of remotely sensed burn severity measures across gradients of environmental conditions including pre-fire vegetation type and structure, and topography in the GSMNP. First objective of this study is to identify which biophysical factors are important in determining the patterns of burn severity in the 2016 Chimney Tops 2 wildfire. Second objective is to evaluate consistency and inconsistency of burn severity measures from multitemporal Landsat and National Ecological Observatory Network (NEON) lidar data. Section 2 presents the data and methodology. The results of this study are presented in Section 3, and discussions and concluding remarks are presented in Section 4 and Section 5, respectively.
2 Materials and methods
2.1 Study area
Our study region is defined based on the fire perimeter from the Monitoring Trends in Burn Severity (MTBS) database shown in Figure 1A (Eidenshink et al., 2007). The study region covers the area burned by the CT2 fire in 2016 (Figure 1B), and its extent is about 3,994 ha. The selected area’s elevation ranges from 405 m to 1,638 m (Figure 1E). Along the elevation gradient, annual precipitation amounts range from 127 to 203 cm, and they increase with elevation (Shanks, 1954). The mean annual temperature is 13°C varying up to 6.7°C. The GSMNP is ecologically rich and diverse. This park consists of more than 1,600 species of flowering plants, including about 100 native shrub and tree species (Jenkins, 2007). It is one of the largest deciduous, temperate, and old-growth forests that still exist in North America. The distribution of vegetation in the park is strongly influenced by topography, moisture, and other environmental gradients (Whittaker, 1956) (Figure 1C). Before the fire event, most of our study region was densely tree covered (∼98 ± 6%), and the mean forest height was 21.6 ± 7.4 m (Figure 1D, see Section 2.4).
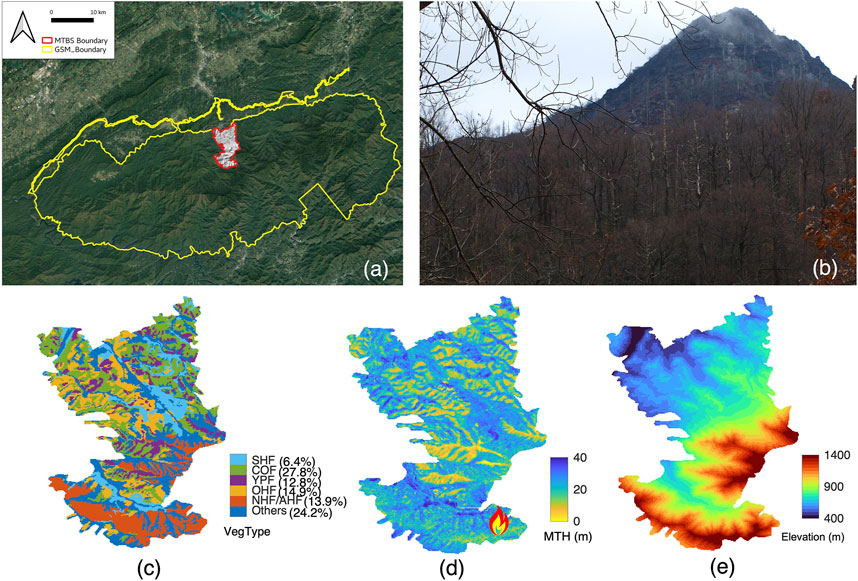
FIGURE 1. Geographical location of 2016 Chimney Tops 2 wildfire in Great Smoky Mountains National Park (A) and a view of burnt forest captured during 2018s field trip (B). Spatial distribution of vegetation type (C), mean forest height (D), and digital elevation (E) over the study region. A fire marker in panel (D) indicates the location of the first fire ignition of the CT2 fire. In panel (C), HF, COF, YPF, OHF, and NHF/AHF stand for successional hardwood forest, chestnut oak forest, yellow pine forest, oak-hickory forest, and northern hardwood/acid hardwood forest, respectively.
2.2 Vegetation type map
The National Park Service developed a seamless and complete GIS vegetation database of GSMNP. Photo interpretation of color infrared aerial photographs (1997–1998), GPS-assisted field observations, and the hierarchical GSM Vegetation Classification System containing over 150 overstory and understory classes were used to create the vegetation database. The vegetation type map is available from https://www.sciencebase.gov/catalog/item/542ecdb6e4b092f17df5ac4a. The overall attribute accuracy of the vegetation type map is 80.4% (Kappa Index = 80.0). The map provides 150 over- and understory forest types, but we only focused on the forest types whose occurrence is more than 5% of the total vegetated area within our study region (Figure 1C). Over the defined study region, Successional Hardwood Forest (SHF), Chestnut Oak Forest (COF), Yellow Pine Forest (YPF), Oak-hickory forest (OHF), Northern hardwood/acid hardwood forest (NHF/AHF), and others occupy 6.4%, 27.8%, 12.8%, 14.9%, 13.9% and 24.2% of the total vegetated regions. We use these six forest types for the following analyses.
2.3 Landsat based burn severity and vegetation indices
To quantify the burn severity of the CT2 fire, we first checked the differenced Normalized Burn Ratio (dNBR) and the burn severity classification from the publicly available MTBS database. In general, Normalized Burn Ratio (NBR, Eq.1) is sensitive to the amount of leaves, moisture, and char or ash in the soil, thus the difference between pre- and post-fire NBR has been often used as a proxy of fire damage. Our initial assessment of MTBS dNBR product showed unexpected biases because of a seasonal mismatch in pre- and post-fire NBR (Eq.2). Also dNBR has been generally considered to have biases due to pre-fire vegetation conditions (Wulder et al., 2009). Thus, in this study, we decided to use the Relativized dNBR, i.e., RdNBR (Eq.3) (Miller and Thode, 2007), and directly compute RdNBR from two cloud-free Landsat 8 OLI L2 surface reflectances collected in 2015 (DOY 257) and 2017 (DOY 246). Note that we alternatively took 2015 as a pre-fire state due to the absence of cloud-free images in 2016. All Landsat data was obtained from Harmonized Landsat and Sentinel (HLS) data archive at https://hls.gsfc.nasa.gov/. The Landsat surface reflectances from HLS are normalized for per-pixel view and per-granule illumination angles (Claverie et al., 2017). View angle is set to nadir and solar zenith is set to a temporally constant value at each tile’s center and varies with latitude. Higher values of the satellite-derived burn severity index (e.g., dNBR and RdNBR) indicate a decrease in photosynthetic and surface materials holding water and an increase in ash, carbon, and soil cover (Miller and Thode, 2007).
where ρnir and ρswir are surface reflectances at near-infrared (NIR, Band 5) and shortwave infrared (SWIR, Band 7) wavelengths. NBRpre and NBRpost stand for pre- and post-fire NBR values.
Additionally, we also calculated the Normalized Difference Vegetation Index (NDVI), Normalized Difference Moisture Index (NDMI), and Land Surface Temperature (LST) from the pre- and post-fire Landsat images. NDVI quantifies the amount of living green plant material and is linearly related to absorbed photosynthetically active radiation (e.g., Sellers, 1985). It is calculated from contrasting reflectances at near-infrared (ρnir) and red (ρred) bands (Rouse et al., 1974) (Eq.4):
The NDMI uses NIR and SWIR bands to create a difference ratio that is sensitive to the moisture levels in vegetation (Eq.5) (Wilson and Sader, 2002). It has been widely used to monitor droughts and fuel levels in fire-prone areas. Note that SWIR bands for NBR and NDMI are different: Band 7 (2.11–2.29 μm) and 6 (1.57–1.65 μm) were used for NBR and NDMI, respectively.
To retrieve Landsat-based LST, we followed the approach proposed by Avdan and Jovanovska (2016). Since temperature is the main controller of fuel moisture content that is associated with fire ignition, spread, and other fire behavior, LST is expected to have some degree of relation with burn severity. We first computed Pv from NDVI, which is a measure of vegetation proportion in each pixel (Eq. 6). Based on the computed Pv, land surface emissivity (Eq. 7) and LST are sequentially calculated (Eq. 8). Note that the top-of-atmosphere brightness temperature (BT) required in Eq. 8 was directly obtained from the Landsat L2 product.
where 0.004 and 0.986 correspond to the average emissivity of bare soil and vegetated areas, respectively (Sobrino and Raissouni, 2000).
where, BT = brightness temperature; λ = wavelength; ϱ = constant of Boltzmann; and ε = surface emissivity.
2.4 NEON lidar data and vegetation structural variables
NEON Airborne Observation Platform (AOP) has collected lidar data over the GSMNP regions on an annual basis using the Optech ALTM Gemini (Vaughan, ON, Canada) (Kampe et al., 2010; Kane et al., 2014). The AOP has collected full-waveform lidar data over the GSMNP regions since 2016. The lidar produced about 4 laser points per square meter, with a maximum of 5 returns per point. In this study, we used the lidar data collected in June 2016 and June 2018 to investigate changes in pre- and post-fire GSMSP forest structure. Note that we chose 2018 data as a post-fire lidar collection rather than 2017 (October) to avoid a seasonal mismatch between pre- and post-fire lidar data (Calders et al., 2015). The digital terrain model (DTM) and canopy height model (CHM) were generated at 1 m spatial resolution following standard NEON-generated processing algorithms (Kampe et al., 2010). To facilitate analyses of spectral and structural changes derived from Landsat and lidar, we resampled 1 m lidar data into 30 m spatial resolution, which is comparable to Landsat spatial resolution. All lidar-derived structural variables are geometrically co-registered to ensure the same location is assessed by Landat-based land surface variables. Mean tree height (MTH) was used to summarize forest canopy structure in this study, calculated as the average of 1 m canopy heights within 30 m grid cells. We also introduced fractional tree cover (TC) calculated as the percent of 1 m pixels >2 m in height within a 30 m grid cell. Pre- and post-fire MTH were used to quantify forest structural changes induced by the CT2 fire, i.e., RdMTH. The RdMTH is a relativized form by normalizing differences with pre-fire conditions, as below.
2.5 Analytical approach for modeling burn severity
Our primary objective is to identify key controlling factors in characterizing burn severity patterns of the CT2 fire. Topographical features and pre-fire vegetation conditions were the main explanatory variables. We used elevation, slope, aspect, and topographic position index (TPI) (Jenness, 2006) as topographical features. TPI is an index showing the morphological characteristics of landscapes. It shows the difference in elevation between a focal cell and all cells in the neighborhood (Jenness, 2006). In the case of plan curvature, negative curvatures illustrate concave, zero curvature represents flat, whereas positive curvatures are known as convex. This index not only can provide important morphological characteristics but also hydrological (e.g., soil wetness, snow accumulation, etc.) variations of the study region (e.g., Choubin et al., 2019).
A random forest regression model was used in this study to quantify the factors explaining the spatial patterns of satellite and lidar observed fire damage over the GSMNP. Random forest regression is a non-parametric statistical method, and it does not require distributional assumptions on covariates in relation to the response variable (Breiman, 2001). In this study, we set 100 binary decision trees in the model, and each node is split using the best break among all variables. Note that we identify the optimal number of decision trees through experimental model runs (not shown here). The explanatory covariates used can be categorized into two groups: topographical features, i.e., Elevation, Aspect, Slope, TPI, and pre-fire vegetation composition and structure, i.e., vegetation type, NDVIpre, NDMIpre, LSTpre, MTHpre, and TCpre. We also computed variable importance from the random forest regression model. The variable importance is a measure based on how much the error increases when the variable is excluded. A larger error before and after permutation means greater importance of the variable in the model and contributes more to predictive accuracy than other variables (Breiman, 2001). The relationship between explanatory variables and target fire severity indices (here, RdNBR and dMTH) was also evaluated using partial dependence plots, which display the marginal effect of an individual predictor on the response variable (Liaw and Wiener, 2002). Additionally, to understand compounding interactions between pre-fire vegetation conditions and topography, we also investigated how topographical features characterize spatial distribution of vegetation type and structure, i.e., MTHpre. All random forest analyses were carried out with the “treebagger” package in Matlab (R2021a).
3 Results
3.1 Burn severity patterns of 2016 Chimney Tops 2 wildfire
Fire severity across our study region was highly variable (Figure 2). Our Landsat- (RdNBR) and lidar- (RdMTH) based analyses show a similar spatial pattern of fire damage during the CT2 fire (Figures 2A,C). In particular, we observed widespread, severe, and patchy damaged forests over the central and northeastern parts of the study region. According to the fire severity classification based on RdNBR thresholds defined by Miller and Thode (Miller and Thode, 2007) (Figures 2E,F), the CT2 fire burned approximately 2,608 ha (RdNBR>=69), whereas the rest of the region (1,386 ha) was not likely damaged by the fire. About half (1,333 ha) of the burned regions are damaged with a low degree (69<=RdNBR<=315) of fire severity and the other two one-fourths of the regions are categorized as moderate (566 ha, 22%) (316<=RdNBR<=640) and high (708 ha, 27%) (641<=RdNBR) severity class.
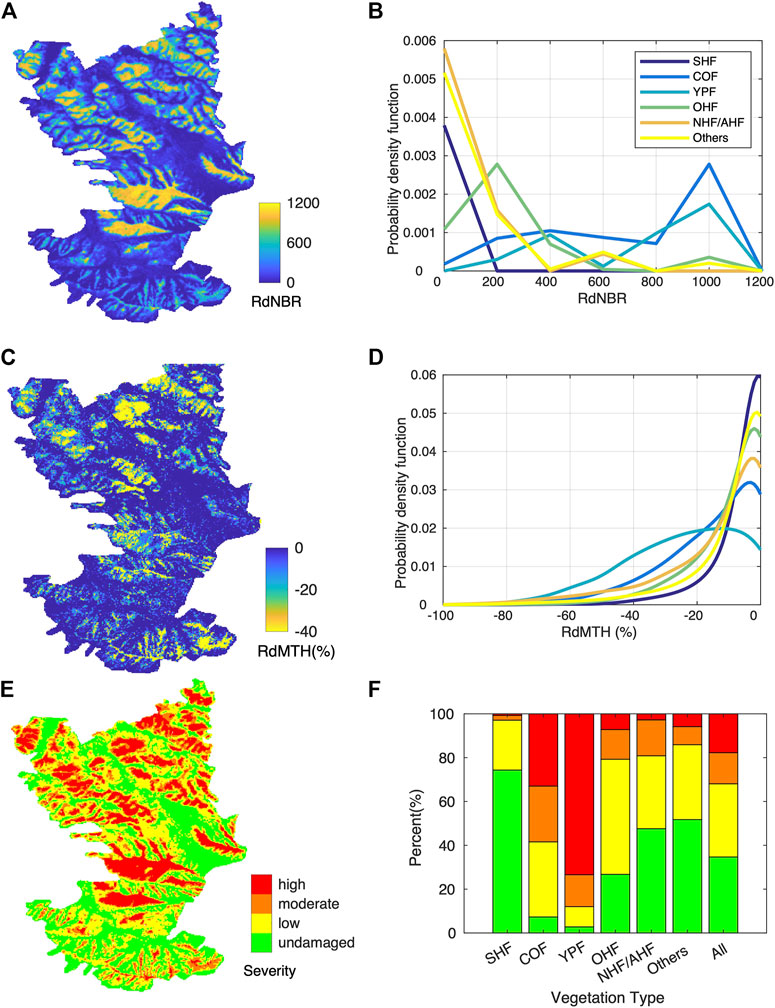
FIGURE 2. Spatial pattern of the relativized differenced Normalized Burn Ratio (RdNBR) (A), relativized mean tree height (C), and burn severity classification based on the RdNBR thresholds defined by Miller and Thode (Miller and Thode, 2007) (E). Probability density function (pdf) of RdNBR (B) and RdMTH (D) by vegetation type classes. (F) Vegetation type specific distribution of burn severity classes. Green, yellow, orange, and red stand for undamaged, low, moderate, and high severity class. HF, COF, YPF, OHF, and NHF/AHF stand for successional hardwood forest, chestnut oak forest, yellow pine forest, oak-hickory forest, and northern hardwood/acid hardwood forest, respectively.
Burn severity varies significantly by forest type. The resulting patterns from both RdNBR and RdMTH indicate that Yellow Pine Forest covered regions were most severely damaged by the CT2 fire and followed by Chestnut Oak Forest (Figures 2B,D). More than 70% and 30% of the Yellow Pine Forest and Chestnut Oak Forest were impacted by high burn severity (based on RdNBR), and it links to about 24% and 15% of MTH reduction respectively. In contrast, most Successional Hardwood Forest and Northern hardwood/acid hardwood forest -covered regions were undamaged or lightly damaged (only −3.9 and −8.7% of RdMTH, respectively). Though both severity measures display a predominant spatial agreement, we found that there is a discernible discrepancy over the central region near the Bull Head peak where relatively shorter Yellow Pine Forest canopies dominated. This discrepancy will be further reported and discussed in the following section (Section 3.3).
3.2 Importance of pre-fire vegetation structure and topography
To identify explanatory variables playing key roles in characterizing spatial patterns of burn severity, we developed RF-models for RdNBR and RdMTH, and quantified the importance of the variables (Figure 3). The RF-based models for both RdNBR and RdMTH reasonably well capture the spatial variation of the CT2 fire induced burn severity. The developed model for RdNBR (N = 6,768) can explain 94% of variation. MTHpre, elevation, TPI, vegetation type, and slope are the five most important variables identified in this model. Interestingly, we also find MTHpre, TPI, slope, and elevation are key variables in explaining forest structural changes, i.e., RdMTH. Our analysis shows that the RF-model for MTHpre (N = 6,768) can capture 80% of variation in the tree height changes in the CT2 fire. In addition, our analysis identifies the pre-fire canopy moisture level (NDMIPre) and land surface temperature (LSTPre) important in the burn severity characterization. However, the RF-model for the RdMTH tends to overestimate severely damaged forests that experienced greater than 40% of MTH reduction. We initially anticipated that vegetation type plays an important role in characterizing burn severity patterns due to species-specific fire flammability and resistance (Popović et al., 2021). However, our results suggest that vegetation type is less important in the CT2 fire likely due to confounding interaction with other variables (e.g., elevation, MTHpre, etc.). We further discuss its importance and relation with other variables in the latter part of this section.
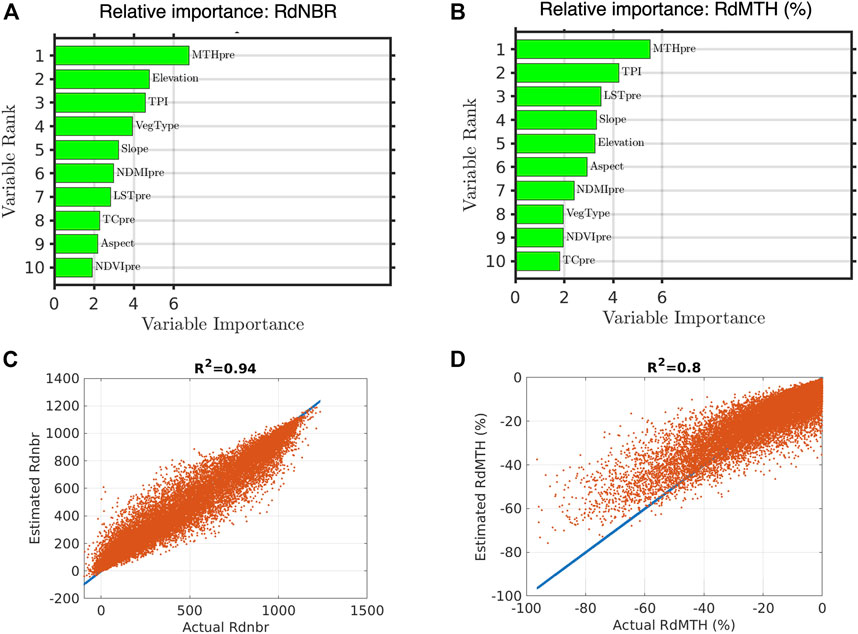
FIGURE 3. Variable importance quantified from the random forest model for the RdNBR (A) and RdMTH (B). The performance of the models for the RdNBR (C) and RdMTH (D) evaluated with independent testing data.
Figure 4 and Figure 5 demonstrate the partial dependence of each explanatory variable on regulating the RdNBR and RdMTH, respectively. First, both partial dependence plots for the RdNBR and RdMTH reveal that fire damage increases with higher elevation and decreases with lower elevation. Despite general agreement in the tendency of partial dependence, we noticed that RdNBR based severity rapidly increases from low to medium elevation whereas RdMTH-based severity increases from medium to high elevation range. Shorter pre-fire canopy heights tend to be more damaged whereas taller trees tend to be less damaged. Higher land surface temperature likely increases the degree of burn severity for both Landsat- and lidar-based burn severity metrics. Other important topographical features identified are slope and TPI. These two features together suggest that burn severity is generally higher in upper and steep hills whereas the bottom of the valley with flat conditions is likely less damaged. In the case of RdNBR, we find an obvious pattern showing that south-facing forest stands experience higher damage while north-facing stands tend to be less damaged. This aspect-dependent relation is also evident in the RdMTH but the severity peaks at south and south-east facing forests. Our partial dependence analysis from both Landsat RdNBR and lidar RdMTH data shows vegetation type dependent burn severity patterns confirming two most severely damaged forests (Yellow Pine Forest and Chestnut Oak Forest) and two least damaged forests (Successional Hardwood Forest and other forest class). For the case of TC, we find opposite patterns in RdNBR and RdMTH indicating an increase of RdNBR and a decrease of RdMTH over higher tree covered regions. In the RF model for RdMTH, lower pre-fire NDMI which is a proxy of vegetation moisture content burned more severely than those with higher NDMIpre but this pattern is not consistent in the RdNBR though it is a less important variable.
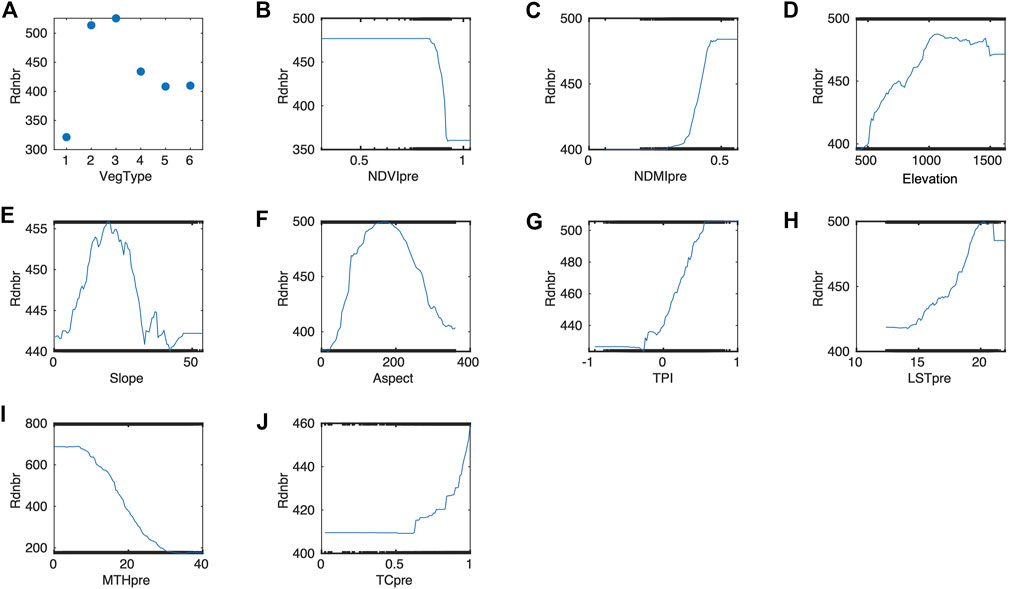
FIGURE 4. Partial dependence plots of explanatory variables (n = 10) on regulating RdNBR of the CT2 fire in Great Smoky Mountains National Park: (A) Vegetation type, (B) NDVIpre, (C) NDMIpre, (D) Elevation, (E) Slope, (F) Aspect, (G) TPI, (H) LSTpre, (I) MTHpre, and (J) TCpre. In panel (A), numbers stand for six vegetation type classes, i.e., HF, COF, YPF, OHF, NHF/AHF, and others, respectively.
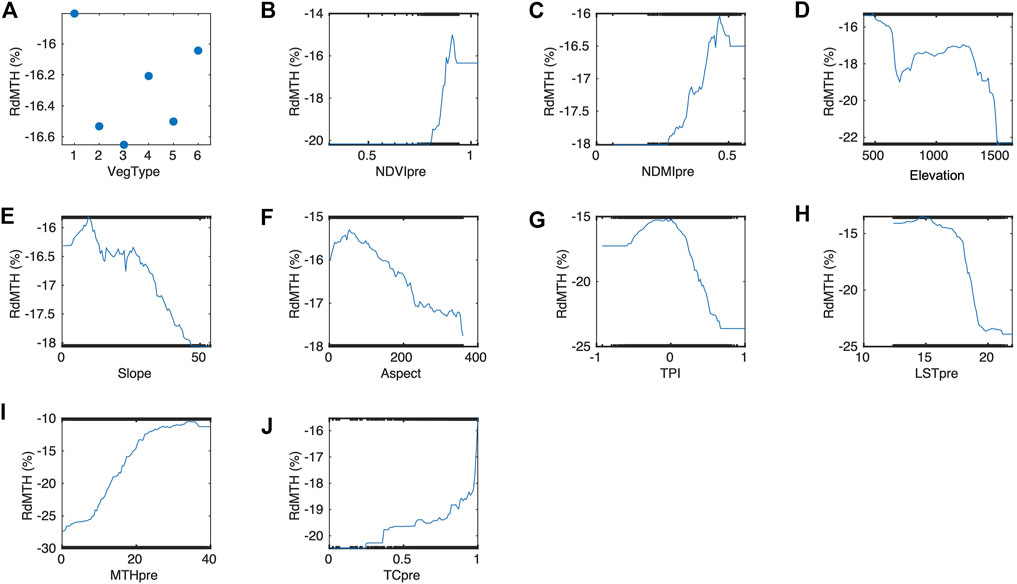
FIGURE 5. Partial dependence plots of explanatory variables (n = 10) on regulating RdMTH of the CT2 fire in Great Smoky Mountains National Park: (A) Vegetation type, (B) NDVIpre, (C) NDMIpre, (D) Elevation, (E) Slope, (F) Aspect, (G) TPI, (H) LSTpre, (I) MTHpre, and (J) TCpre. In panel (A), numbers stand for six vegetation type classes, i.e., HF, COF, YPF, OHF, NHF/AHF, and others, respectively.
The pre-fire vegetation structure and topographical features derived from the NEON AOP lidar data over the GSMNP were identified as key explanatory variables in explaining spatial burn severity patterns measured from both multitemporal Landsat and lidar data (Figure 3). We initially anticipated that vegetation type can be a key variable as species-dependent fire resistance may play a critical role in determining fuel characteristics and severity patterns (Hengst and Dawson, 1994; Fernández-Guisuraga et al., 2021). In contrast, our results suggest that vegetation type is relatively less important in the CT2 fire. We then hypothesized that topographical features govern forest type occurrence and structure, thus these variables are standing out from our analyses. To test this hypothesis, we further investigated how topography alone can explain forest type occurrence and structure. The results shown in Supplementary Figures S1, S2 supported our hypothesis. Particularly, elevation and aspect could reasonably predict spatial distribution of MTHpre. Aspect and TPI were identified as important features of forest type distribution. Supplementary Figure S3 shows distribution of species with respect to environmental conditions. In general, north- and northeast-facing slopes at higher elevation are most likely to have Northern hardwood/acid hardwood forest, and other forest types, whereas we found more Chestnut Oak Forest and Yellow Pine Forest over lower elevation with south- and southwest-facing slopes. Partial dependence of TPI implies that the upper hill is the most favorable location for Chestnut Oak Forest and Yellow Pine Forest and the bottom of the valley is much favorable for the other forest class. These topographical controls on forest type distribution also strongly limit tree growth, i.e., taller trees in north facing, shorter trees in south facing. For instance, trees in the Yellow Pine Forest, that face north and are located at the bottom of the valley, reach ∼25 m, but trees facing south are only 10 m tall at the top of the ridge. Topographic associations between valley bottoms and vegetation growth, i.e., MTHpre, likely reflect more favorable edaphic conditions along the channel banks, as well as more sheltered microclimates and available water (Moeslund et al., 2013a; Moeslund et al., 2013b). As a whole, the observed spatial pattern of forest type distribution and their height growth suggest a closely linked biogeographical niche governed by topography-mediated microclimate and forest structure (Moeslund et al., 2013a; Moeslund et al., 2013b). This close association between pre-fire vegetation composition/structure and local topography indicates there are discernible compounding interactions between these factors on burn severity patterns.
3.3 Comparison between Landsat- and lidar-based burn severity measures
Our analyses reveal how two different burn severity measures from Landsat and lidar perform in the CT2 fire case (Figure 6). Complementary analysis reveals that spectral burn severity indices from Landsat including dNDVI (= NDVIpre-NDVIpost), dNBR, and RdNBR tightly share their variations (Supplementary Figure S4). It indicates that they could capture fire-induced damage in a similar manner. Yet, relations between spectral indices and lidar structural variables tend to be linear at low and moderate burn severity levels (based on RdNBR) but their linearity turns to non-linear at higher damage class (>800 RdNBR) (Figure 6). This non-linear relation is even inverted when RdNBR is greater than ∼950. This inverted relation explains why RdNBR and RdMTH display inconsistent burn severity patterns in the central part (near the Bull Head peak) of our study region (Figures 2A,C). Interestingly, these relations between RdNBR and RdMTH are invariant across vegetation classes except Northern hardwood/acid hardwood forest stands. We find that about two times less RdNBR changes in Northern hardwood/acid hardwood forest than in the other five classes with respect to the change in MTH. For instance, 20% of MTH reduction in Northern hardwood/acid hardwood forest and other five forest classes mean ∼400 and ∼800 of RdNBR, respectively. This implies a varying sensitivity of RdNBR to structural changes in different forest types.
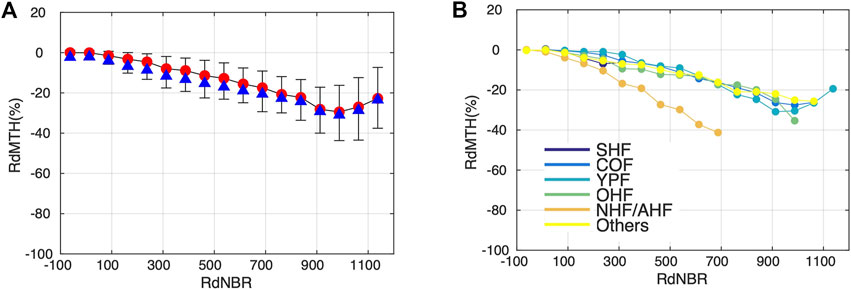
FIGURE 6. Comparison between burn severity measures (RdNBR and dMTH) from passive and active remote sensing sensors. Relations from all vegetation types and each type shown in (A) and (B) respectively. In panel (A), the red circle and blue triangle represent median and mean values, and error bars stand for the 25th and 75th percentile. In panel (B), the colored circles represent median values of each vegetation type.
In addition to vegetation type dependent varying sensitivity of RdNBR to RdMTH, we also find a varying sensitivity of RdNBR to RdMTH over different pre-fire forest structures (Figure 7). To the increase of RdNBR, taller and old growth forests tend to have less dynamic RdMTH change than shorter and younger forest stands. This structure dependent response likely causes the observed non-linear and inverse relation between RdMTH and RdNBR at high-severity burn (Figure 6).
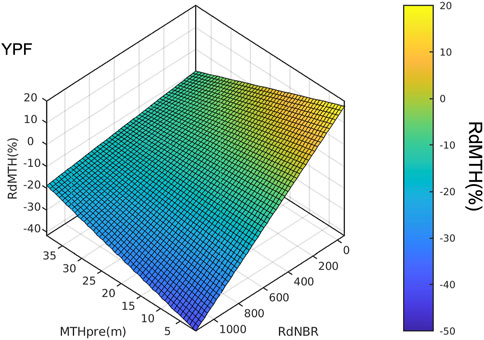
FIGURE 7. Relations between MTHpre, RdMTH, and RdNBR in yellow pine forests (YPF).
4 Discussion
The topographical features derived from the NEON AOP lidar data over the GSMNP were identified as key explanatory variables in explaining spatial burn severity patterns. Generally, topography including elevation, topographic position, aspect, and slope plays an important role in determining local patterns of potential incident solar radiation. Topography-induced variation in solar energy can influence local vegetation patterns and flammability through multiple mechanisms: soil moisture, temperature, and light availability (Lydersen and North, 2012; Moeslund et al., 2013a). For instance, southern aspects generally receive more sunlight leading to more xeric and warmer conditions (Stage, 1976) (Supplementary Figures S3A, D) and thus resulting in drier fuels and smaller trees (Supplementary Figure S3G), which may burn with greater severity. Furthermore, topography is also a determinant of fire spread behavior. Fire spreads more readily upslope than downslope, and daytime upslope winds that develop from differential heating in mountainous terrain can drive upslope fire spread (Weng et al., 2004; Werth et al., 2011). Middle and upper slope positions often experience higher fire line intensities because of higher effective wind speeds, lower canopy cover, and preheating of fuels as fires move upslope (Figure 4G; Figure 5G) (Rothermel, 1983).
The association we observed between pre-fire structure (i.e., MTHpre) and fire severity may be linked to several mechanisms. Because taller trees usually have bigger stems and thicker bark, it has been linked to the reduced fire-induced mortality (Hély et al., 2003). Alternatively, fuel characteristics over large tree dominated areas may have been burned less intensely (Figure 4I; Figure 5I). Thus, the patterns we observed may have been created by variation in fire intensity, spreading pattern, variation in the susceptibility of trees to damage and mortality, or a combination of these factors. Another potential confounding issue is that there is a historical disturbance gradient within the fire footprint where higher elevations were minimally disturbed and lower elevations were progressively more disturbed in the early part of the 20th century. This disturbance has likely had a range of effects on vegetation structure and composition, either directly or through changes to soils (Tucker, 1979; Tuttle and White, 2016).
In this study, we did not include weather variables (e.g., temperature, humidity, wind, etc.) in characterizing spatial patterns of burn severity since spatially explicit weather data was not available at a fine scale. According to the regional weather data (Supplementary Figure S5), November of 2016 when the CT2 fire happened was a very dry month (and year) with unprecedented wind gusts (National Park Service, 2017). Under extreme fire conditions, we expect that local weather conditions may play a significant role in determining fire spread and severity patterns (Viedma et al., 2020). Without accounting for fire weather, however, our RF-based analyses could explain a significant portion of the spatial variation of burn severity (R2 of RdNBR = 0.94, R2 of RdMTH = 0.8). This is likely because our analysis indirectly accounted for weather-induced burn severity patterns by introducing proxies such as topography, canopy moisture level, and land surface temperature which govern fire spread and microclimate conditions. Our RF-based analysis revealed that LST is an important variable for both RdNBR and RdMTH modeling. Hotter land surfaces in the study region tend to be severely damaged whereas cooler surfaces are less damaged. Further, interactions between topography (and/or pre-fire vegetation) and weather conditions (e.g., wind direction) might reflect fire-weather interaction into the developed RF-models.
In this study, by comparing burn severity measures from Landsat and lidar observations, we confirmed that there is a generally good agreement between spectral (RdNBR) and structural (RdMTH) measures (Wulder et al., 2009; McCarley et al., 2017). However, vegetation type and pre-fire structure dependent RdNBR sensitivities were noticed (Figure 6; Figure 7). We observed unexpected non-linear and inverse relations between RdMTH and RdNBR at highly damaged forests (Figure 6). Possible explanations for the observed pattern are twofold: First, residual structures such as dead standing trees were still measurable from the post-fire lidar observation but its spectral responsiveness is low to the RdNBR (see Figure 1B; Figure 8) (Bolton et al., 2015). Second, understory, subcanopy, and/or soil burning may increase RdNBR significantly but not RdMTH because RdMTH represents more upper canopy status than lower canopy and/or soil. Spectral burn severity indices from Landsat NIR and SWIR bands generally provide how much photosynthetically active vegetation is damaged by fire events. Surface reflectances at different wavelengths are a result of photon interaction with vegetation media and soil, however, the lidar based matrix we used represents mostly changes in upper canopy status rather than lower canopy and near-surface vegetation. This difference may result in the observed discrepancy in burn severity measures.
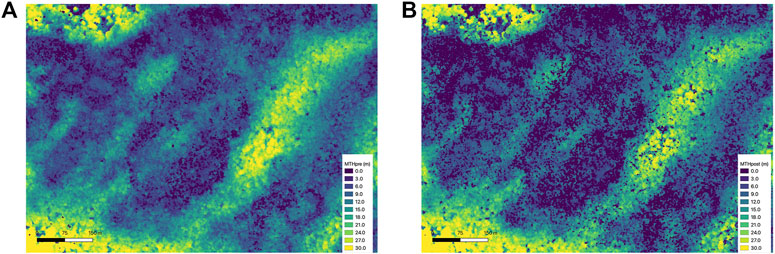
FIGURE 8. Pre- (A) and post-fire (B) mean tree height near the Bull Head peak where Landsat and lidar based burn severity measures show inconsistent patterns.
Over the GSMNP regions, NEON AOP collected lidar data on an annual basis since 2016. The collected multi-temporal lidar observations are fortunate and grant a unique opportunity to understand how the CT2 fire event modified the GSMNP forests and what environmental factors primarily characterize spatial variability of burn severity over the highly mixed severity fire. Furthermore, future repeat lidar data acquisition over the GSMNP can offer insight into processes of forest regeneration after fire events across varying degrees of burn severity, topography, and pre-fire vegetation structure and composition. A growing number of repeat lidar data acquisition allows us to investigate forest structural changes after disturbance by providing multidimensional information. In addition to the GSMNP, the repeating lidar collections over a range of ecosystems and disturbance histories are already available within the NEON sites (Atkins et al., 2020) and other long-term research sites (e.g., G-LiHT, LVIS, etc.) (Leitold et al., 2021). Repetitive spaceborne lidar measurements from NASA Global Ecosystem Dynamics Investigation (GEDI) and ICESat-1and2 also expand our capability to sample multi-temporal forest structure characteristics and its changes (Neuenschwander and Pitts, 2019; Dubayah et al., 2020). Synergistic uses of such high spatial resolution multi-temporal 3-D data with optical passive sensors (e.g., Landsat, Sentinel-2, etc.) and other supporting measurements (e.g., field measurements) will greatly improve our understanding of carbon turnover, the timing and duration of subsequent changes in forest structure, and the associated impacts on productivity, demography, runoff, and nutrient cycling across ecosystems.
5 Concluding remarks
We used multitemporal Landsat and lidar observations to quantify fire severity at the GSMNP. Our analysis revealed that the CT2 fire was a mixed-severity fire, and about 22% and 27% of the burned area was damaged moderately and severely. We found that topography and pre-fire vegetation structure played significant roles in characterizing heterogeneous mixed burn severity patterns. Elevation, mean tree height, and topographic position emerged as key controlling factors. We generally observed consistent spatial patterns from Landsat and lidar-based severity measures. However, vegetation type and pre-fire structure-dependent relations between RdNBR and RdMTH caused locally inconsistent severity, particularly in high RdNBR regions. Our study highlights the critical roles of topography and pre-fire vegetation structure in understanding burn severity patterns and urges to integrate both spectral and structural changes to fully map fire impacts on forests.
Data availability statement
All data used in this study is publicly available. The vegetation type map used in this study is available in https://www.sciencebase.gov/catalog/item/542ecdb6e4b092f17df5ac4a. Landsat and NEON airborne lidar data used in this study are available in https://hls.gsfc.nasa.gov/ and https://data.neonscience.org/, respectively.
Author contributions
TP and SS designed the research; TP performed analysis; TP and SS interpreted the results, wrote the draft, and revised the paper. All authors contributed to the article and approved the submitted version.
Funding
This work is supported by the 2022-2023 College of Arts and Sciences Research Grant Fund at University of North Alabama and the Ben H. Craig Professorship of Geography, University of North Alabama.
Acknowledgments
TP gratefully acknowledges the support from NASA Earth Science Directorate (ESD).
Conflict of interest
The authors declare that the research was conducted in the absence of any commercial or financial relationships that could be construed as a potential conflict of interest.
Publisher’s note
All claims expressed in this article are solely those of the authors and do not necessarily represent those of their affiliated organizations, or those of the publisher, the editors and the reviewers. Any product that may be evaluated in this article, or claim that may be made by its manufacturer, is not guaranteed or endorsed by the publisher.
Supplementary material
The Supplementary Material for this article can be found online at: https://www.frontiersin.org/articles/10.3389/frsen.2023.1096000/full#supplementary-material
References
Alexander, J. D., Seavy, N. E., Ralph, C. J., and Hogoboom, B. (2006). Vegetation and topographical correlates of fire severity from two fires in the Klamath-Siskiyou region of Oregon and California. Int. J. Wildland Fire 15, 237–245. doi:10.1071/wf05053
Alonso-González, E., and Fernández-García, V. (2021). Mosev: A global burn severity database from MODIS (2000–2020). Earth Syst. Sci. Data 13, 1925–1938. doi:10.5194/essd-13-1925-2021
Alonzo, M., Morton, D. C., Cook, B. D., Andersen, H.-E., Babcock, C., and Pattison, R. (2017). Patterns of canopy and surface layer consumption in a boreal forest fire from repeat airborne lidar. Environ. Res. Lett. 12, 065004. doi:10.1088/1748-9326/aa6ade
Atkins, J. W., Bond-Lamberty, B., Fahey, R. T., Haber, L. T., Stuart-Haëntjens, E., Hardiman, B. S., et al. (2020). Application of multidimensional structural characterization to detect and describe moderate forest disturbance. Ecosphere 11, e03156. doi:10.1002/ecs2.3156
Avdan, U., and Jovanovska, G. (2016). Algorithm for automated mapping of land surface temperature using LANDSAT 8 satellite data. J. sensors 2016, 1–8. doi:10.1155/2016/1480307
Birch, D. S., Morgan, P., Kolden, C. A., Abatzoglou, J. T., Dillon, G. K., Hudak, A. T., et al. (2015). Vegetation, topography and daily weather influenced burn severity in central Idaho and Western Montana forests. Ecosphere 6, 1–23. doi:10.1890/es14-00213.1
Bolton, D. K., Coops, N. C., and Wulder, M. A. (2015). Characterizing residual structure and forest recovery following high-severity fire in the Western boreal of Canada using Landsat time-series and airborne lidar data. Remote Sens. Environ. 163, 48–60. doi:10.1016/j.rse.2015.03.004
Calders, K., Schenkels, T., Bartholomeus, H., Armston, J., Verbesselt, J., and Herold, M. (2015). Monitoring spring phenology with high temporal resolution terrestrial LiDAR measurements. Agric. For. Meteorology 203, 158–168. doi:10.1016/j.agrformet.2015.01.009
Choubin, B., Borji, M., Mosavi, A., Sajedi-Hosseini, F., Singh, V. P., and Shamshirband, S. (2019). Snow avalanche hazard prediction using machine learning methods. J. Hydrology 577, 123929. doi:10.1016/j.jhydrol.2019.123929
Claverie, M., Masek, J. G., Ju, J., and Dungan, J. L. (2017). Harmonized landsat-8 sentinel-2 (HLS) product user’s guide. Washington, DC, USA: National Aeronautics and Space Administration.
Cohen, D., Dellinger, B., Klein, R., and Buchanan, B. (2007). Patterns in lightning-caused fires at great smoky mountains national park. Fire Ecol. 3, 68–82. doi:10.4996/fireecology.0302068
Dubayah, R., Blair, J. B., Goetz, S., Fatoyinbo, L., Hansen, M., Healey, S., et al. (2020). The global ecosystem dynamics investigation: High-resolution laser ranging of the earth’s forests and topography. Sci. remote Sens. 1, 100002. doi:10.1016/j.srs.2020.100002
Eidenshink, J., Schwind, B., Brewer, K., Zhu, Z.-L., Quayle, B., and Howard, S. (2007). A project for monitoring trends in burn severity. Fire Ecol. 3, 3–21. doi:10.4996/fireecology.0301003
Fernández-Guisuraga, J. M., Suárez-Seoane, S., García-Llamas, P., and Calvo, L. (2021). Vegetation structure parameters determine high burn severity likelihood in different ecosystem types: A case study in a burned mediterranean landscape. J. Environ. Manag. 288, 112462. doi:10.1016/j.jenvman.2021.112462
Guindon, L., Gauthier, S., Manka, F., Parisien, M.-A., Whitman, E., Bernier, P., et al. (2021). Trends in wildfire burn severity across Canada, 1985 to 2015. Can. J. For. Res. 51, 1230–1244. doi:10.1139/cjfr-2020-0353
Guthrie, V., Finucane, M., Keith, P., and Stinnett, D. (2017). After action review of the november 28, 2016. United States: Firestorm.
Harris, L., and Taylor, A. H. (2015). Topography, fuels, and fire exclusion drive fire severity of the Rim fire in an old-growth mixed-conifer forest, yosemite national park, USA. Yosemite Natl. Park, U. S. A. Ecosyst. 18, 1192–1208. doi:10.1007/s10021-015-9890-9
Hély, C., Flannigan, M., and Bergeron, Y. (2003). Modeling tree mortality following wildfire in the southeastern Canadian mixed-wood boreal forest. For. Sci. 49 (4), 566–576. doi:10.1093/forestscience/49.4.566
Hengst, G. E., and Dawson, J. O. (1994). Bark properties and fire resistance of selected tree species from the central hardwood region of North America. Can. J. For. Res. 24, 688–696. doi:10.1139/x94-092
Jenkins, M. A. (2007). Vegetation communities of great smoky mountains national park. Southeast. Nat. 6, 35–56. doi:10.1656/1528-7092(2007)6[35:vcogsm]2.0.co;2
Jenness, J. (2006). Topographic Position Index (tpi_jen. avx) extension for ArcView 3. x, v. 1.3 a. United States: Jenness Enterprises.
Jung, S.-E., Kwak, D.-A., Park, T., Lee, W.-K., and Yoo, S. (2011). Estimating crown variables of individual trees using airborne and terrestrial laser scanners. Remote Sens. 3, 2346–2363. doi:10.3390/rs3112346
Kampe, T. U., Johnson, B. R., Kuester, M. A., and Keller, M. (2010). Neon: The first continental-scale ecological observatory with airborne remote sensing of vegetation canopy biochemistry and structure. J. Appl. Remote Sens. 4, 043510. doi:10.1117/1.3361375
Kane, V. R., Cansler, C. A., Povak, N. A., Kane, J. T., McGaughey, R. J., Lutz, J. A., et al. (2015). Mixed severity fire effects within the Rim fire: Relative importance of local climate, fire weather, topography, and forest structure. For. Ecol. Manag. 358, 62–79. doi:10.1016/j.foreco.2015.09.001
Kane, V. R., North, M. P., Lutz, J. A., Churchill, D. J., Roberts, S. L., Smith, D. F., et al. (2014). Assessing fire effects on forest spatial structure using a fusion of Landsat and airborne LiDAR data in Yosemite National Park. Remote Sens. Environ. 151, 89–101. doi:10.1016/j.rse.2013.07.041
Kelly, L. T., Giljohann, K. M., Duane, A., Aquilué, N., Archibald, S., Batllori, E., et al. (2020). Fire and biodiversity in the anthropocene. Science 370, eabb0355. doi:10.1126/science.abb0355
Leitold, V., Morton, D. C., Martinuzzi, S., Paynter, I., Uriarte, M., Keller, M., et al. (2021). Tracking the rates and mechanisms of canopy damage and recovery following Hurricane Maria using multitemporal lidar data. bioRxiv.
Lydersen, J., and North, M. (2012). Topographic variation in structure of mixed-conifer forests under an active-fire regime. Ecosystems 15, 1134–1146. doi:10.1007/s10021-012-9573-8
McCarley, T. R., Kolden, C. A., Vaillant, N. M., Hudak, A. T., Smith, A. M., Wing, B. M., et al. (2017). Multi-temporal LiDAR and Landsat quantification of fire-induced changes to forest structure. Remote Sens. Environ. 191, 419–432. doi:10.1016/j.rse.2016.12.022
Miller, J. D., and Thode, A. E. (2007). Quantifying burn severity in a heterogeneous landscape with a relative version of the delta Normalized Burn Ratio (dNBR). Remote Sens. Environ. 109, 66–80. doi:10.1016/j.rse.2006.12.006
Moeslund, J. E., Arge, L., Bøcher, P. K., Dalgaard, T., Odgaard, M. V., Nygaard, B., et al. (2013a). Topographically controlled soil moisture is the primary driver of local vegetation patterns across a lowland region. Ecosphere 4, art91–26. doi:10.1890/es13-00134.1
Moeslund, J. E., Arge, L., Bøcher, P. K., Dalgaard, T., and Svenning, J.-C. (2013b). Topography as a driver of local terrestrial vascular plant diversity patterns. Nordic J. Bot. 31, 129–144. doi:10.1111/j.1756-1051.2013.00082.x
National Park Service (2017). Chimney tops 2 fire ReviewIndividual fire review report. Berlin, Germany: Springer.
Neuenschwander, A., and Pitts, K. (2019). The ATL08 land and vegetation product for the ICESat-2 Mission. Remote Sens. Environ. 221, 247–259. doi:10.1016/j.rse.2018.11.005
Park, T. (2020). Potential lidar height, intensity, and ratio parameters for plot dominant species discrimination and volume estimation. Remote Sens. 12, 3266. doi:10.3390/rs12193266
Perry, D. A., Hessburg, P. F., Skinner, C. N., Spies, T. A., Stephens, S. L., Taylor, A. H., et al. (2011). The ecology of mixed severity fire regimes in Washington, Oregon, and Northern California. For. Ecol. Manag. 262, 703–717. doi:10.1016/j.foreco.2011.05.004
Popović, Z., Bojović, S., Marković, M., and Cerdà, A. (2021). Tree species flammability based on plant traits: A synthesis. Sci. Total Environ. 800, 149625. doi:10.1016/j.scitotenv.2021.149625
Pyne, S. J. (1996). “Wild hearth a prolegomenon to the cultural fire history of northern Eurasia,” in Fire in ecosystems of boreal eurasia (Berlin, Germany: Springer), 21–44.
Rothermel, R. C. (1983). Field procedures for verification and adjustment of fire behavior predictions. United States: US Department of Agriculture, Forest Service, Intermountain Forest and Range.
Rouse, J. W., Haas, R. H., Schell, J. A., and Deering, D. W. (1974). “Monitoring vegetation systems in the great plains with ERTS: Proceedings of the third earth resources technology satellite-1 symposium,” in NASA SP-351, United States, CA, 01 January 1974, 301–317.
Schwartz, N. B., Urban, D. L., White, P. S., Moody, A., and Klein, R. N. (2016). Vegetation dynamics vary across topographic and fire severity gradients following prescribed burning in Great Smoky Mountains National Park. For. Ecol. Manag. 365, 1–11. doi:10.1016/j.foreco.2016.01.027
Sellers, P. J. (1985). Canopy reflectance, photosynthesis and transpiration. Int. J. remote Sens. 6 (8), 1335–1372. doi:10.1080/01431168508948283
Shanks, R. E. (1954). Climates of the great smoky mountains. Ecology 35, 354–361. doi:10.2307/1930098
Sobrino, J. A., and Raissouni, N. (2000). Toward remote sensing methods for land cover dynamic monitoring: Application to Morocco. Int. J. remote Sens. 21 (2), 353–366. doi:10.1080/014311600210876
Stage, A. R. (1976). An expression for the effect of aspect, slope, and habitat type on tree growth. For. Sci. 22 (4), 457–460. doi:10.1093/forestscience/22.4.457
Szpakowski, D. M., and Jensen, J. L. (2019). A review of the applications of remote sensing in fire ecology. Remote Sens. 11, 2638. doi:10.3390/rs11222638
Tucker, C. J. (1979). Red and photographic infrared linear combinations for monitoring vegetation. Remote Sens. Environ. 8, 127–150. doi:10.1016/0034-4257(79)90013-0
Turner, M. G., and Romme, W. H. (1994). Landscape dynamics in crown fire ecosystems. Landsc. Ecol. 9, 59–77. doi:10.1007/bf00135079
Tuttle, J. P., and White, P. S. (2016). “Structural and compositional change in great smoky mountains national park since protection, 1930s–2000s,” in Natural disturbances and historic range of variation (Berlin, Germany: Springer), 263–294.
Viedma, O., Chico, F., Fernández, J. J., Madrigal, C., Safford, H. D., and Moreno, J. M. (2020). Disentangling the role of prefire vegetation vs. burning conditions on fire severity in a large forest fire in SE Spain. Remote Sens. Environ. 247, 111891. doi:10.1016/j.rse.2020.111891
Weng, Q., Lu, D., and Schubring, J. (2004). Estimation of land surface temperature–vegetation abundance relationship for urban heat island studies. Remote Sens. Environ. 89, 467–483. doi:10.1016/j.rse.2003.11.005
Werth, P. A., Potter, B. E., Clements, C. B., Finney, M. A., Forthofer, J. A., McAllister, S. S., et al. (2011). Synthesis of knowledge of extreme fire behavior: volume I for fire managers. United States: US Department of Agriculture, Forest Service, Intermountain Forest and Range.
Whittaker, R. H. (1956). Vegetation of the great smoky mountains. Ecol. Monogr. 26, 1–80. doi:10.2307/1943577
Wilson, E. H., and Sader, S. A. (2002). Detection of forest harvest type using multiple dates of Landsat TM imagery. Remote Sens. Environ. 80, 385–396. doi:10.1016/s0034-4257(01)00318-2
Keywords: fire, burn severity, Landsat, NEON lidar, remote sensing, vegetation structure, topography, great smoky mountains national park
Citation: Park T and Sim S (2023) Characterizing spatial burn severity patterns of 2016 Chimney Tops 2 fire using multi-temporal Landsat and NEON LiDAR data. Front. Remote Sens. 4:1096000. doi: 10.3389/frsen.2023.1096000
Received: 11 November 2022; Accepted: 13 March 2023;
Published: 04 April 2023.
Edited by:
Ram Kumar Singh, TERI School of Advanced Studies (TERI SAS), IndiaReviewed by:
Patrick Jantz, Northern Arizona University, United StatesHuaguo Huang, Beijing Forestry University, China
Copyright © 2023 Park and Sim. This is an open-access article distributed under the terms of the Creative Commons Attribution License (CC BY). The use, distribution or reproduction in other forums is permitted, provided the original author(s) and the copyright owner(s) are credited and that the original publication in this journal is cited, in accordance with accepted academic practice. No use, distribution or reproduction is permitted which does not comply with these terms.
*Correspondence: Taejin Park, tpark@baeri.org; Sunhui Sim, ssim@una.edu