Characterizing atmospheric aerosols using polarimetry and shadow hiding
 Evgenij Zubko1,2
  Maxim Zheltobryukhov3 Ekaterina Chornaya3 Konstantin A. Shmirko4 Vladimir V. Lisitsa4 Andrey N. Pavlov4
  Anton Kochergin3 Gennady Kornienko3
  Gorden Videen5*
- 1Humanitas College, Kyung Hee University, Yongin-si, Gyeonggi-do, Republic of Korea
- 2Institute for Basic Science (IBS), Planetary Atmospheres Group, Daejeon, Republic of Korea
- 3Institute of Applied Astronomy, Russian Academy of Science, Saint-Petersburg, Russia
- 4Institute of Automation and Control Processes, Far Eastern Branch of Russian Academy of Science, Vladivostok, Russia
- 5Space Science Institute, Boulder, CO, United States
Unpolarized sunlight is scattered by aerosols acquiring partial linear polarization. By aiming a ground-based detector vertically upward, it can record the polarimetric response of aerosols that are illuminated by the Sun. As the Sun sets, a portion of the sky is shadowed and the polarimetric response of the aerosols in the unshadowed region can be measured. This provides a means of scanning different portions of the atmospheric column with time. By comparing the measured polarimetric response with that of model agglomerated debris particles we can place constraints on the sizes and chemical composition of the aerosols in different portions of this column. We conducted a survey over 24 different epochs from April 2021 to December 2022, consisting of approximately 600 measurements of polarization of the atmosphere in twilight at the Ussuriysk Astrophysical Observatory. We found that most of the measurements correspond with water-ice particles or dust. However, on some occasions organic carbon dominated the measurements. These epochs correspond with increased fire seats in the region.
1 Introduction
Linear polarization of electromagnetic radiation can be fully characterized using three Stokes parameters I, Q, and U (e.g., Bohren and Huffman, 1983) as follows:
Here Ptotal corresponds to the degree of linear polarization characterizing the strength of linear polarization that initially unpolarized solar radiation acquires upon scattering in the atmosphere. Note, Ptotal spans the range from 0 (totally unpolarized light) to 1 (fully polarized light), and it is often measured in percent. The angle γ describes the orientation of the linear-polarization plane with regard to the Stokes-parameters reference plane. In the literature, I, Q, and U are often inferred from four radiometric measurements conducted with the linear polarizer (analyzer) rotating around the optical axis via 45° (e.g., Hadamcik and Levasseur-Regourd, 2003). However, using the Fesenkov equations (e.g., Fessenkoff, 1935; Chornaya et al., 2020), the same can be done with only three measurements, with analyzer orientations of 0°, 60°, and 120°:
where F0, F60, and F120 stand for the fluxes of electromagnetic radiation measured at the corresponding orientations of the analyzer.
In various applications, target particles often appear in random orientation and, as a consequence, their Mueller matrix takes on a simple, block-diagonal form (see, e.g., Bohren and Huffman, 1983). This feature has an important implication for the angle γ. If the Stokes-parameter reference plane is set to coincide with the scattering plane (i.e., the plane defined by mutual location of source of light, target, and radiometer), then the angle γ is equal to either 0° or 90°. In other words, when the reference plane is coincident with the scattering plane, the linear polarization is characterized solely by the second Stokes parameter Q, and the third Stokes parameter disappears, U = 0. In this case, the definition in Eq. 1 can be simplified as follows:
where F⊥ and F|| denote fluxes of electromagnetic radiation measured with the analyzer oriented perpendicular to the scattering plane and to lie within that plane, respectively. Note, the degree of linear polarization P in Eq. 3 is already a sign-dependent characteristic, with sign indicating the orientation of the linear-polarization plane: i.e., negative polarization P < 0 implies γ = 0° and F⊥ < F||, while positive polarization P > 0 corresponds to γ = 90° or F⊥ > F||. Note that fundamental scattering processes like single scattering by Rayleigh particles and Fresnel reflections result in positive polarization, which is more commonly seen than negative polarization, which often is seen in the backscattering region due to multiple scattering (Videen, 2002, 2003).
It is worth noting that obtaining the degree of linear polarization defined with Eq. 3 requires only two measurements with the analyzer oriented with regard to the scattering plane at 0° and 90°. However, in order to secure a robust result in this case, one needs to ensure that this approach is applied to randomly oriented particles. It is likely to be the case when an object of interest is comprised of equi-dimensional particles with highly irregular morphology because the shape of such particles has no preferential direction for alignment. It is not clear whether this holds for aerosol particles. Mineral-dust particles do have irregular shapes on the scale of a micrometer, but they can be subject to forces like wind, gravity and magnetic fields that can align them (e.g., Okamoto, 2002; Konoshonkin et al., 2022; Kustova et al., 2022).
Shkuratov et al. (2005) first observed negative polarization in the Martian atmosphere using the Hubble Space Telescope (HST) during the 2003 opposition. Thin clouds producing negatively polarized light could be seen to move across the landscape that produced a positively polarized signal (Shkuratov et al., 2005). Laboratory measurements of aerosolized particles and surfaces having the same composition have shown that the scattered light from the surfaces has a reduced polarization state (e.g., Shkuratov et al., 2004). The scattered light from the Martian surface and thin clouds had different polarization states, suggesting that the negative polarization from the clouds were the result of water ice condensing onto dust particles at the leading edge of the dust storm (Shkuratov et al., 2005). Sun et al. (2014) subsequently observed negative polarization in Earth’s clear-sky atmosphere for the first time using the Polarization and Anisotropy of Reflectances for Atmospheric Science coupled with Observations from a Lidar (PARASOL) instrument. These anomalous results could be explained by introducing a layer of super-thin clouds, too thin to be detected using the intensity signal (Sun et al., 2014). Due to the system geometry, satellite measurements of the negative-polarization branch include both the atmospheric particles as well as the illuminated surface below. At present, discrimination of the terrestrial and atmospheric components is a difficult, if not ill-posed, problem and many satellite programs focus on retrievals over ocean, where the surface scattering of the dark ocean is lower and can be minimized by avoiding glint conditions. It also can be possible to perform discrimination using a model (e.g., Sun et al., 2019; Chen et al., 2021), but quantitative results would be accompanied with large uncertainty. One advantage of a ground-based instrument is that the terrestrial background does not immediately contribute to the light-scattering response from the atmosphere as a radiometer is oriented upward. Nevertheless, the terrestrial background still can contaminate the signal via multiple scattering between the underlying terrain and the atmosphere. Such contamination, however, is greatly reduced in twilight, shortly after sunset or prior to sunrise, when the terrain is shadowed from direct solar radiation; whereas, the atmosphere is illuminated by the sunlight.
Twilight phenomena in the atmosphere have been studied by means of different techniques (see Rozenberg, 1966 for review). In particular, it has been investigated by means of polarimetry (e.g., Fesenkov, 1966; Pavlov et al., 2018; Ugolnikov et al., 2021). It is worth noting that the polarimetric response from the atmosphere during daylight is somewhat different from what emerges in twilight; nevertheless, there also is a great deal of qualitative similarity between them (Rozenberg, 1966). Objectives of polarimetry within atmospheric science has taken place for well over a century. Piltschikoff (1892) used multi-wavelength polarimetry to examine mechanisms of light scattering in the atmosphere. In addition, he also searched for seasonal correlations between the dominating wind direction and the polarimatric response from the air above the city of Kharkov. Later on, when Rayleigh attributed the light-scattering phenomena to the molecular constituents of the atmosphere, polarimetry was used to constrain their depolarization effect and, hence, internal structure (see Young, 1982 for review). It also was noticed that the degree of linear polarization in the atmosphere appears considerably smaller than what emerges from the most abundant species of air (Khvostikov, 1940). This, together with the asymmetry of the phase function (i.e., the angular distribution of the scattered light, Bohren and Huffman, 1983), indicate a key contribution of micron-sized aerosol particles in atmospheric light scattering. Interestingly, the wavelength dependence of the linear polarization detected by Piltschikoff (1892) also suggests that light scattering has a non-molecular origin. Fesenkov (1966) proposed a polarimetric method to estimate the contribution of multiple scattering in the twilight atmosphere. Today, polarimetry is considered to be a powerful tool for studying the microphysics of atmospheric aerosols (e.g., Pavlov et al., 2018; Ugolnikov et al., 2021).
In this paper we present results of a 20-month polarimetric survey of the atmosphere in twilight conducted at the Ussuriysk Astrophysical Observatory, located at 43.6986°N, 132.1656°E (code C15), a division of the Institute of Applied Astronomy of the Russian Academy of Sciences. In addition, using irregularly shaped agglomerated debris particles, we search for the best fit to our polarimetric measurements. These modeling efforts allow us to place constraints on the microphysical properties of the aerosol particles.
2 Technique of polarimetric measurements
We measure the degree of linear polarization in accordance with the definition in Eq. 1. Then we investigate possible alignment of aerosol particles by means of the position angle γ, similar to what was performed by Ulanowski et al. (2007). While deviations of γ from 0° to 90° could be interpreted as preferential orientations of aerosol particles, our observation campaign suggests such deviations are not a common phenomenon (see the end of the next section). Even when they are detected, deviations appear to be quite small, with the vast majority of them being less than 10°. As a consequence, there is hardly a noticeable difference between the value of Ptotal and the absolute value of P in Eq. 3. It also is worth noting that the degree of linear polarization is typically considered within the sign-dependent definition given in Eq. 3.
Measurements were conducted using the RC500 telescope whose primary mirror has a diameter of 0.5 m. The telescope is equipped with a commercially available CMOS detector ZWO ASI 6200 pro. Its resolution is equal to 9576 pixels × 6388 pixels a pixel size of 3.76 μm; the detector is operated in the 2 × 2 binning mode. The images of twilight sky were processed using the Image Reduction and Analysis Facility (IRAF) software system designed for reduction of astronomical data. It consists of basic routines for bias subtraction and flat-field correction.
The telescope is equipped with an analyzer (dichroic polarization filter) that can rotate around the optical axis to three discrete positions 0°, 60°, and 120°. For simplicity, the first orientation (i.e., 0°) was set parallel to the rows in the CMOS detector. On the follow-up processing of observational data, we retrieve precisely the direction to the Sun in each obtained image. The resulting line simultaneously corresponds to a projection of the scattering plane onto the plane of the sky. We take into account the angular difference between the detector’s rows and the scattering plane and adjust the angle γ in Eqs 1, 3, so it refers to the scattering plane.
The geometry of light scattering can be characterized with the scattering angle θ or the phase angle α, which is commonly used in planetary science (see Figure 1). They are supplementary to one another, so α = 180° – θ. It is worth noting that the sunlight illuminating the Earth atmosphere appears to be a parallel beam due to the very long distance to the Sun, ∼1.5 × 10⁸ km. In ground-based observations of the atmosphere, the scattering angle θ is an alternate angle to the elongation ε, the angular distance between the direction to the Sun and the optical axis of the telescope; i.e., θ = ε (see Figure 1).
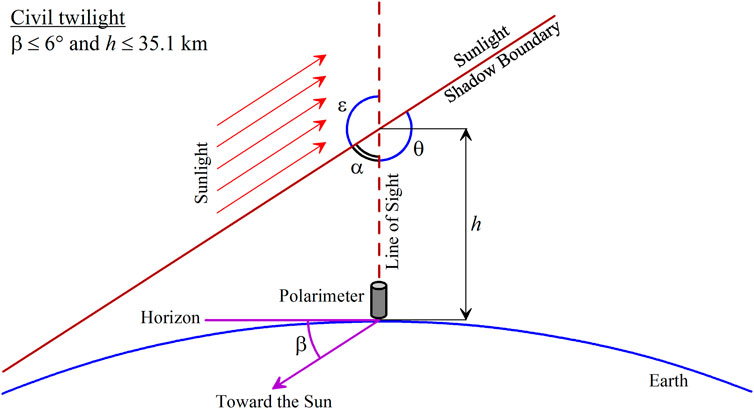
FIGURE 1. Scheme illustrating polarimetric observations of atmospheric aerosols in twilight.
At every instant, the position of the Sun on the celestial sphere is well known and can be obtained from the existing ephemeris. Within the most frequently used equatorial coordinate system, it is characterized with two angles: right ascension (RA) and declination (δ). The orientation of the optical axis of the telescope can also be described in terms of the system of coordinates. Since both directions are known, the elongation can be calculated using the interrelation:
Here, subscripts T and S refer to telescope and Sun, respectively. We compute the elongation using Eq. 4 and then obtain the phase angle α = 180° – ε (see Figure 1). In what follows, we investigate the degree of linear polarization P as a function of α.
An important characteristic of twilight is the zenith height of the upper boundary of shadow h (see Figure 1). It is determined by the radius of the Earth R = 6,371 km and the angular depth of the Sun beneath the horizon β as follows:
Note, the civil twilight is defined at β ≤ 6° that corresponds to h ≤ 35.1 km.
We measure the polarimetric response in the atmosphere using the broadband V filter of the Johnson-Cousins photometric system. Its effective wavelength is λeff = 0.551 μm and the bandpass is FWHM = 0.088 μm. The brightness of the sky in twilight is a function of the angle β. For instance, on the edge of civil twilight and nautical twilight, i.e., at β = 6°, the apparent brightness of the sky is ∼13.1 mag/arcsec2 (Nawar et al., 2020). In our measurements, we gather flux using a circular aperture having a radius of 100 effective pixels (i.e., those emerging after the 2 × 2 binning). On average, the angular resolution of an effective pixel is 0.378 arcsec/pixel and, hence, the area of integration is equal to 4,489 arcsec2 or 1.247 arcmin2. The exposure time is set to avoid saturation of the response in the CMOS detector. At β = 6°, it was set to 20 s for every image. At smaller β, however, it was decreased to a shorter value, down to 1 s.
At every pair of angles α and β, we repeat the measurements 3–5 times and compute the average value of the degree of linear polarization P and the standard deviation of the mean, quantifying the uncertainty in the results shown in Figures 2, 4–6. The polarimetric measurements of the twilight sky are conducted using the same algorithms used in previous polarimetric observations of comets (e.g., Zubko et al., 2020b; Chornaya et al., 2020; Zheltobryukhov et al., 2020; Kochergin et al., 2021).
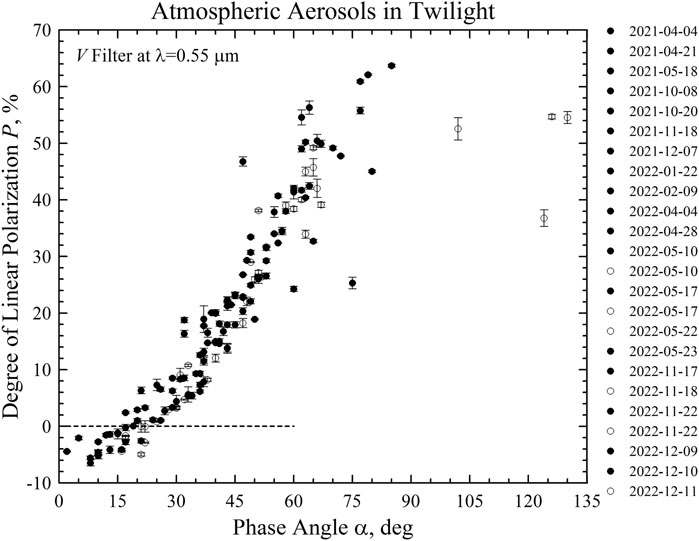
FIGURE 2. Degree of linear polarization P of the air above the Ussuriysk Astrophysical Observatory as a function of the phase angle a. Points correspond to measurements in morning twilight and open circles in evening twilight.
Finally, we describe the circumstances in which we conducted our measurements of the twilight sky. Because it is not our primary goal of study, we do it only prior to and after astronomical observations. This means that on each such occasion, the sky is free of clouds and the air is transparent, i.e., clear-sky conditions. If weather conditions are not favorable for astronomical observations, we do not measure the atmosphere either. Furthermore, measurements in the morning twilight were conducted only when the visibility remained sufficiently good for astronomical needs all night long. Thus, our measurements correspond with a highly transparent atmosphere and clear-sky conditions.
3 Results of observations
Figure 2 shows the degree of linear polarization P as a function of phase angle α that was measured at the Ussuriysk Astrophysical Observatory in twilight on 24 different epochs embracing the period from 4 April of 2021 until 11 December of 2022. Black points correspond to measurements conducted in morning twilight (18 epochs) and the open circles to evening twilight (6 epochs). All epochs are listed in the legend of Figure 2. In total, Figure 2 consolidates ∼600 measurements into 155 data points, each of which results from averaging 3–5 measurements producing a mean and standard deviation. Although Figure 2 shows a noticeable scattering of data points, one can see a common trend in the phase dependence of polarization. At small phase angles, α < 15°, the aerosol particles systematically reveal negative polarization (i.e., F⊥ < F||). This negative-polarization branch could be as deep as Pmin = −6%.
The negative polarization near backscattering arises in weakly absorbing particles whose size is comparable to wavelength (Zubko et al., 2012); whereas, the elastic light-scattering response and fluorescence emission from gaseous molecules remain positively polarized (i.e., F⊥ > F||) throughout the entire range of phase angles. Therefore, the negative polarization observed even in an optically thin atmosphere indicates a the presence of weakly absorbing aerosol particles at least within the passband of the V filter used in our study.
The negative polarization produced by aerosol particles was expected based on various preceding studies, including those from PARASOL (Sun et al., 2014; 2019), airborne optical measurements of the ambient aerosols sampled by airplane at altitude (Dolgos and Martins, 2014), from laboratory optical measurements of various terrestrial-dust analogs (Volten et al., 2001; Muñoz et al., 2012; Zubko et al., 2019), and from numerical simulations of light scattering by irregularly shaped particles (Zubko et al., 2003, 2005, 2006, 2015a; Nousiainen et al., 2009, 2012; Lindqvist et al., 2011; Shmirko et al., 2018). As demonstrated in Figure 2, the negative polarization is seemingly a persistent feature of an optically thin atmosphere. It is worth noting that the negative polarization unambiguously demonstrates the dominating contribution of aerosol particles because gaseous molecules can only produce positive linear polarization.
At phase angles α between 15° and 25°, the degree of linear polarization P in Figure 2 tends to change its sign from negative at smaller α to positive at larger α. On two epochs, 10 and 17 May of 2022, we were lucky to catch a nearly zero polarization. In the former case, P = –(0.04 ± 1.01)% was observed at α = 21° and, in the latter case, P = –(0.03 ± 1.01)% occurred at α = 22°. It is important that, in both these cases, nearly zero polarization appears also in the sign-independent Ptotal and, hence, the sign transition is not accompanied with an intermediate value of the position angle γ between 0° and 90°. In other words, the transition occurs without rotation of the linear-polarization plane from γ = 0° to γ = 90°. It is worth noting that such a rotation has been observed, for instance, in comets, where it is the result of spatial inhomogeneity of cometary dust particles (Zheltobryukhov et al., 2020).
When phase angles exceed approximately 25°, the degree of linear polarization P of light scattered by the atmosphere is positive (F⊥ > F||). It grows with phase angle α and attains its maximum value Pmax at side scattering. Data points in Figure 2 are somewhat sparse at α ∼ 90°. Nevertheless, they suggest that the amplitude of positive polarization spans at least from Pmax ∼ 25%–65%. Interestingly, a qualitatively similar dispersion of Pmax (but with lower limits) also is long known for comets, where it reflects different chemical composition of their dust (Zubko et al., 2016). In the next section we will develop a quantitative model for polarization measured on each of the 24 epochs listed in Figure 2. It allows us to place constraints on the microphysical properties of dust settling in the atmosphere.
Finally, we address deviations in orientation of the linear-polarization plane from its two standard positions, γ = 0° (i.e., the negative polarization) and γ = 90° (the positive polarization). The polarization planes γ = 0° and 90° reveal symmetry in orientation of the target particles with respect to the scattering plane (e.g., Bohren and Huffman, 1983). Because the line of sight in our measurements was not oriented with regard to factors that may cause a preferential orientation (directions of horizontal and vertical winds, electrical or magnetic fields), γ = 0° and 90° implies random orientation of the aerosol particles. Among the entire ensemble of 155 observations shown in Figure 2, deviations of the angle γ from these two positions in excess of 10° have been detected in 27 data points; whereas, deviations in excess of 20° appear only in 6 data points. They constitute only a small fraction of all observations, 17.4% and 3.9%, respectively. In other words, we may suspect preferential orientation of aerosol particles in 17.4% of the cases and significant preferential orientation of aerosol particles only in 3.9% cases. It is unclear how much orientation of non-spherical particles is necessary to acquire such a shift in the polarization plane. It is worth noting that the maximum possible deviation of the angle γ is 45°, which we have never met in practice. Thus, the current polarimetric survey suggests that the aerosol particles contributing to the light-scattering response appear in the atmosphere in random orientation approximately 80% of the time. An alignment of aerosol particles either is not a common phenomenon in our observations (see report of its observation by Ulanowski et al., 2007) or it arises in relatively large particles (>10 μm), whose contribution to the light-scattering response is negligible in the presence of submicron- and micron-sized particles (Zubko et al., 2020a). This could be the result of the observing conditions and locations of the aerosols, which were different from those of Ulanowski et al. (2007).
4 Constraints on microphysics of atmospheric aerosols inferred from modeling
4.1 General remarks
In this section we briefly introduce the model of agglomerated debris particles, demonstrate several examples of their polarimetric response, and outline principles of searching for the best fit to polarimetric measurements of the atmosphere.
Agglomerated debris particles were defined by Zubko et al. (2005, 2006) to have discrete irregular shape and, hence, to be suitable for computation of their light-scattering response within the discrete dipole approximation (DDA) (e.g., Draine and Flatau, 1994; Yurkin and Hoekstra, 2007 for review). Five samples of agglomerated debris particles are shown at the top of Figure 3; we refer to Zubko et al. (2013) for a detailed description of the algorithm for their generation. As one can see, the particles have a highly irregular, nearly equidimensional shape. The packing density of their constituent material with regard to the circumscribing sphere is about 0.236, suggesting a fluffy internal morphology: about 3/4 of the internal volume of the circumscribing sphere is empty space. So far, the light-scattering properties of the agglomerated debris particles have been calculated at 60 different values of complex refractive index m, consistent with various species of cosmic and terrestrial dust particles. Each value of m was studied over a wide range of size parameter x = 2πr/λ from 1 up to 60 (where r is the radius of the circumscribing sphere and λ is the wavelength of incident radiation). The upper limit is dependent on m in accordance with the DDA validity criterion (Zubko et al., 2010).
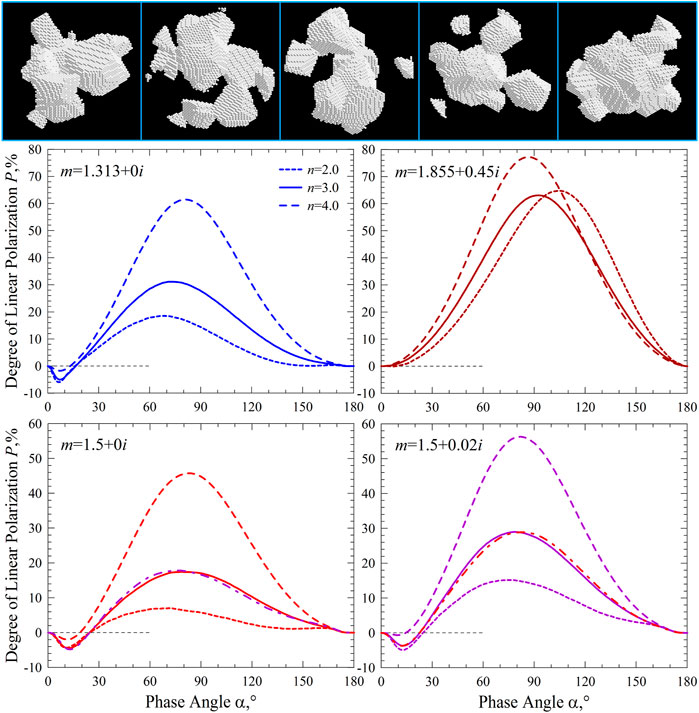
FIGURE 3. Five sample agglomerated debris particles (images on top) and their degree of linear polarization P as a function of the phase angle a at four values of complex refractive index m (panels below): m = 1.313 + 0i (middle left), m = 1.855 + 0.45i (middle right), m = 1.5 + 0i (lower left), m = 1.855 + 0.02i (lower right). Different curves of the same color show results obtained at power index n = 2, 3, and 4 (the line types in the middle-left panel are the same for the other panels). Dash-dot curves on the lower panels demonstrate ambiguity of results obtained at slightly different values of Im(m), see text for more details.
Four panels in Figure 3 demonstrate the degree of linear polarization P as a function of the phase angle α in agglomerated debris particles having water-ice composition with m = 1.313 + 0i (top left), carbonaceous-material composition with m = 1.855 + 0.45i (top right), and mineral composition with m = 1.5 + 0i (bottom left) and 1.5 + 0.02i (bottom right). In the upper panels, the size parameter spans the range from x = 1 to 60, and, in the bottom panels, x = 1 to 52. At wavelength λ = 0.55 μm, these ranges of x correspond to particle radii r ≈ 0.09–5.25 μm and r ≈ 0.09–4.55 μm, respectively. Over these sizes the light-scattering response is averaged with a power-law size distribution r–n. Results obtained at n = 2 are shown with a short-dash line, at n = 3 with a solid line, and at n = 4 with a long-dash line. Increasing n has the effect of increasing the weighting of smaller particles, which, as one can see in Figure 3, dampens the phenomenon of negative polarization and simultaneously increases the positive polarization, and makes the angular profile of polarization resemble what emerges from the Rayleigh approximation for particles with r << λ (e.g., Bohren and Huffman, 1983). This is expected because increasing power index n increases the number concentration of these particles. However, at n < 3, the polarization curves corresponding to different refractive indices of their material m reveal significant differences one from another.
Some trends are apparent in Figure 3; for instance, the polarization maximum Pmax increases with absorption and decreases with real part of refractive index. Increasing material absorption Im(m) and decreasing Re(m) in a similar way increases Pmax. This may lead to a non-unique fit of the positive polarization branch and, hence, some uncertainty in aerosol retrievals. The ambiguity can be resolved by considering other aspects of the curves. For instance, incorporating the phenomenon of negative polarization at small phase angles. While increasing Im(m) only slightly affects the phase angle of minimum polarization αmin, decreasing Re(m) noticeably shifts αmin toward 0°. This interrelation between αmin and Re(m) takes a very simple quantitative form (see Zubko et al., 2015b for more details). Therefore, an accurate measurement of αmin may help to avoid ambiguity in retrievals obtained solely from the positive polarization branch.
Nevertheless, some small changes in refractive index m of aerosol particles might be difficult to discriminate in practice. This is demonstrated in the bottom panels of Figure 3. In the lower-left panel, the purple dash-dot line shows results obtained at m = 1.5 + 0.02i and n = 2.3. This polarization curve is virtually the same as at m = 1.5 + 0i and n = 3 (red solid line). On the bottom-right panel in Figure 3, the red dash-dot line demonstrates the results for m = 1.5 + 0i and n = 3.48, nearly matching the case of m = 1.5 + 0.02i and n = 3 (purple solid line). Thus, the effect of small changes in Im(m) could be dampened by changes in the size distribution of target particles. This demonstrates that retrieving microphysical properties of aerosol particles based solely on polarimetry is an ill-posed problem; however, we can place constraints on these properties which can be significant, especially when accompanied by a priori knowledge. The angular profile of the degree of linear polarization appears to be the most sensitive to the microphysics of target particles among all other light-scattering characteristics [e.g., Zubko et al. (2012), Zubko et al. (2013), Zubko et al. (2014), Zubko et al. (2016)].
In the single-scattering regime, the polarimetric response slowly changes while Im(m) grows from 0 to 0.02. In this case, increasing material absorption predominantly affects the positive-polarization branch at side scattering. However, when the same particles are deposited on a substrate, even a small change in Im(m) has a noticeable impact on the light-scattering response. For instance, while the particulate surface is highly reflective at Im(m) = 0, it is very dark in appearance at Im(m) = 0.02, having reflectivity of only a few percent.
High sensitivity of polarization to microphysical properties implies, simultaneously, that the primitive models of aerosol shape are inapplicable for quantitative interpretations of the polarimetric measurements. For instance, a model of a perfect sphere computed with the Lorenz-Mie theory contains angular resonances that are not seen in laboratory optical measurements of various analogs of atmospheric aerosols (e.g., Dubovik et al., 2006). A mixture of prolate and oblate spheroids could significantly improve the fit to the polarimetric measurements; however, the spheroidal particles cannot simultaneously reproduce the multi-wavelength polarimetric measurements of aerosol particles (Dubovik et al., 2006). Irregularly shaped agglomerated debris particles are able to achieve this (Zubko et al., 2013). It also is worth noting that even when a best fit is formally obtained with spheroids, it does not necessarily yield correct constraints on the microphysical properties retrieved from the aerosol particles (Nousiainen et al., 2011; Zubko et al., 2013).
It is significant that the agglomerated debris particles have been compared with laboratory optical measurements, including polarimetry, of feldspar particles (Zubko et al., 2013), forsterite particles (Zubko, 2015), olivine particles (Videen et al., 2018), and volcanic-sand particles (Zubko et al., 2019). Not only do they provide reasonable fits to all these experimental data, but they do so with a size distribution and refractive index closely matching what has been measured for the sample particles. In other words, the microphysics retrieved with the agglomerated debris particles do correspond to the actual properties of target particles. So far, only the agglomerated debris particles have demonstrated this capability. We, therefore, employ these particles in quantitative analysis of our polarimetric measurements of the twilight atmosphere.
When searching for the best fit, we assume the polarized scattering signal is dominated by single-particle scattering and perform least-squares fits to the DDA-calculated phase curves from size distributions of agglomerated debris particle. We reduce the number of free model parameters to a minimum. For instance, instead of the log-normal size distribution that is often considered in application to atmospheric aerosols (e.g., Willeke and Brockmann, 1977; Dubovik et al., 2006), we use the power-law size distribution r–n that is formally characterized by only three parameters: the minimum radius of aerosol particles rmin, their maximum radius rmax, and the power index n. It is worth noting that aerosol particles sampled previously in situ in the atmosphere were successfully characterized in terms of the power-law size distribution (e.g., Junge et al., 1961). Another important feature to emphasize is an equivalence of the polarimetric response produced by polydisperse particle systems obeying a log-normal size distribution and a power-law size distribution (see Pavlov et al., 2018 and therein for review). Therefore, a log-normal size distribution does not produce a unique polarimetric response that cannot be reproduced with a power-law size distribution. However, in the latter case this goal is achieved using only three parameters characterizing the size distribution.
In addition, the lower and upper limits of the size distribution, rmin ≈ 0.09 μm and rmax ≈ 4.55 (5.25) μm, are set to fully encompass particles that scatter efficiently in the optical range. At λ = 0.55 μm, they correspond to the size parameter xmin = 1 and xmax = 52 (60). If the index of the power-law size distribution complies with n < 6, an arbitrary chosen bottom limit in size distribution xmin < 1 would yield a polarimetric response virtually the same as what is demonstrated in Figure 3. At n > 2–3, the same holds for the upper limit xmax in excess of 52. In practice, this implies that rmin and rmax are not fully free parameters in our modeling because a decrease of rmin and/or an increase of rmax affect the resulting polarimetric response minimally. We refer to Zubko et al. (2020a) for more details on the effect of small and large particles on the degree of linear polarization. In these circumstances, the power index n is essentially the only parameter characterizing the size distribution. In this study it was varied from n = 1 to 5.
4.2 Constant microphysics of aerosol particles throughout all altitudes
We start analyzing the measurements presented in Figure 2 by considering some simple cases in which the aerosol particles appear distributed homogeneously through the sampled atmospheric column and can be characterized using the agglomerated debris particles with a single complex refractive index m and sole power index n. Among all 24 epochs, we have found 9 epochs of this kind. They are presented in Figure 4 and on the upper-left panel in Figure 5. Here and in what follows, the numbers shown next to the data points indicate the altitude of the shadow boundary measured in km. Each panel, except the third row in Figure 4, presents only one modeling result shown with the solid curve.
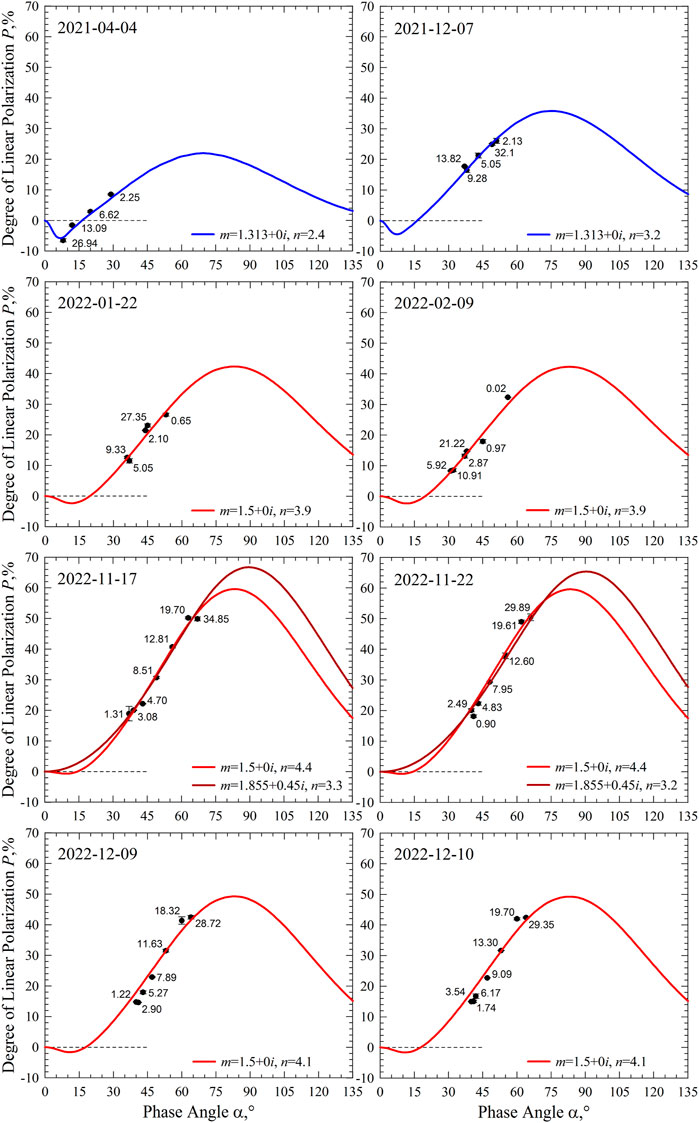
FIGURE 4. Degree of linear polarization as a function of phase angle a measured in the air above the Ussuriysk Astrophysical Observatory on eight epochs (points) and their modeling with the agglomerated debris particles (lines).
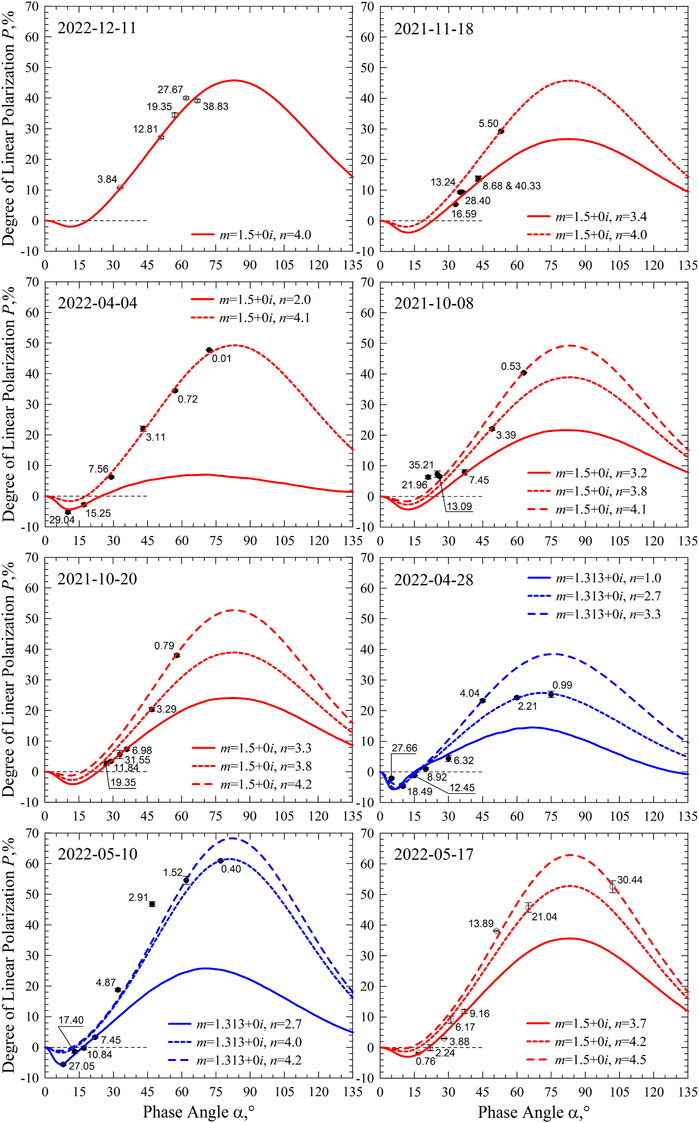
FIGURE 5. Degree of linear polarization as a function of phase angle a measured in the air above the Ussuriysk Astrophysical Observatory on eight epochs (open circles and points) and their modeling with the agglomerated debris particles (lines).
The first measurement conducted on April 4 of 2021 (top left panel in Figure 4) can be reproduced using the refractive index of water ice, m = 1.313 + 0i, obeying a power-law size distribution with index n = 2.4. We examine this chemical composition in all other epochs and find that n = 3.2 works on 7 December of 2021 (top right panel in Figure 4), suggesting slightly smaller water-ice particles on that date. On other epochs, the water-ice composition cannot fit the measurements using a single value of the power index n; however, other chemical compositions are able to reproduce the measurements using a single value of the power index n. We find that a mineral composition with refractive index m = 1.5 + 0i works well in all other panels in Figure 4 and on the upper-left panel in Figure 5.
In our analyses, we do not consider a third type of chemical composition of the agglomerated debris particles as long as the refractive indices m = 1.313 + 0i and 1.5 + 0i are capable of reproducing the polarimetric response of the atmospheric aerosols. Nevertheless, the fitted profile is not unique and there remains some room for a range of solutions. First of all, there is some ambiguity in the imaginary part of refractive index Im(m). As was demonstrated in the previous subsection, this can range from 0 to 0.02 with a simultaneous decrease of the power index n. As a result of the limited range of phase angle α in the measurements, the polarimetric response could be equally well reproduced by particles having dramatically different refractive indices. We show this, for instance, in the third row of Figure 4. In addition to the mineral-dust composition having m = 1.5 + 0i, the polarimetric measurements can also be satisfactorily reproduced by particles having a carbonaceous composition with m = 1.855 + 0.45i (Jenniskens, 1993). Despite the resemblance of their polarimetric responses over the range of observed α, the two materials could have been discriminated with confidence by the phenomenon of negative polarization at small phase angles and/or amplitude of the positive polarization branch Pmax at larger phase angles.
As one can see in Figure 4 and in the upper-left panel of Figure 5, the agglomerated debris particles with m = 1.5 + 0i reveal a relatively small range of power index in their size distribution, n = 3.9–4.4 for all 7 epochs. However, on 5 out of 7 epochs, the power index n appears constrained to a very narrow range, n = 4 ± 0.1. Interestingly, the water-ice particles demonstrate a noticeably wider dispersion of their power index, n = 2.4 and 3.2; even though this finding emerges from a very limited set of data of only two epochs.
4.3 Constant chemical composition and varying size distribution of aerosols with altitude
On epochs other than those we have considered in the previous subsection, we assume a constant chemical composition of aerosol particles, but allow an altitude dependence of their size distribution. Using this constraint, we can fit the polarimetric measurements of the other 9 epochs. These are aggregated in Figure 5 (except the upper-left panel) and in the upper row of panels in Figure 6. In all these cases the best fits again can be achieved either using the water-ice particles with m = 1.313 + 0i (2 epochs) or using the mineral-dust particles with m = 1.5 + 0i (7 epochs). In the corresponding panels, curves of different types show results obtained at different values of the power index n. In two out of nine cases, the polarimetric responses can be reproduced with two values of n; whereas, in the other seven cases, we need three or more values of n. In order to keep the figures readable, we limit the number of curves to 3 in each panel.
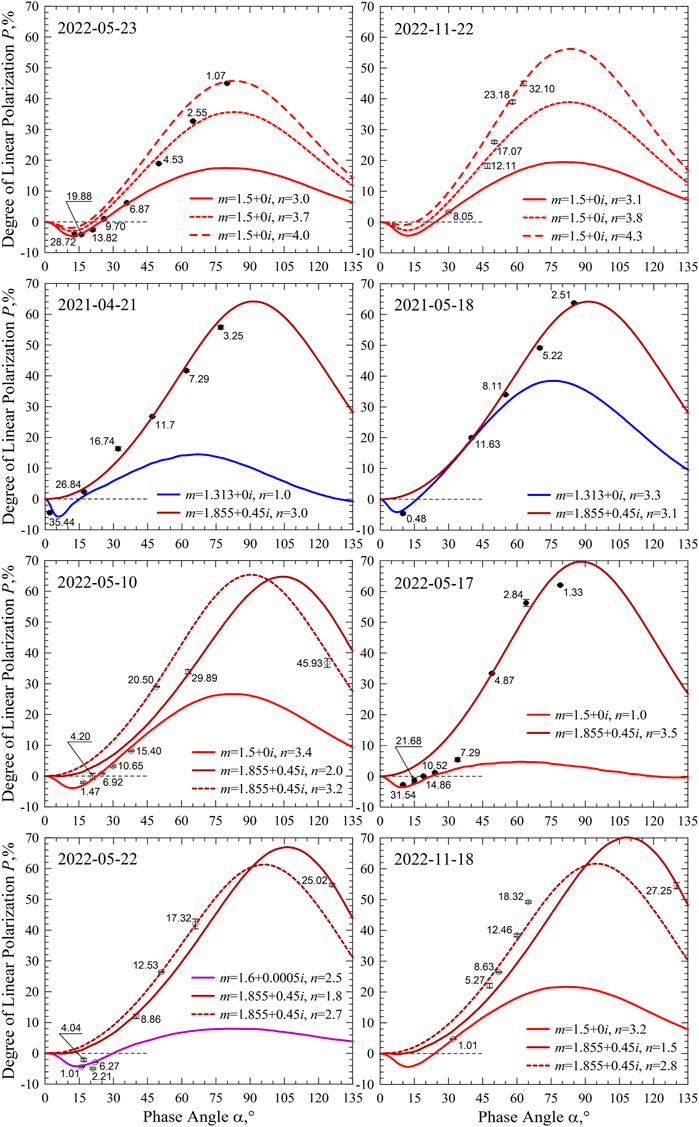
FIGURE 6. Degree of linear polarization as a function of phase angle a measured in the air above the Ussuriysk Astrophysical Observatory on eight epochs (open circles and points) and their modeling with the agglomerated debris particles (lines).
As one can see in Figure 5 and the upper row of Figure 6, there is no clear dependence of the power index n on altitude of the shadow. Only 2 epochs, 17 May and 22 November of 2022, suggest an increase of power index n with altitude, which implies a decrease in the average size of aerosol particles. Such a trend seems reasonable for particles suspended in air.
On 3 epochs, 8 October of 2021, 28 April and 17 May of 2022, the power index n reveals seemingly a non-monotonic dependence on the altitude. Note, the last epoch also appeared in the previous paragraph. In the other 5 epochs, n tends to decrease while the altitude increases, implying that the average size of aerosol particles grows with altitude. An absence of regularity in altitude dependence of the power index n could be tentatively explained by the particular atmospheric conditions. This matter requires further investigation.
4.4 Chemical heterogeneity of aerosol particles
In the two previous subsections, we demonstrated that the polarimetric measurements conducted on 18 out of 24 epochs can be reproduced with a single chemical composition of the aerosol particles, having either m = 1.313 + 0i or m = 1.5 + 0i. In the remaining 6 epochs analyzed in the second to fourth rows of Figure 6, this simple scenario is inconsistent with the experimental data.
In some cases, such as the measurements in the evening twilight on 10 May of 2022 (left panel in the third row of Figure 6), fitting all the data points solely with m = 1.5 + 0i might be possible. However, each data point obtained above 20 km would require its own value of the power index: n = 4.2 for 20.50 km, n = 3.85 for 29.89 km, and n = 5 for 45.93 km.
We avoid fitting single data points because such a fit does not significantly constrain the fitted phase, resulting limited constraints on the retrieved microphysics of the aerosol particles. A single data point may have worth for a dedicated fit only if the polarimetric response takes on an extreme value at a given phase angle α. For example, the polarimetric response detected on 21 April of 2021 at 35.44 km and 22 May of 2022 at 1.01 at 6.27 km require a different approach. In the former case, the measurements unambiguously reveal water-ice composition of aerosol particles and an extremely low index in their size distribution n = 1. In the latter case, a wide branch of the negative polarization indicates a relatively large value of the real part of refractive index, Re(m) = 1.6 (Zubko et al., 2015b). However, the degree of linear polarization P ∼ 30%–40% detected at side scattering on the evening twilight on 10 May of 2022 does not constrain the modeling. Therefore, we require a simultaneous fit to at least two data points and, consider this epoch as a case of chemical heterogeneity of the aerosol particles. Nevertheless, in the other 5 epochs, the chemical heterogeneity is deduced with much more confidence, as all data points cannot be fit with the same refractive index.
As one can see in Figure 6 (except the upper row), each case necessarily incorporates the refractive index of carbonaceous material m = 1.855 + 0.45i. This particular refractive index results from optical measurements of laboratory analogs of organic matter formed in interstellar space (Jenniskens, 1993). We adapt it here because this refractive index was investigated over a wide range of size parameter x in particles having various aggregate morphology, including the agglomerated debris particles (Zubko et al., 2015a). It is worth noting that it is also used in quantitative modeling of the polarimetric response in comets (e.g., Zubko et al., 2016).
Despite its interstellar origin, m = 1.855 + 0.45i also is representative of the refractive index of black carbon resulting from the combustion of terrestrial organic materials. For instance, using various techniques and assumptions (e.g., Bond and Bergstrom, 2006; Kahnert and Kanngießer, 2020), the refractive index of atmospheric black carbon at λ = 0.55 μm is constrained to Re(m) = 1.75 – 1.95 and Im(m) = 0.63 – 0.79. The real part of refractive index of interstellar organics appears in the middle of the range estimated in atmospheric black carbon; whereas, the imaginary part of refractive index in the interstellar organics is somewhat smaller. We note that, in this case, the larger imaginary part of refractive index, Im(m) ∼ 0.7, does not imply stronger material absorption in the black carbon, as the light has to penetrate the material in order to be absorbed. Instead, the black carbon could be a slightly less absorbing material compared to the interstellar organics (Jenniskens, 1993). High Im(m) reveals a stronger conductivity of constituent material. It was demonstrated that the polarimetric response of agglomerated debris particles is weakly dependent on the specific value of Im(m) when it is sufficiently large, Im(m) > 0.3 (Zubko et al., 2009). Therefore, the refractive index m = 1.855 + 0.45i also appears to be a good approximation for atmospheric black carbon.
The necessity to incorporate aerosols having refractive index m = 1.855 + 0.45i may indicate a strong contamination of air with combustion products. On some epochs this suggestion appears to be consistent with wildfires. For instance, on 21 April of 2021 (see on left in the second row of Figure 6), the Ministry of the Russian Federation for Civil Defence, Emergency Situations and Elimination of Consequences of Natural Disasters reported observations of 146 seats of wildfire in Primorsky Krai1 (a subject of Russian Federation where the Ussuriysk Astrophysical Observatory is located). On 4 April of 2021, 17 days before, our polarimetric measurements revealed aerosol particle solely of water-ice composition (see on top left in Figure 4). For this earlier date, there were reported only 28 seats of wildfires in Primorsky Krai.2
Another potentially important source of carbonaceous materials in the atmosphere at high altitudes could be interplanetary dust particles (IDPs). These particles produce the phenomenon of the Zodiacal Light that, in the absence of light pollution, can be observed from Earth with the naked eye several hours before sunrise and after sunset. IDPs have predominantly cometary origin (e.g., Nesvorný et al., 2010). While orbiting around the Sun, these particles continually strike the Earth’s atmosphere and their total mass load is estimated to be up to 60,000 metric tons per year (Love and Brownlee, 1993).
The cosmic-dust load obviously increases on the occasions of meteor showers, which occur when the Earth encounters the debris field left by a previous comet in its orbit (Jenniskens, 2006), as relatively large cometary particles (100+ μm) continue orbiting around the Sun in virtually the same trajectory as the parent body. This results from their very small ejection velocities from the cometary nucleus (∼1 m/s) and a small effect of solar-radiation pressure on their subsequent motion. Nevertheless, in several revolutions around the Sun, these particles become dispersed along the orbit by gravitational perturbations from giant the planets (Jupiter, Saturn, etc.), and form a relatively homogeneous stream of meteoroids. This stream is also referred to as the dust trail.
Through in situ (e.g., Fomenkova et al., 1992; Ishii et al., 2008) and polarimetric studies of comets (e.g., Zubko et al., 2012; 2016; 2020b; Chornaya et al., 2020; Zheltobryukhov et al., 2020; Kochergin et al., 2021), their coma is populated by submicron and micron-sized dust particles, having Mg-rich silicate and carbonaceous-material composition. One can assume, therefore, either silicate-carbonaceous or solely carbonaceous chemical composition of the particles forming a meteor shower.
Our measurements on 18 November 2022 suggest a high abundance of carbonaceous particles in the atmosphere above 5 km (see on right bottom in Figure 6). This epoch coincides with the annual maximum of the Leonids Meteor Shower3 that originated from Comet 55P/Tempel-Tuttle. The Leonids particles strike the Earth’s atmosphere at a relative high velocity, ∼71 km/s. During peak activity in 2022, an experienced observer was capable of detecting about 12–14 meteors per hour by the naked eye.4 Note, in application to the Leonids meteor shower, a meteor that can be observed by the naked eye (i.e., apparent brightness of six mag or brighter) is caused by meteoroids having diameter larger than 1 mm. However, meteors whose brightness is comparable to the brightest stars or planets arise from meteoroids having a diameter up to 2 cm (Jenniskens, 2006).
While the meteors-per-hour rate is often used for comparison of one meteor shower to another, it poorly reflects the true number of meteoroids striking the atmosphere. For example, an investigation of the Leonids Meteor Shower during its maximum activity in 1997 by means of the Arecibo Radar revealed up to 600 meteors per hour within a region having a diameter of only 300 m (Janches et al., 2000). At an altitude of ∼100 km, these meteoroids are decelerated rapidly, ∼30 km/s2. This leads to ablation, sputtering, and eventually total disruption of the meteoroids, yielding an enormous number of submicron and micron-sized dust particles. These by-product aerosol particles are presumably what we have detected in our measurements on 18 November of 2022.
We were able to measure the polarization of the atmosphere on 18 November 2021 that corresponds to the maximum activity of the Leonids meteor shower in 2021. As one can see in the upper-right panel in Figure 5, these measurements indicate the absence of carbonaceous particles in the upper atmosphere. Unfortunately, we have not found in the literature reports of how active the Leonids meteor shower was during this epoch.
The Leonids meteor shower is well known for year-to-year variability. Moreover, every ∼33 years, the Leonids produce a so-called meteor storm, with up to 150,000 meteors-per-hour in the visible (Wu and Williams, 1996). This periodicity corresponds to the orbital period of Comet 55P/Tempel–Tuttle. The latest Leonids meteor storm was observed in 2002 and the next storm is expected in 2031. In addition, the visibility of the Leonids meteor shower is dependent on geographical location of the observer (Jenniskens, 2006). It might happen that either the rate was lower than usual or the Ussuriysk Astrophysical Observatory was not the best place to observe the Leonids meteor shower on its maximum in 2021. Repeatability of our result obtained on 18 November of 2022 is subject for further investigation.
5 Conclusion
On 24 different epochs between 4 April of 2021 and 11 December of 2022, we conducted ∼600 measurements of polarization of the atmosphere in twilight at the Ussuriysk Astrophysical Observatory. These efforts yielded 155 data points obtained at phase angles spanning the range from α = 2°–130°, while the bottom boundary of the atmosphere illuminated by direct sunlight decreased from h ≈ 46 km to about 0 km. Our measurements systematically reveal the phenomenon of negative polarization at small phase angles α < 15°, proving the dominating contribution of aerosol particles on the light-scattering response even within the broadband V filter, since gaseous emission does not produce negative polarization.
Our limited polarization measurements do not demonstrate a seasonal dependence on the atmospheric aerosols detected, but the vast majority of our measurements correspond to relatively high elevation of the shadow boundary, h > 3 km, where the population of aerosol particles is already hardly affected by precipitation.
We examined alignment of aerosol particles in the atmosphere and found that some preferential orientation could be suspected in approximately 20% of the measurements. The majority of the light-scattering measurements suggests random orientation of the aerosols.
Quantitative interpretation based on the model of irregularly shaped agglomerated debris particles has revealed their capability to reproduce the polarimetric response measured in the atmosphere. In practice, the entire set of 155 data points can be closely matched using only the agglomerated debris particles. Modeling reveals that in 9 out of 24 epochs (37.5%) the measurements can be reproduced with a single refractive index m and power-law size-distribution index n, suggesting a homogeneous distribution. During the other 9 epochs (37.5%) the measurements suggest a single chemical composition of aerosol particles (i.e., the same m), but somewhat different values of the power index n at different altitudes. No clear dependence of n on h was detected.
Therefore, in 75% of the epochs, we observed a chemically homogeneous composition of the atmosphere. These measurements could be modeled using only two different refractive indices, m = 1.313 + 0i (4 out of 18 epochs) and 1.5 + 0i (14 out of 18 epochs). The former unambiguously corresponds to water ice; whereas, the later one to mineral dust. In the latter case, there is some uncertainty about the material absorption. Non-absorbing material having Im(m) = 0 could be replaced with a material having Im(m) = 0.02, yielding nearly the same fit to the measurements, but at a somewhat larger value of the power index n. Such ambiguity could be considered as a shortcoming of the polarimetric method.
In the remaining 25% of the epochs, our modeling strongly suggests chemical heterogeneity of aerosols in the atmosphere in which at least two types of particles are needed to reproduce the measurements. One type has either water-ice composition with m = 1.313 + 0i or mineral-dust composition with m = 1.5 + 0i and 1.6 + 0.0005i. However, the second type of chemical composition was always associated with a carbonaceous composition and refractive index m = 1.855 + 0.45i. In some cases, the appearance of this material correlated with an increased number of seats of wildfire and, hence, could be related to contamination of the air with combustion products (black carbon). In other cases, we suspect the impact of a meteor shower and, hence, carbonaceous particles might have interplanetary-space origin. Sometimes it is hard to identify a presumable source of the carbonaceous particles, and this matter requires further investigation.
Finally, all the observations were conducted during epochs under clear-sky conditions when the air was transparent, meeting the high demands of astronomical applications. This was necessary to gather the light-scattering response from the aerosol particles at high altitudes. Although these particles could have a global origin, conclusions drawn in this paper are presumably dependent on the location of our observatory.
Data availability statement
The original contributions presented in the study are included in the article/supplementary material, further inquiries can be directed to the corresponding author.
Author contributions
EZ: Writing–original draft. MZ: Writing–review and editing. EC: Writing–review and editing. KS: Writing–review and editing. VL: Writing–review and editing. AP: Writing–review and editing. AK: Writing–review and editing. GK: Writing–review and editing. GV: Writing–review and editing.
Funding
The authors declare financial support was received for the research, authorship, and/or publication of this article. The work by KS, EZ, EC, VL, and AP was supported by Russian Science Foundation (agreements 19-77-10022 for polarimetric measurements and 23-77-00004 for retrievals and analysis). The work by EZ was supported by the Institute for Basic Science (IBS-R035-C1).
Conflict of interest
The authors declare that the research was conducted in the absence of any commercial or financial relationships that could be construed as a potential conflict of interest.
Publisher’s note
All claims expressed in this article are solely those of the authors and do not necessarily represent those of their affiliated organizations, or those of the publisher, the editors and the reviewers. Any product that may be evaluated in this article, or claim that may be made by its manufacturer, is not guaranteed or endorsed by the publisher.
Footnotes
1Unfortunately, this link and the link in the next footnote are currently only available from within Russia and possibly a few other countries. In the meantime, we suggest using a VPN and hope this situation changes soon. https://25.mchs.gov.ru/deyatelnost/press-centr/operativnaya-informaciya/4440854
2https://25.mchs.gov.ru/deyatelnost/press-centr/operativnaya-informaciya/svodka-chs-i-proisshestviy/4425898
3https://solarsystem.nasa.gov/asteroids-comets-and-meteors/meteors-and-meteorites/leonids/in-depth/
4https://www.imo.net/no-2022-leonid-outburst-detected/
References
Bohren, C. F., and Huffman, D. R. (1983). Absorption and scattering of light by small particles. New York, NY: Wiley. doi:10.1002/9783527618156
Bond, T. C., and Bergstrom, R. W. (2006). Light absorption by carbonaceous particles: an investigative review. Aerosol. Sci. Tech. 40, 27–67. doi:10.1080/02786820500421521
Chen, W., Xu, Y., and Fu, Q. (2021). On the negative polarization's effects at top of atmosphere. Atmos. Environ. 254, 118425. doi:10.1016/j.atmosenv.2021.118425
Chornaya, E., Zubko, E., Luk'yanyk, I., Kochergin, A., Zheltobryukhov, M., Ivanova, O. V., et al. (2020). Imaging polarimetry and photometry of Comet 21P/Giacobini-Zinner. Icarus 337, 113471. doi:10.1016/j.icarus.2019.113471
Dolgos, G., and Martins, J. V. (2014). Polarized imaging nephelometer for in situ airborne measurements of aerosol light scattering. Opt. Express 22, 21972–22990. doi:10.1364/OE.22.021972
Draine, B. T., and Flatau, P. J. (1994). Discrete-dipole approximation for scattering calculations. J. Opt. Soc. Am. A 11, 1491–1499. doi:10.1364/JOSAA.11.001491
Dubovik, O., Sinyuk, A., Lapyonok, T., Holben, B. N., Mishchenko, M., Yang, P., et al. (2006). Application of spheroid models to account for aerosol particle nonsphericity in remote sensing of desert dust. J. Geophys. Res. 111, D11208. doi:10.1029/2005JD006619
Fessenkoff, B. (1935). Détermination de la polarisation de la couronne solaire. Astron. J. Sov. Union 12, 309–323. [In French]. N/A.
Fomenkova, M. N., Kerridge, J. F., Marti, K., and McFadden, L.-A. (1992). Compositional trends in rock-forming elements of comet Halley dust. Science 258, 266–269. doi:10.1126/science.11538058
Hadamcik, E., and Levasseur-Regourd, A. C. (2003). Imaging polarimetry of cometary dust: different comets and phase angles. J. Quant. Spectrosc. Radiat. Transf. 79-80, 661–678. doi:10.1016/S0022-4073(02)00314-X
Ishii, H. A., Bradley, J. P., Dai, Z. R., Chi, M., Kearsley, A. T., Burchell, M. J., et al. (2008). Comparison of Comet 81P/Wild 2 dust with interplanetary dust from comets. Science 319, 447–450. doi:10.1126/science.1150683
Janches, D., Mathews, J. D., Meisel, D. D., and Zhou, Q.-H. (2000). Micrometeor observations using the Arecibo 430 MHz radar: I. Determination of the ballistic parameter from measured Doppler velocity and deceleration results. Icarus 145, 53–63. doi:10.1006/icar.1999.6330
Jenniskens, P. (1993). Optical constants of organic refractory residue. Astron. Astrophys. 274, 653–661. N/A.
Jenniskens, P. (2006). Meteor showers and their parent comets. Cambridge, UK: Cambridge University Press. doi:10.1017/CBO9781316257104
Junge, C. E., Chagnon, C. W., and Manson, J. E. (1961). Stratospheric aerosols. J. Atmos. Sci. 18, 81–108. doi:10.1175/1520-0469(1961)018<0081:SA>2.0.CO;2
Kahnert, M., and Kanngießer, F. (2020). Modelling optical properties of atmospheric black carbon aerosols. J. Quant. Spectrosc. Radiat. Transf. 244, 106849. doi:10.1016/j.jqsrt.2020.106849
Khvostikov, I. A. (1940). Theory of light scattering and its application in problems of air transparency and fogs. Uspekhi Fiz. Nauk. 24, 165–227. [In Russian]. doi:10.3367/UFNr.0024.194006a.0165
Kochergin, A., Zubko, E., Chornaya, E., Zheltobryukhov, M., Videen, G., Kornienko, G., et al. (2021). Monitoring the negative polarization in Comet 29P/Schwassmann–Wachmann during quiescence. Icarus 366, 114536. doi:10.1016/j.icarus.2021.114536
Konoshonkin, A. V., Borovoi, A. G., Kustova, N. V., Shishko, V. A., and Timofeev, D. N. (2022). Light scattering by atmospheric ice crystals within the physical optics approximation. Moscow, Russia: FIZMATLIT. [In Russian]. N/A.
Kustova, N., Konoshonkin, A., Kokhanenko, G., Wang, Z., Shishko, V., Timofeev, D., et al. (2022). Lidar backscatter simulation for angular scanning of cirrus clouds with quasi-horizontally oriented ice crystals. Opt. Lett. 47, 3648–3651. doi:10.1364/OL.463282
Lindqvist, H., Nousiainen, T., Zubko, E., and Muñoz, O. (2011). Optical modeling of vesicular volcanic ash particles. J. Quant. Spectrosc. Radiat. Transf. 112, 1871–1880. doi:10.1016/j.jqsrt.2011.01.032
Love, S. G., and Brownlee, D. E. (1993). A direct measurement of the terrestrial mass accretion rate of cosmic dust. Science 262, 550–553. doi:10.1126/science.262.5133.550
Muñoz, O., Moreno, F., Guirado, D., Dabrowska, D. D., Volten, H., and Hovenier, J. W. (2012). The Amsterdam–Granada light scattering database. J. Quant. Spectrosc. Radiat. Transf. 113, 565–574. doi:10.1016/j.jqsrt.2012.01.014
Nawar, S., Morcos, A. B., El Agmy, R. M., Gad, G. M. A., and Elgohary, S. (2020). Sky twilight brightness at zenith expressed in magnitudes. NRIAG J. Astron. Geophys. 9, 63–70. doi:10.1080/20909977.2020.1714176
Nesvorný, D., Jenniskens, P., Levison, H. F., Bottke, W. F., Vokrouhlický, D., and Gounelle, M. (2010). Cometary origin of the Zodiacal Cloud and carbonaceous micrometeorites. Implications for hot debris disks. Astrophys. J. 713, 816–836. doi:10.1088/0004-637X/713/2/816
Nousiainen, T., Kahnert, M., and Lindqvist, H. (2011). Can particle shape information be retrieved from light-scattering observations using spheroidal model particles? J. Quant. Spectrosc. Radiat. Transf. 112, 2213–2225. doi:10.1016/j.jqsrt.2011.05.008
Nousiainen, T., Zubko, E., Lindqvist, H., Kahnert, M., and Tyynelä, J. (2012). Comparison of scattering by different nonspherical, wavelength-scale particles. J. Quant. Spectrosc. Radiat. Transf. 113, 2391–2405. doi:10.1016/j.jqsrt.2012.03.032
Nousiainen, T., Zubko, E., Niemi, J. V., Kupiainen, K., Lehtinen, M., Muinonen, K., et al. (2009). Single–scattering modeling of thin, birefringent mineral–dust flakes using the discrete–dipole approximation. J. Geophys. Res. – Atmos. 114, D07207. doi:10.1029/2008JD011564
Okamoto, H. (2002). Information content of the 95-GHz cloud radar signals: theoretical assessment of effects of nonsphericity and error evaluation of the discrete dipole approximation. J. Geophys. Res. 107, 4628. doi:10.1029/2001JD001386
Pavlov, A. N., Zubko, E., Konstantinov, O. G., Shmirko, K., Mayor, A.Yu., and Videen, G. (2018). Vertical profile of polarization over Vladivostok using horizon shadowing: clues to understanding the altitude variation of reflectance of aerosol particles. J. Quant. Spectrosc. Radiat. Transf. 204, 94–102. doi:10.1016/j.jqsrt.2017.08.024
Piltschikoff, M. N. (1892). Sur la polarisation spectrale du ciel. Comptes Rendus Acad. Sci. Paris 115, 555–558. [In French]. N/A.
Rozenberg, G. V. (1966). Twilight: a study in atmospheric optics. New York, NY: Springer. doi:10.1007/978-1-4899-6353-6
Shkuratov, Yu., Kreslavsky, M., Kaydash, V., Videen, G., Bell, J., Wolff, M., et al. (2005). Hubble space telescope imaging polarimetry of mars during the 2003 opposition. Icarus 176, 1–11. doi:10.1016/j.icarus.2005.01.009
Shkuratov, Yu., Ovcharenko, A., Zubko, E., Volten, H., Muñoz, O., and Videen, G. (2004). The negative polarization of light scattered from particulate surfaces and of independently scattering particles. J. Quant. Spectrosc. Radiat. Transf. 88, 267–284. doi:10.1016/j.jqsrt.2004.03.029
Shmirko, K., Pavlov, A., and Zubko, E. (2018). Coating effect on light scattering by irregularly shaped particles. J. Quant. Spectrosc. Radiat. Transf. 215, 71–76. doi:10.1016/j.jqsrt.2018.05.005
Sun, W., Hu, Y., Baize, R. R., Videen, G., Kim, S. S., Choi, Y.-J., et al. (2019). Technical note: a simple method for retrieval of dust aerosol optical depth with polarized reflectance over oceans. Atmos. Chem. Phys. 19, 15583–15586. doi:10.5194/acp-19-15583-2019
Sun, W., Videen, G., and Mishchenko, M. I. (2014). Detecting super-thin clouds with polarized sunlight. Geophys. Res. Lett. 41, 688–693. doi:10.1002/2013GL058840
Ugolnikov, O. S., Kozelov, B. V., Pilgaev, S. V., and Roldugin, A. V. (2021). Retrieval of particle size distribution of polar stratospheric clouds based on wide-angle color and polarization analysis. Planet. Space Sci. 200, 105213. doi:10.1016/j.pss.2021.105213
Ulanowski, Z., Bailey, J., Lucas, P. W., Hough, J. H., and Hirst, E. (2007). Alignment of atmospheric mineral dust due to electric field. Atmos. Chem. Phys. 7, 6161–6173. doi:10.5194/acp-7-6161-2007
Videen, G. (2002). Polarization opposition effect and second-order ray-tracing. Appl. Opt. 41, 5115–5121. doi:10.1364/ao.41.005115
Videen, G. (2003). Polarization opposition effect and second-order ray-tracing: cloud of dipoles. J. Quant. Spectrosc. Radiat. Transf. 79-80, 1103–1109. doi:10.1016/s0022-4073(02)00343-6
Videen, G., Zubko, E., Arnold, J. A., MacCall, B., Weinberger, A. J., Shkuratov, Yu., et al. (2018). On the interpolation of light-scattering responses from irregularly shaped particles. J. Quant. Spectrosc. Radiat. Transf. 211, 123–128. doi:10.1016/j.jqsrt.2018.03.009
Volten, H., Muñoz, O., Rol, E., de Haan, J. F., Vassen, W., Hovenier, J. W., et al. (2001). Scattering matrices of mineral aerosol particles at 441.6 nm and 632.8 nm. J. Geophys. Res. 106, 17375–17401. doi:10.1029/2001JD900068
Willeke, K., and Brockmann, J. E. (1977). Extinction coefficients for multimodal atmospheric particle size distributions. Atmos. Environ. 11, 995–999. doi:10.1016/0004-6981(77)90029-4
Wu, Z., and Williams, I. P. (1996). Leonid meteor storms. Mon. Not. Roy. Astron. Soc. 280, 1210–1218. doi:10.1093/mnras/280.4.1210
Yurkin, M. A., and Hoekstra, A. G. (2007). The discrete dipole approximation: an overview and recent developments. J. Quant. Spectrosc. Radiat. Transf. 106, 558–589. doi:10.1016/j.jqsrt.2007.01.034
Zheltobryukhov, M., Zubko, E., Chornaya, E., Luk'yanyk, I., Ivanova, O. V., Kochergin, A., et al. (2020). Monitoring polarization in comet 46P/wirtanen. Mon. Not. Roy. Astron. Soc. 498, 1814–1825. doi:10.1093/mnras/staa2469
Zubko, E. (2015). Modeling light scattering by forsterite particles. Opt. Lett. 40, 1204–1207. doi:10.1364/OL.40.001204
Zubko, E., Kimura, H., Shkuratov, Yu., Muinonen, K., Yamamoto, T., Okamoto, H., et al. (2009). Effect of absorption on light scattering by agglomerated debris particles. J. Quant. Spectrosc. Radiat. Transf. 110, 1741–1749. doi:10.1016/j.jqsrt.2008.12.006
Zubko, E., Muinonen, K., Muñoz, O., Nousiainen, T., Shkuratov, Yu., Sun, W., et al. (2013). Light scattering by feldspar particles: comparison of model agglomerate debris particles with laboratory samples. J. Quant. Spectrosc. Radiat. Transf. 131, 175–187. doi:10.1016/j.jqsrt.2013.01.017
Zubko, E., Muinonen, K., Shkuratov, Yu., Hadamcik, E., Levasseur-Regourd, A.-C., and Videen, G. (2012). Evaluating the carbon depletion found by the Stardust mission in Comet 81P/Wild 2. Astron. Astroph. 544, L8. doi:10.1051/0004-6361/201218981
Zubko, E., Muinonen, K., Videen, G., and Kiselev, N. (2014). Dust in comet C/1975 V1 (west). Mon. Not. Roy. Astron. Soc. 440, 2928–2943. doi:10.1093/mnras/stu480
Zubko, E., Petrov, D., Grynko, Ye., Shkuratov, Yu., Okamoto, H., Muinonen, K., et al. (2010). Validity criteria of the discrete dipole approximation. Appl. Opt. 49, 1267–1279. doi:10.1364/AO.49.001267
Zubko, E., Petrov, D., Shkuratov, Yu., and Videen, G. (2005). Discrete dipole approximation simulations of scattering by particles with hierarchical structure. Appl. Opt. 44, 6479–6485. doi:10.1364/AO.44.006479
Zubko, E., Shkuratov, Yu., Kiselev, N., and Videen, G. (2006). DDA simulations of light scattering by small irregular particles with various structure. J. Quant. Spectrosc. Radiat. Transf. 101, 416–434. doi:10.1016/j.jqsrt.2006.02.055
Zubko, E., Shkuratov, Yu., and Videen, G. (2015a). Effect of morphology on light scattering by agglomerates. J. Quant. Spectrosc. Radiat. Transf. 150, 42–54. doi:10.1016/j.jqsrt.2014.06.023
Zubko, E., Videen, G., Arnold, J. A., MacCall, B., Weinberger, A. J., and Kim, S. S. (2020a). On the small contribution of supermicron dust particles to light scattering by comets. Astrophys. J. 895, 110. doi:10.3847/1538-4357/ab8ae4
Zubko, E., Videen, G., Hines, D. C., and Shkuratov, Yu. (2016). The positive-polarization of cometary comae. Planet. Space Sci. 123, 63–76. doi:10.1016/j.pss.2015.09.020
Zubko, E., Videen, G., and Shkuratov, Yu. (2015b). Retrieval of dust-particle refractive index using the phenomenon of negative polarization. J. Quant. Spectrosc. Radiat. Transf. 151, 38–42. doi:10.1016/j.jqsrt.2014.09.015
Zubko, E., Zheltobryukhov, M., Chornaya, E., Kochergin, A., Videen, G., Kornienko, G., et al. (2020b). Polarization of disintegrating comet C/2019 Y4 (ATLAS). Mon. Not. Roy. Astron. Soc. 497, 1536–1542. doi:10.1093/mnras/staa1725
Zubko, E. S., Shkuratov, Yu.G., Hart, M., Eversole, J., and Videen, G. (2003). Backscattering and negative polarization of agglomerate particles. Opt. Lett. 28, 1504–1506. doi:10.1364/OL.28.001504
Keywords: atmosphere, observations, polarization, aerosols, microphysics, agglomerated debris particles
Citation: Zubko E, Zheltobryukhov M, Chornaya E, Shmirko KA, Lisitsa VV, Pavlov AN, Kochergin A, Kornienko G and Videen G (2024) Characterizing atmospheric aerosols using polarimetry and shadow hiding. Front. Remote Sens. 4:1321621. doi: 10.3389/frsen.2023.1321621
Received: 14 October 2023; Accepted: 11 December 2023;
Published: 05 January 2024.
Edited by:
Yongxiang Hu, National Aeronautics and Space Administration, United StatesReviewed by:
Weizhen Hou, Harvard University, United StatesXiuqing Hu, China Meteorological Administration, China
Copyright © 2024 Zubko, Zheltobryukhov, Chornaya, Shmirko, Lisitsa, Pavlov, Kochergin, Kornienko and Videen. This is an open-access article distributed under the terms of the Creative Commons Attribution License (CC BY). The use, distribution or reproduction in other forums is permitted, provided the original author(s) and the copyright owner(s) are credited and that the original publication in this journal is cited, in accordance with accepted academic practice. No use, distribution or reproduction is permitted which does not comply with these terms.
*Correspondence: Gorden Videen, gvideen@spacescience.org