Complete characterization of ocean color radiometers
 Viktor Vabson1*
  Ilmar Ansko1
  Kim Duong1
  Riho Vendt1
  Joel Kuusk1
  Kevin Ruddick2
  Agnieszka Bialek3
  Gavin H. Tilstone4
  Juan Ignacio Gossn5
  Ewa Kwiatkowska5
- 1Tartu Observatory, University of Tartu, Tartu, Estonia
- 2Royal Belgian Institute of Natural Sciences, Brussels, Belgium
- 3National Physical Laboratory, Climate and Earth Observation Group, Teddington, United Kingdom
- 4PML—Plymouth Marine Laboratory, Plymouth, United Kingdom
- 5European Organisation for the Exploitation of Meteorological Satellites (EUMETSAT), Darmstadt, Germany
Verifying and validating waterleaving radiance measurements from space for an accurate derivation of Ocean/Water Colour biogeophysical products is based on concurrent high-quality fiducial reference measurements (FRM) carried out on the ground or water body. The FRM principles established by the Committee on Earth Observation Satellites (CEOS) recommend that in situ Ocean Colour radiometers (OCR) have a documented history of SI traceable calibrations including uncertainty budgets. Furthermore, there can be significant differences between calibration and use of the instruments in the field due to differences in operating temperature, angular variation of the light field (especially for irradiance sensors), the intensity of the measured radiation, and spectral variation of the target, among others. Each of these factors may interact with individual properties of the instrument when deployed in the field, and estimation of such uncertainties requires instrument characterization in addition to the absolute radiometric calibration if expanded uncertainties within ±10% (k = 2) are the aim. The FRM4SOC Phase 2 project - funded by the European Commission in the frame of the Copernicus Programme and implemented by EUMETSAT - contributes to these efforts, aiming at developing an operational and sustained network of radiometric measurements of FRM quality. Within FRM4SOC-2, scientists from the Tartu Observatory (TO) of the University of Tartu performed an unprecedented batch of calibrations and characterizations on a set of 37 hyperspectral field radiometers representative of the most used OCR classes within the OC community. The calibrations and characterizations performed include the determination of radiometric responsivity, long-term stability, the accuracy of the spectral scale, non-linearity and accuracy of integration times, spectral stray light, angular response of irradiance sensors in air, dark signal, thermal sensitivity, polarization sensitivity, and signal-to-noise ratio of individual OCRs. Consistent correction of biases and extended uncertainty analysis procedures of in situ data obtained from different instruments and measurement models need to be clearly defined, which is the objective of this paper.
1 Introduction
Fiducial reference measurements (FRM) provide independent ground measurement results with uncertainty estimates suitable for validation of the satellite remote sensing data products (Vendt et al., 2021). Scientists from the Tartu Observatory (TO) of the University of Tartu have lead the FRM4SOC (Fiducial Reference Measurements for Satellite Ocean Colour) project funded by the European Commision’s Copernicus Programme, initially (2016–2019) launched by the European Space Agency (ESA) (Banks et al., 2020) and followed-up in a second phase (FRM4SOC-2) (2021–2023) by the European Organization for the Exploitation of Meteorological Satellites EUMETSAT (“EUMETSAT | FRM4SOC Phase-2,” 2023). The necessary conditions for water remote sensing (Vendt et al., 2021) are traceability of measurements to the International System of Units (SI) (Białek et al., 2020b; BIPM, 2019) and evaluation of uncertainty of each measurement result (Białek et al., 2020a; JCGM 100:2008,” 2008).
Any field radiometer used for the validation of satellite ocean color radiometry data must have a documented history of SI traceable calibrations including uncertainty statements (Mueller et al., 2003; Zibordi et al., 2019; Vabson et al., 2022). For this, regular calibration and complete characterization of OCRs is required due to non-negligible drifts observed in the responsivity of sensors, frequently observed biases of single instruments from the ideal realization of specification values, and to account for environmental factors that may affect the results. Moreover, there can be significant differences between calibration and later field use regarding operating temperature, angular variation of the light field (especially for irradiance sensors), the intensity of the measured radiation, spectral variation of the target, etc. Each of these factors may interact with individual properties of the instrument when used in the field, and estimation of uncertainties therefore requires instrument characterization in addition to the absolute radiometric calibration (Vabson et al., 2019a; Vabson et al., 2019b; Zibordi et al., 2019; Vabson et al., 2022). Characterization results describe the properties of individual radiometers. A system of two or three radiometers however, is often used for the determination of remote-sensing reflectance and/or fully normalized water-leaving radiance [see, e.g. Zibordi et al., 2019; Ruddick et al., 2019a; Ruddick et al., 2019b]. Data handling of a three-radiometer system, including uncertainty contributions, is substantially more complicated compared to that for a single radiometer. For a single radiometer, some parameters that make a significant contribution to the uncertainty budget may have almost no effect on a three-radiometer system. For evaluating specific uncertainty contributions to the total uncertainty of final measurands, a particular measurement model and a full set of relevant input quantities must be known. Besides calibration/characterization (cal/char) results, the input quantities of the measurement model include additional information, that must be acquired during field measurements.
Characterising the spectral radiation measurands associated with the OC remote sensing products (irradiance, radiance, remote-sensing reflectance, etc.) for the above-described effects allows assessing:
• steady drift and random variations of the radiometric responsivity,
• individual differences of radiometers,
• environmental conditions influencing the data.
This study focuses on the two most common OCR instrument models used for Fiducial Reference Measurements:
• TriOS RAMSES,
• Sea-Bird Scientific HyperOCR.
The selection of radiometers reflects the typical choice of instruments used for in situ validation of satellite-derived water reflectance (“ocean color validation”), by the marine ocean optics community. According to the above-water field measurement protocols (Mobley, 1999; Mueller et al., 2003; Ruddick et al., 2019a; Zibordi et al., 2019; Ruddick et al., 2019b) usually a system with three radiometers denoted by the combination “(2L, 1E)” is used: two radiance sensors, for upwelling (water) and downwelling (sky) radiances, respectively, and an irradiance sensor, measuring downwelling irradiance. For the RAMSES and HyperOCR this is generally achieved by three separate radiometers (Hooker and Lazin, 2000; Ruddick et al., 2006), although the measurement can also be achieved with two radiometers, one irradiance and one radiance, if the latter is mounted on a pointing system for both water- and sky-viewing (Vansteenwegen et al., 2019).
In total, 37 OCRs were calibrated and characterized in TO in the frame of FRM4SOC phase-2. In Section 2, the description of the calibrated and characterized instruments, and a short review about the measurement of parameters needed for correction of biases and for the full description of uncertainty contributions is given. Calibration and characterization results are presented in Section 3. The majority of OCRs involved in FRM4SOC-2 project were subject to a full list of characterizations as presented in (Zibordi et al., 2019). In this paper, besides the calibration results, the outcomes of only a few characterizations (angular response of irradiance sensors in air, non-linearity of radiometric response, steady-state and dynamic thermal sensitivity) are described. In Section 4, some specific problems related with correcting in situ results are considered. Specifically, the size of corrections may depend on measurement configuration and will be substantially different when evaluating measurements done with a single OCR compared to those done with three-radiometer systems. Discussion about the calibration and characterisation results and conclusions are presented in Section 5. Throughout the article, above water measurements are discussed. The calibration and characterization procedures of OCRs used at the optical laboratory of TO are the same for in air and in water instruments, except for the immersion factors which are additionally needed for the in water measurements. The terminology and nomenclature (Lu, Ld, Ed) used for the above water measurements is based on (Ruddick et al., 2019a; 2019b; Goyens and Ruddick, 2023).
2 Materials and methods
2.1 Description of radiometers subject to calibration and characterization
A list of key parameters of TriOS RAMSES and Sea-Bird Scientific HyperOCR radiometers for both irradiance E and radiance L sensors are given in Table 1. The information are based on documents supplied by the manufacturers of OCRs and components/modules, and on the results of on-site testing of instruments. At first, OCRs were radiometrically calibrated, then characterized according to parameters listed in Table 2, and then recalibrated. These radiometers measure radiation from the atmosphere or water in the spectral range from 350 to 900 or 1000 nm with a resolution of 10 nm. The radiometers contain a spectrometer module (Zeiss MMS-1), proprietary front-end electronics and optical input elements in a watertight housing. The housing is cylindrically symmetrical, with the optical input and electrical connector in the opposite ends of the cylinder. The housing is fabricated from stainless steel (RAMSES) or Acetron (HyperOCR). The optical axis is expected to coincide with the center of the cylinder. The wavelength scale and some other parameters are defined in the calibration files provided by the manufacturer.
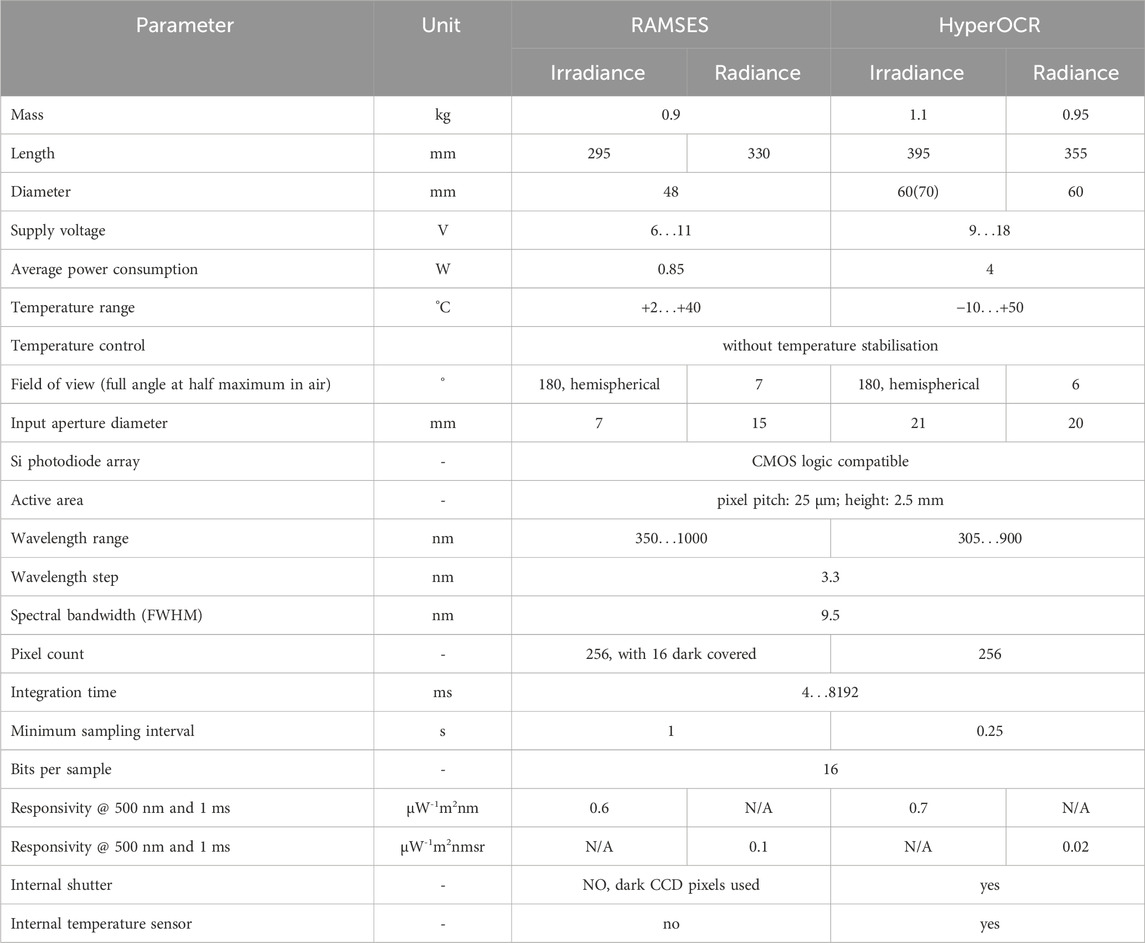
Table 1. Key parameters of the radiometers.
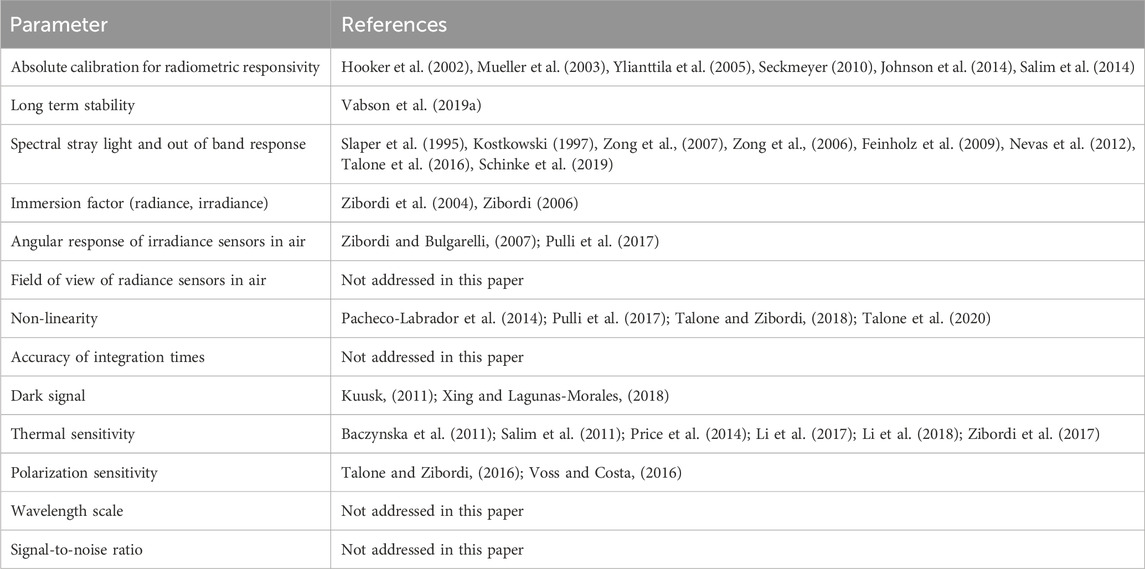
Table 2. List of characterized OCR properties and references where the characterization procedures are described.
2.2 Radiometric characterization
The complete calibration and characterization scheme for the OCRs was designed by following the guidelines of the IOCCG protocols (Zibordi et al., 2019) and the measurements performed in FRM4SOC Phase-1 (Vabson et al., 2019b; 2019a). Characterization procedures of OCRs used at the optical lab of TO are largely based on former studies and publications carried out for similar radiometers. A full list of characterized parameters, which can affect field measurements and are needed for correction of biases and evaluation of uncertainties is given in Table 2.
Limitations in the design and construction of OCRs inhibit significantly the characterization and the use of characterization results for correcting in situ data. Changes in the radiometric response due to the self-heating in stable laboratory conditions can distort the calibration and characterization results. For example, small deviations in spectra due to sensitivity to the polarization state and/or angular effects can be of the same magnitude as the thermal responsivity change of the radiometer. The radiometer’s response will drift with the varying internal temperature, which in turn depends on the data acquisition process/rate. Due to internal self-heating, achieving good reproducibility of the calibration and characterization results may be difficult.
2.2.1 Absolute calibration for radiometric responsivity
Absolute radiometric calibration of OCRs is needed to derive values of measured quantities accompanied by the specific SI unit and an estimate of measurement uncertainty from field results obtained in arbitrary units. This approach makes results obtained by using different sensors at different times comparable. The spectral responsivity of a radiometer is usually calibrated by measuring a known radiation source aligned at a specified distance. Procedures for this are well established and validated (Hooker et al., 2002; Mueller et al., 2003; Ylianttila et al., 2005; Seckmeyer, 2010; Johnson et al., 2014; Salim et al., 2014). Radiometric calibration of the irradiance and radiance sensors and their uncertainty budgets for the optics laboratory at TO are described in (Vabson et al., 2019a) and in more detail in (Vabson et al., 2022). The uncertainty of radiometric calibration described in (Vabson et al., 2019a) has been validated by an international comparison between four participants (TO, National Physical Laboratory, Joint Research Centre, and TriOS) in 2016, and, since 2018, is accredited by the Estonian Accreditation Centre (EAK).
2.2.2 Angular response of irradiance sensors in air
For determination of the angular response, a pseudo-collimated light beam is needed. Such a beam could be formed by using a point source with collimating optics using lenses, spherical or parabolic mirrors or the bare point source far enough away from the radiometer’s input diffuser. The latter is impractical due to too low irradiance levels for most of the OC radiometers. The collimated beam defines the optical axis of the setup. The radiometer should be rotated in the plane coplanar to the optical axis so that the crossing of the optical and rotation axes stays in the center of the diffuser’s surface. For an ideal diffuser, the radiometer’s output signal should follow the cosine law with respect to the rotation angle θ over all wavelengths of the radiometer. To guarantee reproducibility of characterization results, for angular measurements of irradiance sensors the sensor’s azimuth angle shall be clearly defined and recorded in the characterization report.
2.2.3 Non-linearity of radiometric response
For determination of the radiometric non-linearity, a stable light source (e.g., the calibration source) was measured by using at least two different integration times. Following (Vabson et al., 2019a; Lin et al., 2022), the absolute non-linearity error
where
2.2.4 Dark signal
Radiometers usually have a non-null output called dark signal without any input flux at the entrance optics (Zibordi et al., 2019). Dark signal is caused by the photodetector dark current and additional contributions such as the electronic offset and varies largely with temperature and integration time. Due to varying conditions, frequent measurements of the dark signal are essential. The optimal way during both the characterization and the field measurements is to measure the dark signal and the illuminated signal with equal integration times and as close in time as possible to minimize internal temperature drifts between these measurements.
2.2.5 Thermal sensitivity
Temperature is among the most significant environmental factors impacting OCR response (Zibordi et al., 2017; Vabson et al., 2022). Both the radiometric responsivity and the dark signal of a sensor are temperature sensitive. For determination of the thermal coefficients, the radiometer was immersed in a cylindrical thermally controlled water tank, equipped with an optical grade fused silica window. Although any climate chamber with an optical window might be suitable, submersion of the OCRs in a liquid tank is preferable for frequent repetition since this provides much better thermal contact with the environment and faster thermal adaptation, compared to in air adaptation times which can exceed hours. The characterization setup with a lamp (in the case of irradiance sensor) or a lamp-plaque or lamp-sphere (in the case of radiance sensors) is similar to the corresponding radiometric calibration setups. The crucial parameter of the light source is temporal stability, while the absolute irradiance/radiance output is not that important.
For determination of the thermal coefficients, temperature setpoints were selected as +5 °C, +10 °C, +20 °C, +30 °C, +35 °C and +40 °C to cover the temperature range expected during field use. The temperature was maintained at each selected setpoint for about an hour for reaching thermal equilibrium. Three integration times of the radiometer were used at each temperature setpoint to account for the non-linearity effect. At least two scans were performed for each radiometer, with temperature ramping up and down, respectively.
Accounting for thermal effects with varying temperature is complicated, but in field conditions, the temperature is usually varying. Therefore, dynamic tests have been performed in a thermostat to evaluate the possible effects from changing temperature on the radiometer measurement signal by sweeping the temperature from 5°C up to 40°C and back down to 5°C. Temperature sweeping rate was 0.5°C/min with a full test length of 4 h.
2.2.6 Polarization sensitivity
For the characterization of the polarization sensitivity of a radiance sensor, a linearly polarized source is required (Talone and Zibordi, 2016). The source can be created by using an unpolarized radiance source (an integrating sphere or lamp-plaque setup) and a linear polarizer with known properties. The sensor’s azimuth angle is defined and recorded in the same way as for angular measurements.
2.2.7 Wavelength scale
For calibration of the wavelength scale, fixed narrow-band sources with known wavelength reference values such as lasers, gas discharge lamps, certified sharp absorption line filters or tuned narrow-band sources such as monochromators and tunable lasers can be used. According to the specifications of the manufacturers (TriOS, 2019; Sea-Bird Scientific, 2024), the wavelength accuracy of TriOS RAMSES and Seabird HyperOCR radiometers is within ±0.3 nm. Therefore, the characterization setup has to provide reference values with smaller or at least with the same uncertainty.
2.2.8 Signal-to-noise ratio
The signal-to-noise ratio (SNR) is determined as the ratio of an averaged signal with subtracted dark to the standard deviation of a single measurement accounting for the variance of both light and dark signal.
3 Calibration and characterization results
3.1 Radiometric responsivity
In the context of the FRM4SOC projects, all radiometers involved in inter-comparison exercises must be uniformly calibrated immediately before comparison. The calibration state of sensors before calibration at the optical lab of TO and after calibration is shown in Figure 1A (Vabson et al., 2019a) and in Figure 1B. Agreement of measurement results for irradiance (E) and radiance (L) sensors were evaluated as a standard deviation calculated from the individual comparison spectra normalized by the consensus value (e.g., mean or median). The relative standard deviation of individual differences of the radiometers estimated with the previous calibration coefficients was found to be within 5%–10% if the same stable radiation source was measured in controlled laboratory conditions (using an integrating sphere for the radiance, and a Quartz Tungsten Halogen (QTH) lamp on the optical axis for the irradiance sensors). Just after calibration, calculating the same results with the fresh determined calibration coefficients the relative standard deviation was within ±1%. Agreement between OCRs before FRM4SOC phase 2 is shown in Figure 1B where for RAMSES and HyperOCR sensors the relative standard deviation of individual differences was within 2% and 10%, respectively. These results highlight the crucial role of reliable SI-traceable radiometric calibrations in improving agreement between the OCRs used by participants in all comparison exercises performed in the frame of the FRM4SOC projects (Vabson et al., 2019b; 2019a; Alikas et al., 2020; Tilstone et al., 2020).
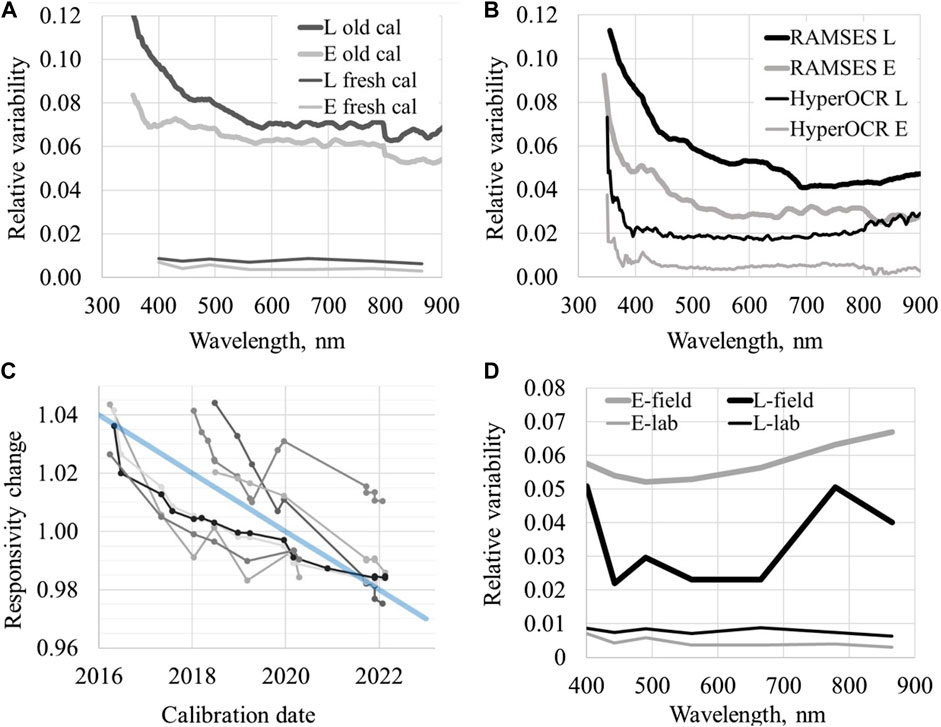
Figure 1. Agreement of measurement results for irradiance (E) and radiance (L) sensors as a function of calibration state and environmental conditions. (A) Agreement between OCRs before FRM4SOC-1 (thick lines), after calibration during FRM4SOC-1 (thin lines). (B) Agreement between OCRs before FRM4SOC-2; RAMSES sensors (thick lines), and HyperOCR sensors (thin lines). (C) Responsivity drift at 550 nm of selected OCRs with the thick blue line representing a 1% annual responsivity drop (linear fit). (D) Agreement between OCRs with fresh calibration during the field comparison (thick lines), and during the laboratory comparison (thin lines) without any characterisation corrections applied.
Variation of the radiometric responsivity over many years for selected instruments is shown in Figure 1C. Responsivity drift is monitored in the spectral range from 400 nm to 800 nm. Average drift is close to −1% per year (shown with broad blue line). Occasionally however, a responsivity jump of several percent may happen. Due to drift of the OCRs, recalibration is advisable before and after each deployment. Yearly re-calibration is recommended as a minimum requirement to achieve FRM standards. More frequent checking of responsivity is also recommended, e.g., using field portable light sources or natural light sources, especially for long-term unsupervised systems where fore-optics contamination may occur.
Variation of the radiometric responsivity as a function of the measurement conditions for freshly calibrated radiometers is shown in Figure 1D. The relative standard deviation of individual differences during the field intercomparison of radiometers was around 5% (thick lines), and during the laboratory intercomparison below 1% (thin lines) (Vabson et al., 2019b; 2019a). Any corrections that rely on characterization of radiometers during these exercises were not applied. Spread of the laboratory intercomparison results was small as the measurement conditions were close to the calibration conditions. Due to significant difference in conditions of the field deployments, instrument characterisation in addition to the absolute radiometric calibration and respective corrections are needed if expanded uncertainties below ±10% (k = 2) are to be achieved.
3.2 Angular response of irradiance sensors in air
The cosine response in air of a HyperOCR irradiance sensor is shown in Figure 2A. The cosine response error for HyperOCR sensors is usually within ±2% in the range of incident angles from −60° to +60°. The cosine response in air for a RAMSES irradiance sensor is shown in Figure 2B. The cosine response error for RAMSES sensors is often significantly larger than the cosine response error of HyperOCR sensors, with greater variability between individual sensors. Measurements at TO have shown that RAMSES sensors may have large cosine errors that are around ±10% (Vabson et al., 2019b). In addition, angular response of RAMSES irradiance sensors is often markedly more asymmetrical than for HyperOCR.
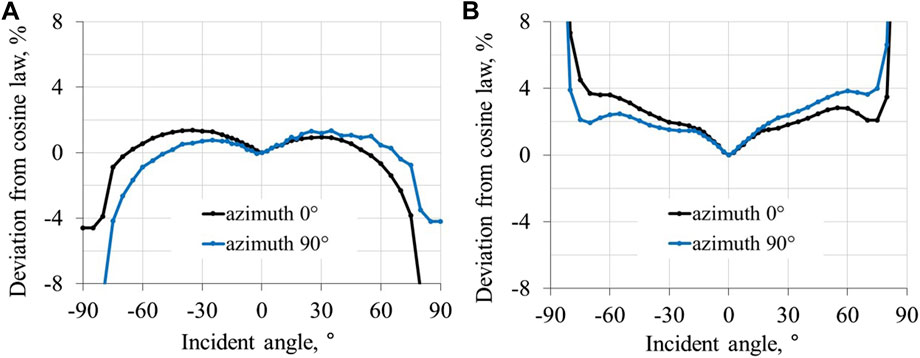
Figure 2. Angular response of irradiance sensor as a function of OCR’s azimuth plane. (A) Deviation from cosine law of one HyperOCR sensor. (B) Deviation from cosine law of one RAMSES sensor.
The determination of cosine response of irradiance sensors depends strongly on the radiation source used and the measurement geometry. Therefore, careful choice of the source, proper baffling of the measurement beam and evaluation of the beam’s spatial uniformity are required. As the results are extremely sensitive to small misalignments, repeating the full alignment and validating it against the opposite azimuth is advisable by rotating the radiometer around its axis by 180°. Azimuth planes differing in 180° should coincide, but with opposite sign of the incident angle. Accounting for temporal and thermal drifts is also necessary. Due to asymmetry of the cosine response, the azimuth angle of the OCR should be specified during characterization and during field deployments (and an azimuthal reference must therefore be marked on the OCR).
3.3 Non-linearity of radiometric response
Figure 3A shows the difference between non-linearity coefficients α(λ) determined using two methods. During radiometric calibration, the full-spectrum α(λ) was determined in 2018 and twice in 2022. Determination with an adjustable monochromatic source was made in 2022. In the central spectral part, the agreement between the results is satisfactory. Determination by using the adjustable monochromatic source is clearly preferable due to a better signal to noise ratio in the UV and NIR parts of the spectrum. This method is therefore considered as validation/reference for the full-spectrum results.
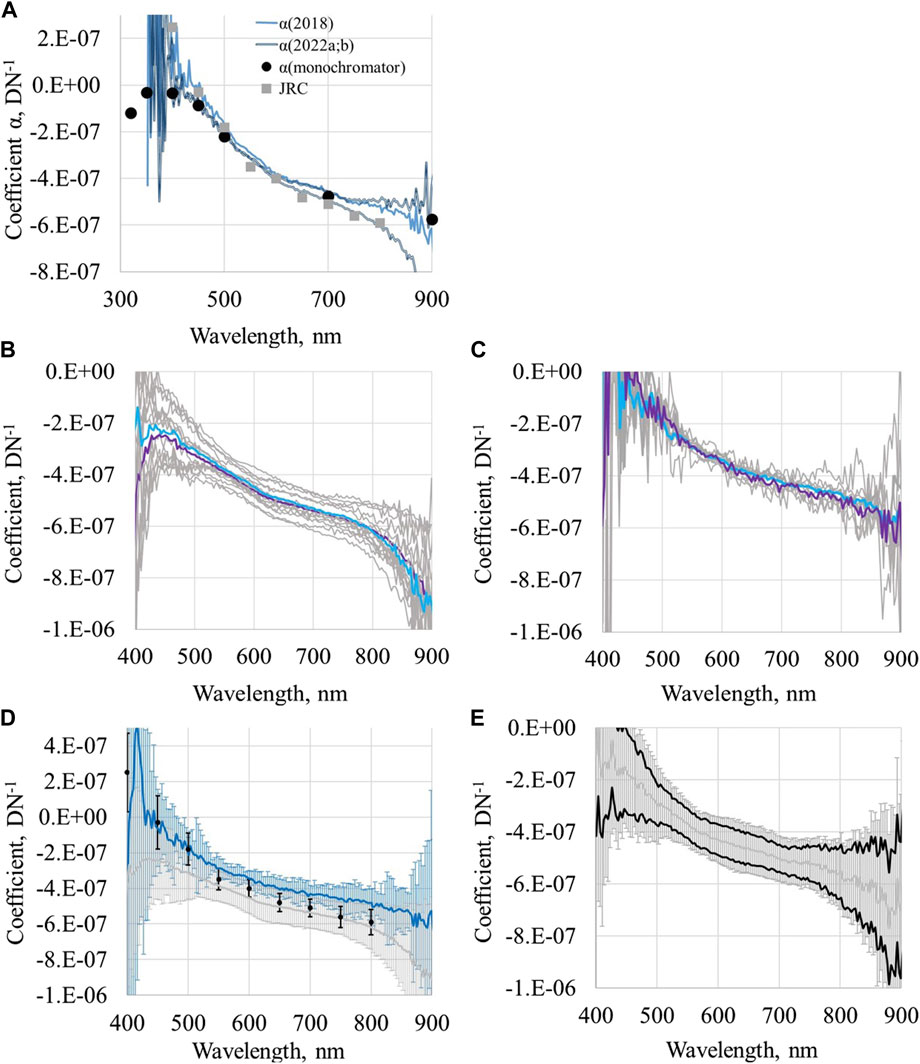
Figure 3. Non-linearity of radiometric response of OCRs. (A) Non-linearity coefficient α(λ) of a RAMSES radiance sensor (SAM_821E) determined during calibration with a FEL lamp (in 2018 blue line, in 2022 gray lines), using an adjustable monochromatic source (dots), and results from JRC (squares) (Talone and Zibordi, 2018; Talone et al., 2020). (B) Spread of non-linearity coefficients determined during FRM4SOC-2 for RAMSES. Mean of E sensors (violet line), and L sensors (blue line). (C) Spread of non-linearity coefficients determined during FRM4SOC-2 for HyperOCR. (D) Class-specific presentation of non-linearity coefficients with expanded uncertainty for RAMSES (gray) and HyperOCR (blue), including results from JRC (Talone and Zibordi, 2018; Talone et al., 2020) shown as dots. (E) Sensitivity of non-linearity coefficient to small changes in integration time. Class-specific distribution: gray showing expanded uncertainty; non-linearity coefficients for integration time changed by ±0.1%: black.
The range of non-linearity coefficients for 16 RAMSES sensors is shown in Figure 3B and for 9 HyperOCR sensors in Figure 3C. The range of variation in
The influence of integration times on the accuracy of the non-linearity coefficient is shown in Figure 3E. The integration time initially set to 64 ms was changed by ±0.1%. This small deviation from the correct set value 64 ms will cause changes in α which are comparable with the measured spread of non-linearity coefficients shown for the RAMSES sensors in Figure 3B. Thus, non-linearity determination based on two different integration times will give reliable results only when the relative uncertainty of setting integration times is better than 0.03%.
3.4 Thermal sensitivity
In Figure 4A the thermal coefficients for the radiance sensors after correction for non-linearity for RAMSES (black) and for HyperOCR (gray) are given together with expanded uncertainty (k = 2) of the temperature coefficients.
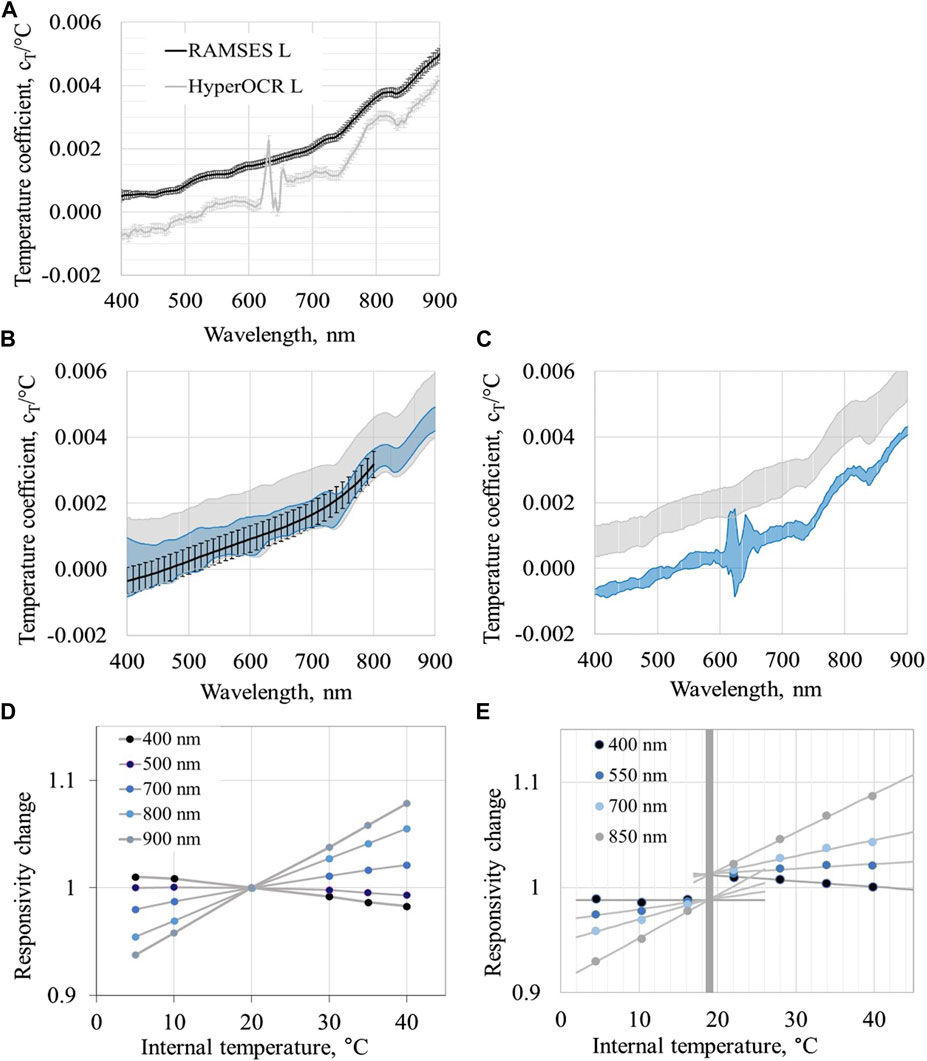
Figure 4. Steady-state thermal properties of the OCRs. (A) Individual temperature coefficient of one RAMSES (black) and one HyperOCR (gray) radiance sensor with expanded uncertainties. (B) Class-specific temperature coefficients for RAMSES radiance (blue region) and irradiance (gray region). Data from JRC (Zibordi et al., 2017) are indicated by a black line. (C) Same as B but for HyperOCR. (D) Responsivity-temperature plots for HyperOCR radiance sensor and (E) for HyperOCR irradiance sensor.
Class-specific temperature coefficients at equilibrium conditions for 17 individual characteristics of RAMSES sensors (9L and 8E) is given in Figure 4B and for 8 HyperOCR sensors (4L and 4E) is given in Figure 4C. Additionally, the results of the Joint Research Centre (JRC) (Zibordi et al., 2017) based on data of four RAMSES sensors are shown in Figure 4B. There is no significant difference between TO and JRC. The spread of JRC results is smaller than the spread of TO data given that it contains much larger group of individual characteristics. Distributions of the RAMSES sensors partly cover each other, but the spread of the irradiance sensors is about twice the spread of the radiance sensors. Distributions of the HyperOCR radiance and irradiance sensors are clearly separated (Figure 4B), but the spread of both radiance and irradiance sensors is much smaller than the typical range for the RAMSES sensors. Larger difference between the HyperOCR radiance and irradiance sensors is likely to be caused by the high thermal sensitivity of the material, polytetrafluoroethylene (PTFE), used for the construction of the cosine collector. The phase transition of PFTE at 19°C can cause relative change of the optical transmittance around 3% (Ylianttila and Schreder, 2005). The manufacturer does not provide details of the diffuser material for the HyperOCR irradiance sensors, however, the discontinuity in the thermal dependence of these radiometers around 19 °C ambient temperature resembles the properties of PTFE. Responsivity-temperature plots for HyperOCR radiance sensor are shown in Figure 4D and for irradiance sensor in Figure 4E. Responsivity-temperature relationship of the radiance sensor is well-suited for applying a linear model to estimate the temperature coefficient, but for the irradiance sensor due to a stepwise change in the signal at 19°C the linear model is much less convenient. The uncertainty of the HyperOCR irradiance sensors increases, especially if measurements are performed within a temperature range that contains this point (Figure 4E).
3.5 Dynamic thermal sensitivity
A rather large difference between external and internal temperature of an OCR will be seen if a radiometer is equipped with an internal temperature sensor. For the HyperOCR sensor immersed into a water thermal bath, the difference between internal and external temperatures is about (2…3) °C (Figure 5A), depending how data are acquired, and on the ambient fluid. The temperature difference of the same sensor used in air can be much larger, even reaching 5 °C.
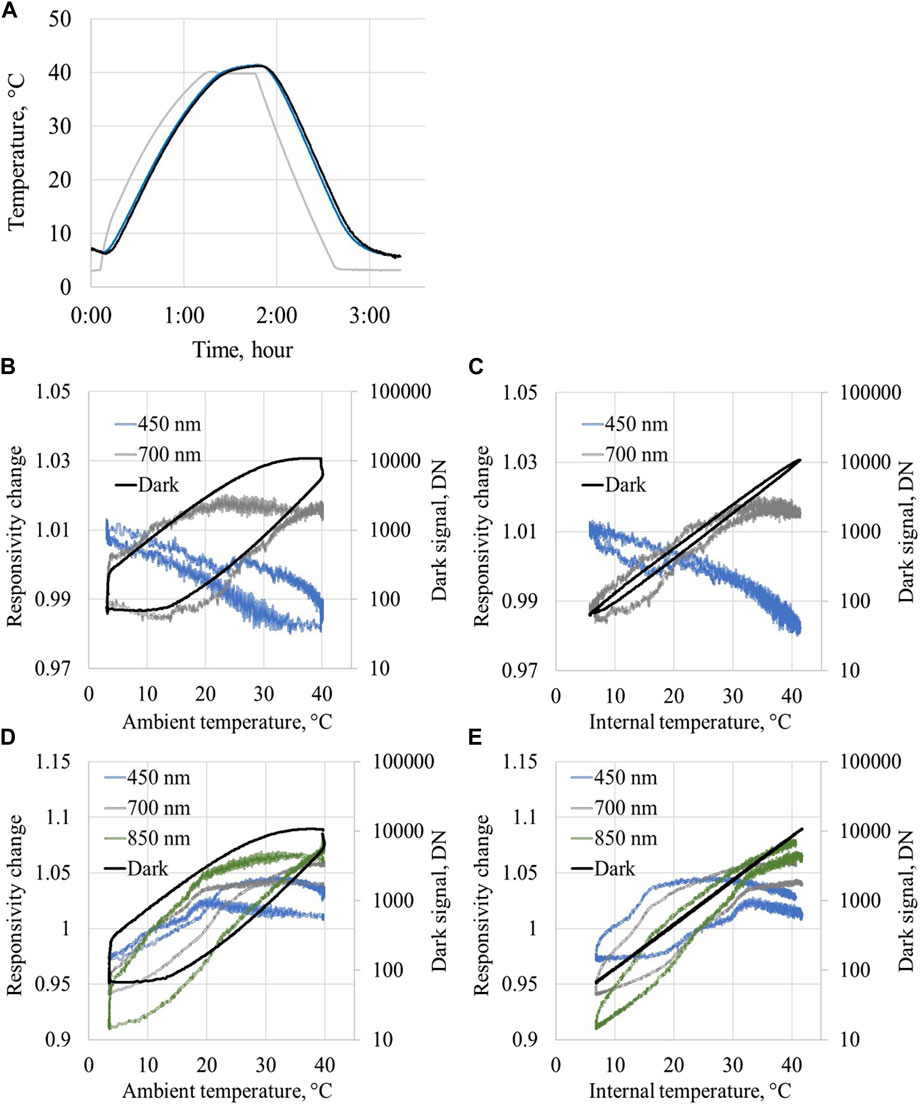
Figure 5. Dynamic thermal properties of the radiance and irradiance OCRs. (A) Time lags and differences between different temperature sensors (gray: ambient temperature sensor, blue: internal temperature sensor (added ad hoc in the case of TriOS): black: temperature calculated from the dark signal) at varying temperatures measured for a radiometer immersed in water. (B) Relative variations of optical signal of HyperOCR radiance sensor as a function of ambient temperature (blue: 400 nm, gray: 700 nm). Variation of the dark signal (black) is shown using logarithmic scale. (C) Optical and dark signal of HyperOCR radiance sensor as a function of internal temperature. (D) Optical and dark signal of HyperOCR irradiance sensor as a function of ambient temperature. (E) Optical and dark signal of HyperOCR irradiance sensor as a function of internal temperature.
Strong hysteresis of the optical signal of the radiometers is evident if the signal is presented as a function of the ambient temperature (see Figures 5B, D). As well as the responsivity change at 400 nm and 700 nm, the radiometer’s dark signal is shown. Hysteresis of the optical signal contributes significantly to the measurement uncertainty. The situation is similar to field measurements, where the temperature is obtained with an external temperature sensor. In this case, uncertainty due to hysteresis can be similar or even larger than the change in thermal responsivity. Hysteresis becomes significantly smaller if the same data are presented as a function of temperature measured with the internal temperature sensor of the radiometer (Figure 5C). In this case, the contribution from the temperature correction will dominate. This clearly shows the importance of an internal temperature sensor of a radiometer used under variable environmental conditions. In addition, correcting for temperature effects is inefficient without an internal temperature sensor due to the large uncertainty of the determined temperature difference under calibration and found in the field.
Hysteresis of the optical signal of the HyperOCR irradiance sensor is shown in Figures 5D, E. As seen in Figures 5B–E, and the variations in the dark signal of both radiance and irradiance sensors are very similar, implying that thermal effects on both optical sensors are comparable. The behavior of the optical and dark signal of the radiance sensor (Figures 5B, C) is also similar indicating a common source of hysteresis. For irradiance sensors, the cosine collector, which is known to have an abrupt change of transmittance at around 19°C, is located on the external surface, causing additional hysteresis compared to the radiance sensors. Consequently, hysteresis of the optical signal did not decrease substantially when presented as a function of the internal temperature sensor (Figure 5E), although the dark signal hysteresis is removed, as expected. Thus, for HyperOCR irradiance sensors, using internal temperature will not avoid an increase in uncertainty due to hysteresis.
4 Correcting in situ data
The measurement data may lead to different measurement results and uncertainties depending on how the measurement process is modeled. This is dependent on which statistical assumptions are used, which approximations are applied, and which environmental factors are taken into account. For radiometric in situ measurements, at least three levels of measurement outputs should be distinguished:
• instrument indications or readings—raw data level;
• measurement results of a single radiometer—values attributed to the measured target (e.g., water, sky, upper hemisphere), accompanied by a measurement unit and an uncertainty estimate;
• measurement results of a multi-radiometer system–calculated from two or more radiometers.
If a three radiometer system is used, accounting for the correlations between input quantities is crucial. Strong correlations are likely to occur if the same calibration standards have been used for calibration of different radiometers within a short time period from calibration, if the characteristics of the radiometers, and measurement environmental conditions are similar. Small differences in internal heating of the synchronously working individual radiometers and/or slightly deviating measurement conditions of the three-radiometer system used in the field however, may significantly change the correlations between the data of the radiometers.
A comprehensive characterization of the radiometers and the implementation of correction schemes enables a reduction in the uncertainties of field data. If only a single radiometer is used, the application of cal/char data is quite straightforward, and cal/char uncertainties contribute entirely to the overall uncertainty budget of the measurement data. For example, relative temperature correction for six individual radiometers as a function of difference from the calibration temperature is shown in Figure 6A. During field use, possible thermal full scale effect for these radiometers will remain within ±10%. In Figure 6B, thermal effects of the three-radiometer system with large discrepancy between individual thermal coefficients of radiance and irradiance sensors are presented for maximum bias from the calibration temperature of ±20°C. The effect is proportional to both (i) the deviation of the in-field temperature from the calibration temperature, and (ii) to the difference between the thermal coefficients of the radiance and irradiance sensors.
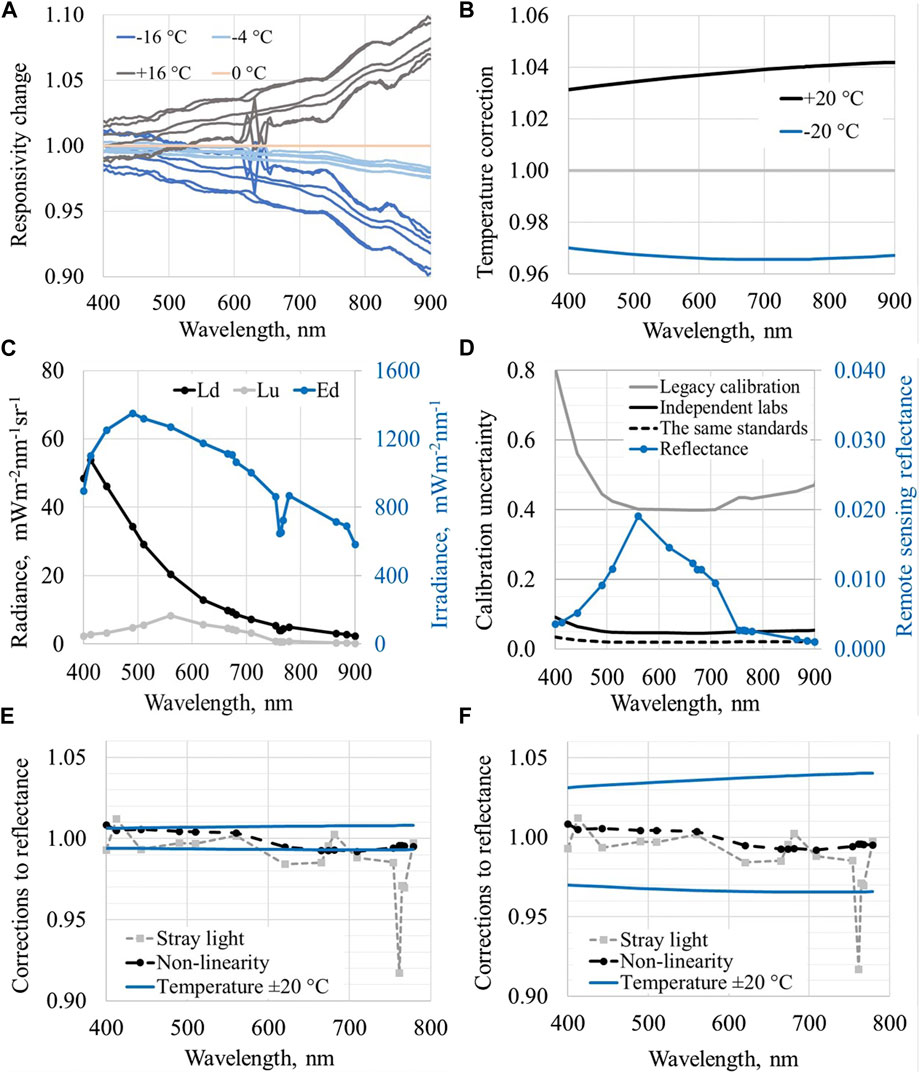
Figure 6. Size of corrections for a single OCR and for a three-radiometer system. (A) Temperature corrections as a function of the difference from the calibration temperature for six OCRs. (B) Bias of the three-radiometer HyperOCR system at ±20 °C from the calibration temperature. (C) Spectra measured with three radiometers for determination of the remote sensing reflectance. (D) Relative expanded uncertainty of the three-radiometer system due to contributions from the individual calibration uncertainties of the applied radiometers is shown with solid lines. Remote sensing reflectance convoluted to OLCI bands is given with a blue line. (E) Simulation of the joint relative effects with three RAMSES sensors due to spectral stray light, non-linearity, and temperature difference during calibration and later use. (F) The joint relative effects for similar system with three HyperOCR sensors.
For a two-radiometer scheme, cal/char contributions to the uncertainty can be rather similar to the single radiometer case. For example, with two radiance sensors, which can be used for determination of the water leaving radiance
The water-leaving reflectance spectra can be calculated from the synchronized time series measured with the three-radiometer system. Calculations include the following steps:
• all measured radiance and irradiance spectra are corrected for the spectral stray light, non-linearity, thermal effects, etc.;
• spectral response functions of a satellite sensor are used to convolute
• the remote sensing reflectance
where
If the same standard lamp has been used for radiometric calibration of all the sensors of a three-radiometer system measuring,
Similarly, if we assume an identical behavior for thermal sensitivity of all three sensors the temperature correction will cancel out. Thus, for the three-radiometer system (with all radiometers belonging to the same class) class-based temperature corrections would have no significant effect on the results. This does not imply that in the case of a three-radiometer system, the temperature corrections are always insignificant. If real individual temperature characteristics are used, the thermal correction for a deviation of about 10°C from the temperature during calibration may be several percent (Figure 6B). Here, the differences between the thermal coefficients of different sensors are critical, and due to different thermal loads of the radiometers, temperature differences from calibration points may be different.
For the three-radiometer system, the correction coefficients for non-linearity and spectral stray light, even based on the same (class-specific) characteristics will lead to different corrections for individual radiometers due to significant spectral differences of the target signals. Individual characteristics of radiometers are certainly preferable. For uncertainty contributions of the three-radiometer system, instead of individual characterization parameters, the differences between the radiometers will be more relevant.
An example showing the combined contributions of different uncertainty sources for a three-radiometer system of RAMSES and HyperOCR radiometers is presented in Figures 6E, F. Here, the relative contribution due to spectral stray light is shown with gray dotted lines, due to non-linearity with black dotted lines and the limits of relative biases due to temperature differences during calibration and later use are given as with blue lines. Large variation in the thermal effect (Figure 6F) is due to difference in thermal coefficients of the HyperOCR radiance and irradiance sensors (Figure 4C). Here, possible differences among internal temperatures of the three radiometers during the field deployment are not accounted for.
5 Conclusion
During the FRM4SOC Phase 2 project 37 hyperspectral field radiometers, including both irradiance and radiance sensors for TriOS RAMSES and Sea-Bird Scientific HyperOCR systems, were calibrated and characterized. There was good agreement between the characterizations made in this study and results from previous studies (Zibordi et al., 2017; Talone and Zibordi, 2018; Talone et al., 2020). The spread of individual results of many parameters has been expanded compared with previous studies however, and as a consequence, class specific characterization of these parameters may no longer be suitable. To provide individual characterizations of a large number of radiometers, several highly specialized calibration/chararcterization laboratories are needed. Using characterization results to correct field data is also time consuming and complex, as additional measurement information (e.g., OCR’s internal temperature) is needed in the measurement equation of remote sensing reflectance and whilst in-field measurement protocols need to be strictly followed (Ruddick et al., 2019a; Zibordi et al., 2019; Ruddick et al., 2019b; Ruddick, 2023).
For some properties of radiometers, dynamic tests are essential. The anomalous thermal dependence of the HyperOCR irradiance sensors was revealed only during the continuous change in temperature as opposed to thermal equilibrium. Another important feature detected during dynamic tests is the hysteresis of optical response and its dependence on a particular sensor used for temperature determination. Such an effect may significantly contribute to the uncertainty of the field results. In order to account for dynamic effects during field measurements, the best solution would be to have two temperature sensors installed in each radiometer: one sensor close to the location of the optical sensor and the other would be located on the surface of the radiometer. Differences between sensors will show the speed of temperature variation and give input for dynamic influences.
Although in comparison with RAMSES the cosine error and asymmetry of HyperOCR irradiance sensors is often smaller, the diffuser material used in HyperOCR irradiance sensors can cause significant errors, evident as strong hysteresis patterns in the responsivity as a function of ambient temperature (Figure 5), which cannot be compensated due to unknown temperature of the diffuser in variable environmental conditions. HyperOCR instruments have an internal temperature logger, whereas RAMSES do not, so recording internal temperature in RAMSES sensors in the varying field conditions is almost impossible.
Most of the OCR parameters that produce the greatest bias also contribute significantly to the combined uncertainty for individual radiometers, but using the three-radiometer system this effect is far less. The size of individual specific thermal effects over the range from 400 nm to 800 nm is up to ±10% if the bias from the calibration temperature is ±20°C. Relative joint thermal correction for the three-radiometer system is within ±4% if the discrepancies between the temperature coefficients of radiance and irradiance sensors is large, and almost zero if the thermal characteristics are similar. Joint non-linearity and spectral stray light corrections are also usually smaller than individual corrections and are within a few percent. Contrary to this, the angular response of the irradiance sensors cannot be reduced as it does not cancel out and therefore contributes to the uncertainty budget of a three-radiometer system (up to ±10%).
Characterization of radiometers is important if in situ OC expanded uncertainties below 10% level are aimed at. However, without very careful regular radiometric calibration of OCRs the advantages of the characterization cannot be achieved (Figure 6D) as the differences due to unsatisfactory calibration state can be much larger than possible biases, which is revealed in the characterization. Some parameters that contribute significantly to measurements with a single radiometer may be negligible in a two- or three-radiometer system. Consistent correction of biases and extended uncertainty analysis of in situ data obtained by different measurement models and instrument configurations need further attention.
Data availability statement
Publicly available datasets were analyzed in this study. This data can be found here: The cal/char data presented in this study can be found in online repositories Fiducial Radiometer Database (FidRadDB) and Ocean Colour In-Situ Database (OCDB) at https://ocdb.eumetsat.int.
Author contributions
VV: Conceptualization, Data curation, Methodology, Visualization, Writing–original draft, Writing–review and editing, Formal Analysis. IA: Conceptualization, Formal Analysis, Investigation, Methodology, Software, Visualization, Writing–review and editing. KD: Data curation, Formal Analysis, Methodology, Visualization, Writing–review and editing. RV: Conceptualization, Formal Analysis, Methodology, Project administration, Writing–review and editing. JK: Formal Analysis, Methodology, Writing–review and editing. KR: Formal Analysis, Methodology, Writing–review and editing. AB: Formal Analysis, Methodology, Writing–review and editing. GT: Formal Analysis, Methodology, Writing–review and editing. JG: Formal Analysis, Methodology, Writing–review and editing. EK: Formal Analysis, Methodology, Project administration, Writing–review and editing.
Funding
The author(s) declare financial support was received for the research, authorship, and/or publication of this article. The work presented in this article was performed in the framework of the project Fiducial Reference Measurements for Satellite Ocean Color (FRM4SOC) Phase-2 (EUMETSAT contract no. EUM/CO/21/460002539/JIG) funded by European Commission (Copernicus Programme) and implemented by EUMETSAT. The work has also made use of the laboratory facilities of Tartu Observatory, University of Tartu, supported by the Estonian Research Council project TT8 (grant number TT8) and the Estonian State Shared Service Center project KosEST [grant number SLTTO20562T (2014-2020.4.01.20-0284)].
Acknowledgments
The authors would like to thank Giuseppe Zibordi, Carol Johnson and Julian Gröbner for valuable comments during FRM4SOC Phase 2 project.
Conflict of interest
The authors declare that the research was conducted in the absence of any commercial or financial relationships that could be construed as a potential conflict of interest.
Publisher’s note
All claims expressed in this article are solely those of the authors and do not necessarily represent those of their affiliated organizations, or those of the publisher, the editors and the reviewers. Any product that may be evaluated in this article, or claim that may be made by its manufacturer, is not guaranteed or endorsed by the publisher.
Footnotes
1https://www.oceanopticsbook.info/packages/iws_l2h/conversion/files/rhoTable_AO1999.txt
References
Alikas, K., Ansko, I., Vabson, V., Ansper, A., Kangro, K., Uudeberg, K., et al. (2020). Consistency of radiometric satellite data over lakes and coastal waters with local field measurements. Remote Sens. 12, 616. doi:10.3390/rs12040616
Baczynska, K., O’Hagan, J. B., Pearson, A. J., and Eriksen, P. (2011). Temperature correction of UV spectral solar measurements for ICEPURE project. Photochem. Photobiol. 87, 1464–1467. doi:10.1111/j.1751-1097.2011.00981.x
Banks, A. C., Vendt, R., Alikas, K., Bialek, A., Kuusk, J., Lerebourg, C., et al. (2020). Fiducial reference measurements for Satellite Ocean Colour (FRM4SOC). Remote Sens. 12, 1322. doi:10.3390/rs12081322
Białek, A., Douglas, S., Kuusk, J., Ansko, I., Vabson, V., Vendt, R., et al. (2020a). Example of Monte Carlo method uncertainty evaluation for above-water Ocean Colour radiometry. Remote Sens. 12, 780. doi:10.3390/rs12050780
Białek, A., Goodman, T., Woolliams, E., Brachmann, J., Schwarzmaier, T., Kuusk, J., et al. (2020b). Results from verification of reference irradiance and radiance sources laboratory calibration experiment campaign. Remote Sens. 12, 2220. doi:10.3390/rs12142220
Burggraaff, O. (2020). Biases from incorrect reflectance convolution. Opt. Express 28, 13801–13816. doi:10.1364/OE.391470
EUMETSAT | FRM4SOC Phase-2 (2023). EUMETSAT | FRM4SOC phase-2 [WWW document]. Available at: https://frm4soc2.eumetsat.int/ (Accessed February 17, 2023).
Feinholz, M. E., Flora, S. J., Yarbrough, M. A., Lykke, K. R., Brown, S. W., Johnson, B. C., et al. (2009). Stray light correction of the marine optical system. J. Atmos. Ocean. Technol. 26, 57–73. doi:10.1175/2008JTECHO597.1
Goyens, C., and Ruddick, K. (2023). Improving the standard protocol for above-water reflectance measurements: 1. Estimating effective wind speed from angular variation of sunglint. Appl. Opt. 62, 2442–2455. doi:10.1364/AO.481787
Hooker, S. B., Firestone, E. R., McLean, S., Sherman, J., Small, M., Lazin, G., et al. (2002). The seventh SeaWiFS intercalibration round-robin experiment (SIRREX-7), TM-2003- 206892, 17. Greenbelt: NASA Goddard Space Flight Center.
Hooker, S. B., and Lazin, G. (2000). SeaWiFS postlaunch technical report series volume 8, the SeaBOARR-99 field campaign.
JCGM 100 (2008). Evaluation of measurement data — guide to the expression of uncertainty in measurement (GUM). First Edition. Available online: https://www.bipm.org/en/committees/jc/jcgm/publications.
Johnson, C., Yoon, H., Rice, J. P., and Parr, A. C. (2014). “Chapter 1.2 - principles of optical radiometry and measurement uncertainty,” in Experimental methods in the physical Sciences, optical radiometry for ocean climate measurements. Editors G. Zibordi, C. J. Donlon, and A. C. Parr (Academic Press), 13–67. doi:10.1016/B978-0-12-417011-7.00003-9
Kuusk, J. (2011). Dark signal temperature dependence correction method for miniature spectrometer modules. J. Sens. 608157, 1–9. doi:10.1155/2011/608157
Li, L., Dai, C., Wu, Z., and Wang, Y. (2017). Temperature and nonlinearity correction methods for commercial CCD array spectrometers used in field (Proc. SPIE 10463, AOPC 2017: Space Optics and Earth Imaging and Space Navigation), 104631K. doi:10.1117/12.2285634
Li, L., Dai, C., Wu, Z., and Wang, Y. (2018). Temperature correction method for commercial CCD array spectrometers used in spectral radiometry measurement. J. Phys. Conf. Ser. 972, 012020. doi:10.1088/1742-6596/972/1/012020
Lin, J., Dall’Olmo, G., Tilstone, G. H., Brewin, R. J. W., Vabson, V., Ansko, I., et al. (2022). Derivation of uncertainty budgets for continuous above-water radiometric measurements along an Atlantic Meridional Transect. Opt. Express 30, 45648–45675. doi:10.1364/OE.470994
Mobley, C. D. (1999). Estimation of the remote-sensing reflectance from above-surface measurements. Appl. Opt. 38, 7442–7455. doi:10.1364/AO.38.007442
Mueller, J. L., Morel, A., Frouin, R., Davis, C., Arnone, R., Carder, K., et al. (2003). Ocean optics protocols for satellite Ocean color sensor validation, Revision 4. Volume III: Radiometric Measurements and Data Analysis Protocols. doi:10.25607/OBP-62
Nevas, S., Wübbeler, G., Sperling, A., Elster, C., and Teuber, A. (2012). Simultaneous correction of bandpass and stray-light effects in array spectroradiometer data. Metrologia 49, S43–S47. doi:10.1088/0026-1394/49/2/S43
Pacheco-Labrador, J., Ferrero, A., and Martín, M. P. (2014). Characterizing integration time and gray-level-related nonlinearities in a NMOS sensor. Appl. Opt. 53, 7778–7786. doi:10.1364/AO.53.007778
Price, L. L. A., Hooke, R. J., and Khazova, M. (2014). Effects of ambient temperature on the performance of CCD array spectroradiometers and practical implications for field measurements. J. Radiol. Prot. 34, 655–673. doi:10.1088/0952-4746/34/3/655
Pulli, T., Nevas, S., Gawhary, O. E., Berg, S. van den, Askola, J., Kärhä, P., et al. (2017). Nonlinearity characterization of array spectroradiometers for the solar UV measurements. Appl. Opt. 56, 3077–3086. doi:10.1364/AO.56.003077
Ruddick, K. G., De Cauwer, V., Park, Y.-J., and Moore, G. (2006). Seaborne measurements of near infrared water-leaving reflectance: the similarity spectrum for turbid waters. Limnol. Oceanogr. 51, 1167–1179. doi:10.4319/lo.2006.51.2.1167
Ruddick, K. G., Voss, K., Banks, A. C., Boss, E., Castagna, A., Frouin, R., et al. (2019a). A review of protocols for fiducial reference measurements of downwelling irradiance for the validation of satellite remote sensing data over water. Remote Sens. 11, 1742. doi:10.3390/rs11151742
Ruddick, K. G., Voss, K., Boss, E., Castagna, A., Frouin, R., Gilerson, A., et al. (2019b). A review of protocols for fiducial reference measurements of water-leaving radiance for validation of satellite remote-sensing data over water. Remote Sens. 11, 2198. doi:10.3390/rs11192198
Salim, S. G. R., Fox, N. P., Theocharous, E., Sun, T., and Grattan, K. T. V. (2011). Temperature and nonlinearity corrections for a photodiode array spectrometer used in the field. Appl. Opt. 50, 866–875. doi:10.1364/AO.50.000866
Salim, S. G. R., Woolliams, E. R., and Fox, N. P. (2014). Calibration of a photodiode array spectrometer against the copper point. Int. J. Thermophys. 35, 504–515. doi:10.1007/s10765-014-1609-1
Schinke, C., Franke, M., Bothe, K., and Nevas, S. (2019). Implementation and uncertainty evaluation of spectral stray light correction by Zong’s method. Appl. Opt. 58, 9998–10009. doi:10.1364/AO.58.009998
Sea-Bird Scientific, (2024). Specifications for HyperOCR radiometer [WWW Document]. Available at: https://www.seabird.com/hyperspectral-radiometers/hyperocr-radiometer/family?productCategoryId=54627869935 (accessed (accessed January.31.2019).
Seckmeyer, G., Bais, A., Bernhard, G., Blumthaler, M., Drüke, S., Kiedron, P., et al. (2010). Instruments to measure solar ultraviolet radiation Part 4: array spectroradiometers. Geneva, Switzerland: WMO/TD No. 1538, 39pp.
Slaper, H., Reinen, H. a. J. M., Blumthaler, M., Huber, M., and Kuik, F. (1995). Comparing ground-level spectrally resolved solar UV measurements using various instruments: a technique resolving effects of wavelength shift and slit width. Geophys. Res. Lett. 22, 2721–2724. doi:10.1029/95GL02824
Talone, M., and Zibordi, G. (2016). Polarimetric characteristics of a class of hyperspectral radiometers. Appl. Opt. 55, 10092–10104. doi:10.1364/AO.55.010092
Talone, M., and Zibordi, G. (2018). Non-linear response of a class of hyper-spectral radiometers. Metrologia 55, 747–758. doi:10.1088/1681-7575/aadd7f
Talone, M., Zibordi, G., Ansko, I., Banks, A. C., and Kuusk, J. (2016). Stray light effects in above-water remote-sensing reflectance from hyperspectral radiometers. Appl. Opt. 55, 3966–3977. doi:10.1364/AO.55.003966
Talone, M., Zibordi, G., and Bialek, A. (2020). Reduction of non-linearity effects for a class of hyper-spectral radiometers. Metrologia 57, 025008. doi:10.1088/1681-7575/ab6277
Tilstone, G., Dall’Olmo, G., Hieronymi, M., Ruddick, K., Beck, M., Ligi, M., et al. (2020). Field intercomparison of radiometer measurements for Ocean Colour validation. Remote Sens. 12, 1587. doi:10.3390/rs12101587
TriOS (2019). RAMSES technische spezifikationen [WWW document]. TriOS Mess- Datentech. Available at: https://www.trios.de/ramses.html (Accessed January 31, 2019).
Vabson, V., Ansko, I., Vendt, R., and Kuusk, J. (2022). Technical Report D12: harmonised cal/char lab guidelines, including lab protocols for FRMOCnet OCR models.
Vabson, V., Kuusk, J., Ansko, I., Vendt, R., Alikas, K., Ruddick, K., et al. (2019a). Laboratory intercomparison of radiometers used for satellite validation in the 400–900 nm range. Remote Sens. 11, 1101. doi:10.3390/rs11091101
Vabson, V., Kuusk, J., Ansko, I., Vendt, R., Alikas, K., Ruddick, K., et al. (2019b). Field intercomparison of radiometers used for satellite validation in the 400–900 nm range. Remote Sens. 11, 1129. doi:10.3390/rs11091129
Vansteenwegen, D., Ruddick, K., Cattrijsse, A., Vanhellemont, Q., and Beck, M. (2019). The pan-and-tilt hyperspectral radiometer system (PANTHYR) for autonomous satellite validation measurements—prototype design and testing. Remote Sens. 11, 1360. doi:10.3390/rs11111360
Vendt, R., Vabson, V., Ansko, I., and Kuusk, J. (2021). Maapealse tugiväärtuse mõõtmine satelliitkaugseire andmete valideerimiseks. Kaugseire Eest. 2021. Artik. Tõravere Tartu. Obs. 2021, 10–20. lk.
Voss, K. J., and Costa, L.B. da (2016). Polarization properties of FEL lamps as applied to radiometric calibration. Appl. Opt. 55, 8829–8832. doi:10.1364/AO.55.008829
Xing, X., and Lagunas-Morales, J. (2018). “Laboratory results on the dependence of dark current upon environmental temperature variability for Satlantic’s OCR504 radiometers,” in Optical precision manufacturing, testing, and applications. Presented at the optical precision manufacturing, testing, and applications, SPIE. Editors J. McBride, J. Tan, S. Han, and X. Zhang (Beijing, China), 11. doi:10.1117/12.2504241
Ylianttila, L., and Schreder, J. (2005). Temperature effects of PTFE diffusers. Opt. Mater. 27, 1811–1814. doi:10.1016/j.optmat.2004.11.008
Ylianttila, L., Visuri, R., Huurto, L., and Jokela, K. (2005). Evaluation of a single-monochromator diode array spectroradiometer for sunbed UV-radiation measurements¶. Photochem. Photobiol. 81, 333–341. doi:10.1111/j.1751-1097.2005.tb00192.x
Zibordi, G. (2006). Immersion factor of in-water radiance sensors: assessment for a class of radiometers. J. Atmos. Ocean. Technol. 23, 302–313. doi:10.1175/JTECH1847.1
Zibordi, G., and Bulgarelli, B. (2007). Effects of cosine error in irradiance measurements from field ocean color radiometers. Appl. Opt. 46, 5529–5538. doi:10.1364/AO.46.005529
Zibordi, G., Hooker, S. B., Mueller, J., and Lazin, G. (2004). Characterization of the immersion factor for a series of in-water optical radiometers. J. Atmos. Ocean. Technol. 21, 501–514. doi:10.1175/1520-0426(2004)021<0501:COTIFF>2.0.CO;2
Zibordi, G., Talone, M., and Jankowski, L. (2017). Response to temperature of a class of in situ hyperspectral radiometers. J. Atmos. Ocean. Technol. 34, 1795–1805. doi:10.1175/JTECH-D-17-0048.1
Zibordi, G., Voss, K. J., Johnson, B. C., and Mueller, J. L. (2019). IOCCG ocean optics and biogeochemistry protocols for Satellite Ocean Colour sensor validation, 3.0. Dartmouth, NS, Canada: IOCCG. doi:10.25607/OBP-691
Zong, Y., Brown, S. W., Johnson, B. C., Lykke, K. R., and Ohno, Y. (2006). Simple spectral stray light correction method for array spectroradiometers. Appl. Opt. 45, 1111–1119. doi:10.1364/ao.45.001111
Keywords: fiducial reference measurements, SI-traceability, measurement uncertainty, radiometric calibration, characterization, hyperspectral radiometers
Citation: Vabson V, Ansko I, Duong K, Vendt R, Kuusk J, Ruddick K, Bialek A, Tilstone GH, Gossn JI and Kwiatkowska E (2024) Complete characterization of ocean color radiometers. Front. Remote Sens. 5:1320454. doi: 10.3389/frsen.2024.1320454
Received: 12 October 2023; Accepted: 21 March 2024;
Published: 10 April 2024.
Edited by:
Sawaid Abbas, University of the Punjab, PakistanReviewed by:
Dingtian Yang, Chinese Academy of Sciences (CAS), ChinaB. Carol Johnson, National Institute of Standards and Technology (NIST), United States
Copyright © 2024 Vabson, Ansko, Duong, Vendt, Kuusk, Ruddick, Bialek, Tilstone, Gossn and Kwiatkowska. This is an open-access article distributed under the terms of the Creative Commons Attribution License (CC BY). The use, distribution or reproduction in other forums is permitted, provided the original author(s) and the copyright owner(s) are credited and that the original publication in this journal is cited, in accordance with accepted academic practice. No use, distribution or reproduction is permitted which does not comply with these terms.
*Correspondence: Viktor Vabson, viktor.vabson@ut.ee