Unidentified fish sounds as indicators of coral reef health and comparison to other acoustic methods
 Sierra D. Jarriel1*
  Nathan Formel1
  Sophie R. Ferguson1,2†
  Frants H. Jensen1,3
  Amy Apprill4
  T. Aran Mooney1*
- 1Biology Department, Woods Hole Oceanographic Institution, Woods Hole, MA, United States
- 2Marine Biological Laboratory, Woods Hole, MA, United States
- 3Department of Ecoscience, Aarhus University, Aarhus, Denmark
- 4Marine Chemistry and Geochemistry Department, Woods Hole Oceanographic Institution, Woods Hole, MA, United States
The global decline of coral reefs is a major contributor to the global biodiversity crisis and requires improved monitoring at these critically important habitats. Non-invasive passive acoustic assessments may address this need, leveraging the rich variety and spatiotemporal variability of biological sounds present in coral reef environments and offering near-continuous temporal coverage. Despite this, acoustic metrics that reliably represent coral reef health are still debated, and ground-truthing of methods is limited. Here we investigated how the prevalence of low frequency biotic sounds (without species information) relates to coral reef health, providing a foundation from which one can compare assessment methods. We first quantified call rates of these low frequency sounds for three reefs exhibiting different community assemblages around St. John, U.S. Virgin Islands, by manually annotating presumed fish noises for 1 min every 30 min across 8 days for each site. Annotated days were selected at key points across lunar cycles. These call rates were then compared with traditional visual surveys, and several acoustic methods and indices commonly used in underwater soundscape research. We found that, overall, manually detected fish call rates successfully differentiated between the three reefs, capturing variation in crepuscular activity levels–a pattern consistent with previous work that highlights the importance of diel choruses. Moreover, fish vocal rates were predictors of hard coral cover, fish abundance, and fish species richness, while most acoustic indices failed to parse out fine distinctions among the three sites. Some, such as the Acoustic Complexity Index, failed to reveal any expected differences between sites or times of day, while the Bioacoustic Index could only identify the most acoustically active reef, otherwise having weak correlations to visual metrics. Of the indices tested, root-mean-squared sound pressure level and Acoustic Entropy, both calculated in the low frequency fish band (50–1,200 Hz), showed the strongest association with visual health measures. These findings present an important step toward using soundscape cues for reef health assessments. The limited generalizability of acoustic indices across different locations emphasizes the need for caution in their application. Therefore, it is crucial to improve methods utilizing fish sounds, such as automatic fish call detectors that are able to generalize well to new soundscapes.
1 Introduction
As one of Earth’s most biodiverse ecosystems, coral reefs are hotspots of biological activity (Reaka-Kudla, 1997). They provide valuable resources to humans, including vital fisheries (Newton et al., 2007), tourism (Spalding et al., 2017), and coastal protection (van Zanten et al., 2014), making them a source of livelihood for many lower-latitude nations (Birkeland, 1997; Cinner, 2014). However, in recent decades, reef-building corals and associated biodiversity have experienced a dramatic and unprecedented decline, reducing their contributions to these communities by half (Eddy et al., 2021). The need to study and monitor reef health using non-invasive and scalable tools has led to the development of diverse monitoring techniques (Apprill et al., 2023), such as eDNA (West et al., 2020), remote-sensing (Mumby et al., 2004; Liu et al., 2005), visual imaging and surveys (Mallet and Pelletier, 2014), and passive acoustics (Kaplan et al., 2015; Mooney et al., 2020; Lamont et al., 2022a).
Traditional methods of diver surveys are still the most widely accepted and standardized method for reef monitoring (i.e., AGRRA surveys), but come with limitations. Visual transect surveys can be time- and resource-consuming, provide only intermittent snapshots of reef state, and potentially introduce bias through observer limitations and fish deterrence (Brock, 1982; Sale and Sharp, 1983). However, the great diversity and concentration of soniferous species on reefs, as well as those that make ancillary sounds, contribute to an active, bustling soundscape that makes coral reefs excellent candidates for passive acoustic monitoring (PAM; Mooney et al., 2020; Kaplan et al., 2018). Changes to the community assemblages, such as that which exists between neighboring locations (Radford et al., 2014) or after severe habitat degradation (Gordon et al., 2018) can be detected in the soundscape. The potential for non-invasive continuous monitoring in these critical ecosystems, paired with the relative accessibility and low cost of PAM, makes further investigation into meaningful acoustic metrics for coral reef health imperative.
Sound is a dynamic component of coral reef communities. The two persistent sources of biological sounds on coral reefs are marine invertebrates, particularly snapping shrimp, which occupy the mid-to high-frequencies (∼2–20 kHz) (Au and Banks, 1998), and lower frequency fish sounds, typically below 2 kHz (Tricas and Boyle, 2014; Ferguson et al., 2022). Soundscape signatures can vary on daily (Staaterman et al., 2014; Kaplan et al., 2015), celestial, (Staaterman et al., 2014; Parsons et al., 2016; McWilliam et al., 2017), and seasonal scales (Kaplan et al., 2018), and are biologically important for coral reef animals. Sounds are produced for communicative purposes, such as for courtship and reproduction (Myrberg et al., 1986; Parmentier et al., 2010; Tricas and Boyle, 2014), aggression (Parmentier et al., 2010; Tricas and Boyle, 2014), and territory defense (Winn et al., 1964; Myrberg, 1997), as well as incidentally, by feeding (Sartori and Bright, 1973). These cues can then be perceived and utilized by reef animals. Indeed, evidence suggests juvenile and larval fish use sound to relocate and orient themselves to reefs (Montgomery et al., 2006; Simpson et al., 2008; Radford et al., 2011; Suca et al., 2020) and coral larvae use sound as a settlement cue for suitable habitat (Lillis et al., 2016; Lillis et al., 2018; Aoki et al., 2024). While increasingly applied to soundscape metrics, how these various soundscape components can be used to assess habitat and community attributes is still being understood.
Snapping shrimp band average sound pressure level (SPL) and snap counts have been shown to be indicative of structural complexity, but not necessarily fish community, live coral cover, or overall reef health (Kaplan et al., 2015; Nedelec et al., 2015; Lyon et al., 2019; Williams et al., 2022). Low frequency SPL is among the most common analyses for fish sounds, but its effectiveness in predicting reef health has yielded mixed results. In some studies, higher sound levels below 2 kHz, along with increased sound levels around dawn and dusk, were correlated with higher coral cover and fish abundance (Piercy et al., 2014; Kaplan et al., 2015; Peck et al., 2021). Yet in other studies, low frequency SPL alone had little relationship with reef composition (Lamont et al., 2022b; Williams et al., 2022) or had partial or mixed success (Bertucci et al., 2016; Dimoff et al., 2021). Additionally, while fish call rates have revealed similar trends to low frequency SPL at a single site, Ferguson et al. (2022) showed that the direct relationship between these two variables was not significant. Fewer studies have examined the daily fluctuations in SPL, despite documented increases in fish sound production around dawn and dusk (Winn et al., 1964; Parmentier et al., 2010).
Other processing techniques often derived from terrestrial applications have been proposed to address marine biodiversity questions (Sueur et al., 2008a), yet they too have borne challenges. A major appeal to exploring these indices is their potential application to uncalibrated sound recordings, which, if successful, opens the door to low-cost recording alternatives (Lamont et al., 2022a). Unfortunately, the success of these indices in determining coral reef health has been wildly variable between locations and applications. The Acoustic Complexity Index (ACI; Pieretti et al., 2011) is the most popular index in marine environments (Pieretti and Danovaro, 2020; Minello et al., 2021) and has shown promise in the lower frequency fish band in some studies. In certain cases, ACI demonstrated robustness to wind and boat noise (Harris et al., 2016) and outperformed alternative metrics in its ability to predict environment or reef state (Staaterman et al., 2014; Lamont et al., 2022b; Mahale et al., 2023). Yet in similar studies, it was not a significant predictor of reef quality (Kaplan et al., 2015; Lyon et al., 2019) or species diversity (Staaterman et al., 2017). Specific parameters play a role in the effectiveness of ACI and other indices but are not standardized and optimized specifications likely vary by location (Harris et al., 2016; Bolgan et al., 2018; Dimoff et al., 2021). Further, in many of these applications, we still lack ground-truthing of these metrics to specific call types, rates, and at times, even local observations of fish and reef communities, thus metric applications were often correlative.
This study evaluated whether the number of low frequency biotic sounds could function as a proxy for fish abundance and coral cover at different sites with varying communities, leveraging the known positive correlation between these two variables (Komyakova et al., 2013). We sought to test the hypothesis that between-site variations in total acoustic energy in the low frequency band are a result of differential fish activity and abundance (e.g., Kaplan et al., 2015). To do so, acoustic recordings from three long-term studied coral reefs of varying community assemblages in the U.S. Virgin Islands were manually audited for presumed fish sounds. The strength of crepuscular activity spikes and average call rates were examined and compared for each site. Hard coral coverage and fish abundance for each reef were collected from parallel and ongoing efforts and used to ground-truth acoustic outputs [Dinh et al., 2018; Formel et al. (in preparation)]. Further, this study compared fish call rates to a variety of acoustic metrics and indices typically used in the bioacoustic literature, including SPL, ACI, acoustic entropy (H), the bioacoustic index (BIO), acoustic diversity (ADI), and acoustic evenness (AEI), to evaluate their effectiveness in predicting reef community assemblages.
2 Methods and materials
2.1 Data collection
Three sites with long-term acoustic and visual monitoring were selected in the U.S. Virgin Islands National Park on St. John, USVI, based on their varying coral cover and fish abundance (Figure 1A). These fringing coastal reefs are part of a long-term project aiming to understand the relationship between soundscapes and the reef community (Kaplan et al., 2015; Mooney et al., 2017). Summaries of the reef community assessments are briefly described below but can be found in more detail in earlier work (Kaplan et al., 2015; Dinh et al., 2018; Formel et al. [in preparation]). Tektite Reef (18.30962 N, 64.72218 W) is considered an acoustically rich reef, correlating with high fish diversity and coral cover (Kaplan et al., 2015; Ferguson et al., 2022; Table 1). Yawzi Point (18.31458 N, 64.72609 W) was selected as an intermediate quality reef and is characterized by slightly lower fish abundances and diversity (Friedlander and Beets, 2008) and generally lower hard coral cover (Edmunds, 2013; Table 1). Finally, Cocoloba Reef (18.31528 N, 64.76065 W) was a degraded reef habitat increasingly dominated by macroalgae and bare space (Table 1), with historically low fish diversity (Friedlander and Beets, 2008).
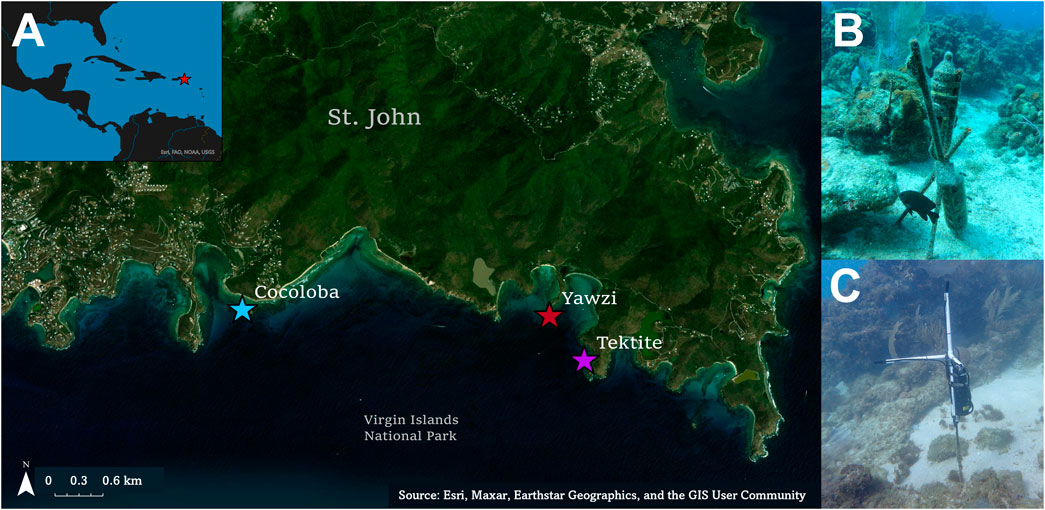
FIGURE 1. (A) Map of the three study reefs on the south side of St. John, US Virgin Islands, located within the Virgin Islands National Park. (B) ST-300 single channel recorder located on Tektite reef. The same set-up was used for Yawzi sound recordings as well. (C) ST-4300 four channel recorder on Cocoloba. Only the first channel was used for analysis.
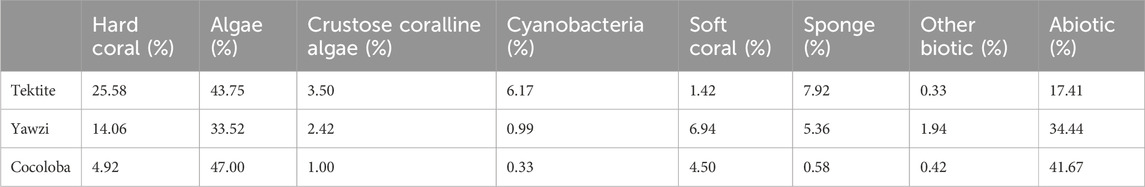
TABLE 1. Bottom composition of the three sites based on point intercept transect surveys averaged across 2016–2017 (Tektite n = 12, Yawzi n = 13, Cocoloba n = 12). Values are percentages of total recorded bottom cover. Methods adapted from Atlantic and Gulf Rapid Reef Assessment (AGRRA) surveys, following Formel et al. (in preparation, 2023).
Video transect surveys were conducted to assess fish abundance and diversity at each site in June 2016 and July 2017 (methods following Dinh et al., 2018). Each 30 m transect was recorded and analyzed in the lab to quantify the number of species and number of total fish in each video (Dinh et al., 2018). While the visual surveys did not precisely co-occur with our acoustic surveys, the goal was to determine how the sites generally differed in community composition, rather than document subtle fluctuations in fish populations during the study period. Further, while some fish movements are to be expected, many reef fish are known for their high site fidelity and dramatic relocations are unlikely within a year (Marnane, 2000; Pittman et al., 2014; Griffin et al., 2023). The resulting species numbers and counts for 9 transects per site were averaged, and site means were used to compare with acoustic metrics. Distribution of both species and total fish were normal, so an ANOVA, followed by a Tukey HSD post hoc test, was used for statistical comparison between sites. Parallel to fish, the benthic composition of each site was characterized using manual surveys following Atlantic and Gulf Rapid Reef Assessment (AGRRA) methods (following Formel et al. [in preparation]). Diver transects at Tektite (n = 12), Cocoloba (n = 12), and Yawzi (n = 13) were averaged across 2016 and 2017 to quantify the benthic coverage percentage of hard coral, macroalgae, crustose coralline algae, cyanobacteria, soft coral, sponge, other biotic, and abiotic for each site (Table 1). The hard coral coverage difference between sites was statistically assessed with an ANOVA, followed by a Tukey HSD post hoc test.
Sound data from Tektite and Yawzi were collected on single-channel SoundTraps (ST-300; Ocean Instruments, sensitivity = −172.6 and −171.2 dB re 1 μPa/V, respectively Figure 1B). Cocoloba data were collected with a 4-channel ST-4300 recorder (Ocean Instruments, sensitivity = −161.2 dB re 1 μPa/V Figure 1C); only one channel was used for fish call audits and batch analyses. Instruments were secured 0.5 m above the seafloor on rebar stakes anchored in sandy patches within the reef (Figure 1). SoundTraps were deployed from March 2017 to July 2017, recording on a duty cycle of 3 s of self-calibration followed by 60 s of recording every 10 min at 48 kHz.
2.2 Fish call auditing
Due to the labor-intensive nature of selecting fish calls by hand, 8 days of the 2017 spring and early summer deployment were chosen for analysis and 1 minute every 30 min was manually audited for fish vocalizations. To account for the possible effect of the moon phase on fish call rates (Parsons et al., 2016; McWilliam et al., 2017), days of interest were selected at various points in the lunar cycle: full moon (11 April, 10 May), third quarter (19 April, 18 May), new moon (26 April, 25 May), and first-quarter (2 May, 1 June).
The resulting 24 days (8 days for 3 sites) of subsampled sound data was manually analyzed by 3 independent, trained analysts (S.D.J., N.F., S.R.F.) using a customized interactive interface created in MATLAB R2020A (Mathworks, Natick, MA). First, sound files were low-pass filtered and decimated to 4 kHz to focus on the lower frequency range typical of fish calls. Nearly all reef fish sounds are below 2000 Hz, particularly between 50 and 1,200 Hz (Tricas and Boyle, 2014; Ferguson et al., 2022; Rice et al., 2022), which was the focus of this study. Spectrograms were then created (128 pt, 32 ms Hamming window, 75% overlap, 1,024 pt FFT size) and visualized in 10-s increments to distinguish characteristically short-duration fish calls (Tricas and Boyle, 2014). Analysts boxed fish calls by time and frequency and defined them as “pulse” or “tonal”, or “chorus” – in the case of overlapping, indistinguishable vocal events. The “chorus” label was used sparingly when individual calls were impossible to isolate and were thus factored into the final counts as only a single call, inevitably underrepresenting high activity periods to some extent. Final checks over all the annotations were done for consistency by S.D.J.
Any high-amplitude abiotic noise, such as weather or vessels, that had the potential to interfere with fish call detection was also boxed and labeled. Later, periods of disrupting noise were removed from the analysis, subtracting the entire period from both the call counts and the time available.
2.3 Analysis
Data preparation, statistical analysis, and graphing were done in MATLAB R2020b and R (www.r-project.org). Call rates were first calculated for each 1-min segment by dividing the total number of calls by the number of seconds available, after any vessel or disruptive noise was removed. If less than 10 s of useable data remained, the whole segment was removed from all analyses.
All site-specific total averages, such as for visual measures, fish call rates, or received SPL, are reported as mean ± 1.96*standard error (SE), which represent the upper and lower bounds of 95% confidence intervals of the mean. To visually compare trends between sites on a daily scale, hourly call rates were first calculated and then all 8 days were averaged together at each hour of the day. To examine the effect of time of day further, each day was divided into 4 time periods based on their respective local daily light periods, downloaded from timeanddate.com. Time-of-day groupings were delineated as follows: dusk: from sunset to astronomical twilight (defined as when the center of the Sun is eighteen degrees below the horizon, Forsythe et al., 1995), night: time between the two astronomical twilights, dawn:from astronomical twilight to sunrise, and day: from sunrise to sunset. The average call rate, in calls per minute, was calculated for each time period first for each moon phase and then combined, by averaging call rates from all files within each time-of-day period. A ratio of change was measured to evaluate the strength of crepuscular peaks by site, by dividing the average call rate in the crepuscular time periods by their adjacent daily period. Thus, values of 1 indicate no change between successive light periods, with higher ratios denoting larger shifts in acoustic activity.
Within-site comparisons of time-of-day on call rate required transformations to achieve normality, and then were evaluated with a one-way ANOVA. If significant differences were found, Tukey’s HSD post hoc test, with no multiple comparisons correction, was performed to identify where these differences lay. Tektite and Yawzi both used a square root transformation, but Cocoloba only met the assumptions after a simple logarithmic transformation (there were no zero data points at any site). Transformations remained consistent within their respective site between each moon phase tested. Between-site comparisons for both cumulative and for each daily light period were assessed with a Kruskal–Wallis test (KW) on untransformed data, followed by Dunn’s test of multiple comparisons, with no adjustment. Results from both the ANOVA and KW, along with associated post hoc tests, are summarized in Tables 2, 3 for ease of understanding.
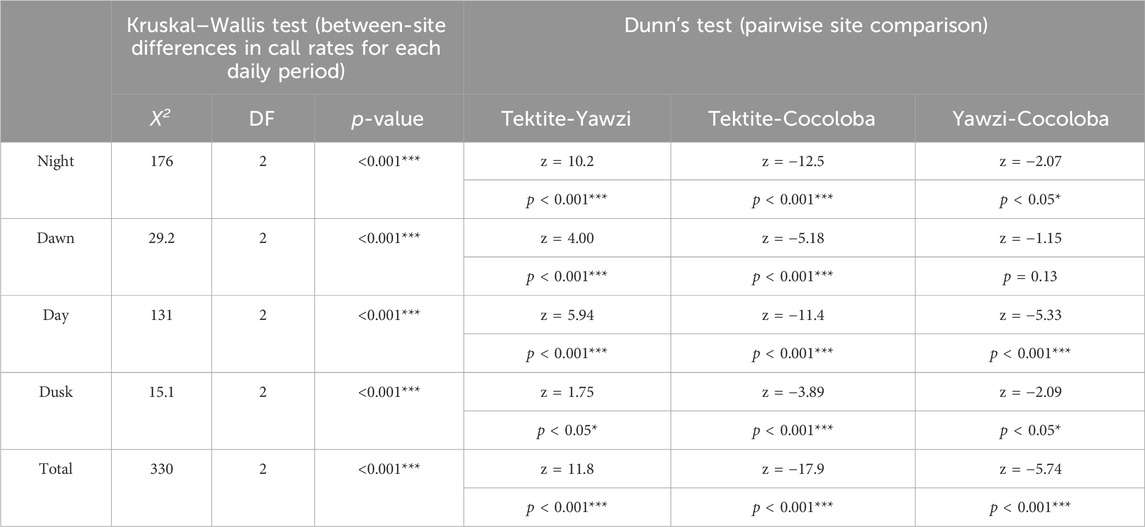
TABLE 2. Results of Kruskal–Wallis non-parametric analysis of variance on call rates (calls/min) between sites at different times of day. Each significant light period was followed up with Dunn’s test for multiple comparisons, with no adjustment. Z-statistics and p-values are listed for each combination of sites. Significant p-values are indicated with stars (*p < 0.05; **p < 0.01; ***p < 0.001).
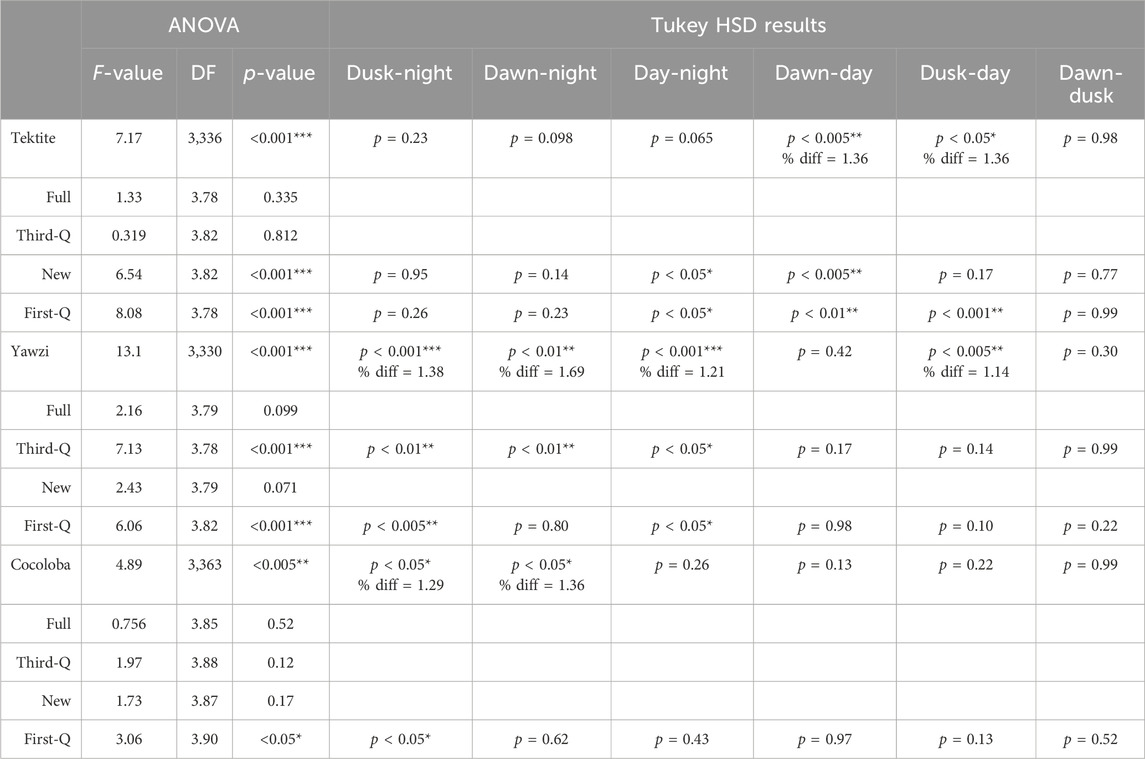
TABLE 3. Results from one-way ANOVA tests comparing within-site daily call rate changes, across different lunar cycles. If significance (p < 0.05) was found, post hoc Tukey HSD tests were performed. Otherwise, no difference was reported. Difference ratios (% diff) were calculated for overall sites when significance was reported from the Tukey HSD test by dividing the average call rate from the higher period (listed first) by the lower period.
Received SPL in the fish band was calculated from each audited sound file, with vessel noise durations removed, by bandpass filtering from 50 to 1,200 Hz. The 60 s signal was divided into blocks of 1 s with 50% overlap, root-mean-squared SPL was calculated and averaged across all blocks in that sound file, and finally converted to decibels (dB). Statistical average SPL was then calculated hourly and for each daily light period in order to examine crepuscular trends for each site. Statistical means and standard errors reported here do not operate on the linear units and thus do not represent the total noise energy, however, they more appropriately describe the underlying statistical distribution of noise levels. Comparison between the two methods revealed less than a dB of difference for overall site means. For analogous arithmetic calculations using linear units of SPL, see the Supplementary Material.
Several acoustic indices were also calculated from audited files to compare directly to fish call counts, using Seewave (Sueur et al., 2008a) and Soundecology (Villanueva-Rivera and Pijanowski, 2018) packages in R (methods following Williams et al., 2022). Given the clear characterization of fish call rates, we sought to test and evaluate the effectiveness of several acoustic indices that have been suggested to help quantify aquatic biodiversity. The indices tested were the Acoustic Complexity Index (ACI), which quantifies the variability of intensities in each frequency bin (window length = 512, overlap = 0, window = Hamming, frequency range = 50 Hz–1,200 Hz; Pieretti et al., 2011); Acoustic Entropy (H), the product of temporal and spectral dissimilarities (window length = 512, envelope transform = Hilbert; Sueur et al., 2008b); the Bioacoustic Index (BIO), a calculation of both the sound amplitude and number of frequency bands occupied (freq range = 50 Hz–1,200 Hz, dB threshold = −50, freq step = 100; Boelman et al., 2007); the Acoustic Diversity Index, in which the Shannon index is applied to frequency bins over a specified threshold (ADI, Max freq = 1,200, dB threshold = −50, freq step = 100, Villanueva-Rivera et al., 2011); and the Acoustic Evenness Index, a measure of the proportion of frequency bins over a specified threshold (AEI, Max freq = 1,200 Hz; freq step = 200; threshold = −50 dB, Villanueva-Rivera et al., 2011).
Distributions of SPL and acoustic indices were strongly non-normal, so a Kruskal–Wallis followed by Dunn’s test with a Bonferroni correction was applied to compare between sites. Linear regressions were utilized to evaluate the relationship between call rate and acoustic indices for each sound file, as well as relationships between SPL and other indices. Kendall’s tau (τ) coefficient was chosen as a non-parametric alternative to calculate the correlation between acoustic metrics and visual metrics. A complete correlation matrix between all acoustic and visual relationships can be found in the Supplementary Material. Overall site averages across 2016–2017 transects were used to represent fish abundance, fish species richness, and hard coral cover percentage for the correlation analysis.
3 Results
3.1 Reef biometrics
The three reefs varied by hard coral coverage (Table 1, One-way ANOVA: F2,34 = 35.12, p < 0.0001), fish abundance (Figure 2, One-way ANOVA: F2,24 = 19.0, p < 0.0001), and fish species richness (Figure 2, One-way ANOVA: F2,24 = 12.3, p < 0.0005). Tektite had the highest coral coverage (25.58% ± 2.78%, mean ± 1.96*SE), highest average number of total fish (175.5 ± 15.4), and most fish species (22.8 ± 1.0) per transect. As determined by a Tukey’s post hoc test, this was significantly higher than the degraded site, Cocoloba, which had the lowest coral cover (4.92% ± 3.10%, p < 0.0001), total fish (43.8 ± 4.5, p < 0.001), and species per transect (13.6 ± 0.4, p < 0.0001). Yawzi had the second highest coral cover (14.06% ± 2.40%), fish abundance (141.8 ± 14.9), and richness (20.1 ± 0.4 species), also significantly higher than Cocoloba (Tukey post hoc, coral: p < 0.005, total fish: p < 0.005, species: p < 0.001). Despite the differences, Yawzi was not significantly different from Tektite in fish abundance and species counts but did significantly differ in hard coral coverage (Tukey’s post hoc, p < 0.0005).
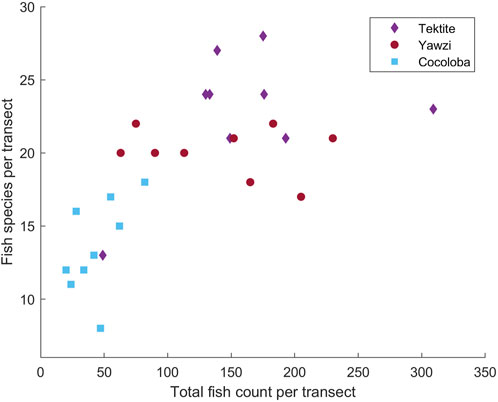
FIGURE 2. Results of manual video transect analysis of fish species and total counts at Tektite, Yawzi, and Cocoloba reefs from 2016 to 2017, showing site differences in community assemblage. Each analyzed 30 m transect is represented by a point.
3.2 Call rates
A total of 1,041 manually audited 1-min sound files were analyzed between the three sites after boat noise was removed (Tektite: 340, Yawzi: 334, Cocoloba: 367). A KW test revealed significant differences between total call rates at the three sites (X2(2) = 330, p < 0.001). Tektite had the highest average call rate, with 63.93 ± 0.16 calls per minute, significantly greater than the next highest, Yawzi, at 39.16 ± 1.67 calls per minute, during all photoperiods (Figure 3; Table 2) and Cocoloba, which had the lowest average call rate at 31.67 ± 0.08 calls per minute (Figure 3; Table 2). Yawzi recorded higher call rates than Cocoloba in all photoperiods, with this relationship showing significance during night, day, and dusk (Figure 3; Table 2).
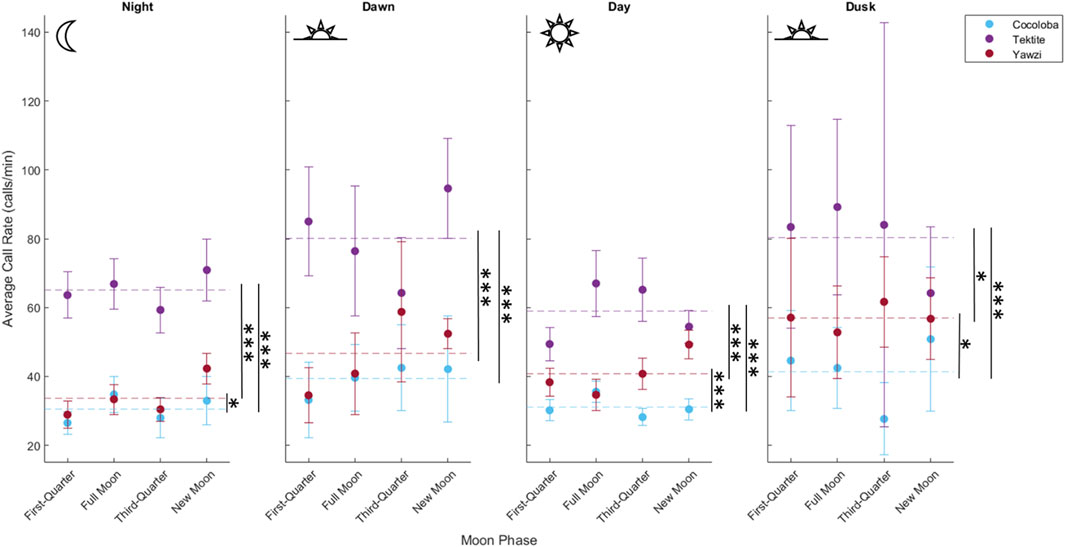
FIGURE 3. Comparison of call rate by reef during four daily photoperiods, demonstrating variation in crepuscular activity between sites. Points represent averaged call rate for each daily period by moon phase, with 95% confidence interval bars (±1.96*SE), colored by site. Mean call rate for each photoperiod and site is visualized by a horizontal dashed line. Significant difference in call rates between pairs of sites is shown with stars (*p < 0.05; **p < 0.01; ***p < 0.001, Dunn’s test for multiple comparisons, no adjustment).
Some degree of crepuscular activity spikes was observed at all sites (Figure 4), although the strength of this trend varied with site and moon phase. Fish call rates at Yawzi were most influenced by time of day, particularly in the third-quarter and first-quarter moon phases (One-way ANOVA: F3,330 = 13.1, p < 0.001, Figure 5A; Table 3). Cocoloba also had significant differences in activity between night and dawn (Tukey’s post hoc: p < 0.05), and night and dusk (p < 0.05, Figure 5B and Table 3). For Tektite, day appeared to be the outlying period, significantly lower than dawn, dusk, and night call rates (Figure 5C; Table 3). Interestingly, full moon was the only lunar phase in which time of day had no significant effect on activity at any site.
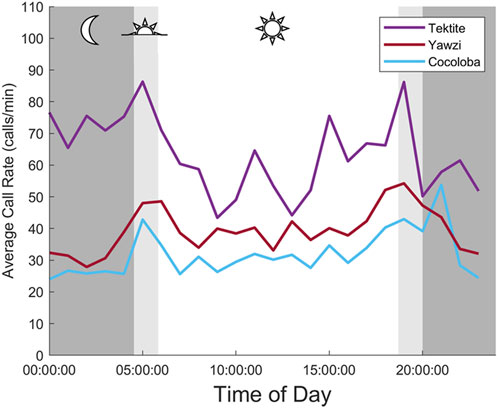
FIGURE 4. Averaged daily trends in fish call rate between three reefs. Each point is an hourly mean (2 min of audited data, 30 min apart), averaged across 8 days at the same time. Mean night for study days is strongly shaded, with light shading indicating mean dusk and dawn periods.
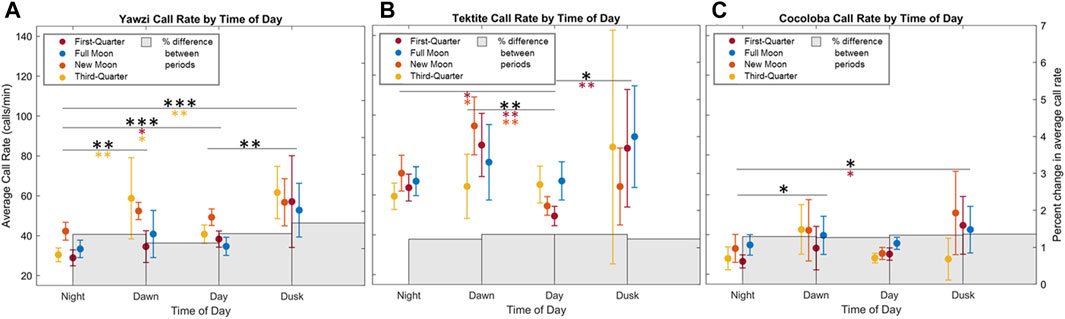
FIGURE 5. Effect of photoperiod and moon cycle on call rate for three reefs (A) Yawzi, (B) Cocoloba, (C) Tektite. Points and bars represent mean call rate (calls/min) and 95% confidence intervals (±1.96*SE) during the respective daily period, colored by lunar phase (2 days of data for each phase). Significance in call rate variation between daily light periods is shown with stars (*p < 0.05; **p < 0.01; ***p < 0.001, Tukey HSD with no correction), with colored stars showing post hoc results in respective moon phase, and black representing combined significance between photoperiods.
A single unknown call type was opportunistically identified and documented at all three reefs and plotted to compare daily call density trends between sites (Figure 6). The call was a downswept tonal hum, ranging between 2 Hz (average lower bound = 82 Hz) and 1,255 Hz (average upper bound = 729 Hz) and lasting 0.2–0.6 s (average length = 0.35 s, Figure 6B). Site-specific crepuscular peaks were observed, with dawn activity dominating at Tektite, and dusk activity dominating at Yawzi (Figure 6A). A total of 398 of these stereotyped calls were detected, representing approximately 0.9% of the total calls identified. Similar to overall calls, the most were found at Tektite (385 calls) and the least was detected at Cocoloba (97 calls).
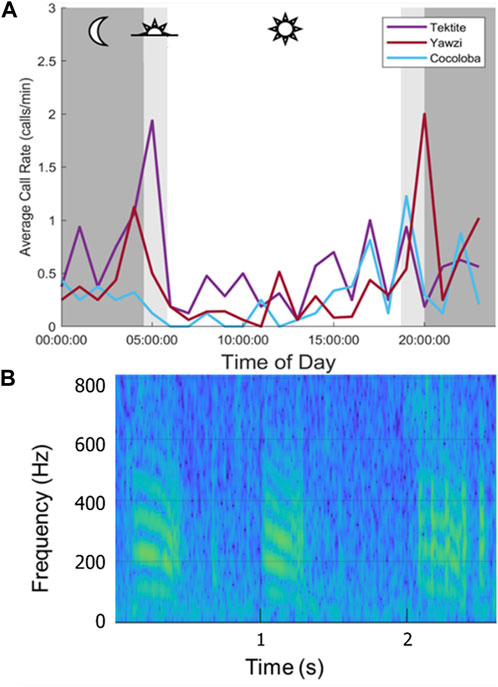
FIGURE 6. Call rates at three sites for a single, stereotyped call type. (A) Averaged hourly call rate of downswept tonal hum across 8 days, colored by site. Mean night period is strongly shaded, with mean dusk and dawn lightly shaded. Note the differences in daily patterns: a large dawn peak at Tektite, and smaller one a Yawzi, then a large dusk peak at Yawzi and smaller dusk peaks at Cocoloba. Cocoloba, the most degraded, showed the least daily variation. (B) Spectrogram of the tonal call (128 pt, 32 ms Hamming window, 75% overlap, 1,024 pt FFT).
3.3 Biodiversity indices comparison
The average received SPL of the audited sound files varied significantly between all sites (KW test: X2(2) = 649, p < 0.0001, Figure 7A), with Tektite as the site with the highest sound levels at 96.33 ± 0.27 dB re 1 µPa (mean ±1.96*SE). Despite showing statistical significance, Yawzi and Cocoloba sound levels varied by less than a decibel, with Yawzi at 89.73 ± 0.22 dB re 1 µPa and Cocoloba slightly lower, at 89.09 ± 0.15 dB re 1 µPa (Dunn’s test, p < 0.005). Tektite also had the strongest crepuscular peaks in SPL (dawn-night: 5.1 dB change, dawn-day: 1.7 dB change, dusk-day: 0.8 dB change, dusk-night: 4.2 dB change), although Yawzi also saw increases during dusk and dawn versus night (dusk-night: 2.8 dB change, dawn-night: 2.0 dB change), although day time had the highest sound levels at this site. Cocoloba had the weakest crepuscular peaks with an average 1.2 dB increase from night to dawn and a 1.8 dB difference between dusk and night (Figure 7B).
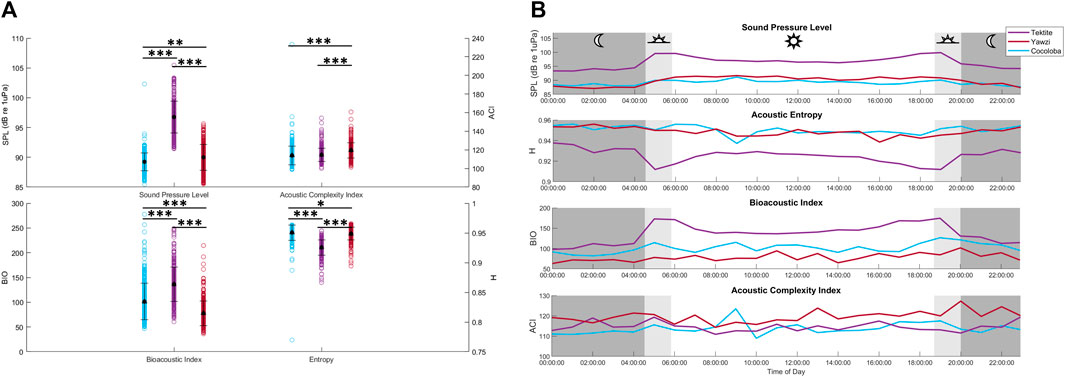
FIGURE 7. Averaged daily trends and distributions of acoustic indicators between reefs. (A) Recieved sound pressure level (SPL, dB re 1 µPa), acoustic complexity (ACI), bioacoustic index (BIO), and entropy (H) in the low frequency band for each audited file by site. Mean and standard deviation for each site are overlayed in black. Statistical differences in distribution between sites are represented by stars (*p < 0.05; **p < 0.01; ***p < 0.001, Dunn’s test of multiple comparisons, Bonferroni adjustment). (B) Daily hourly mean values of 4 acoustic indicators averaged across 8 days, colored by site.
In addition to SPL, several acoustic indices were tested on the same files and frequency range and compared to fish call rates. The AEI and ADI had no significant linear relationship with call rate (AEI: Multiple R2 = 1.543e-3, p > 0.05; ADI: Multiple R2 = 5.297e-4, p > 0.05) and no visible trends or differences between sites, and are thus not included in the rest of the analysis. The ACI explained less than 2% of the variation in call rates and, although weak, the linear regression was significant due to the large sample size of files (Figure 8A, Multiple R2 = 0.016, p < 0.0001). The BIO was able to identify Tektite as the “healthiest” site, and even identified some crepuscular trends within Tektite (Figure 7B), but was otherwise weakly related to call rate (Multiple R2 = 0.175) and visual metrics (τ = 0.26). H, the product of spectral and temporal entropy, reported a negative correlation with fish calls (Figure 8A, Multiple R2 = 0.262, p < 0.0001), portraying very similar, though inverted, patterns as SPL on these datasets (Figure 7B). In addition to a strong direct relationship between SPL and H (Figure 8B, Multiple R2 = −0.758), the pair had similarly strong statistical relationships with call rate (Figure 8A) and visual metrics (Figure 9).
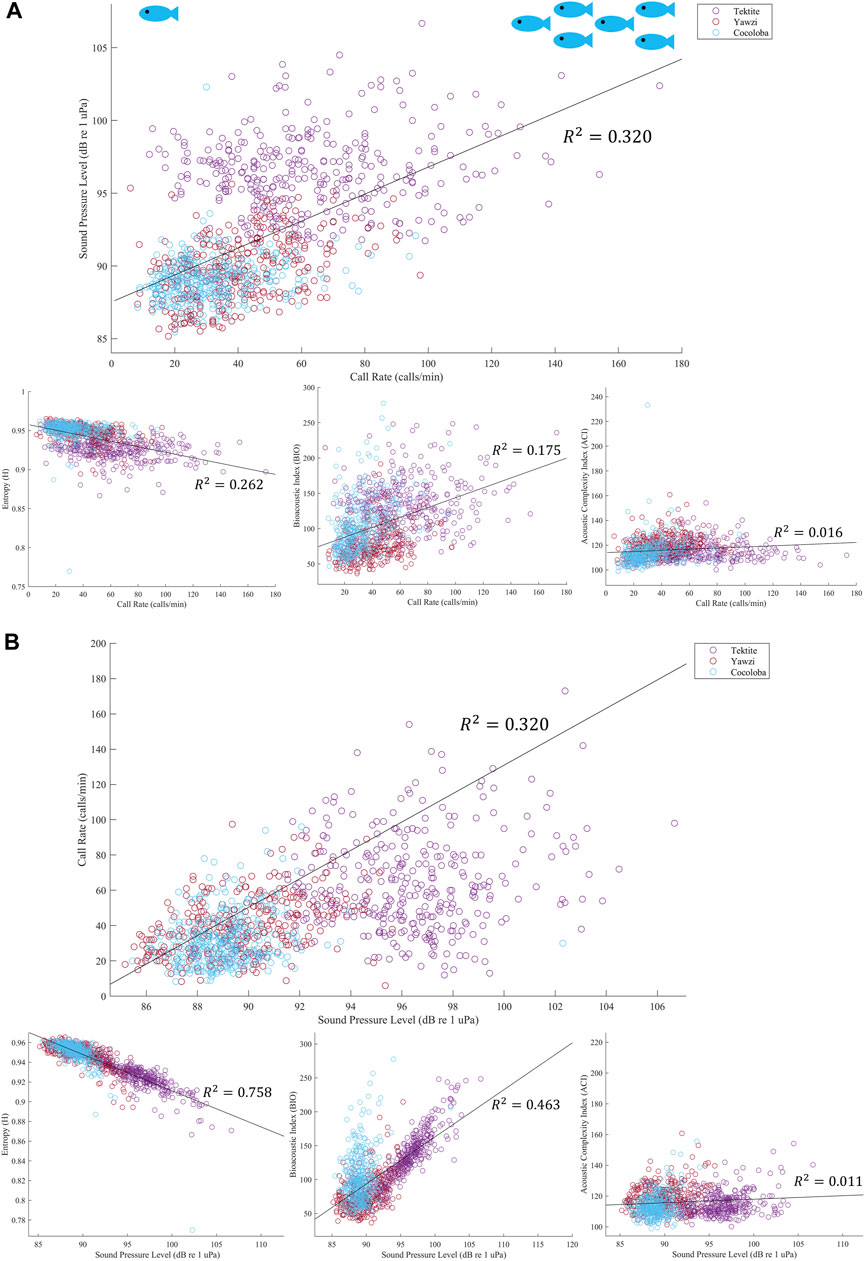
FIGURE 8. (A) Linear regression of call rate and acoustic indicator, colored by site. Output from each audited file is plotted, and then best fit line is overlayed in black with corresponding multiple R2 value. All regressions showed significance, with the strongest relationship with fish call rate being sound pressure level, top plot, and the weakest being the acoustic complexity index, bottom right plot. (B) Linear regression of SPL with other acoustic indicators. Top plot again shows regression between call rate and SPL, with the axes flipped. However, in this figure we can see that SPL actually has stronger relationships with both the Bioacoustic Index, bottom middle plot, and Entropy, bottom left. Similar to call rate, ACI has a negligible relationship to SPL.
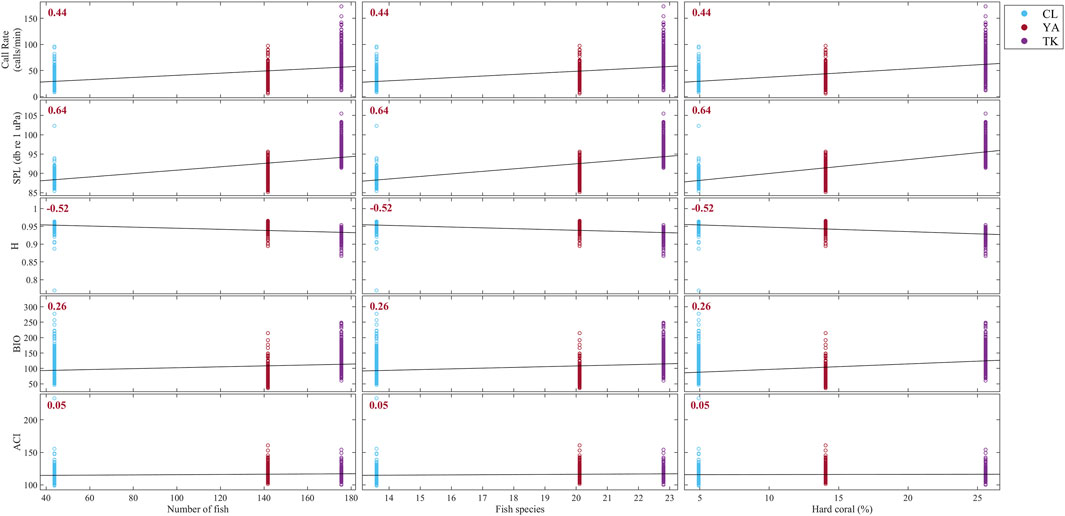
FIGURE 9. Correlation matrix between acoustic indicators derived from this study and average number of fish, fish species, and hard coral percent cover from visual surveys over 2016 and 2017 using Kendall rank correlation. Sites are delineated with colors: Cocoloba (CL) in light blue, Yawzi (YA) in red, and Tektite (TK) in purple. Kendall’s tau (τ) coefficient is printed for each relationship; all correlations were statistically significant and shown in red. Strong positive correlations are apparent between visual metrics and call rate and SPL, as well as a strong negative correlation with H. BIO and ACI were both weakly related to fish abundance, fish species, and hard coral cover.
Overall, visual metrics had the strongest positive correlation with SPL (τ = 0.64, p < 0.0001) and call rate (τ = 0.44, p < 0.0001), and a fairly strong negative correlation with H (Figure 9, τ = −0.52, p < 0.0001). BIO and ACI had the weakest relationships with fish abundance, fish species, and hard coral cover at these sites (BIO: τ = 0.26, ACI: τ = 0.05).
4 Discussion
With the rapid global decline of biodiversity on coral reefs, it is imperative that cost-effective methods of managing these habitats continue to be developed. Passive acoustic monitoring (PAM) has been increasingly applied to coral reef research, although how best to assess acoustic signals of biodiversity and reef state is still debated. The three sites examined in this study demonstrated clear, incremental variation in bottom substrate (e.g., coral cover), fish abundance, and fish species richness, making them ideal for exploring acoustic metrics indicative of reef community composition and quality. Manually annotated fish sounds were found to be a measure predictive of visual reef health indicators, successfully differentiating between three reefs based on fish abundance and coral cover and exposing varying levels of crepuscular spikes in activity at all the sites. Thus, this work provides a key ground-truthing foundation to support using fish calls as a means to assess coral reef health. Further, this is the first study to demonstrate that the observed differences in crepuscular activity strength in the low frequency acoustic band between reefs are the direct result of individual fish calls.
Tektite, the healthiest of the three reefs, with high coral cover and fish abundance, had the highest average call rate during every photoperiod and also demonstrated significant crepuscular spikes in activity, with especially low call rates during the day. Received SPL, BIO, and H were also able to distinguish Tektite as the most biologically active reef and even highlight daily trends within it, but had less success differentiating between the two less active reefs. Yawzi, the intermediate reef, had the second-highest call rates on average but the strongest variation between light periods, particularly due to low call rates at night. The degraded, algae-dominated site, Cocoloba, had the lowest call rates of the three, with weak crepuscular peaks. Similar trends can be seen with a single call type, a downswept tonal hum recorded at all three sites. The rate of this call had little daily variation at Cocoloba compared to the other healthier sites, which saw strong spikes in occurrence at either dawn (Tektite) or dusk (Yawzi). This time-of-day difference between Yawzi and Tektite is itself interesting, given that these reefs are only ca. 500 m apart and one might assume calls would follow the same general pattern. Similar differences between nearby sites have also been noted for snapping shrimp (Lillis and Mooney, 2018). While this was one of the more common and stereotyped call types, it averaged less than 1 call/min at each site, a tiny fraction of the 30–64 average calls/min recorded at the same sites. Statistically, this call type represented less than 1% of the total calls detected. Characterizing the number of unique call types at each site was beyond the scope of this study, but this single “common” call type certainly speaks to the diversity of low frequency sounds at these reefs.
Three out of the six computational methods evaluated showed some similar patterns to fish call rates (SPL, BIO, and H; Figure 7). Averaged received SPL (dB re 1 µPa) in the low frequency band, a commonly used metric for soundscapes, aligned with fish calls quite well, with Tektite having the highest levels and strongest crepuscular peaks. Dawn and dusk peaks in SPL were less apparent in the two quieter reefs, Cocoloba and Yawzi. Yawzi sound levels were significantly higher than those on Cocoloba, reflecting the reef health noted by traditional visual observations of fish and coral cover. However, the SPL differences between the two reefs were less than a decibel of difference on average and likely due to the increased daytime levels at Yawzi. This discrepancy in Yawzi’s heightened SPL versus fish call rate during the day may have been caused by increased abiotic ambient noise during the day, a known pitfall of SPL.
Similarly, H identified Tektite apart from the other reefs, but differentiation between Yawzi and Cocoloba was less obvious (Figure 7). At these sites, H had a negative relationship with all other variables and its daily trends were inverted from call rate, BIO, or SPL. Entropy is calculated from 0 to 1, with 0 being a single pure tone and 1 reflecting completely random noise (Seuer et al., 2008a). In terrestrial environments, for which this index was designed, it has been shown to positively correlate with the number of species (Seuer et al., 2008b). However, in acoustically active marine environments, dense fish choruses can drive the index down (Staaterman et al., 2017), which is likely what occurred here. Other aquatic studies have also observed this inverted relationship between entropy and fish activity (Bohnenstiehl et al., 2018) or phonic richness, a measure of the number of types of fish calls, although this relationship tends to be relatively weak (Williams et al., 2022).
BIO, which measures cumulative intensity across frequency bands (Boelman et al., 2007), yielded slightly weaker correlations with visual metrics and call rate at these sites. Among the few aquatic studies using BIO, one investigation revealed a significant relationship with reef state and the higher frequency shrimp patterns (Williams et al., 2022). Another found strong, positive correlations with planktivores and non-encrusting coral (Elise et al., 2019), although this was only demonstrated in one 2-h recording. Given these limited but equivocal results, BIO’s utility (or lack thereof) could perhaps be explored further.
This study found that the ACI had almost no relationship with call rate or other acoustic indices and demonstrated no meaningful site or time-of-day differentiation. It was included in the analysis because of its recent proliferation in underwater soundscape literature and weak but significant correlation to call rate. However, ACI effectively gave no information about these particular reefs. This further contributes to the uncertainty around the application of ACI and acoustic indices in general to coral reef soundscapes, as they can be very case-specific and sensitive to spectral resolution and specified parameters (Bohnenstiehl et al., 2018; Dimoff et al., 2021). The contradictory literature around acoustic indices begs caution when applying them to new soundscapes without validation (Mooney et al., 2020). Further, the variable success of indices can lead to a pick-and-choose mentality to support the expected outcomes.
Manual annotation of fish calls does not come without challenges. Manual detection is time- and effort-intensive, making it unsuitable for long time-series, near-real-time monitoring, or large-scale projects. Like reefs themselves, fish sounds are highly diverse, variable, and abundant, with fish calls being largely unknown, making it challenging even for experienced acousticians. Dense, near-constant chorusing at healthy reefs almost certainly leads to missed calls during peak times, although our results suggest that counts are still representative, even with this limitation. These challenges to generalized fish call detection have also contributed to the lag in producing accurate machine-learning models to automate the process. As a terrestrial parallel, bird vocalization recognition in acoustically dense environments has advanced significantly in recent years with the rise of deep learning models, which now surpass other methods (Xie et al., 2023). More focused work on bringing generalized reef fish detectors up to this standard would allow fish calls to be a practical method of coral reef monitoring and could potentially avoid many of the pitfalls of acoustic proxies. This method would theoretically be applicable to low-cost, uncalibrated acoustic recorders, unlike SPL or sound exposure level (SEL), which would break down a remaining barrier of underwater PAM and allow the field to expand rapidly.
Addressing the question of biodiversity is a priority for aquatic researchers, especially at a time when it is quickly disappearing (Eddy et al., 2021). Phonic richness by manually classified call types has shown promise as a metric of reef fish diversity in other studies, but this method is also limited by time and effort allocation (Lamont et al., 2022b). Unsupervised clustering of fish detections, even of unknown origin, would be a critical follow-up step to tackle the question of biodiversity, but current models are limited to 3-4 larger clusters of reef sounds, rather than parsing out the extreme diversity and variability of coral reef fish calls (Lin et al., 2017; Ozanich et al., 2021; Mahale et al., 2023). As machine learning continues to advance, opportunities to fine-tune these methods to use total fish call variation to predict biodiversity, and particularly biodiversity changes, should be explored.
In conclusion, this study demonstrated the utility of individual fish calls, even of unknown identification, in characterizing reef quality–namely, fish abundance and fish diversity, which are both known to strongly correlate with hard coral cover (Komyakova et al., 2013). Fish call rate analysis across 8 days differentially partitioned our three sites more accurately than any of the commonly used acoustic metrics tested, revealing spikes in crepuscular fish activity in our intermediate site that the indices missed. Our results suggest that fish calls and acoustic activity are indicators of healthy reef communities and can be applied to monitor coral reef health. Our results further add to the inconsistency and uncertainty surrounding acoustic indices in the low frequency for reef composition predictions. Manually auditing fish calls is not a proposed method for coral reef health monitoring in its current state, but rather this study was a baseline to validate it as a useful metric and encourage the development of thorough, generalized reef fish call detectors to analyze passive acoustic datasets in a meaningful time frame.
Data availability statement
The raw data supporting the conclusion of this article will be made available by the authors, without undue reservation.
Author contributions
SJ: Conceptualization, Data curation, Formal Analysis, Investigation, Methodology, Visualization, Writing–original draft. NF: Data curation, Formal Analysis, Writing–review and editing. SF: Data curation, Formal Analysis, Methodology, Writing–review and editing. FJ: Methodology, Software, Writing–review and editing. AA: Project administration, Writing–review and editing. TAM: Conceptualization, Funding acquisition, Project administration, Resources, Supervision, Writing–review and editing.
Funding
The author(s) declare financial support was received for the research, authorship, and/or publication of this article. This research was funded by National Science Foundation OCE, OTIC, and NRI awards (1806478, 2024077, 2155093, 2133029).
Acknowledgments
The experiments were conducted under National Park Service Scientific Research and Collecting Permits VIIS-2016-SCI-0017–20 and we thank the Park staff for their support. We also thank Matthew Long and Cynthia Becker and other contributors for their assistance in the field, and the staff volunteers at Marine Research Program, University of the Virgin Islands, and the Virgin Islands Environmental Resource Station (VIERS) for their logistical assistance and support.
Conflict of interest
The authors declare that the research was conducted in the absence of any commercial or financial relationships that could be construed as a potential conflict of interest.
Publisher’s note
All claims expressed in this article are solely those of the authors and do not necessarily represent those of their affiliated organizations, or those of the publisher, the editors and the reviewers. Any product that may be evaluated in this article, or claim that may be made by its manufacturer, is not guaranteed or endorsed by the publisher.
Supplementary material
The Supplementary Material for this article can be found online at: https://www.frontiersin.org/articles/10.3389/frsen.2024.1338586/full#supplementary-material
References
Aoki, N., Weiss, B., Jézéquel, Y., Zhang, W. G., Apprill, A., and Mooney, T. A. (2024). Soundscape enrichment increases larval settlement rates for the brooding coral Porites astreoides. London, England: Royal Society Open Science.
Apprill, A., Girdhar, Y., Mooney, T. A., Hansel, C. M., Long, M. H., Liu, Y., et al. (2023). Toward a new era of coral reef monitoring. Environ. Sci. Technol. 57, 5117–5124. doi:10.1021/acs.est.2c05369
Au, W. W. L., and Banks, K. (1998). The acoustics of the snapping shrimp Synalpheus parneomeris in Kaneohe Bay. J. Acoust. Soc. Am. 103 (1), 41–47. doi:10.1121/1.423234
Bertucci, F., Parmentier, E., Lecellier, G., Hawkins, A. D., and Lecchini, D. (2016). Acoustic indices provide information on the status of coral reefs: an example from Moorea Island in the South Pacific. Sci. Rep. 6 (1), 33326. doi:10.1038/srep33326
Boelman, N. T., Asner, G. P., Hart, P. J., and Martin, R. E. (2007). Multi-trophic invasion resistance in Hawaii: bioacoustics, field surveys, and airborne remote sensing. Ecol. Appl. 17 (8), 2137–2144. doi:10.1890/07-0004.1
Bohnenstiehl, D. R., Lyon, R. P., Caretti, O. N., Ricci, S. W., and Eggleston, D. B. (2018). Investigating the utility of ecoacoustic metrics in marine soundscapes. J. Ecoacoustics 2 (2), 1. doi:10.22261/JEA.R1156L
Bolgan, M., Amorim, M. C. P., Fonseca, P. J., Di Iorio, L., and Parmentier, E. (2018). Acoustic Complexity of vocal fish communities: a field and controlled validation. Sci. Rep. 8 (1), 10559. doi:10.1038/s41598-018-28771-6
Brock, R. E. (1982). A critique of the visual census method for assessing coral reef fish populations. Bull. Mar. Sci. 32 (1), 269–276.
Cinner, J. (2014). Coral reef livelihoods. Curr. Opin. Environ. Sustain. 7, 65–71. doi:10.1016/j.cosust.2013.11.025
Dimoff, S. A., Halliday, W. D., Pine, M. K., Tietjen, K. L., Juanes, F., and Baum, J. K. (2021). The utility of different acoustic indicators to describe biological sounds of a coral reef soundscape. Ecol. Indic. 124, 107435. doi:10.1016/j.ecolind.2021.107435
Dinh, J. P., Suca, J. J., Lillis, A., Apprill, A., Llopiz, J. K., and Mooney, T. A. (2018). Multiscale spatio-temporal patterns of boat noise on U.S. Virgin Island coral reefs. Mar. Pollut. Bull. 136, 282–290. doi:10.1016/j.marpolbul.2018.09.009
Eddy, T. D., Lam, V. W. Y., Reygondeau, G., Cisneros-Montemayor, A. M., Greer, K., Palomares, M. L. D., et al. (2021). Global decline in capacity of coral reefs to provide ecosystem services. One Earth 4 (9), 1278–1285. doi:10.1016/j.oneear.2021.08.016
Edmunds, P. J. (2013). Decadal-scale changes in the community structure of coral reefs of St. John, US Virgin Islands. Mar. Ecol. Prog. Ser. 489, 107–123. doi:10.3354/meps10424
Elise, S., Bailly, A., Urbina-Barreto, I., Mou-Tham, G., Chiroleu, F., Vigliola, L., et al. (2019). An optimised passive acoustic sampling scheme to discriminate among coral reefs’ ecological states. Ecol. Indic. 107, 105627. doi:10.1016/j.ecolind.2019.105627
Ferguson, S. R., Jensen, F. H., Hyer, M. D., Noble, A., Apprill, A., and Mooney, T. A. (2022). Ground-truthing daily and lunar patterns of coral reef fish call rates on a US Virgin Island reef. Aquat. Biol. 31, 77–87. doi:10.3354/ab00755
Forsythe, W. C., Rykiel, E. J., Stahl, R. S., Wu, H., and Schoolfield, R. M. (1995). A model comparison for daylength as a function of latitude and day of year. Ecol. Model. 80 (1), 87–95. doi:10.1016/0304-3800(94)00034-F
Friedlander, A. M., and Beets, J. P. (2008). Temporal trends in reef fish assemblages inside Virgin Islands National Park and around St. John, U.S. Virgin Islands, 1988-2006. Availableat: https://repository.library.noaa.gov/view/noaa/16907 (Accessed March 14, 2023).
Gordon, T. A. C., Harding, H. R., Wong, K. E., Merchant, N. D., Meekan, M. G., McCormick, M. I., et al. (2018). Habitat degradation negatively affects auditory settlement behavior of coral reef fishes. Proc. Natl. Acad. Sci. 115 (20), 5193–5198. doi:10.1073/pnas.1719291115
Griffin, L. P., Brownscombe, J. W., Gagne, T. O., Haak, C. R., Cormier, R., Becker, S. L., et al. (2023). There’s no place like home: high site fidelity and small home range of bonefish (Albula vulpes) inhabiting fringing reef flats in Culebra, Puerto Rico. Environ. Biol. Fishes 106 (2), 433–447. doi:10.1007/s10641-022-01312-x
Harris, S. A., Shears, N. T., and Radford, C. A. (2016). Ecoacoustic indices as proxies for biodiversity on temperate reefs. Methods Ecol. Evol. 7 (6), 713–724. doi:10.1111/2041-210X.12527
Kaplan, M. B., Lammers, M. O., Zang, E., and Aran Mooney, T. (2018). Acoustic and biological trends on coral reefs off Maui, Hawaii. Coral Reefs 37 (1), 121–133. doi:10.1007/s00338-017-1638-x
Kaplan, M. B., Mooney, T. A., Partan, J., and Solow, A. R. (2015). Coral reef species assemblages are associated with ambient soundscapes. Mar. Ecol. Prog. Ser. 533, 93–107. doi:10.3354/meps11382
Komyakova, V., Munday, P. L., and Jones, G. P. (2013). Relative importance of coral cover, habitat complexity and diversity in determining the structure of reef fish communities. PloS one 8 (12), e83178. doi:10.1371/journal.pone.0083178
Lamont, T. A. C., Chapuis, L., Williams, B., Dines, S., Gridley, T., Frainer, G., et al. (2022a). HydroMoth: testing a prototype low-cost acoustic recorder for aquatic environments. Remote Sens. Ecol. Conservation 8 (3), 362–378. doi:10.1002/rse2.249
Lamont, T. A. C., Williams, B., Chapuis, L., Prasetya, M. E., Seraphim, M. J., Harding, H. R., et al. (2022b). The sound of recovery: coral reef restoration success is detectable in the soundscape. J. Appl. Ecol. 59 (3), 742–756. doi:10.1111/1365-2664.14089
Lillis, A., Apprill, A., Suca, J. J., Becker, C., Llopiz, J. K., and Mooney, T. A. (2018). Soundscapes influence the settlement of the common Caribbean coral Porites astreoides irrespective of light conditions. R. Soc. Open Sci. 5 (12), 181358. doi:10.1098/rsos.181358
Lillis, A., Bohnenstiehl, D., Peters, J. W., and Eggleston, D. (2016). Variation in habitat soundscape characteristics influences settlement of a reef-building coral. PeerJ 4, e2557. doi:10.7717/peerj.2557
Lillis, A., and Mooney, T. A. (2018). Snapping shrimp sound production patterns on caribbean coral reefs: relationships with celestial cycles and environmental variables. Coral Reefs 37 (2), 597–607. doi:10.1007/s00338-018-1684-z
Lin, T.-H., Fang, S.-H., and Tsao, Y. (2017). Improving biodiversity assessment via unsupervised separation of biological sounds from long-duration recordings. Sci. Rep. 7 (1), 4547. doi:10.1038/s41598-017-04790-7
Liu, G., Strong, A., Skirving, W., and Arzayus, F. (2005). Overview of NOAA coral reef watch program’s near-real time satellite global coral bleaching monitoring activities. Proc. 10th Int. Coral Reef. Symp. 1, 1783–1793.
Lyon, R. P., Eggleston, D. B., Bohnenstiehl, D. R., Layman, C. A., Ricci, S. W., and Allgeier, J. E. (2019). Fish community structure, habitat complexity, and soundscape characteristics of patch reefs in a tropical, back-reef system. Mar. Ecol. Prog. Ser. 609, 33–48. doi:10.3354/meps12829
Mahale, V. P., Chanda, K., Chakraborty, B., Salkar, T., and Sreekanth, G. B. (2023). Biodiversity assessment using passive acoustic recordings from off-reef location—unsupervised learning to classify fish vocalization. J. Acoust. Soc. Am. 153 (3), 1534–1553. doi:10.1121/10.0017248
Mallet, D., and Pelletier, D. (2014). Underwater video techniques for observing coastal marine biodiversity: a review of sixty years of publications (1952–2012). Fish. Res. 154, 44–62. doi:10.1016/j.fishres.2014.01.019
Marnane, M. J. (2000). Site fidelity and homing behaviour in coral reef cardinalfishes. J. Fish Biol. 57 (6), 1590–1600. doi:10.1111/j.1095-8649.2000.tb02234.x
McWilliam, J. N., McCauley, R. D., Erbe, C., and Parsons, M. J. G. (2017). Patterns of biophonic periodicity on coral reefs in the Great Barrier Reef. Sci. Rep. 7 (1), 17459–17513. doi:10.1038/s41598-017-15838-z
Minello, M., Calado, L., and Xavier, F. C. (2021). Ecoacoustic indices in marine ecosystems: a review on recent developments, challenges, and future directions. ICES J. Mar. Sci. 78 (9), 3066–3074. doi:10.1093/icesjms/fsab193
Montgomery, J. C., Jeffs, A., Simpson, S. D., Meekan, M., and Tindle, C. (2006). Sound as an orientation cue for the pelagic larvae of reef fishes and decapod Crustaceans. Adv. Mar. Biol. 51, 143–196. doi:10.1016/S0065-2881(06)51003-X
Mooney, T. A., Di Iorio, L., Lammers, M., Lin, T.-H., Nedelec, S. L., Parsons, M., et al. (2020). Listening forward: approaching marine biodiversity assessments using acoustic methods. R. Soc. Open Sci. 7 (8), 201287. doi:10.1098/rsos.201287
Mooney, T. A., Lillis, A., Kaplan, M. B., Suca, J., and Lammers, M. (2017). Variability in coral reef soundscapes, spatiotemporal differences, biophysical and behavioral drivers, and associations with local biota. J. Acoust. Soc. Am. 141 (5), 3939. doi:10.1121/1.4988920
Mumby, P. J., Skirving, W., Strong, A. E., Hardy, J. T., LeDrew, E. F., Hochberg, E. J., et al. (2004). Remote sensing of coral reefs and their physical environment. Mar. Pollut. Bull. 48 (3), 219–228. doi:10.1016/j.marpolbul.2003.10.031
Myrberg, A. A. (1997). Sound production by a coral reef fish (Pomacentrus partitus): evidence for a vocal, territorial. Bull. Mar. Sci. 60 (3), 1017–1025.
Myrberg, A. A., Mohler, M., and Catala, J. D. (1986). Sound production by males of a coral reef fish (Pomacentrus partitus): its significance to females. Anim. Behav. 34 (3), 913–923. doi:10.1016/S0003-3472(86)80077-X
Nedelec, S. L., Simpson, S. D., Holderied, M., Radford, A. N., Lecellier, G., Radford, C., et al. (2015). Soundscapes and living communities in coral reefs: temporal and spatial variation. Mar. Ecol. Prog. Ser. 524, 125–135. doi:10.3354/meps11175
Newton, K., Côté, I. M., Pilling, G. M., Jennings, S., and Dulvy, N. K. (2007). Current and future sustainability of island coral reef fisheries. Curr. Biol. 17 (7), 655–658. doi:10.1016/j.cub.2007.02.054
Ozanich, E., Thode, A., Gerstoft, P., Freeman, L. A., and Freeman, S. (2021). Deep embedded clustering of coral reef bioacoustics. J. Acoust. Soc. Am. 149 (4), 2587–2601. doi:10.1121/10.0004221
Parmentier, E., Kéver, L., Casadevall, M., and Lecchini, D. (2010). Diversity and complexity in the acoustic behaviour of Dacyllus flavicaudus (Pomacentridae). Marine Biology 157, 2317–2327.
Parsons, M., Erbe, C., McCauley, R., McWilliam, J., Marley, S., Gavrilov, A., et al. (2016). Long-term monitoring of soundscapes and deciphering a useable index: examples of fish choruses from Australia. Proc. Meet. Acoust. 27, 010023. doi:10.1121/2.0000286
Peck, M., Tapilatu, R. F., Kurniati, E., and Rosado, C. (2021). Rapid coral reef assessment using 3D modelling and acoustics: acoustic indices correlate to fish abundance, diversity and environmental indicators in West Papua, Indonesia. PeerJ 9, e10761. doi:10.7717/peerj.10761
Piercy, J. J. B., Codling, E. A., Hill, A. J., Smith, D. J., and Simpson, S. D. (2014). Habitat quality affects sound production and likely distance of detection on coral reefs. Mar. Ecol. Prog. Ser. 516, 35–47. doi:10.3354/meps10986
Pieretti, N., and Danovaro, R. (2020). Acoustic indexes for marine biodiversity trends and ecosystem health. Philosophical Trans. R. Soc. B Biol. Sci. 375 (1814), 20190447. doi:10.1098/rstb.2019.0447
Pieretti, N., Farina, A., and Morri, D. (2011). A new methodology to infer the singing activity of an avian community: the Acoustic Complexity Index (ACI). Ecol. Indic. 11 (3), 868–873. doi:10.1016/j.ecolind.2010.11.005
Pittman, S. J., Monaco, M. E., Friedlander, A. M., Legare, B., Nemeth, R. S., Kendall, M. S., et al. (2014). Fish with chips: tracking reef fish movements to evaluate size and connectivity of caribbean marine protected areas. PLoS ONE 9 (5), e96028. doi:10.1371/journal.pone.0096028
Radford, C., Stanley, J., and Jeffs, A. (2014). Adjacent coral reef habitats produce different underwater sound signatures. Mar. Ecol. Prog. Ser. 505, 19–28. doi:10.3354/meps10782
Radford, C. A., Stanley, J. A., Simpson, S. D., and Jeffs, A. G. (2011). Juvenile coral reef fish use sound to locate habitats. Coral Reefs 30 (2), 295–305. doi:10.1007/s00338-010-0710-6
Reaka-Kudla, M. L. (1997). “The global biodiversity of coral reefs: a comparison with rain forests, ” in Biodiversity II: Understanding and Protecting Our Biological Resources. Editors M. L. Reaka-Kudla, D. E. Wilson, and E. O. Wilson (Washington, DC: Joseph Henry Press), 83–108.
Rice, A. N., Farina, S. C., Makowski, A. J., Kaatz, I. M., Lobel, P. S., Bemis, W. E., et al. (2022). Evolutionary patterns in sound production across fishes. Ichthyology Herpetology 110 (1), 1–12. doi:10.1643/i2020172
Sale, P. F., and Sharp, B. J. (1983). Correction for bias in visual transect censuses of coral reef fishes. Coral Reefs 2 (1), 37–42. doi:10.1007/BF00304730
Sartori, J. D., and Bright, T. J. (1973). Hydrophonic study of the feeding activities of certain Bahamian parrot fishes, family Scaridae. Hydro-Laboratory Journal 2 (1), 25–56.
Simpson, S. D., Jeffs, A., Montgomery, J. C., McCauley, R. D., and Meekan, M. G. (2008). Nocturnal relocation of adult and juvenile coral reef fishes in response to reef noise. Coral Reefs 27 (1), 97–104. doi:10.1007/s00338-007-0294-y
Spalding, M., Burke, L., Wood, S. A., Ashpole, J., Hutchison, J., and zu Ermgassen, P. (2017). Mapping the global value and distribution of coral reef tourism. Mar. Policy 82, 104–113. doi:10.1016/j.marpol.2017.05.014
Staaterman, E., Ogburn, M. B., Altieri, A. H., Brandl, S. J., Whippo, R., Seemann, J., et al. (2017). Bioacoustic measurements complement visual biodiversity surveys: preliminary evidence from four shallow marine habitats. Mar. Ecol. Prog. Ser. 575, 207–215. doi:10.3354/meps12188
Staaterman, E., Paris, C. B., DeFerrari, H. A., Mann, D. A., Rice, A. N., and D’Alessandro, E. K. (2014). Celestial patterns in marine soundscapes. Mar. Ecol. Prog. Ser. 508, 17–32. doi:10.3354/meps10911
Suca, J. J., Lillis, A., Jones, I. T., Kaplan, M. B., Solow, A. R., Earl, A. D., et al. (2020). Variable and spatially explicit response of fish larvae to the playback of local, continuous reef soundscapes. Mar. Ecol. Prog. Ser. 653, 131–151. doi:10.3354/meps13480
Sueur, J., Aubin, T., and Simonis, C. (2008a). Seewave: a free modular tool for sound analysis and synthesis. Bioacoustics 18, 213–226. doi:10.1080/09524622.2008.9753600
Sueur, J., Pavoine, S., Hamerlynck, O., and Duvail, S. (2008b). Rapid acoustic survey for biodiversity appraisal. PLOS ONE 3 (12), e4065. doi:10.1371/journal.pone.0004065
Tricas, T. C., and Boyle, K. S. (2014). Acoustic behaviors in Hawaiian coral reef fish communities. Mar. Ecol. Prog. Ser. 511, 1–16. doi:10.3354/meps10930
van Zanten, B. T., van Beukering, P. J. H., and Wagtendonk, A. J. (2014). Coastal protection by coral reefs: a framework for spatial assessment and economic valuation. Ocean Coast. Manag. 96, 94–103. doi:10.1016/j.ocecoaman.2014.05.001
Villanueva-Rivera, L. J., and Pijanowski, B. C. (2018). soundecology: soundscape Ecology_ (R package version 1.3.3) [Computer software]. https://CRAN.R-project.org/package=soundecology.
Villanueva-Rivera, L. J., Pijanowski, B. C., Doucette, J., and Pekin, B. (2011). A primer of acoustic analysis for landscape ecologists. Landsc. Ecol. 26 (9), 1233–1246. doi:10.1007/s10980-011-9636-9
West, K. M., Stat, M., Harvey, E. S., Skepper, C. L., DiBattista, J. D., Richards, Z. T., et al. (2020). EDNA metabarcoding survey reveals fine-scale coral reef community variation across a remote, tropical island ecosystem. Mol. Ecol. 29 (6), 1069–1086. doi:10.1111/mec.15382
Williams, B., Lamont, T. A. C., Chapuis, L., Harding, H. R., May, E. B., Prasetya, M. E., et al. (2022). Enhancing automated analysis of marine soundscapes using ecoacoustic indices and machine learning. Ecol. Indic. 140, 108986. doi:10.1016/j.ecolind.2022.108986
Winn, H. E., Marshall, J. A., and Hazlett, B. (1964). Behavior, diel activities, and stimuli that elicit sound production and reactions to sounds in the longspine squirrelfish. Copeia, 413–425. doi:10.2307/1441036
Keywords: fish calls, soundscapes, acoustic indices, unknown sounds, biodiversity
Citation: Jarriel SD, Formel N, Ferguson SR, Jensen FH, Apprill A and Mooney TA (2024) Unidentified fish sounds as indicators of coral reef health and comparison to other acoustic methods. Front. Remote Sens. 5:1338586. doi: 10.3389/frsen.2024.1338586
Received: 14 November 2023; Accepted: 05 February 2024;
Published: 01 March 2024.
Edited by:
DelWayne Roger Bohnenstiehl, North Carolina State University, United StatesReviewed by:
Timothy J. Rowell, National Oceanic and Atmospheric Administration (NOAA), United StatesCarrie Wall, University of Colorado Boulder, United States
Copyright © 2024 Jarriel, Formel, Ferguson, Jensen, Apprill and Mooney. This is an open-access article distributed under the terms of the Creative Commons Attribution License (CC BY). The use, distribution or reproduction in other forums is permitted, provided the original author(s) and the copyright owner(s) are credited and that the original publication in this journal is cited, in accordance with accepted academic practice. No use, distribution or reproduction is permitted which does not comply with these terms.
*Correspondence: Sierra D. Jarriel, sierra.jarriel@whoi.edu; T. Aran Mooney, amooney@whoi.edu
†Present address: Sophie R. Ferguson, Integrated Statistics, under contract to the Northeast Fisheries Science Center, National Marine Fisheries Service, National Oceanic and Atmospheric Administration, MA, USA