Using the automated HYPERNETS hyperspectral system for multi-mission satellite ocean colour validation in the Río de la Plata, accounting for different spatial resolutions
 Ana I. Dogliotti
 Estefanía Piegari
 Lucas Rubinstein1,4
  Kevin G. Ruddick
- 1Instituto de Astronomía y Física del Espacio, Consejo Nacional de Investigaciones Científicas y Técnicas (IAFE, CONICET/UBA), Buenos Aires, Argentina
- 2Instituto Franco-Argentino para el estudio del Clima y sus impactos (UMI-IFAECI, CNRS CONICET-UBA), Buenos Aires, Argentina
- 3Instituto de Investigación e Ingeniería Ambiental (IIIA, CONICET/UNSAM), Buenos Aires, Argentina
- 4Laboratorio de Acústica y Electroacústica (LACEAC), FIUBA, Buenos Aires, Argentina
- 5Royal Belgian Institute of Natural Sciences (RBINS), Brussels, Belgium
Validation of water reflectance using in situ data is essential to ensure the quality of ocean colour satellite-derived products useful for water quality monitoring, like turbidity and chlorophyll-a concentration. Since December 2021, the HYPERNETS automated hyperspectral system has been collecting data in the optically complex and highly turbid waters of the Río de la Plata, an ideal scenario for testing atmospheric correction algorithms’ performance. The site, located 60 km south of Buenos Aires (Argentina), is described in relation to the water reflectance spectral features and variability using high spatial resolution imagery and a methodology is proposed to objectively select a sensor-specific location of a reference pixel for satellite validation. Six months of data is used to evaluate surface water reflectance operational products from multi-spectral systems like Landsat 8&9/OLI (L89/OLI), Sentinel-2/MSI (S2/MSI) & Sentinel-3/OLCI (S3/OLCI), and PlanetScope SuperDoves (PS/SD), and also non standard products for Aqua/MODIS (Aqua/MODIS) and SNPP&JPSS1/VIIRS (SJ/VIIRS) missions. Moreover, the standard surface water reflectance product from the hyperspectral PRISMA mission could also be evaluated. The matchups show general good results when in situ measurements are compared to L2 standard products of high spatial resolution sensors that use land-based atmospheric correction approach, if sun glint contamination is avoided. Low mean relative percentage difference was found for S2/MSI (2.45%) and L89/OLI (−3.52%), but higher for PS/SD (30.7%). In turn, S3/OLCI medium resolution also showed low mean relative differences (2.31%), while SJ/VIIRS and Aqua/MODIS showed larger and negative differences (−16.35 for SJ/VIIRS and −35.6% for Aqua/MODIS) which showed a clear increase towards the shortest blue bands. The results show the great potential of the HYPERNETS automated system to provide high quality and quantity of data for validation of satellite data at all visible and near infrared (VNIR, 400–900 nm) wavelengths in a multi-mission perspective.
1 Introduction
Declining water quality of coastal and estuarine waters has become a global issue of concern affecting human health, ecosystems and the economic environment (IOCCG, 2018). Given the increasing anthropogenic activities and water pollution issues in populated coastal areas, there is a strong need to perform integrated and regular water monitoring to improve the present strategies concerning water treatment and management, as well as governance. While traditional in situ water sampling and measurements are expensive, both in cost and time, satellite remote sensing technology has shown to be a cost-effective tool for proving synoptic data for monitoring large scale and long-term water quality (Mumby et al., 1999). Therefore, it is essential to validate satellite-derived products, in particular water reflectance (ρw), using in situ data to ensure the quality of derived parameters useful for water quality monitoring, like turbidity and chlorophyll-a concentration.
The Río de la Plata (RdP) estuary, located in the Southwestern South Atlantic (∼35°S), is the natural boundary limit between Argentina and Uruguay where the respective capital cities of Buenos Aires and Montevideo are located. The estuary and its area of influence is of great social, economical and ecological importance being the source of drinking water for millions of people, a region for tourism, transportation, and fishing activities, and the location of big harbours and industrial centers. It is a highly active and human impacted area that receives the discharge of domestic and industrial effluents as well as agro-chemicals that drain from large areas of intensive agricultural production, leading to an important increase in nutrient loading, showing symptoms of eutrophication (Nagy et al., 2002; García-Alonso et al., 2019). Moreover, cyanobacterial blooms have become a recurrent phenomenon in the estuary, especially in the last 2 decades along the northern Uruguayan coast (De León and Yunes, 2001; Aubriot et al., 2020; Kruk et al., 2021), and also on the Argentine coast (Sathicq et al., 2014; Dogliotti et al., 2021), although less frequent and intense.
Therefore, water quality control and regular monitoring of the trophic status of this estuarine system are very important for which remote sensing is a powerful tool. However, due to the optical complexity of RdP waters, i.e., high inorganic suspended matter, they represent a challenging scenario for both atmospheric correction and bio-optical algorithm development.
The use of autonomous systems, like AERONET-OC, has shown to be effective for increasing the number of validation match-ups (Zibordi et al., 2009; Zibordi et al., 2020). However, the multispectral nature of the instrument used in the AERONET-OC network, prevents its use to validate hyperspectral missions and missions with different spectral band configurations. Within the H2020/HYPERNETS project, a new hyperspectral radiometer with a pointing system and auxiliary sensors has been developed to provide fine spectral resolution radiometric data in the visible and near infrared (VNIR) region with high quality measurements at lower cost. One of these autonomous hyperspectral systems has been deployed for the first time in the turbid waters of Río de la Plata estuary, close to the city of Buenos Aires, gathering high quality radiometric information since December 2021. At the moment of writing other five HYPERNETS systems have been deployed in a wide variety of water types, i.e., in coastal waters with moderately (Aqua Alta Oceanographic Tower in Italy) to more turbid (Zeebrugge in Belgium) waters, in inland water bodies with clear (Garda Lake in Italy) and turbid and productive (Etang de Berre in France) waters, and in estuaries with turbid to highly turbid waters like the Gironde estuary, in France, with similar optical characteristics to the highly turbid waters in the Río de la Plata estuary (LPAR site).
The objectives of the present paper are to introduce the hyperspectral automated fixed station deployed in the turbid waters of the Río de la Plata estuary in support for long-term multi-mission satellite ocean colour validation, evaluate the spatial variability of water reflectance around the site in order to select the location of reference pixel to be used for satellite validation, and to show its potential to provide high quality and quantity of data by evaluating surface water reflectance operational products from existing satellite missions operating in the visible and near infrared (VNIR, 400–900 nm) spectral bands that are used for aquatic applications.
2 Data and methods
2.1 HYPERNETS system and HYPSTAR® in situ reflectance data
The HYPERNETS System, deployed at the LPAR site, is comprised of an advanced hyperspectral VNIR spectrometer with an embedded RGB imaging camera, a relative calibration LED source, a pan-tilt mechanism that allows positioning and pointing the radiometer in different directions, and auxiliary sensors (pressure, humidity, temperature, rain, light, and two external cameras). A detailed description of the system and sensor can be found in Kuusk et al. (submitted to this same Frontiers Research Topic). All the controlling, positioning, and data transmitting parts of the system are located in a water-proof main box and the whole system is powered by a 12 V battery that is connected to a solar panel and charge controler.
The HYPSTAR® (HYperspectral Pointable System for Terrestrial and Aquatic Radiometry) Standard Range (HYPSTAR®-SR), developed within the European Union’s H2020 HYPERNETS project, is a hyperspectral radiometer system with radiance (Field Of View, FOV 2°) and irradiance (FOV 180°) optical entrances that are optically multiplexed to one VNIR spectrometer module that collects data between 380 and 1,020 nm with a FWHM of 3 nm (https://hypstar.eu/). Since the same spectrometer is used for both radiance and irradiance measurements, the three measurements needed to derive water reflectance (ρw), i.e., the downwelling sky radiance (Ld), upwelling radiance from the water (Lu) and downwelling irradiance (Ed), are measured sequentially. The system is programmed to collect data every 20 min between 09:00 to 17:00 local time, and data is saved in a local device and automatically transferred (3G) to a remote server where it is processed and quality controlled using the HYPERNETS processor (https://github.com/HYPERNETS/hypernets_processor, see Goyens et al., 2022 for details).
The standard water measurement sequence consists of sequential measurements of Ed (three replicates), Ld (three replicates), Lu (six replicates), and three more replicates of Ld and Ed after the Lu measurements. The zenith angles of the sea- and sky-viewing radiance sensors are 40° and the relative azimuth angle with respect to the sun is ±90° as in Zibordi et al. (2009). This geometry is kept constant throughout the day thanks to the automated pan/tilt mechanism that rotates the radiometer. Data from a sequence that pass quality control are mean averaged, and if sufficient replicates are available, i.e., at least 3 replicates of each parameter, the water-leaving radiance reflectance (ρw) is computed by:
Where ρF is the air-water interface reflectance factor that is approximated as a function of the sun and viewing geometry and wind speed (Mobley, 1999). Wind speed is derived from NCEP/GDAS (National Centers for Environmental Prediction, National Weather Service, NOAA, U.S. Department of Commerce, 2015) when available or fixed to 2 m/s otherwise. As part of the WATERHYPERNET network, an international prototype network of sites running automated systems of pointable hyperspectral radiometers with common data acquisition and processing, a common quality control of the data is performed (Goyens et al., 2022; De Vis et al.; Ruddick et al. submitted this same Frontiers Research Topic) and further LPAR site-specific quality control is applied in order to reduce perturbations from the structure, e.g., avoiding certain viewing and illuminating geometry, and removing variable ρw, i.e., with a coefficient of variation (standard deviation to mean ratio) CV<10% in the VIS 400–900 nm. Further details the HYPSTAR® data processing are available in Goyens et al. (2022), and De Vis et al., submitted this same Frontiers Research Topic). The quality-controlled hyperspectral water reflectance spectra have been convoluted to the spectral response of the different multi-spectral sensors analyzed in this study (Supplementary Figures S1, S2) and smoothed using a moving average filter (15 window size) for comparison with PRISMA data.
2.2 LPAR fixed station
The La Plata Argentine site (LPAR) is located 60 km south of the city of Buenos Aires (Argentina) in the coastal waters of the highly turbid of Río de la Plata middle estuary (Figure 1). The fixed structure, that belongs to the “Escuela Naval Militar” (Naval Academy), is located at the end of the 1.1 km long and 50 cm wide jetty (34°49′04.8″ S, 57°53′45.3″ W), with a size of 5 × 5 m and a height of ∼8.5 m above water surface. Water flows freely under the jetty, thus minimising impact of the jetty on the hydrodynamics and ambient water colour. The HYPSTAR® is located in the northwestern corner in the first level of this platform. The LPAR site is located between a regional water intake that distributes drinking water to 2.5 million people in the Buenos Aires province and the active commercial harbour of La Plata city, an area where intense phytoplankton blooms (including toxic Cyanobacteria) have been recorded frequently since 2020 (Dogliotti et al., 2021) presenting human health risks and causing occasional problems for the water intake site.
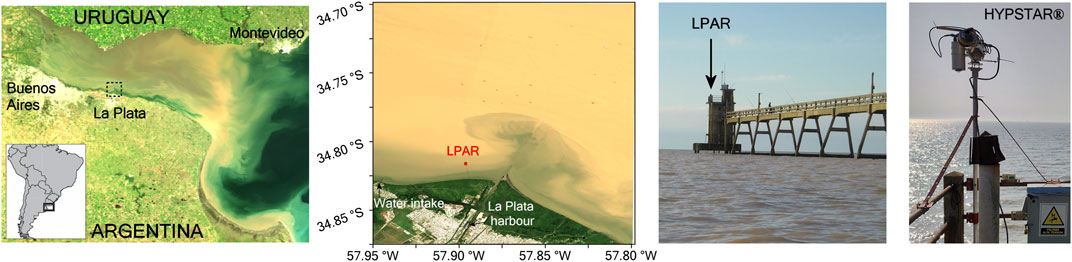
Figure 1. Location of the LPAR site next to La Plata harbor on the Sentinel-3A/OLCI (left) and Sentinel-2A/MSI images taken 2022-09-05 and photos of the platform and HYPSTAR® sensor (right).
The Río de la Plata (RdP) is a large and shallow funnel shaped estuary with high values of suspended particulate matter, ranging from 100 to 300 g m−3 (Framiñan et la. 2006) and reaching 940 g m−3 in the maximum turbidity zone. The region is therefore an ideal site to test atmospheric correction algorithm performance (Shi and Wang et al., 2009; Gossn et al., 2019; Maciel et al., 2022). The LPAR site is located in the southern limit of the middle estuary and the average water depth is ∼4 m.
In situ HYPSTAR® data at LPAR have been automatically collected from 2021-12-16 until 2022-09-19, with some downtime periods, and operating from 09:00 to 17:00 local time every 20 min. Spectra collected during this period were quite fluctuating depending on the month of the year, but spectral shapes and magnitude are consistent with measured spectra collected in this part of the estuary during previous campaigns (Gossn et al., 2019; Dogliotti et al., 2021). Examples of monthly mean spectra +/- 1 standard deviation collected in February and July 2022 are shown in Figure 2. Data collected in July show typical turbid waters water spectra features, i.e., highest ρw values in the 550–700 nm part of the spectra (0.10–0.14), a peak around 810 nm, due to a local minimum of the water pure absorption, and relatively high ρw values in the NIR (0.025–0.075). In turn, spectra collected in February showed features more related to moderately productive waters with indications of cyanobacteria presence, i.e., a clear strong decrease in ρw around 675 nm (second peak of chlorophyll-a absorption) and slight decrease in ρw around 620 nm (characteristic absorption peak of Phycocyanin, a typical pigment found in cyanobacteria). Moreover, samples collected during a field campaign on 2022-02-16 confirmed the presence of high amount of phytoplankton cells, high chlorophyll-a concentration (25 mg/m3) and the presence of cyanobacteria cells (Dogliotti et al., 2023).
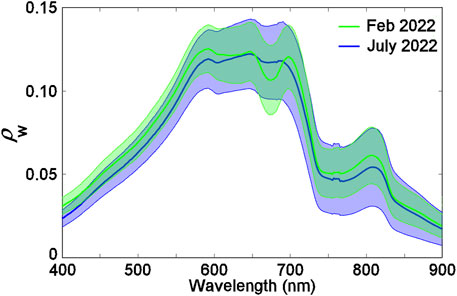
Figure 2. In situ HYPSTAR® L2 average spectra (bold lines) collected at LPAR on February (green) and July (blue) 2022. The shadowed areas delimit the +/-1 standard deviation respect to the average of all available spectra for each month.
2.3 Satellite data
With the aim of demonstrating the capability of HYPERNETS system, different available optical VSWIR satellite missions, with varying band sets and widths and spatial and temporal resolutions, have been chosen. Satellite data acquired from 2021-12-16 to 2022-09-19 covering the LPAR site were downloaded and compared to HYPSTAR® L2 data. Given that the OBPG Level 2 standard products fails in the turbid waters of RdP and pixels are generally masked (Dogliotti et al., 2011), Level 1A MODIS and VIIRS data have been downloaded and processed using alternative atmospheric correction, i.e., the black pixel approach using the SWIR bands (more details below). For the other sensors, operational standard Level 2 images have been downloaded. All the evaluated systems are summarized in Table 1 and described below.
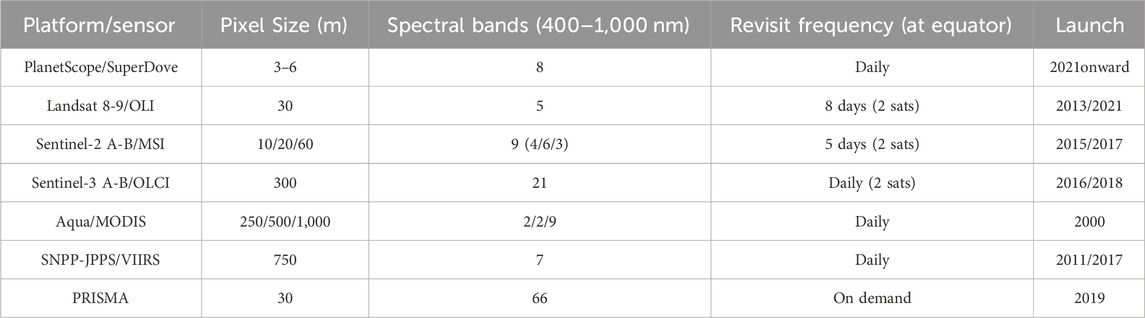
Table 1. Characteristics of the systems evaluated in the present study.
SuperDove (SD) satellites, third generation of PlanetScope Earth-imaging constellation, are currently in orbit and produce imagery with 8 spectral bands in the VNIR region at a ground sampling distance at nadir of 3–6 m (Planet, 2022). Six of the SD bands match and have similar relative spectral responses (RSRs) to S2/MSI bands (Supplementary Figure S1). The absolute calibration is performed using near-simultaneous SuperDove and S2/MSI observations and validated with RadCalNet data (Collison et al., 2022). Level-2 surface reflectance (ρs) orthorectified GeoTIFF files with 3 m pixel size have been downloaded from the Planet Explorer website (https://www.planet.com/explorer). Cloud free images (CMO processor v4.1.4) over the LPAR site have been selected during the deployment period.
Landsat 8 and 9 satellites, on orbit since 2013 and 2021 respectively, carry the Operational Land Imager (OLI) that provides data at 9 spectral bands, eight of which at 30 m spatial resolution and one panchromatic band at 15 m. Considering both satellites together, the revisit time for data collection is every 8 days. Level 2 Collection 2 images over the LPAR site (path row 225/084) have been downloaded from USGS EarthExplorer (http://earthexplorer.usgs.gov/). Landsat 8/9 Level 2 science surface reflectance (ρs) products are generated using the Land Surface Reflectance Code (LaSRC) algorithm (Version 1.5.0).
Sentinel-2 A and B satellites, launched in 2015 and 2017 respectively, carry the MultiSpectral Imager (MSI) with 13 bands in the Visible to ShortWave InfraRed (VSWIR) part of the spectrum with 4 bands at 10 m, 6 bands at 20 m and 3 bands at 60 m spatial resolution. The revisit frequency of each single S2 satellite is 10 days and the combined constellation revisit is 5 days. Level 1C images over the LPAR site (tile 21HVA) have been downloaded from the Sentinel Scientific Data Hub (https://scihub.copernicus.eu/) and processed using Sen2Cor v2.11 atmospheric correction (Louis et al., 2016) algorithm. The default configuration was used giving the same as for the L2A “Core” Products processing in Sentinel-2 Ground Segment with L2A processing baseline 04.00. Surface reflectance (ρs) at all bands were resampled to 10 m resolution using Sentinel Applications Platform (SNAP v9.0.0).
Sentinel-3 A and B satellites, launched in 2016 and 2018 respectively, carry the Ocean and Land Colour Instrument (OLCI) with 21 bands in the VSWIR at 300 m spatial resolution. Being an instrument designed for water applications, OLCI have more and narrower bands (Supplementary Figures S1, S2) with higher signal-to-noise ratio compared to land sensors. The two in-orbit S3 satellites enable a short revisit time of less than 2 days for OLCI at the equator. S3/OLCI Level 2-Water Full Resolution (L2-WFR) images, processed by EUMETSAT with the Instrument Processing Facility (IPF) IPF-OL-1-EO version 7.00 (EUMETSAT, 2021; Zibordi et al., 2022), were downloaded from the Copernicus Online Data Access hosted by EUMETSAT (coda. eumetsat.int). Data were available from the EUMETSAT Ocean Colour baseline collection OL_L2M.003.
The Moderate Resolution Imaging Spectroradiometer (MODIS), onboard of Terra and Aqua platforms launched in 1999 and 2002, has 36 spectral bands, with 19 bands in the VSWIR range at 250 m (2 bands), 500 m (5 bands) and 1,000 m (9 bands) spatial resolution. Only MODIS-Aqua imagery is here evaluated given the difficulties in characterizing the MODIS instrument on board of Terra satellite and its calibration history (Franz et al., 2008). Level-1A images covering LPAR site in cloud-free days were acquired from NASA ocean color website (https://oceancolor.gsfc.nasa.gov) and processed to Level 2 at 1,000 m resolution using SeaWiFS Data Analysis System (SeaDAS) ocssw/l2gen processor version 8.1. The output product, the remote sensing reflectance (Rrs in sr−1), is multiplied by π sr to obtain the water reflectance (ρw). A two-band multiple scattering extrapolative approach, similar to Gordon and Wang (1994), was used but using two SWIR bands (Shi and Wang, 2009), i.e., the aerosol signal was computed accounting for multiple scattering effects and assuming black water in two specified bands in the SWIR (GW94-SWIR). Given that four out of ten detectors for the Aqua/MODIS SWIR2 band (1,640 nm) are inoperable and cannot be used, the SWIR1 (1,240 nm) and SWIR3 (2,130 nm) bands are used (SWIR13). Given the high reflectance of Río de la Plata waters, the following l2gen configuration parameters have been modified compared to the default processing. The bidirectional reflectance distribution function correction (BDRF), based on the blue-to-green ratio chlorophyll estimation, was disabled (brdf_opt = 0) given that it generally degrades performance in turbid waters (Li et al., 2019). The gaseous absorption correction was set to account for ozone, carbon dioxide, nitrogen dioxide, and water vapor (gas_opt = 15). Clouds were masked using the SWIR3 band using a threshold 0.018 and pixels with high sun zenith angle (θs > 60°) and view zenith angle (θv > 70°) were also masked. The high radiance (maskhilt = 0) and straylight (maskstlight = 0) standard masks were switched off since they usually erroneously mask turbid water pixels.
The Suomi National Polar-orbiting Partnership (Suomi-NPP) and two Joint Polar Satellite System satellites (JPSS-1 and JPSS-2 or NOAA-20 and NOAA-21), launched in 2011, 2017 and 2022, carry the Visible Infrared Imaging Radiometer Suite (VIIRS) with 22 spectral bands that ranges from the blue (410 nm) to the long wave infrared (12.5 μm). Five imaging (I) bands, covering the red, near-, shortwave-, medium-, and long wave infrared, have a spatial resolution of 375 m while the 16 moderate (M) resolution bands and the day/night panchromatic band have 750 m spatial resolution. VIIRS-JPPS/SNPP Level-1A cloud-free images covering LPAR site were downloaded from NASA ocean color website (https://oceancolor.gsfc.nasa.gov) and processed to Level 2 using SeaDAS v8.1. The output product, the remote sensing reflectance (Rrs in sr−1), is multiplied by π sr to obtain the water reflectance (ρw). The same atmospheric correction approach (WG94-SWIR) and l2gen configuration parameters were applied, but given that VIIRS has the three operating SWIR bands compared to MA, VIIRS data was processed using three sets of SWIR band combinations, i.e., SWIR12, SWIR13, and SWIR23.
The hyperspectral PRISMA (PRecursore IperSpettrale della Missione Applicativa) mission was launched by the Italian Space Agency (ASI) in 2019. The hyperspectral camera takes images in a continuum of spectral bands with 66 bands in the VNIR range (400–1,010 nm) and 173 bands in the SWIR range (920–2,500 nm) at 30 m spatial resolution. As acquisitions are taken by request, only four cloud-free PRISMA images have been acquired during the LPAR deployment period here analyzed. Level 2C images from the PRISMA archive were downloaded from the ASI portal (https://prisma.asi.it/). PRISMA Level 2 surface reflectance (ρs) product is generated based on MODTRAN v6.0 and using a multi-dimensional LUT approach. The processing uses a land-based atmospheric correction where retrieval of aerosol optical thickness is based on the Dense Dark Vegetation algorithm approach. A full description of the algorithms is available in the PRISMA Algorithm Theoretical Basis Document (ASI, 2021).
2.4 Match-up analysis
The comparison between in situ and satellite data (match-up) has been performed by extracting a 3 × 3 pixel window centered at the reference location for the LPAR site depending on the spatial resolution of the system being evaluated. The location of the reference pixel, as described later in Section 3.1, was selected by evaluating the natural spatial variability of the water reflectance around the platform using S2/MSI 2016-2022 time series at 10 m spatial resolution imagery. If less than 50% of the pixels in the 3 × 3 window were valid, i.e., less than 5 pixels out of 9, the matchup was discarded, otherwise the mean and standard deviation were calculated. Invalid pixels were determined by applying mission-specific recommended flags which varied with the sensor/processor analyzed. Flags considered for each system are listed in Table 2. For the L2 standard land products, which do not correct for sun glint but have SWIR bands, pixels were masked if ρs(∼1,600)>0.05. In order to minimize the effect of outliers on the calculated mean value, pixels beyond median ±1.5* standard deviation were excluded as in Bailley and Werdell (2006). Finally, in order to evaluate spatial homogeneity, the mean value of the valid pixels was used if the median of the CV of ρw between 412 and 560 nm was less than 0.15 (Bailey and Werdell, 2006). The closest HYPSTAR® observation in time with the satellite overpass, within 30 min, was selected and, if bounding observations within a window of maximum 40 min were available, observations were linearly interpolated to the satellite overpass time and convolved to the relative spectral responses (RSR) of the different sensors analyzed (Supplementary Figures S1, S2). Vertical bars in the scatter plots corresponds to the standard deviation of the 3 × 3 window, for satellite data, and the horizontal bars, half the absolute difference between the bounding observations for HYPSTAR® data. The time difference between in situ and satellite overpass was always within 10 min.
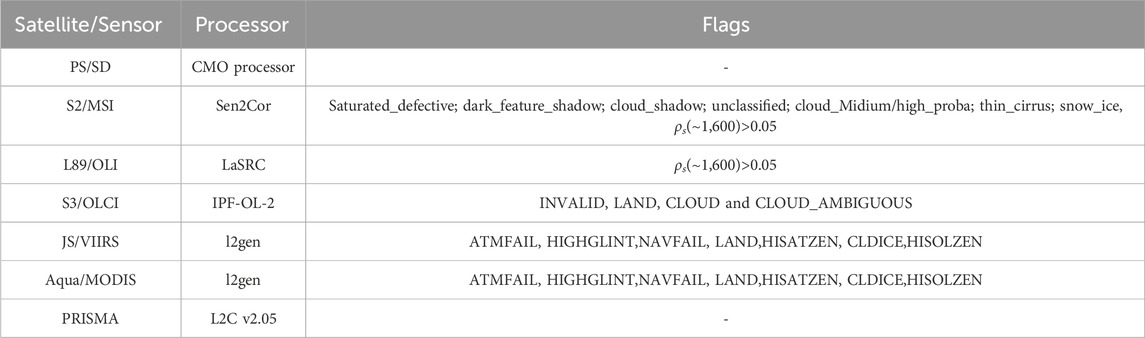
Table 2. List of satellite/sensors, level-2 processor, and flags used for quality control of satellite data.
2.5 Statistics
To describe the difference between satellite and in situ data, regression analysis and a set of statistics were calculated. Linear regressions between predicted (satellite) and observed (in situ) water reflectance were performed using a reduced major axis (RMA) type II regression analysis given that both satellite and in situ measurements are subject to errors. Typical linear regression statistics were obtained, i.e., slope, intercept, and coefficient of determination R2. Considering N match-ups, the differences between in situ (x) and satellite (y) data are quantified by the mean relative percentage difference (RPD) or bias, and the absolute percentage difference (APD), both in percent
The root mean square difference (RMSD) is also computed, which gives the uncertainty in the same units as the evaluated variable.
3 Results
3.1 Selection of reference pixel location
The radiometer is located at the end of a slender (50 cm) 1.1 km long jetty. Given its relative closeness to land, it is important to understand the natural horizontal variability of the water reflectance around the deployment site in order to evaluate its suitability to validate sensors with different spatial resolutions. Therefore, an analysis is performed here considering different satellite spatial resolutions in order to decide whether the site exact location or a reference pixel is preferred and if the latter, select the optimal location. To evaluate the spatial homogeneity of the area, a 6 years time-series of Sentinel-2 (A & B) images resampled to 10, 300, 700 and 1,000 m resolutions was used. For each image, the reflectance value from the 10 m resolution imaged at all bands have been extracted at the exact location of the measurement site and used to calculate the relative percentage difference between this value and each pixel of the same image (Figure 3).
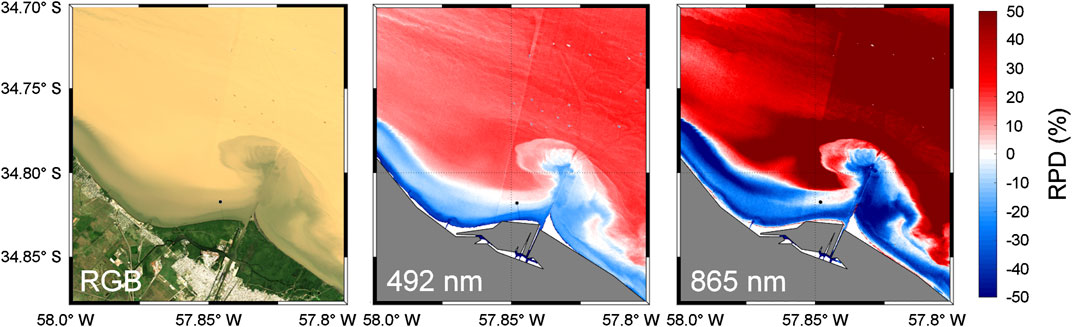
Figure 3. Sentinel-2A/MSI RGB composite of ρw for LPAR site taken on 2020-02-28 (left) and relative percentage difference calculated at each pixel respect to the value at LPAR site location for 492 nm (centre) and 865 nm (right) bands.
Similar daily maps have been calculated for the whole time series comparing the original value at the site at 10 m resolution to the pixels of the resampled images at the other spatial resolutions for the same date (Figure 4).
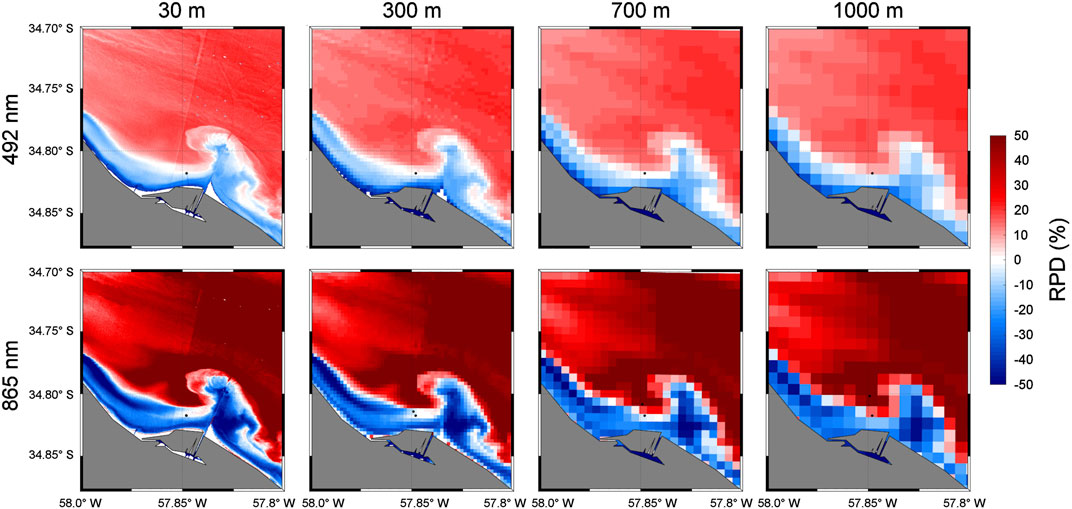
Figure 4. Sentinel-2A/MSI relative percentage difference maps taken on 2020-02-28 calculated at each pixel respect to the value at LPAR site location for 492 nm (top row) and 865 nm (bottom row) bands for resampled images at different spatial resolutions (columns).
It can be observed that lower relative differences are found for shorter (e.g., 492 nm) compared to longer wavelengths (e.g., 865 nm). To determine the region with lower spatial variability, the frequency of pixels with APD lower than 15% per band was calculated. Given that the NIR band showed the highest variability, this band was used to define the reference pixel (with its corresponding 3 × 3 window) to use for typical spatial resolutions sensors. For the medium and lower resolutions, i.e. 300, 700 and 1,000 m, the reference pixel was selected within the region of lower variability (high frequency of APD< 15%) and at a certain distance to the coast, considering the satellite pixel size, in order to avoid contamination (Figure 5).
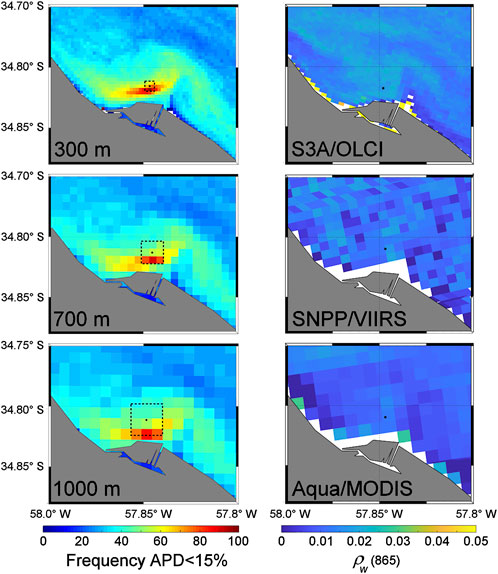
Figure 5. Frequency of APD values lower than 15% calculated using the whole S2/MSI time series (left) and ρw at 865 nm for S3A/OLCI (300 m), SNPP/VIIRS (750 m), and Aqua/MODIS (1,000 m) images taken on 2022-09-05 (right). Location of the reference pixel (black round symbol) and the corresponding 3 × 3 pixel window (dashed black square) are indicated.
In turn, for the higher spatial resolution sensors, i.e. 3 (PS), 10 (MSI) and 30 (OLI) m, the closest pixel to the platform to the Northwest, considering also the 3 × 3 pixel window, is selected in order to avoid contamination from the platform structure (Figure 6). In this way the location of the reference pixel to be used, depending on the resolution of the sensor to evaluate, are shown in Figure 6 and listed in Table 3. Statistics for the 492 nm and 865 nm bands are also presented in Table 3.
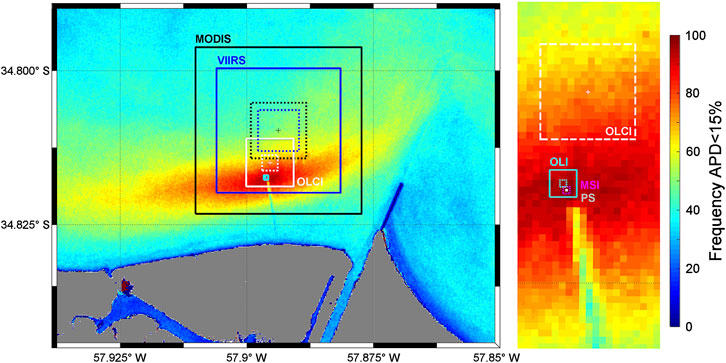
Figure 6. Frequency map of APD values lower than 15% where the location of the reference pixel and corresponding 3 × 3 pixel window are indicated for different sensors: PS (grey), MSI (magenta), OLI (cyan), OLCI (white), VIIRS (blue), and MODIS (black). Detailed view of the LPAR site (right).
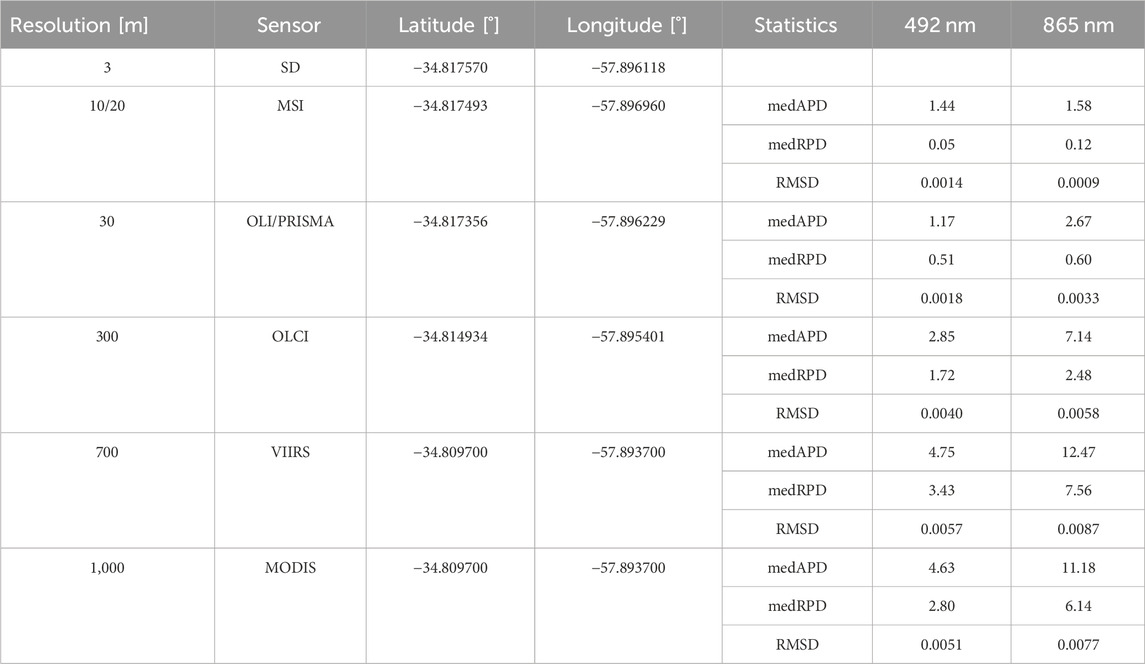
Table 3. Reference pixel location depending on the spatial resolution of the systems and statistics for 492 and 865 nm bands. medAPD: median absolute percentage difference (%), medRPD: median relative percentage difference (%).
3.2 Spectral consistency
Comparison of satellite and in situ ρw spectra for all the sensors analyzed in this study are shown in Figure 7. In general, the average spectral shape of all sensors were consistent with the in situ data, however clear differences are obvious and varied for each sensor. The average spectra of PS/SD tended to overestimate in situ data, especially in the blue (400–500 nm) and NIR (800–900 nm) parts of the spectra. In turn, L89/OLI and S2/MSI tended to overestimate in situ data between 500 and 700 nm, while similar values (average) and variability (standard deviation) were found in the blue and NIR part of the spectra. The average ρw spectra of S3/OLCI was slightly lower (higher) at wavelengths shorter (longer) than 600 nm. Both Aqua/MODIS and SJ/VIIRS sensors, processed using OCSSW/l2gen and SWIR bands, systematically underestimated in situ ρw data. For SJ/VIIRS, increased overestimation can be observed when SWIR12 and SWIR13 bands are used compared to SWIR23. In general, differences increased towards the shorter wavelengths, retrieving negative ρw values in the blue bands, especially for Aqua/MODIS. Finally, PRISMA also showed a systematic underestimation of the in situ ρw throughout the spectra.
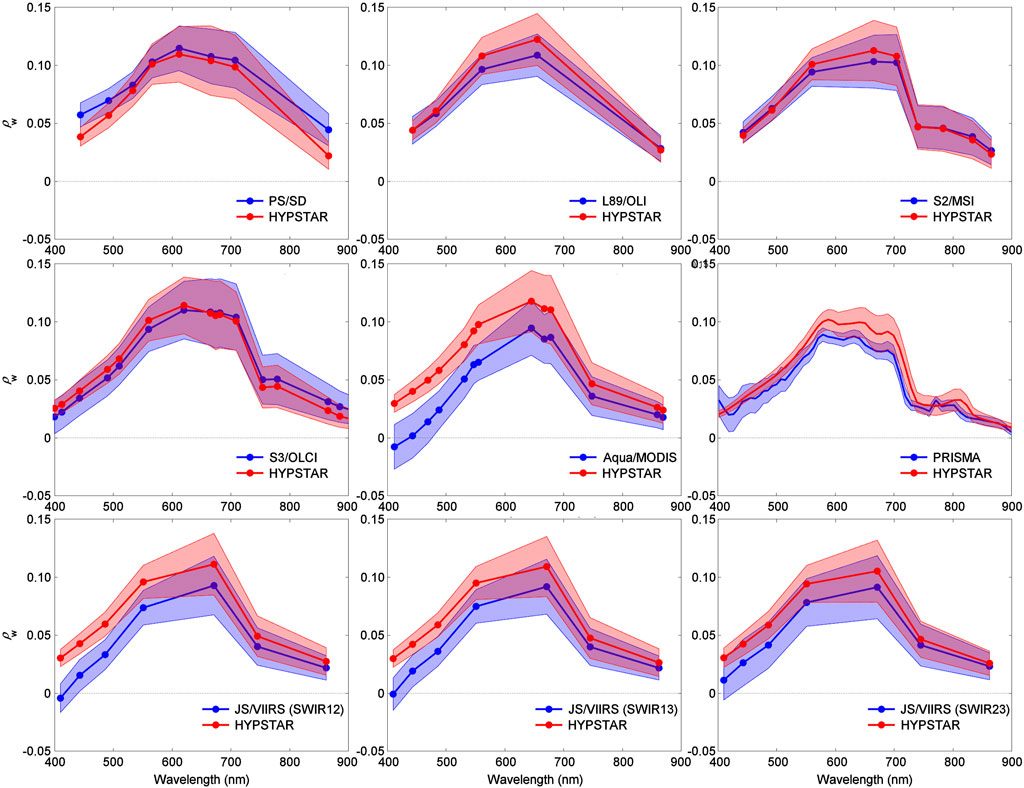
Figure 7. Comparison of ρw spectra of satellite-derived (blue) and in situ HYPSTAR® data (red). Bold lines are the mean and the thin lines are the +/-1 standard deviation respect to the average of all available spectra: PS/SD, L89/OLI, S2/MSI, S3/OLCI, Aqua/MODIS, PRISMA, and JS/VIIRS using SWIR12, SWIR13, and SWIR23 configurations.
3.3 Matchups analysis
Comparisons between satellite-derived and HYPSTAR® in situ water reflectance data for the six multispectral sensors (PS/SD, L89/OLI, S2/MSI, S3/OLCI, JS/VIIRS, and Aqua/MODIS) considering all bands together, are shown in Figure 8. A first evaluation of JS/VIIRS atmospheric correction results comparing the three SWIR bands combination showed that, even though a general underestimation at all bands is evident for all configurations, differences between satellite and in situ data were lower when the SWIR23 bands were used (Figure 8 and Supplementary Figures S3, S4). Therefore the analysis of JS/VIIRS matchups using only the SWIR23 band combination are presented in the following results. Given that comparisons with in situ measurements (plots and statistics) for the same instrument on board of different satellites are comparable, all data from each sensor regardless of the satellite were analyzed and plotted together, i.e., OLI from Landsat-8/9, MSI from S2A/B, and VIIRS from JPPS/SNPP. A breakdown per satellite sensor statistics and scatterplots can be found in Supplementary Figures S5–S12.
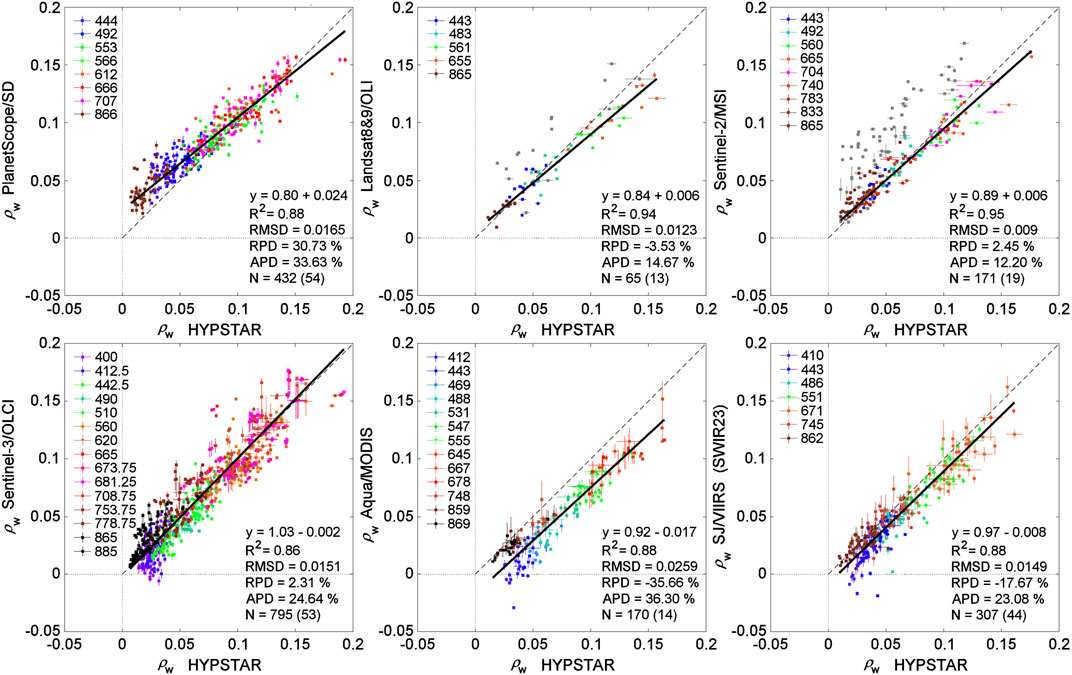
Figure 8. Scatter plots of in situ HYPSTAR versus satellite-derived water reflectance (ρw) for PS/SD, L89/OLI, S2/MSI, S3/OLCI, Aqua/MODIS, SJ/VIIRS. Statistics are presented as the best-fitted SMA linear regression and associated determination coefficient, the RMSD, RPD, APD and the number of data (N) and processed images (in brackets). For L89/OLI and S2/MSI, grey symbols correspond to discarded match-ups due to sun glinted images.
A high correlation for all bands together was found for all sensors (R2 > 0.8), being higher (R2 > 0.9) for L89/OLI and S2/MSI (Figure 8). The latter also showed the lowest average RPD (−3.52 and 2.45), APD (14.67 and 12.20) and RMSD (0.0124 and 0.0091) for L89/OLI and S2/MSI respectively. In both cases, higher underestimation is found at higher water reflectance values (slope <1).
It is interesting to note that if images contaminated with sun glint are not removed (using the ρs(∼1,600)>0.05 criterion) and are thus included in the analysis (grey symbols in Figures 8, 9 for S2/MSI and L89/OLI), correlations decrease (R2 = 0.65 and 0.81) and all statistics increase (Table 4). Moreover, higher overestimation (RPD = 29.74% and 7.4%) and scatter (APD = 37.14% and 24.11%) of the data is found for both S2/MSI and L89/OLI, respectively when sun glinted images are not removed (Table 4). The RMSD not only decrease for both sensors at all bands, but its spectral shape changes from almost spectrally flat (when sun glinted images are included) to a shape that resembles water reflectance when contaminated images are excluded (Figure 9).
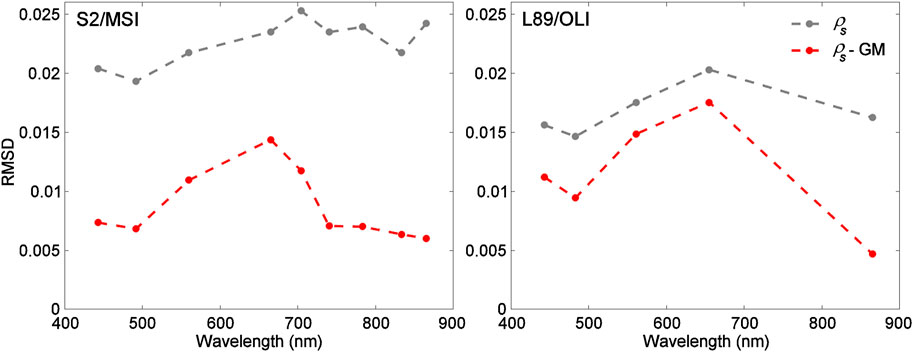
Figure 9. RMSD spectra for S2/MSI (left) and L89/OLI (right) for ρs matchups using all coincident images (grey) and masking sun glinted images (GM) (red).
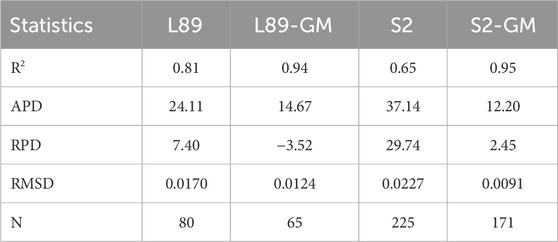
Table 4. Validation statistics for OLI and MSI matchups considering all possible matchups and only non-glinted images (GM: Glint Masked).
Results for PS/SD indicate lower correlation (R2 = 0.88) and on average higher scatter (APD = 33.63%, RMSD = 0.0165) and positive bias (RPD = 30.75%) tending in general to overestimate in situ data especially at low reflectance values. For mid- and low-spatial resolution sensors, i.e., S3/OLCI, JS/VIIRS, and Aqua/MODIS, higher APD (20%–30%) and RMSD (0.014–0.025) were found, with Aqua/MODIS showing higher scatter (APD = 36.30% and RMSD = 0.0259). Both JS/VIIRS and Aqua/MODIS clearly tend to underestimate in situ values at all bands, even retrieving negative values in the shorter bands. While S3/OLCI showed better results, it also retrieved some negative values in the blue, demonstrating clear problems of the atmospheric correction in these turbid waters. PS/SD standard ρs products tend to over(under) estimate in situ values at low(high) water reflectance values (Supplementary Table S1). Given that only a few PRISMA images were available for the period analyzed, only the four match-ups spectra are shown in Figure 10. In general water reflectances were underestimated over the whole spectra, except for the image on 2022-08-25 which showed good correspondence in the region between 550 and 710 nm and overestimation below and above those wavelengths. In general, the PRISMA spectra shape resembles that of the HYPSTAR measurements, although some strange features can be observed, i.e., there is an increase in water reflectance in the 400–420 nm part of the spectra and there is a spike at ∼760 nm that could be an artifact due to the proximity to the region of atmospheric oxygen absorption (Ruddick et al., 2023).

Figure 10. In situ HYPSTAR ρw (black) and PRISMA standard Level-2 ρs (red) spectra.
The spectral variation of the statistics is shown in Figure 11. In general, for all multi-spectral sensors here analyzed, higher scatter (APD = 20–90%) and worse fits (R2 < 0.5, Supplementary Table S1) are found at the shorter bands (<550 nm), but while the average relative difference is positive for S2 (RPD = 2–6%), and PS/SD (RPD = 3–54%), it is negative for L89/OLI (RPD = −3/-10%), S3/OLCI (RPD = −40/-10%), JS/VIIRS (−50/-10%), and Aqua/MODIS (−25/-90%). The absolute relative differences also increases towards the NIR (>700 nm), varying from 10% to 140%, with a general overestimation of the in situ values for all sensors except for VIIRS and MODIS which show a clear underestimation. Furthermore, JS/VIIRS and Aqua/MODIS show a negative bias across the whole spectrum, indicating a general overestimation of the atmospheric path reflectance that increases from the near infrared to the shortest blue bands with RPD, varying from −2.5% to −50% for JS/VIIRS and from −18% to −90% for Aqua/MODIS (Figure 12). S2/MSI and L89/OLI spectral RMSD resemble the shape of water reflectance spectra, with higher values between 500 and 700 nm (0.014–0.017) and lower in the shorter and longer wavelength (∼0.007). A similar shape can also be observed for S3/OLCI, but with higher RMSD at all bands, and for JS/VIIRS but with higher RMSD at shorter wavelengths (∼0.015), while a general increase of RMSD with decreasing wavelength is observed for Aqua/MODIS, evidencing an imperfect correction of the atmospheric path reflectance. In turn, PS/SD shows high RMSD towards both the shorter and longer wavelengths reaching maxima of 0.022 and 0.025, respectively. Results for PS/SD indicate on average low differences with HYPSTAR® observations for the five bands between 553 and 707 nm, with mean absolute relative differences (APD) 8.4%–12%, while differences increases for the shorter bands 442–490 nm (APD = 25.7 and 54.2%) and the longest NIR band (APD = 135.0%), showing in all cases a positive bias. Root mean square differences are also lower for bands between 492 and 707 nm (RMSD = 0.011–0.016) and higher scatter is found for the first (444 nm) and the last (866 nm) bands (RMSD = 0.022 and 0.025).
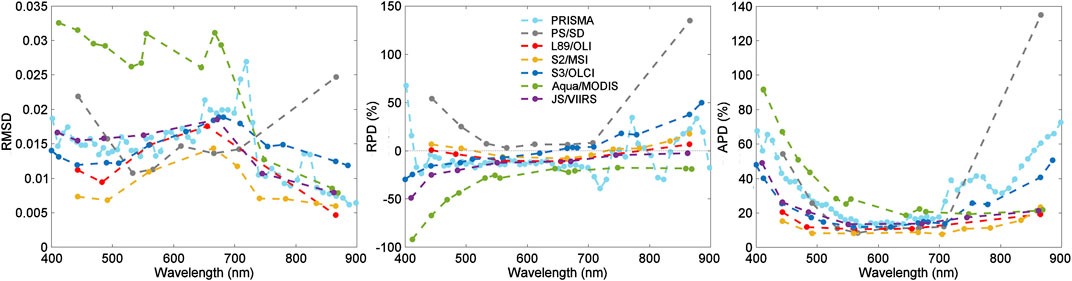
Figure 11. Spectra of RMSD (left), RPD (centre) and APD (right) for the different satellite-sensors evaluated: PS/SD (grey), L89/OLI (red), S2/MSI (orange), S3/OLCI (blue), Aqua/MODIS (green), JS/VIIRS (violet), and PRISMA (light blue).
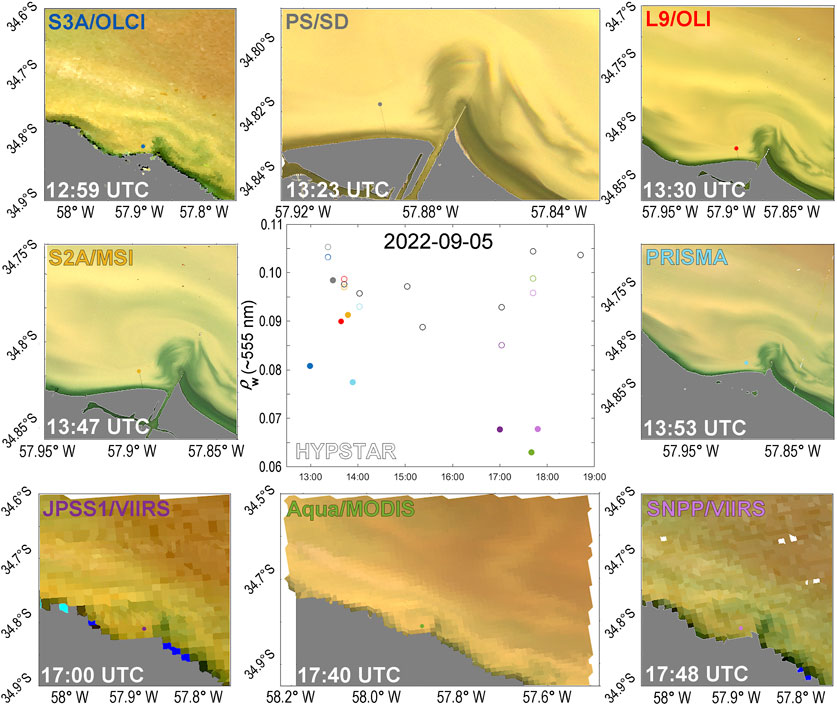
Figure 12. Example of matchups between eight sensors (circles) and HYPSTAR in situ (open circles) reflectance data at ∼555 nm on 2022-09-05 (centre). RGB images from: S3A/OLCI at 12:59 UTC, PS/SD at 13:23UTC, L9/OLI 13:30 UTC, S2A/MSI 13:47 UTC, PRISMA 13:53 UTC, JPSS1/VIIRS 17:00 UTC, Aqua/MODIS 17:40 UTC, SNPP/VIIRS 17:48 UTC. The coloured coded circles on the RGB composites show the reference location use for the matchup.
4 Discussion
4.1 Spatial homogeneity
The quality of the match-ups at a test site will depend on how representative is the point radiometric measurement at the site compared to the satellite pixel of a given size. This will depend the spatial homogeneity of the water and also on the proximity of the site to land (possible mixed pixels or spatial straylight). Different strategies/solutions to address this problem have been proposed, like manually shifting the extraction window to avoid the influence of the structure (Vanhellemont, 2019) or to extract a large pixel window and discard the central pixels to minimize platform contamination (Ilori et al., 2019). For more examples see Table 3 in Concha et al. (2021). In the present study a different and more objective strategy is proposed. High spatial resolution imagery was used to evaluate the spatial variability (homogeneity) and the closeness to land at different length scales in order to select the location of a reference pixel as a function of sensor spatial resolution. Matchup statistics improved when extracting satellite information using the reference pixel location compared to the exact location of the radiometer (Supplementary Figure S13)
4.2 Water reflectance standard product performance
For the eight band SuperDoves satellites, 54 matchups from 44 unique satellites have been obtained showing high consistency for all 44 different satellites. Match-up results obtained in this study were similar to the ones obtained for the turbid waters of the Belgian Coastal Zone (Vanhellemont, 2023), i.e., low relative errors between 566 and 707 nm (APD = 8.4–12%) and larger relative differences (APD = 25–134%) in the blue (444 nm) and NIR (866 nm) bands, but reaching lower and higher values than in the BCZ, with APD = 15–20% and APD = 30–99.4%, respectively. The general overestimation found in this study could be related, as suggested in Vanhellemont (2023), to the use of ancillary (not from image) aerosol optical thickness that could be biased low, especially for the blue band, and due to not corrected sun glint.
Even though L89/OLI and S2/MSI standard L2 products use land remote sensing algorithms for the atmospheric correction, they showed better results compared to the other systems and considering all bands together (Figure 9). Similar results have been found in other turbid waters. Kuhn et al. (2019) found that L8 standard land surface reflectance product had the best performance in the highly scattering (turbid) waters of the Lower Amazon river, with median APD of 4%–17% and RMSD 0.003–0.0157 across the spectrum and varying on the tidal condition (high or low water) of the river. Li et al. (2023) also showed good results for S2 images over turbid waters using Sen2Cor. For turbid waters, aerosol reflectance contributes relatively less to the top of atmosphere signal. A crude aerosol correction can therefore be sufficient and is more robust than typical extrapolative algorithms for aerosol correction.
It is common that nadir-viewing sensors, like L89/OLI, S2/MSI and PS/SD, are frequently affected by sun glint on the air water interface (Vanhellemont, 2019; Lavigne et al., 2023). Given that standard land approaches do not correct for this additional contribution of scattered light to the satellite observed signal, in this study a simple mask using a threshold on water reflectance in the SWIR was applied for L89/OLI and S2/MSI imagery. Even if it is not a correction, a simple masking greatly improved the statistics, evidencing the importance of either correcting or avoiding sun glint contaminated images. The same masking could not be performed to PS/SD imagery because they lack SWIR bands. Glint removal methods have been developed in alternative aquatic atmospheric correction approaches (Harmel et al., 2018; Vanhellemont, 2019) showing improved S2 and L8 retrievals (Vanhellemont, 2020; Maciel et al., 2022), but solutions for sun glint correction of sensors without SWIR bands are still needed (Lavigne et al., 2023).
Matchup results obtained here for MODIS and VIIRS sensors are in agreement with previous comparisons made in the turbid waters of Río de la Plata for both MODIS and VIIRS instruments using the WG94-SWIR atmospheric correction (Dogliotti et al., 2014; Gossn et al., 2021). Namely, retrievals tend to underestimate water reflectance at all wavelengths with increasing differences and scatter from the near infrared to the shortest blue bands, frequently retrieving negative water reflectance, evidencing an overcorrection of the reflectance in visible bands probably due to overestimation of the aerosol component.
The spectral shape of PRISMA water reflectance resembled that of the HYPSTAR® in situ measurements, but a general underestimation was found for the whole spectra except at one date. It has already been found that the PRISMA L2 standard product has better performance in more turbid and productive waters (like the Trasimeno Lake) compared to more clear waters and slightly influenced by suspended particles, like the Venice lagoon at Aqua Alta Oceanographic Tower (Braga et al., 2022). Even though Trasimeno Lake and Río de la Plata have different optical characteristics, similar statistics have been found considering all bands together with high correlation (R2 = 0.82) and scatter (APD∼32%).
The current protocol used to process HYPSTAR data is based on the standard protocol generally used to process above-water measurements, i.e., it uses measurements of the upwelling radiance from the water (Lu) and downwelling sky radiance (Lsky) and an external source for wind speed data to estimate the estimate the air-water interface reflectance factor using Cox–Munk wave-slope statistics (Mobley, 1999). In the case of HYPERNETS, wind is obtained either from NCEP/GDAS or fixed to 2 m/s, if the former is not available (De Vis et al. submitted this same Frontiers Research Topic). Even if a fixed wind speed might be more appropriate to use at LPAR because waves will be fetch-limited, using either modelled or fixed wind speed can lead to errors if they defer from the actual wind speed at the moment of the measurement. In a recent revision of the AERONET-OC Lw uncertainties, Cazzaniga and Zibordi (2023) found that the largest contribution to uncertainties was the sea surface reflectance factor ρF which was mainly explained by the uncertainties in wind speed estimation. Analyzing data from six AERONET-OC sites they found median relative uncertainties ranging from 3.2% to 4.3%. In turn, using HYPSTAR data from Blankaart reservoir, Goyens and Ruddick (2023) calculated that errors on ρw in the blue and NIR can reach up to 75% and 50%, respectively, when wind speed is overestimated by 2 m/s in clear waters, but reaching lowers errors in more turbid waters (up to 25%). This is because the error on water reflectance due to errors in wind speed is an absolute error, i.e., independent of water reflectance, and thus the percentage error is inversely proportional to water reflectance. This is encouraging considering that sediment-rich turbid waters are usually found at LPAR site. However, further analysis on the error introduced by using a fixed or modelled wind speed value is needed and will be assessed when in situ wind speed will be available, a meteorological station is planned to be deployed at LPAR site this year.
5 Conclusion
In this study, the first fixed automated hyperspectral system deployed in South America is described and the natural spatial variability of water reflectance around the site is characterized using high spatial resolution imagery. A methodology is proposed to objectively select a sensor-specific location of a reference pixel for satellite validation.
The water reflectance data collected during the first six operating months after deployment are used to evaluate the performance of operational level-2 products of many optical VSWIR satellite missions with different band sets and widths, from the multispectral metre scale 8-band SuperDoves, the medium S3/OLCI and low spatial resolution VIIRS and MODIS sensors, to the hyperspectral PRISMA sensor. It is shown that in these highly turbid waters, standard level-2 that uses land-based atmospheric correction approaches work reasonable well provided that sun glint contamination is avoided. The S2/MSI and L89/OLI high spatial resolution sensors showed the best results with low absolute percentage difference (APD∼10%) and slight understimation in the bands with the highest water reflectance, i.e., bands between 490 and 704 nm. PS/SD also showed low errors in this spectral region (RPD <10%), but increased overestimation and absolute relative difference in the shorter (blue) and longer (NIR) bands (APD>100%). In general performance decreased for the shorter wavebands for all systems, evidencing the need to improve the atmospheric correction in these challenging turbid waters for these approaches that relay on the extrapolation of the atmospheric path reflectance from the longer to the shorter bands. Finally, the mid-to low-spatial resolution VIIRS and MODIS imagery using the assumption of black pixel in the SWIR, showed the worst performance with a general underestimation of the reflectance across the whole spectra, increasing the difference from the longer (RPD ∼ −20%) to the shorter wavelengths (RPD ∼ −100%).
This work shows the power and the great potential of the HYPERNETS hyperspectral automated system to provide, on a routine basis, high quality and quantity of data for validation of satellite data at all wavelengths in a multi-mission perspective, fundamental in a context of massive and constantly growing Earth observing missions. As an example, in just 1 day level-2 products from eight missions could be evaluated at the LPAR site (Figure 12). These range from the typical “ocean colour” missions, like Aqua/MODIS and S3/OLCI, to “land” missions, like S2/MSI and L89/OLI that are used for coastal and inland waters applications, to the existing and planned hyperspectral missions, like PRISMA, ENMAP and future PACE, as well as geostationary GOCI and future GLIMR missions that provide information at high temporal resolution. Moreover, LPAR as well as other HYPERNETS sites are part the WATERHYPERNET international network (Ruddick et al., 2022; 2024 submitted this same Frontiers Research Topic), which are currently collecting data in very different optical water types in different regions of the world thus generating invaluable standardized radiometric data for satellite validation.
Data availability statement
The datasets presented in this study can be found in online repositories. The names of the repository/repositories and accession number(s) can be found below: https://doi.org/10.5281/zenodo.8048425.
Author contributions
AD: Conceptualization, Data curation, Formal Analysis, Funding acquisition, Investigation, Methodology, Project administration, Validation, Visualization, Writing–original draft, Writing–review and editing. EP: Investigation, Methodology, Resources, Writing–review and editing. LR: Investigation, Methodology, Resources, Software, Writing–review and editing. PP: Investigation, Methodology, Resources, Software, Writing–review and editing. KR: Funding acquisition, Investigation, Project administration, Resources, Supervision, Writing–review and editing.
Funding
The author(s) declare financial support was received for the research, authorship, and/or publication of this article. This study has been carried out in the context of HYPERNETS project funded by the European Union’s Horizon 2020 research and innovation programme (Grant agreement n◦ 775983). Field campaigns and data processing were co-funded by the ANPCyT (PICT-2020/2636) and PIDT-PA-2020/B8 Pampa Azul (MiNCyT) projects.
Acknowledgments
Planet is thanked for research access to SuperDove data. NASA/USGS and ESA/EUMETSAT Copernicus are thanked for the acquisition and free distribution of Landsat and Sentinel-2 and Sentinel-3 images. NASA and NOAA are thanked for the acquisition and free distribution of MODIS and VIIRS imagery. The Italian Space Agency is thanked for the acquisition and distribution of PRISMA data. The Escuela Naval Militar (EsNM) and Servicio de Hidrografia Naval (SHN) are thanked for permission and access to the LPAR platform and installation support. Fabricio Idoeta, Javier Pardiñas, and Ubaldo Hereñú are thanked for the logistics and technical support. HYPERNETS colleagues: Joel Kuusk, Alexander Corizi, Clémence Goyens, and Pieter de Vis are gratefully thanked for developing the radiometer, system, processor, and general support.
Conflict of interest
The authors declare that the research was conducted in the absence of any commercial or financial relationships that could be construed as a potential conflict of interest.
Publisher’s note
All claims expressed in this article are solely those of the authors and do not necessarily represent those of their affiliated organizations, or those of the publisher, the editors and the reviewers. Any product that may be evaluated in this article, or claim that may be made by its manufacturer, is not guaranteed or endorsed by the publisher.
Supplementary material
The Supplementary Material for this article can be found online at: https://www.frontiersin.org/articles/10.3389/frsen.2024.1354662/full#supplementary-material
References
ASI – Italian Space Agency, (2021). PRISMA algorithm theoretical basis document (ATBD), issue 1. http://prisma.asi.it/missionselect/docs.php (Accessed March 3, 2023).Date 14/12/2021.
Aubriot, L., Zabaleta, B., Bordet, F., Sienra, D., Risso, J., Achkar, M., et al. (2020). Assessing the origin of a massive cyanobacterial bloom in the Río de la Plata (2019): towards an early warning system. Water Res. 181, 115944. doi:10.1016/j.watres.2020.115944
Bailey, S. W., and Werdell, P. J. (2006). A multi-sensor approach for the on-orbit validation of ocean color satellite data products. Remote Sens. Environ. 102, 12–23. doi:10.1016/j.rse.2006.01.015
Braga, F., Fabbretto, A., Vanhellemont, Q., Bresciani, M., Giardino, C., Scarpa, G. M., et al. (2022). Assessment of PRISMA water reflectance using autonomous hyperspectral radiometry. ISPRS J. Photogramm. Remote Sens. 192, 99–114. doi:10.1016/j.isprsjprs.2022.08.009
Cazzaniga, I., and Zibordi, G. (2023). AERONET-OC LWN uncertainties: revisited. J. Atmos. Ocean. Tech. 40, 411–425. doi:10.1175/jtech-d-22-0061.1
Collison, A., Jumpasut, A., and Bourne, H. (2022). On-orbit radiometric calibration of the Planet satellite fleet. Planet Labs PBC. https://assets.planet.com/docs/radiometric_calibration_white_paper.pdf (Accessed November 14, 2023).
Concha, J., Bracaglia, M., and Brando, V. (2021). Assessing the influence of different validation protocols on Ocean Colour match-up analyses. Remote Sens. Environ. 259, 112415. doi:10.1016/j.rse.2021.112415
De León, L., and Yunes, J. (2001). First report of a microcystin-containing bloom of the cyanobacterium Microcystis aeruginosa in the La Plata River, South America. Environ. Toxicol. Water Qual. 16, 110–112. doi:10.1002/1522-7278(2001)16:1<110::aid-tox1012>3.3.co;2-q
De Vis, P., Goyens, C., Hunt, S., Quinten Vanhellemont, Q., Ruddick, K., and Bialek, A., Generating hyperspectral reference measurements for surface reflectance from the LANDHYPERNET and WATERHYPERNET networks. Submitt. this Special Issue Front. Remote Sens.
Dogliotti, A. I., Ruddick, K., Nechad, B., and Lasta, C. (2011). “Improving water reflectance retrieval from MODIS imagery in the highly turbid waters of La Plata River,” in Proceedings of VI International Conference “Current problems in optics of natural waters” (ONW’2011), Saint-Petersburg, Russia (Publishing House “Nauka” of RAS), 152.6-10 September, 2011
Dogliotti, A. I., O’Farrel, I., Yema, L., and Merlo, R. (2023). Validation of Sentinel-2/MSI water reflectance and water quality products in the turbid waters of Río de la Plata estuary using fixed automated hyperspectral in situ observations. Proceedings of SPIE, the International Society for Optical Engineering, 12728-1.
Dogliotti, A. I., Camiolo, M., Simionato, C., Jaureguizar, A., Guerrero, R., and Lasta, C. (2014). “First optical observations in the turbidity maximum zone in the Río de la Plata estuary: A challenge for atmospheric correction algorithms,” in. Proceeding of Ocean Optics XXII Conference. Portland: United States of America.
Dogliotti, A. I., Gossn, J. I., Gonzalez, C., Yema, L., Sanchez, L., and O’Farrell, L. (2021). “Evaluation of multi- and hyper-spectral Chl-a algorithms in the Río de la Plata turbid waters during a cyanobacteria bloom,” in 2021 IEEE International Geoscience and Remote Sensing Symposium IGARSS, 7442–7445. doi:10.1109/IGARSS47720.2021
Eumetsat, (2021). Sentinel-3 OLCI L2 report for baseline collection OL_L2M_003- EUM/RSP/REP/21/1211386. Available at: https://www.eumetsat.int/media/47794 (Accessed October 20, 2023).
Eumetsat, (2022). Recommendations for sentinel-3 OLCI Ocean Colour product validations in comparison with in situ measurements – matchup protocols. Available at: https://www.eumetsat.int/media/44087 (Accessed October 20, 2023).
Franz, B. A., Kwiatkowska, E. J., Meister, G., and McClain, C. R. (2008). Moderate resolution imaging spectroradiometer on Terra: limitations for ocean color applications. J. Appl. Remote Sens. 2, 023525. doi:10.1117/1.2957964
García-Alonso, J., Lercari, D., and Defeo, O. (2019). “R_ıo de la Plata: a neotropical Estuarine system,” in Coasts and estuaries. Editors E. Wolanski, J. W. Day, M. Elliott, and R. Ramachandran (Amsterdam: Elsevier), 45–56.Chap. 3
Gordon, H. R., and Wang, M. (1994). Retrieval ofWater-leaving radiance and aerosol optical thickness over the oceans with SeaWIFS: a preliminary algorithm. Appl. Opt. 33, 443–452. doi:10.1364/ao.33.000443
Gossn, J. I., Frouin, R., and Dogliotti, A. I. (2021). Atmospheric correction of satellite optical imagery over the Río de la Plata highly turbid waters using a SWIR-based principal component decomposition technique. Remote Sens. 13 (6), 1050. doi:10.3390/rs13061050
Gossn, J. I., Ruddick, K. G., and Dogliotti, A. I. (2019). Atmospheric correction of OLCI imagery over extremely turbid waters based on red, NIR and 1016nm bands and a new baseline residual technique. Remote Sens. 11 (220), 1–24. doi:10.3390/rs11030220
Goyens, C., Lavigne, H., Dille, A., and Vervaeren, H. (2022). Using hyperspectral remote sensing to monitor water quality in drinking water reservoirs. Remote Sens. 14 (21), 5607. doi:10.3390/rs14215607
Goyens, C., and Ruddick, K. (2023). Improving the standard protocol for above-water reflectance measurements: 1. Estimating effective wind speed from angular variation of sunglint. Appl. Opt. 62 (February), 2442. doi:10.1364/AO.481787
Harmel, T., Chami, M., Tormos, T., Reynaud, N., and Danis, P.-A. (2018). Sunglint correction of the Multi-Spectral Instrument (MSI)-SENTINEL-2 imagery over inland and sea waters from SWIR bands. Remote. Sens. Environ. 204, 308–321. doi:10.1016/j.rse.2017.10.022
Ilori, O. C., Pahlevan, N., and Knudby, A. (2019). Analyzing performances of different atmospheric correction techniques for Landsat 8: application for coastal remote sensing. Remote Sens. 11, 469. doi:10.3390/rs11040469
IOCCG, (2018). “Earth observations in support of global water quality monitoring,” in IOCCG Report Series, No. 17. Editors S. Greb, A. Dekker, and C. Binding (Dartmouth, Canada: International Ocean Colour Coordinating Group), 17, 125.
Kruk, C., Martíınez, A., Martíınez de la Escalera, G., Trinchin, R., Manta, G., Segura, A. M., et al. (2021). Rapid freshwater discharge on the coastal ocean as a mean of long distance spreading of an unprecedented toxic cyanobacteria bloom. Sci. Total Environ. 754, 142362. doi:10.1016/j.scitotenv.2020.142362
Kuhn, C., de Matos Valerio, A., Ward, N., Loken, L., Oliveira Sawakuchi, H., Kampel, M., et al. (2019). Performance of landsat-8 and sentinel-2 surface reflectance products for river remote sensing retrievals of chlorophyll-a and turbidity. Remote Sens. Environ. 224, 104–118. doi:10.1016/j.rse.2019.01.023
Kuusk, J., Corizzi, A., Doxaran, D., Duong, K., Flight, K., Kivastik, J., et al. HYPSTAR: a hyperspectral pointable system for terrestrial and aquatic radiometry. Front. remote sens.
Lavigne, H., Vanhellemont, Q., Ruddick, K., and Vansteenwegen, D. (2023). Turbid water sun glint removal for high resolution sensors without SWIR. Proc. SPIE 12728, Remote Sens. Ocean, Sea Ice, Coast. Waters, Large Water Regions 2023, 1272804. doi:10.1117/12.268391217 October
Li, J., Yin, Z., Lu, Z., Ye, Y., Zhang, F., Shen, Q., et al. (2019). Regional vicarious calibration of the SWIR-based atmospheric correction approach for MODIS-aqua measurements of highly turbid inland water. Remote Sens. 11, 1670. doi:10.3390/rs11141670
Li, W., Huang, Y., Shen, Q., Yao, Y., Xu, W., Shi, J., et al. (2023). Assessment of seven atmospheric correction processors for the sentinel-2 multi-spectral imager over lakes in qinghai province. Remote Sens. 2023 (15), 5370. doi:10.3390/rs15225370
Maciel, F. P., and Pedocchi, F. (2022). Evaluation of ACOLITE atmospheric correction methods for Landsat-8 and Sentinel-2 in the Rıo de la Plata turbid coastal waters. Inter J. Remote Sens. 43 (1), 215–240. doi:10.1080/01431161.2021.2009149
Mobley, C. D. (1999). Estimation of the remote-sensing reflectance from above-surface measurements. Appl. Opt. 38, 7442–7455. doi:10.1364/ao.38.007442
Mumby, P. J., Green, E. P., Edwards, A. J., and Clark, C. D. (1999). The cost-effectiveness of remote sensing for tropical coastal resources assessment and management. J. Environ. Manag. 55 (3), 157–166. doi:10.1006/jema.1998.0255
Nagy, G. J., Gomez-Erache, M., L_opez, C. H., and Perdomo, A. C. (2002). “Distribution patterns of nutrients and symptoms of eutrophication in the Rio de la Plata River Estuary system,” in Nutrients and eutrophication in estuaries and coastal waters. Developments in hydrobiology. Editors E. Orive, M. Elliott, and V. N. de Jonge (Dordrecht, Netherlands: Springer), 164, 125–139.
National Centers for Environmental Prediction, National Weather Service, Noaa, U.S. Department of Commerce, (2015). Ncep gdas/fnl 0.25 degree global tropospheric analyses and forecast grids. National Centers for Environmental Prediction, National Weather Service, Noaa, U.S. Department of Commerce. Maryland, MD, USA.
Planet, (2022). Planet: Planet imagery product specifications. https://assets.planet.com/docs/Planet_Combined_Imagery_Product_Specs_letter_screen.pdf.
Prisma, (2020). PRISMA products specification. Available online: http://prisma.asi.it/missionselect/docs/PRISMA%20Product%20Specifications_Is2_3.pdf (Accessed on November 20, 2023).
Ruddick, K., Brando, V. E., Corizzi, A., Dogliotti, A. I., Doxaran, D., and Goyens, C., WATERHYPERNET: a prototype network of automated in situ measurements of hyperspectral water reflectance for satellite validation and water quality monitoring. Front. Remote Sens.
Ruddick, K. G., De Vis, P., Goyens, C., Kuusk, J., Lavigne, H., and Vanhellemont, Q. (2023). Second derivative water reflectance spectra for phytoplankton species detection: origin, impact, and removal of spectral wiggles. Proc. SPIE 12728, Remote Sens. Ocean, Sea Ice, Coast. Waters, Large Water Regions 2023, 127280A. doi:10.1117/12.268433617 October
Sathicq, M., Gómez, N., Andrinolo, D., Sedán, D., and Donadelli, J. (2014). Temporal distribution of cyanobacteria in the coast of a shallow temperate estuary (Río de la Plata): some implications for its monitoring. Environ. Monit. Assess. 186 (11), 7115–7125.
Shi, W., and Wang, M. (2009). An assessment of the black ocean pixel assumption for MODIS SWIR bands. Remote Sens. Environ. 113 (2009), 1587–1597. doi:10.1016/j.rse.2009.03.011
Vanhellemont, Q. (2019). Adaptation of the dark spectrum fitting atmospheric correction for aquatic applications of the Landsat and sentinel-2 archives. Remote Sens. Environ. 1197 (225), 175–192. doi:10.1016/j.rse.2019.03.010
Vanhellemont, Q. (2020). Sensitivity analysis of the dark spectrum fitting atmospheric correction for metre-and decametrescale satellite imagery using autonomous hyperspectral radiometry. Opt. Express 28 (20), 29948–29965. doi:10.1364/oe.3974562020
Vanhellemont, Q. (2023). Evaluation of eight band SuperDove imagery for aquatic applications. Opt. Express 31 (9), 13851. doi:10.1364/oe.48341824 Apr 2023
Zibordi, G., Holben, B. N., Talone, M., D’Alimonte, D., Slutsker, I., Giles, D. M., et al. (2020). Advances in the Ocean color component of the aerosol robotic network (AERONET-OC). J. Atmos. Ocean. Technol. 38, 725–746. doi:10.1175/jtech-d-20-0085.1
Zibordi, G., Kwiatkowska, E., Mélin, F., Talone, M., Cazzaniga, I., Dessailly, D., et al. (2022). Assessment of OLCI-A and OLCI-B radiometric data products across European seas. Remote Sens. Environ. 272, 112911. doi:10.1016/j.rse.2022.112911
Keywords: ocean colour, satellite validation, hyperspectral reflectance, autonomous system, Río de la Plata, turbid waters, LPAR
Citation: Dogliotti AI, Piegari E, Rubinstein L, Perna P and Ruddick KG (2024) Using the automated HYPERNETS hyperspectral system for multi-mission satellite ocean colour validation in the Río de la Plata, accounting for different spatial resolutions. Front. Remote Sens. 5:1354662. doi: 10.3389/frsen.2024.1354662
Received: 12 December 2023; Accepted: 12 March 2024;
Published: 22 March 2024.
Edited by:
Wenhan Qin, Science Systems and Applications, Inc., United StatesReviewed by:
Peter Gege, German Aerospace Center (DLR), GermanySamantha Jane Lavender, Pixalytics Ltd, United Kingdom
Copyright © 2024 Dogliotti, Piegari, Rubinstein, Perna and Ruddick. This is an open-access article distributed under the terms of the Creative Commons Attribution License (CC BY). The use, distribution or reproduction in other forums is permitted, provided the original author(s) and the copyright owner(s) are credited and that the original publication in this journal is cited, in accordance with accepted academic practice. No use, distribution or reproduction is permitted which does not comply with these terms.
*Correspondence: Ana I. Dogliotti, adogliotti@conicet.gov.ar