The Influence of pH on the Lipase Digestion of Nanosized Triolein, Diolein and Monoolein Films
 Ben A. Humphreys1,2,3*
  José Campos-Terán3,4 Thomas Arnold5,6,7
  Lone Baunsgaard8
  Jesper Vind8
  Cedric Dicko3,9
  Tommy Nylander1,2,3
- 1Department of Chemistry, Physical Chemistry, Lund University, Lund, Sweden
- 2NanoLund, Lund University, Lund, Sweden
- 3Lund Institute of Advanced Neutron and X-ray Science—LINXS, Lund, Sweden
- 4Departamento de Procesos y Tecnología, Universidad Autónoma Metropolitana-Cuajimalpa, Mexico City, Mexico
- 5European Spallation Source ERIC, Lund, Sweden
- 6ISIS Pulsed Neutron and Muon Source, STFC, Harwell Science and Innovation Campus, Didcot, United Kingdom
- 7Department of Chemistry, University of Bath, Bath, United Kingdom
- 8Novozymes A/S, Copenhagen, Denmark
- 9Department of Chemistry, Pure and Applied Biochemistry, Lund University, Lund, Sweden
Herein we studied the processes at the liquid aqueous interface at pH 7 and 8.5 during Thermomyces lanuginosus lipase-catalyzed hydrolysis of nanosized tri-, di- and mono-olein films deposited on a planar substrate. By employing a combination of ellipsometry, QCM-D and ATR-FTIR, we were able to reveal the physical properties of the thin films at high time resolution throughout the initial hydration and subsequent digestion, as well as the main chemical species present before and after lipolysis. The ATR-FTIR results showed that the degree of digestion and protonated state of the oleic acid produced in the reaction are highly dependent on the pH of the aqueous solvent. Furthermore, the ellipsometry and QCM-D results reveal that the duration of the lag phase observed before lipolysis was detected and the magnitude and type of changes to the physical properties of the thin films throughout digestion was influenced by whether the initial substrate consisted of tri-, di- or mono-olein.
1 Introduction
Triglycerides are an essential dietary requirement that play a critical role in energy supply and are a major component in body fat and vegetable oils (Freedman et al., 1984). In industrial and biological processes such as pharmaceutical manufacturing and food formulations, these lipids are often in direct contact with an aqueous environment. While there have been significant advances in the understanding of the changes in the self-assembled, liquid crystalline phase structure during the lipolysis of emulsified lipid assemblies (Borné et al., 2002a; Borné et al., 2002b; Caboi et al., 2002; Salentinig et al., 2010; Salentinig et al., 2011; Warren et al., 2011; Khay Fong et al., 2014; Wadsäter et al., 2014; Salentinig et al., 2015a; Barauskas et al., 2016; Filipe et al., 2021), the structural nature of the oil/water interface, and how it changes during lipolysis has received relatively little attention. Consequently, studying model-thin lipid films upon exposure to an aqueous environment is of fundamental importance as it allows biological processes, such as the action of lipases, to be better understood. Although the lipase-catalyzed hydrolysis of thin triglyceride films has previously been investigated (Snabe and Petersen, 2003; Stamm et al., 2018), the influence of the reaction products such as glycerol, mono- and diglycerides, and free fatty acids (or their salts) on this process is less understood.
Lipases are a unique subset of the esterase family that exhibit very low activity for monomeric water-soluble substrates. In contrast, they are highly active at the lipid-water interfaces such as the surface of a thin glyceride film exposed to an aqueous solvent (Schmid and Verger, 1998; Singh and Mukhopadhyay, 2012; Bohr et al., 2019; Moses et al., 2021). The phenomenon where lipase activation occurs at an interface is referred to as interfacial activation; a term first introduced by Sarda and Desnuelle in 1958 (Sarda and Desnuelle, 1958). Studies have since revealed that interfacial activation is directly related to the molecular orientation of the lipase where the active site and binding region are directed towards the substrate triggering a molecular conformational “lid opening” change in structure (Brzozowski et al., 1991; Schmid and Verger, 1998; Brzozowski et al., 2000; Muth et al., 2017; Willems et al., 2018). Another phenomenon often associated with lipase-catalyzed hydrolysis is an initial period where very little activity is observed, i.e., a lag phase. There are several theories reportedly responsible for this observed lag phase. These include the slow adsorption of lipase at the interface (Verger, 1997), or the requirement of a certain amount of hydrolysis products to be accessible within the lipid phase before optimal lipase activity is observed (Nielsen et al., 1999). Snabe and Petersen have also observed that the lag phase is related to the delayed release of the lipolysis products from the lipid phase to the aqueous phase, therefore highly dependent on the solvent pH and composition (Snabe and Petersen, 2003).
Lipases including Thermomyces lanuginosus, Rhizopus delemar, Candida rugosa, Rhizomucur miehei, and Candida antarctica A and B have gained significant industrial interest as biocatalysts (Schmid and Verger, 1998; Fernandez-Lafuente, 2010; Filipe et al., 2021; Moses et al., 2021). Not only do lipases catalyze the hydrolysis of triglycerides, a process that is extremely useful in detergents, but the reaction products such as free fatty acids (or fatty acid salts), partial glycerides and glycerol are essential for the food and cosmetics industry (Intarakumhaeng et al., 2018). However, a major challenge hampering the further industrial utilization of lipases is the self-limiting effect of the lipolytic reaction where the products often have low solubility. Further, the products can be highly surface-active and, in this way, also impede enzymatic conversion (Reis et al., 2008a; Reis et al., 2008b; Reis P. M. et al., 2008; Reis et al., 2009b; Reis et al., 2010; Muth et al., 2017). Although achieving the desired yields and preventing a progressive decline in the reaction rate is possible, this often requires additional dispersion agents such surfactants or sequestering agents like β-cyclodextrin to remove the inhibitive surface-active products from the interface (Ivanova et al., 2004). A greater understanding of the lipase directed digestion of triglycerides with a particular focus on the identity and location of intermediate products may assist in creating alternative methods to enhance yields without relying on additional reactants.
Thermomyces lanuginosus lipase (TLL) is a selective lipase that targets the Sn-1 and 3 positions of triglycerides. The Sn-2 monoglyceride produced in this reaction, however, is kinetically less stable than the Sn-1 and 3 isomers, and over time acyl migration can lead to the complete triglyceride digestion, i.e., only glycerol and fatty acids/salts remain (Murgia et al., 2002; Laszlo et al., 2008; Salentinig et al., 2015b). Previous studies have shown that the pH of the aqueous TLL solution can influence the extent of triglyceride digestion (Snabe and Petersen, 2003; Snabe et al., 2005). The solution pH determines the protonation state of all species present, not only influencing the interactions between species but also the surface charge at the oil/water interface (Muth et al., 2017). Although the
In this study, we use spectroscopic ellipsometry (S.E.), quartz crystal microbalance with dissipation (QCM-D) and attenuated total reflectance Fourier-transform infrared spectroscopy (ATR-FTIR) to reveal the physical and chemical changes that occur at the aqueous-triolein interface. The thin film was first exposed to an aqueous TRIS buffer at pH 7 or 8.5 until equilibration was achieved. Once equilibrated, the hydrated film was exposed to 2 ppm TLL with the lipolysis monitored for several hours. The pH values of 7 and 8.5 were chosen to be above the isoelectric point of TLL, but on either side of the
2 Materials and Methods
2.1 Materials
Hydrophilic, polished, and thermally oxidized silicon wafers were purchased from Siltronix, Archamps-France. QCM sensors with silicon oxide coating (Q-Sense, QSX 303, ∼4.95 MHz fundamental frequency) were purchased from Biolin Scientific. Solvenco supplied ethanol (99.5%). HCl (37%), H2O2 (30% (w/w)) and CaCl2·2H2O (>99%) were purchased from Merck. TRIS base (≥99.9%) was purchased from Sigma, and Honeywell Burdick and Jackson supplied NH4OH (25%). Polystyrene (PS) with an average M.W. of 280,000 g mol−1 (supplied as pellets) was purchased from Aldrich. Monoolein (mono- and diglycerides ratio 44:1 by weight), denoted as RYLO™ MG19 Glycerol Monooleate (GMO), was produced and provided by Danisco Ingredients (now Dupont, Brabrand, Denmark) with the following fatty acid composition (Lot No. 2119/65–1): 89.3% oleic, 4.6% linoleic, 3.4% stearic and 2.7% palmitic acid. Diolein (unspecified isomer) (>99%) and triolein (>99%) were purchased from Larodan AB (Sweden). Wild type Thermomyces lanuginosus lipase (TLL) at a concentration of 2,500 ppm was kindly provided by Novozymes (Denmark). The activity of the TLL sample used throughout this study was 100 kLU·mL where 1 LU was the amount of enzyme activity which liberates 1 µmol of titratable butyric acid from the substrate glycerol tributyrate per minute under standard conditions. TLL and the lipids were stored at −20°C until used. Toluene (99.8%) (from Sigma-Aldrich) and n-hexane (≥99%) (from Merck) were dried over 4 Å molecular sieves (Riedel-de Haën) for at least 1 day before use. Water obtained from a Milli-Q system (Merck Millipore, 18.2 MΩ cm at 25°C) was used throughout. All reagents were used as received unless stated otherwise. A buffer solution prepared with 100 mM TRIS base and 1 mM CaCl2 was used for all experiments with the pH adjusted to pH 7 or 8.5 using ∼12 M HCl. From here on, this will be referred to as pH 7 buffer or pH 8.5 buffer. The lipase solutions were prepared at a concentration of 2 ppm TLL, which enabled the kinetics of the digestion to be sufficiently slow to be followed throughout the experiments and is consistent with our previous studies (Stamm et al., 2018). Buffer solutions were stored at 4°C until required and used within 1 week of preparation.
2.2 Substrate Preparation
The silicon wafers and QCM sensors were thoroughly cleaned before starting the experiments with a detailed protocol provided in the Supplementary Material. A PS layer was added to the cleaned silicon wafer or QCM sensor using a LabSpin Spin Coater (Suss Micro Tec Lithography GmbH). The PS layer was required to modify the substrate’s surface energy, which increased the stability of the meta-stable lipid film (Vazquez et al., 2006). 1 wt% PS in toluene solution was added onto the silicon oxide substrate while spinning at 6000 RPM for 30 s. The lipid layer was then spin-coated onto the PS film by injecting a 1 wt% lipid in hexane solution onto the PS layer while spinning at 6000 RPM for 30 s. 20 μl of the PS and lipid solutions were required for the silicon wafers, while 30 μl was needed for the larger QCM sensors. The dry thickness of the silicon oxide, PS and lipid layers were sequentially measured in air at each step using Spectroscopic Ellipsometry (S.E.) (see Section 2.3) with the values presented in Table 1. The ATR-FTIR samples were prepared by spin coating 20 μl of 50 wt% lipids in hexane solution directly onto the diamond crystal while spinning at 1,000 rpm. Although the dry thickness of the ATR-FTIR lipid films on the diamond crystal could not be measured directly, they were assumed to be ∼200–300 nm as the intensity of the carbonyl ester peak at 1745 cm−1 was similar to results previously reported for a triolein film of this thickness (Snabe and Petersen, 2003).
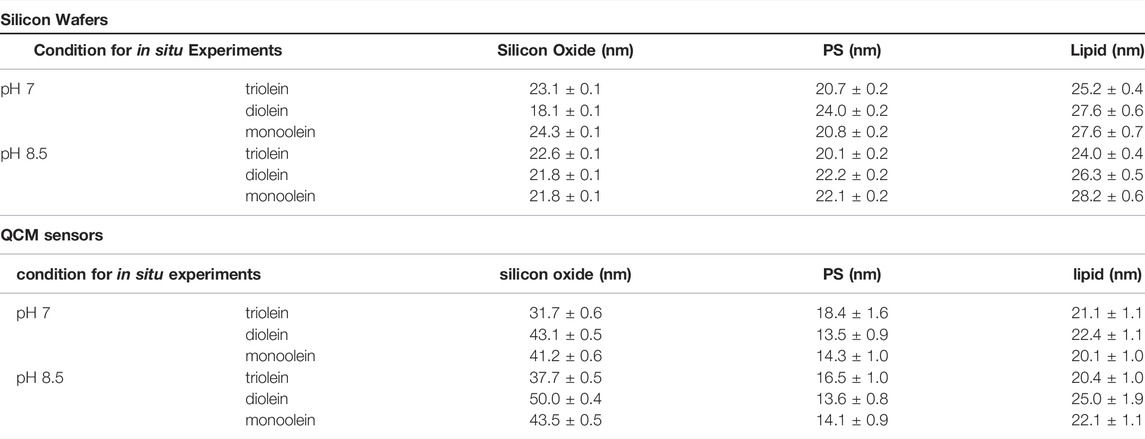
TABLE 1. Summary of dry thicknesses for silicon oxide layer, PS and lipid films measured via spectroscopic ellipsometry for silicon wafers and QCM sensors in air.
2.3 Spectroscopic Ellipsometry
A UVISEL spectroscopic ellipsometer (HORIBA Jobin Yvon) was used to measure the dry film thicknesses and follow the hydration and effect of the lipase interaction with the lipid layers. The instrument measures the changes in polarization of an incident light interacting with a planar surface. The changes in polarization were quantified by measuring the amplitude ratio, Psi (Ψ) and the phase difference, Delta (Δ) utilizing an angle of incidence of 70°, a modulator angle of 0° and an analyzer angle of 45°. The beam diameter used in our experiments was 1.2 mm, yielding a spot size of 2.1 mm at the interface. All experiments were performed at 25°C in the wavelength range of 190–824 nm for the silicon oxide layer and 451–824 nm for the PS and lipid layers. Data analysis to obtain the substrates film layer thickness was performed in the DeltaPsi2 software (HORIBA Jobin Yvon). The theoretical model used software default values for the optical constants developed by scientists at HORIBA Jobin Yvon for the silicon crystal, gold, silicon dioxide, and polystyrene layers obtained from the literature (Palik, 1991). The optical constants used for the lipid layer and buffer solution were previously determined (Stamm et al., 2018), and Cauchy’s equation was applied to account for the wavelength dependence of the refractive index.
For in situ measurements, a custom-designed fluid cell with an internal volume of ∼4 ml and optical quartz windows (Hellma optics) fixed at 70° was used throughout (see Supplementary Figure S1). This 3D printed stainless steel fluid cell (model designed in house and printed by I. Materialise, Belgium) allowed S.E. measurements to be conducted with the substrate in a horizontal orientation. It was also possible to exchange the bulk fluid (rinsing). The initial hydration of the lipid layer involved flowing buffer solution through the cell using a peristaltic pump at 2.3 ml min−1 for 10 min, at which point the pump was stopped. The measurements were monitored until steady-state was achieved, i.e., when no further change in Δ and Ψ were observed. A buffer solution with 2 ppm TLL was then flowed through the cell at 2.3 ml min−1 for 10 min, at which point the pump was stopped. A multilayer-slab model was utilized for the in situ S.E. experiments with the predefined dry thickness values for silicon oxide and PS fixed in this model. The lipid layer was modelled as a linear effective medium approximation (EMA) layer of buffer and lipid of unknown thickness and composition below an ambient buffer layer. This model provided a solvated lipid thickness as a single homogenous layer, averaged over the size of the measurement spot. Although more detailed modelling such as multi-slab or gradient-slab models are available for the solvated lipid thickness, this can be unreliable due to the increased number of unknowns that need to be fitted. It is noted here that although a single layer EMA model for the solvated lipid layer can be less accurate than more complex models, the trends in the data are expected to be equivalent (Edmondson et al., 2010). The error reported by the DeltaPsi2 software for all in situ measurements performed was within 5% of reported values.
2.4 Quartz Crystal Microbalance With Dissipation
QCM-D experiments were performed on a QSense Analyzer (Biolin Scientific, Gothenburg, Sweden) with the temperature set at 25°C. QSoft software was utilized to control the instrument and collect the data. For the initial hydration, the buffer solution was flowed through the cell using a peristaltic pump at 1.2 ml min−1 for 5 min. Then the flow rate was decreased to 0.12 ml min−1 for a further 15 min, at which point the pump was stopped. The changes in frequency (ΔF) and dissipation (ΔD) were monitored until steady-state was achieved, and no further changes observed for at least 5 min. Supplementary Figure S2 presents the ΔF and ΔD results for the hydration of the thin triolein film at pH 7 for the third, fifth and seventh overtones. Supplementary Figure S2 reveals significant separation between the three overtones, which implies that the hydrated film becomes highly viscoelastic. Due to the complexity of the film composition, particularly in the hydrated state, converting ΔF and ΔD results into a mass using the Voight model would be challenging. Therefore, results were discussed in terms of the raw data with the results for the fifth overtone presented throughout this report. After the films achieved an equilibrium hydrated state, a buffer solution with 2 ppm TLL was flowed through the cell at 1.2 ml min−1 for 5 min. The flow rate was then decreased to 0.12 ml min−1 for a further 5 min, at which point the pump was stopped.
2.5 Attenuated Total Reflectance Fourier-Transform Infrared Spectroscopy
ATR-FTIR experiments were performed on a Nicolet 6700 FTIR instrument using a single bounce ATR diamond crystal (Pike Technology, Inc.) at room temperature (∼22 ± 1°C and 40% relative humidity). Each spectrum consists of 64 co-added scans recorded at a scan rate of 1 Hz and resolution of 4 cm−1. An initial spectrum was measured on the dry lipid film. The liquid cell (Pike Technology, Inc.) was then attached, and 5 ml of buffer solution was manually injected through the cell at 5 ml min−1, and the lipid film was allowed to hydrate for 60 min. After initial hydration, 5 ml of 2 ppm TLL in buffer solution was manually injected through the cell at 5 ml min−1 before the cell was sealed and the reaction allowed to progress for ∼22 h. The experiment was concluded with 5 ml rinses performed first with buffer solution then pure water before the cell was removed. Excess solvent was carefully removed, and lipid film dried in air before a final spectrum was measured. This process was necessary to reduce the signal from water. The relevant infrared absorption bands with approximate wavenumbers found in the literature are provided in Table 2 (Doan et al., 1997; Lambert et al., 1998; Lee and Condrate, 1999; Snabe and Petersen, 2003; Sutton et al., 2015a; Sutton et al., 2015b; Ivanin et al., 2020).
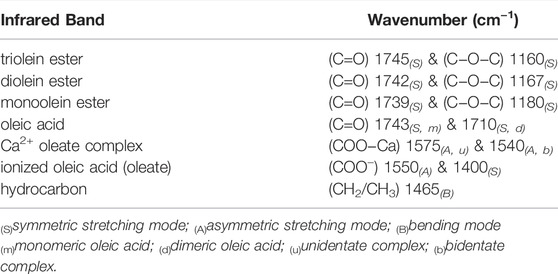
TABLE 2. Summary of relevant infrared bands with approximate wavenumbers.
3 Results and Discussion
3.1 Initial Film Hydration
The changes in film thicknesses for the initial hydration of triolein, diolein and monoolein films after exposure to TRIS buffer at pH 7 and 8.5 were measured using S.E. with the results presented in Supplementary Figure S3. The hydration of each film was allowed to proceed until a steady-state thickness was reached, at which point, no appreciable changes were recorded for a minimum of 5 min. These results are reported as a swelling ratio (S.R.) in Figure 1. The S.R. is the thickness measured by in situ S.E. after the addition of buffer solution (Supplementary Figure S3) divided by the dry film thickness reported in Table 1. This facilitated the comparison between different conditions as the dry film thickness varied somewhat between different samples.
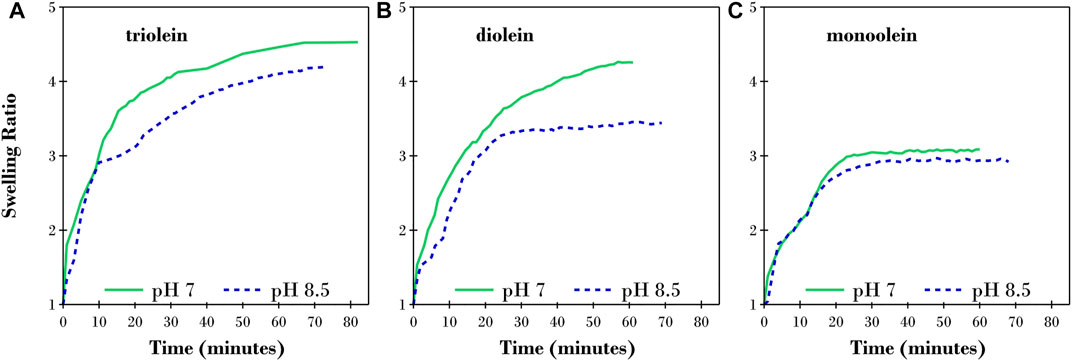
FIGURE 1. Changes in swelling ratio over time for a thin film of (A) triolein, (B) diolein, and (C) monoolein after exposure to TRIS buffer solution at pH 7 (solid green lines) and pH 8.5 (dashed blue lines) calculated from the thickness measured by S.E.
The results shown in Figure 1 indicate that all three films rapidly increased in thickness as the lipid molecules rearranged into an aqueous/lipid phase upon exposure to the buffer solution at both pH 7 and 8.5. For all three lipids investigated, the S.R. was larger at pH 7 than pH 8.5. We also highlight that the time taken to reach equilibrium was directly related to the number of acyl-chains on the glycerides with triolein > diolein > monoolein. The complementary QCM-D ΔF and ΔD results for the hydration of the thin triolein film at pH 7 for the third, fifth and seventh overtones are provided in Supplementary Figure S2. The initial hydration for each QCM-D experiment was monitored until equilibration was achieved. In Supplementary Figure S2, the measured ΔF and ΔD for the triolein film plateaued after ∼70 min; comparable to the time required to reach an equilibrium S.R. in the ellipsometry experiment (green data in Figure 1A). Thus, both techniques confirm that hydration or inclusion of water occurs in the lipid films.
3.2 Effect of Thermomyces lanuginosus Lipase Activity on Buffer Equilibrated Films
A buffer solution with 2 ppm TLL was pumped through the S.E. cell after each film reached a steady-state thickness after exposure to buffer (Supplementary Figure S3). S.E. measurements were started immediately upon introduction of TLL into the system and were performed continuously for several hours with the results reported in Figure 2 in terms of the calculated film thicknesses.
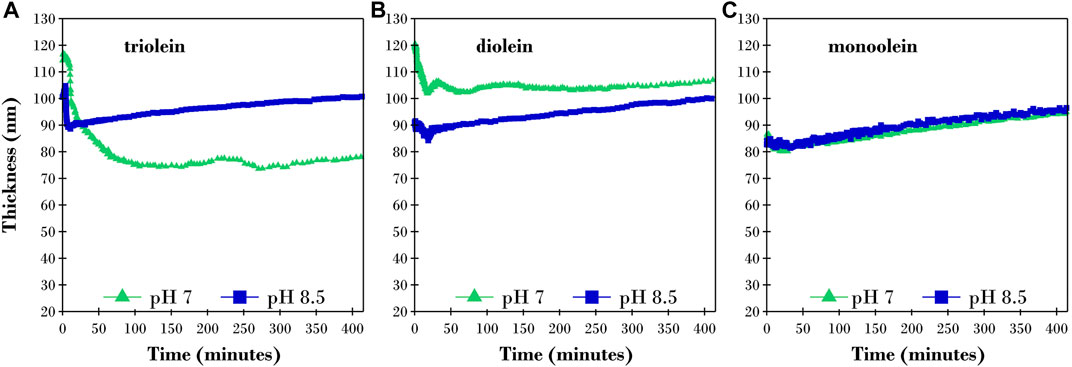
FIGURE 2. Changes in calculated thickness of a buffer equilibrated thin film of (A) triolein, (B) diolein, and (C) monoolein after exposure to 2ppm TLL in TRIS buffer solution at pH 7 (green triangles) and pH 8.5 (blue squares) measured by ellipsometry.
It is evident from Figure 2 that the solution pH and number of oleic acid groups bonded to the glycerol backbone influenced the behavior of TLL. Here, we observed significant variations in lag phase duration, rate of hydrolysis and extent to which the film thickness changed. These key findings will be examined in more detail as each glyceride is discussed. Complementary S.E. experiments were performed on buffer equilibrated triolein films after exposure to an inactive mutant of the enzyme (TLLm) at pH 7 and 8.5 with results presented in Supplementary Figure S4. Supplementary Figure S4 reveals no change in calculated thickness after the addition of the enzyme at both pH 7 and 8.5 for at least 80 min after exposure therefore the observed changes in Figure 2 are due to film hydrolysis.
3.2.1 Lipase Hydrolysis of Triolein
The ATR-FTIR results for the dry triolein films before and after exposure to TLL at pH 7 and 8.5 are presented in Figure 3. We chose to perform ATR-FTIR experiments to analyze the products formed after exposure to TLL as this allowed us to identify all the products from the lipolysis reaction whereas a simple acid-base titration only allows quantification of free fatty acid formation. Acid-base titration is also challenging to apply when the substrate is a thin lipid film. The initial spectra for the films before exposure to TLL (red lines in Figures 3A,B) were almost identical in peak positions and intensities, indicating that the method utilized for the film preparation was highly reproducible. The relevant ATR-FTIR bands for the triolein film (see Table 1) are visible, with absorbance peaks observed at 1745 and 1,160 cm−1 corresponding to the triolein ester bonds and 1,465 cm−1 for the hydrocarbon bonds. Apparent differences are observed for the final dry measurements after exposure to 2 ppm TLL at pH 7 and 8.5. At pH 7 (solid green line in Figure 3A), the triolein ester bond absorbances disappear while the signal corresponding to the reaction products oleic acid and oleate can now be observed. The absorbance from the oleic acid species (COOH at1743 and 1710 cm−1) was less pronounced than the absorbance bands of the oleate species (COO− at 1,550 and 1,400 cm−1). This suggested that the oleate species now dominate the film. However, it cannot be ruled out that the oleic acid formed destabilized the lipid film, and material was dispersed into the aqueous solution. The peak around 1,550 cm−1 indicated that the oleate species was present in free form and as a bidentate complex with calcium (COO−Ca at ∼1,540 cm−1).
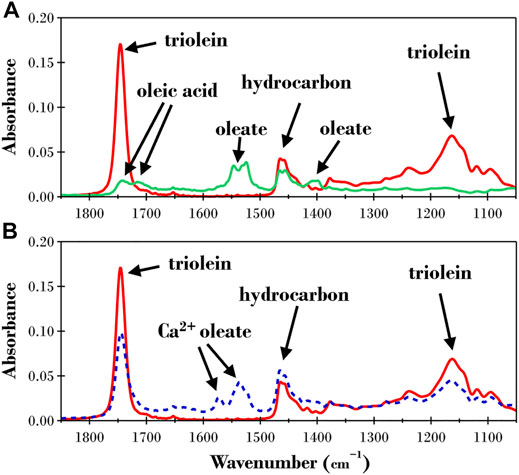
FIGURE 3. ATR-FTIR results for a dry triolein film before (solid red lines) and after exposure to TRIS buffer with 2ppm TLL at (A) pH 7 (solid green line) and (B) pH 8.5 (dashed blue line).
The final spectra for the pH 8.5 experiment (blue dashed line in Figure 3B) confirmed that triolein was still present after ∼22 h of TLL exposure. This suggests that the hydrolysis reaction was significantly hampered. Oleate was now the predominant species produced in the reaction and present as uni- and bidentate Ca2+ complexes.
The S.E. thickness results for the triolein film after exposure to 2 ppm TLL (Figure 2A) are presented in Figures 4A,B as changes in swelling ratio (ΔS.R.) relative to the final plateau values reported in Figure 1A. Figure 4 also reports ΔF and ΔD measured via QCM-D after the buffer equilibrated triolein films were exposed to 2ppm TLL. The plots on the left of Figures 4A,C,E report the changes to the physical properties of the film over the first 30 min of TLL activity, while the plots on the right (B, D & F) show the full results measured over 415 min for each experiment.
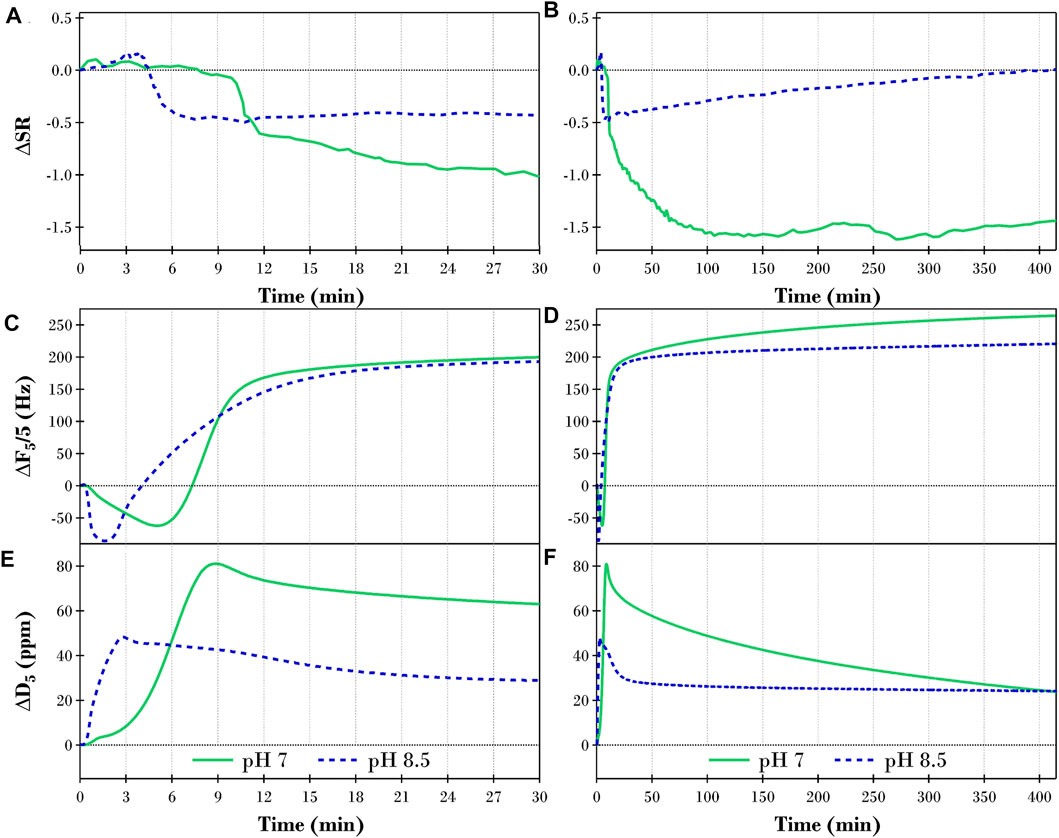
FIGURE 4. Changes in (A,B) swelling ratio (ΔS.R.), (C,D) QCM-D frequency (ΔF5/5), and (E,F) QCM-D dissipation (ΔD5) of the fifth overtone for a TRIS buffer equilibrated triolein film after introducing 2 ppm TLL at pH 7 (solid green lines) and pH 8.5 (dashed blue lines) for 30 and 415 min, respectively.
Focusing on the initial 30 min of TLL activity on the hydrated triolein films (Figures 4A,C,E), a noticeable lag phase was present at both pH 7 and 8.5. TLL adsorption to the surface though, was instantly observed. This was evidenced by the slight increase in thickness while the film also increased in mass (lower frequency) and viscoelasticity (higher dissipation). Therefore, it is proposed that the lag phase hypothesis directed by slow lipase adsorption to the substrate (Verger, 1997) inaccurately describes the process observed for this system. However, what is particularly interesting is that the lag phase persisted for roughly twice as long at pH 7 (∼10 min) than at pH 8.5 (∼5 min), signifying the importance of pH with this phenomenon. Given that an appreciably higher concentration of the oleic acid moieties produced in the hydrolysis reaction at pH 8.5 are present as the calcium complexed oleate species (see Figure 3B), one could argue that the presence of this complexed species was responsible for the reduction in the lag phase. After the initial lag phase, significant changes to the physical properties of the films occurred over a relatively short time at both pH 7 and 8.5.
The ΔS.R. of the film at pH 7 (solid green line in Figure 4A) decreased significantly as the lipase hydrolyzed the ester bonds at the Sn-1 and 3 positions on the triolein molecules. The products of this digestion, first diolein then Sn-2 monoolein, rearranged into their preferred aqueous/lipid phases. The oleic acid product, on the other hand, which favors the protonated, uncharged state at pH 7 (below
Considering the entire 415 min for the pH 7 experiments (green lines in Figures 4B,D,F), the rate of change for the ΔS.R., ΔF and ΔD after the observed lag phase, were initially rapid though gradually decreased over time as a function of the decreasing concentration of ester bonds at the Sn-1 and 3 position for triolein. In addition to the reduced availability of the targeted ester bonds, Reis et al. have reported that the Sn-2 monoolein produced during digestion is interfacially active and can inhibit hydrolysis by displacing the lipase from the interface (Reis et al., 2009b). However, other studies have found that the intermolecular TLL-TLL interactions are strong enough to force the Sn-2 monoolein species to accumulate adjacent to the interface, therefore minimizing its influence (Muth et al., 2017). After ∼150 min, the ΔS.R. plateaued at approximately -1.5 (Figure 4B). This implied that either all the available glycerides were hydrolyzed, and the system was in equilibrium between the oleic acid molecules in the oil phase and those dispersed in the aqueous phase or that the buildup of Sn-2 monoolein at the interface was sufficient to stop the digestion.
Of particular interest for the TLL digestion of triolein at pH 7 was the continued changes in frequency and dissipation after the ΔS.R. equilibrated. We believe this to be evidence of gradual acyl migration of Sn-2 monoolein to the more stable Sn-1 or 3 isomers, allowing further digestion to ensue. We note here that the equilibrium concentration of Sn-2 monoolein should be 10–20 wt% (Murgia et al., 2002). However, since the acyl migration product, Sn-1 monoolein, will proceed to be hydrolyzed by TLL, equilibrium will never be achieved, and the concentration of Sn-2 monoolein will continually decrease. Although there was no appreciable change in film thickness after the first 150 min, an increase in the hydrolysis products, including oleic acid and water-soluble glycerol, gradually changed the oil film’s chemical composition and consequently its mass and viscoelastic properties. This resulted in the continued changes in frequency and dissipation measured for the film. In agreement with the above, the final ATR-FTIR spectrum recorded (solid green line in Figure 3A) indicated that the triglyceride molecules were completely hydrolyzed after 22 h; i.e., there was no evidence that Sn-2 monoolein was present.
The initial response of the buffer equilibrated triolein film, when exposed to TLL at pH 8.5 (blue dashed lines in Figure 4), followed the behavior observed at pH 7 where the lag phase was followed by a rapid decrease in film thickness and perceived mass, i.e., decrease in ΔS.R., increase in ΔF, and decrease in ΔD. However, the increase in the solution pH from 7 to 8.5 meant that significantly more of the oleic acid molecules produced in the reaction were present as the oleate anion species. The oleate anions are strong amphiphiles that are highly surface active. Oleates can also interact with the Ca2+ ions present in the buffer solution to form uni- and bi-dentate complexes, i.e., insoluble calcium soaps. While significant lipase activity was observed proceeding the initial lag phase, the rapid buildup of the oleate species impeded the interfacial biocatalysis, therefore considerably slowing down the hydrolytic process (Muth et al., 2017). This is observed in Figure 4A, where the rapid decrease in ΔS.R. abruptly stopped within the first 10 min of lipase action. After reaching a minimum, the ΔS.R. gradually increased for the remainder of the experiment (Figure 4B), providing evidence of a steady increase in the buildup of the oleate species at the interface as the hydrolysis slowly continued. The pH 8.5 QCM-D ΔF and ΔD results in Figure 4 continued to follow the trend observed at pH 7 beyond the initial 10 min; however, the results plateaued at ∼50 min, unlike the continued changes over the entire experiment at pH 7. The digestion of the triolein film was incomplete at pH 8.5, as evidenced in the final pH 8.5 ATR-FTIR spectrum (blue dashed line in Figure 3B). Consequently, any acyl migration detected through the QCM-D measurements ended much sooner than the pH 7 experiments.
The impact of increasing the solution pH from 7 to 8.5 was twofold. Firstly, the lag phase decreased at a higher pH. This is in agreeance with the hypothesis proposed by Snabe and Peterson where lipolytic activity commences as soon as the lipase is added yet optimum solvent conditions, higher pH in this study, and therefore increased concentration of calcium oleates species are required for quicker release of products from the film (Snabe and Petersen, 2003). Secondly, the amount of time the TLL was highly active was significantly reduced. Here, the significantly increased presence of the oleate species, particularly as calcium oleate complexes, slowed the hydrolysis reaction down and drastically reduced the ability of the products to transition into the aqueous phase.
3.2.2 Lipase Hydrolysis of a Diolein Film
The ATR-FTIR measurements for the TLL digestion of a thin diolein film at pH 7 and 8.5 are presented in Figure 5. The initial spectra for the diolein films (red lines) included a second, smaller peak seen as a shoulder on the absorbance band at 1742 cm−1. This was due to the two diolein isomers where the oleic acid chains can be bonded at the Sn-1/2 or the Sn-1/3 positions on the glycerol backbone, with the main absorbance peak coming from the more stable Sn-1/3 variant.
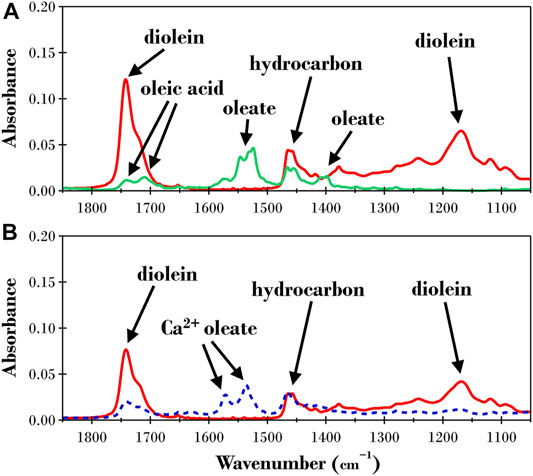
FIGURE 5. ATR-FTIR results for a dry diolein film before (solid red lines) and after exposure to TRIS buffer with 2ppm TLL at (A) pH 7 (solid green line) and (B) pH 8.5 (dashed blue line).
The final dry spectra after exposure to 2 ppm TLL for ∼22 h at pH 7 and 8.5 were very similar to those reported in Figure 3 for triolein. The absorbance band from diolein disappeared in the pH 7 spectrum (green line in Figure 5A) and was again replaced by oleic acid and oleate moieties. In contrast, the pH 8.5 spectrum (blue dashed line in Figure 5B) indicated that diolein molecules are still present while the majority of the hydrolyzed oleic acid chains are in the form of uni- and bidentate Ca2+ oleate complexes.
Figures 6A,B report the ΔS.R. calculated from the S.E. thicknesses presented in Figure 2B for the TLL catalyzed hydrolysis of the diolein films at pH 7 (solid green lines) and 8.5 (blue dashed lines). Figure 6 also presents the corresponding ΔF (C & D) and ΔD (E & F) results from QCM-D measurements. For ease of comparison between the different types of substrate samples, the axis scale for each plot in Figure 6 is consistent with those presented in Figure 4 for the TLL digestion of the triolein films.
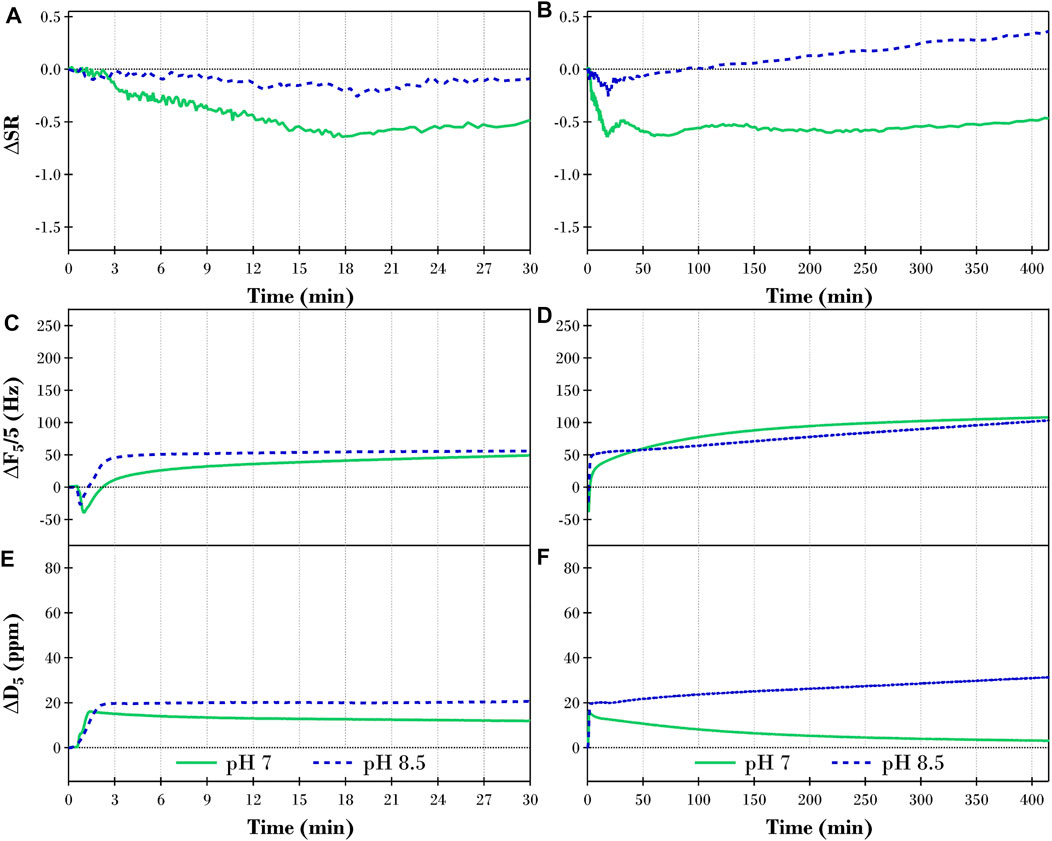
FIGURE 6. Changes in (A,B) swelling ratio (ΔS.R.), (C,D) QCM-D frequency (ΔF5/5), and (E,F) QCM-D dissipation (ΔD5) of the fifth overtone for a TRIS buffer equilibrated diolein film after introducing 2 ppm TLL at pH 7 (solid green lines) and pH 8.5 (dashed blue lines) for 30 and 415 min, respectively.
The first significant difference between the TLL directed hydrolysis of the hydrated diolein film and the corresponding triolein results in Figure 4 is related to the lag phase. While still observed for the pH 7 experiments (green lines in Figures 6A,C,E), the duration of the lag phase was now significantly shorter, ∼3 min for diolein compared to ∼10 min for triolein. At pH 8.5, however (blue dashed lines in Figures 6A,C,E), the lag phase ended within the first minute of lipase exposure. Therefore, the TLL activity was not only influenced by the solvent pH but was also a function of the chemical structure of the target glyceride. Here, reducing the number of oleic acid chains on the glycerol backbone allowed the TLL molecules easier access to the targeted ester bonds, resulting in the catalytic reaction occurring faster.
The overall behavior of the diolein films after exposure to 2 ppm TLL at pH 7 (green lines in Figures 6B,D,F) followed the results observed for the triolein samples (Figure 4) where the ΔS.R. and ΔD decreased while ΔF increased throughout the lipolysis. However, the magnitude of the overall changes measured with S.E. and QCM-D were much lower for the diolein digestion. We believe this is owing to the reduction in oleic acid groups bonded to the glycerol backbone of the substrate. This in turn imposed a different substrate structure, which not only effected the lipid aqueous interface and the bulk of the lipid film, but also influenced the interaction of the lipase and the capability to solubilize the products. The ΔS.R. for diolein plateaued after ∼20 min compared to ∼150 min for the triolein experiment. Furthermore, only a small fraction of the initial diolein molecules would be present in the less stable isomeric conformation, i.e., one of the oleic acid groups bonded at the Sn-2 position. This would significantly lower the concentration of Sn-2 monoolein building up within the film compared to the triolein experiment.
The TLL digestion of diolein at pH 8.5 (blue dashed lined in Figure 6) deviated significantly from the corresponding triolein lipolysis discussed in Section 3.2.1. The ΔS.R. reached a minimum value after ∼20 min, which was only slightly lower than the initial S.R. before the addition of lipase. It is also worth noting however, that the equilibrated swelling ratio for the diolein film after exposure to TRIS buffer was significantly lower at pH 8.5 (S.R. of 3.4) than at pH 7 (S.R. of 4.3), as shown in Figure 1B. After ∼20 min, the ΔS.R. gradually increased for the remainder of the experiment. Interestingly, the ΔF results (Figures 6C,D) increased throughout the experiment, indicating that the total mass of the film gradually reduced. When the ΔS.R. and ΔF are combined with the increasing ΔD results in Fig. Figures 6E,F, one can picture a diolein film increasing in thickness while the internal structural integrity of the hydrated lipid deteriorates, i.e., reduced apparent mass while becoming more viscoelastic.
3.2.3 Lipase Hydrolysis of a Monoolein Film
The ATR-FTIR spectra for the initial monoolein films presented as red lines in Figures 7A,B also included a second, smaller peak seen as a shoulder on the absorbance band at 1739 cm−1, akin to what was observed for diolein in Figure 5. This is again due to the presence of the two monoolein isomers. The single oleic acid chain can be bonded at either the Sn-1 or Sn-2 position on the glycerol backbone, with the main absorbance peak coming from the more stable Sn-1 variant.
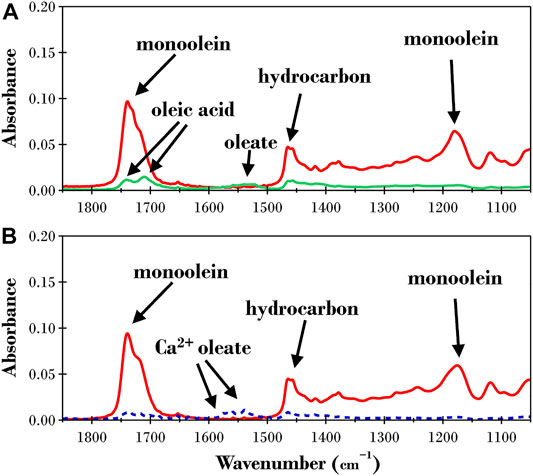
FIGURE 7. ATR-FTIR results for a dry monoolein film before (solid red lines) and after exposure to TRIS buffer with 2ppm TLL at (A) pH 7 (solid green line) and (B) pH 8.5 (dashed blue line).
The final spectra for monoolein after exposure to 2 ppm TLL at pH 7 and 8.5 are quite different to the previously discussed spectra of both triolein and diolein. In this case, there was minimal absorbance from the oleate species at pH 7 (green line in Figure 7A) or pH 8.5 (blue dashed line in Figure 7B). This was an unexpected outcome considering the monoolein ester bonds are completely hydrolyzed with no appreciable absorbance recorded for the C−O−C bond at 1,180 cm−1. The low absorbance peak from the oleate species was likely due to the lower overall concentration of oleic acid moieties as a mass percent of monoolein compared to tri- and diolein.
The ΔS.R. calculated from the S.E. thicknesses presented in Figure 2C for the TLL hydrolysis of the monoolein films at pH 7 (solid green lines) and 8.5 (blue dashed lines) are presented in Figures 8A,B along with the corresponding ΔF (C & D), and ΔD (E & F) results. Once again, to facilitate comparison between tri- di- and mono-olein, the axis scale for each plot in Figure 8 is consistent with those presented in Figures 4, 6.
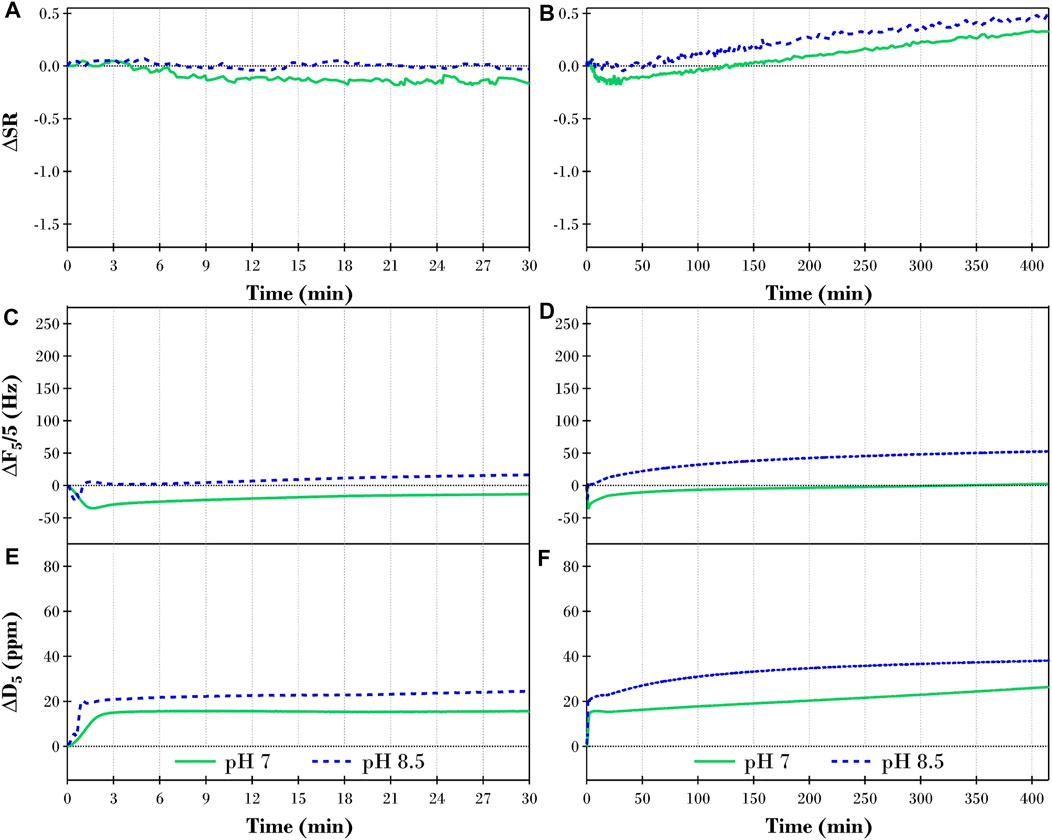
FIGURE 8. Changes in (A,B) swelling ratio (ΔS.R.), (C,D) QCM-D frequency (ΔF5/5), and (E,F) QCM-D dissipation (ΔD5) of the fifth overtone for a TRIS buffer equilibrated monoolein film after introducing 2 ppm TLL at pH 7 (solid green lines) and pH 8.5 (dashed blue lines) for 30 and 415 min, respectively.
We will now discuss the lag phase phenomenon for monoolein compared to the triolein and diolein experiments before moving on to the monoolein lipolysis. Similar to diolein, the lag phase observed after the monoolein films were exposed to 2 ppm TLL was significantly shorter than that observed in the corresponding triolein experiments. Looking closely at Figures 8A,C,E, it is evident that the lag phase persisted for ∼3 min at pH 7 (green lines) while at pH 8.5 (blue dashed lines), it ended within the first minute. Although the ΔS.R. for the pH 8.5 experiment showed no significant change over the first 30 min, the more sensitive ΔF results revealed subtle changes that are associated with the initial adsorption of TLL to the interface (decreasing ΔF) followed by the digestion of the lipids within the film (increasing ΔF).
As was observed for the diolein experiments at pH 8.5 (blue dashed lines in Figure 6), the changes in the physical properties of the monoolein films throughout lipase digestion at pH 7 and 8.5 were significantly different to the respective triolein experiments discussed in Section 3.2.1. Here, the equilibrium S.R. reached in the initial hydration of the monoolein film at pH 7 (S.R. of 3.1) and 8.5 (S.R. of 2.9) was much lower than the corresponding triolein experiments (S.R. of 4.5 and 4.2 respectively, see Figure 1). This is believed to be an essential factor in the variations found between the digestion of the glycerides. Here we note that monoolein swells when exposed to an excess of water to form a liquid crystalline bicontinuous phase (Hyde and Andersson, 1984). The ΔS.R. for the pH 7 experiment (green line in Figures 8A,B) only slightly decreased below the initial buffer equilibrated S.R., reaching a minimum (ΔS.R. = −0.2) after ∼10 min before plateauing for the next 20 min. After ∼30 min of TLL exposure, the calculated ΔS.R. gradually increased for the remainder of the experiment. The introduction of the lipase into the system at pH 8.5 (blue dashed line in Figures 8A,B) had minimal effect on the ΔS.R. for the first 30 min where it oscillated within error either side of the initial S.R. of the buffer equilibrated monoolein film. After 30 min, however, the ΔS.R. gradually increased following a similar trajectory to the ΔS.R. for the pH 7 monoolein experiment.
In contrast to the increasing ΔS.R. throughout the monoolein hydrolysis at pH 7 and 8.5, the QCM-D measured ΔF (Figures 8C,D) slowly increased, indicating the apparent total mass reduces as the accessible ester bonds were cleaved. When the ΔS.R. and ΔF results are combined with the increasing ΔD results in Figures 8E,F, as expressed in Section 3.2.2, for the diolein pH 8.5 experiments, one can again picture a monoolein film that is increasing in thickness while the internal structural integrity of the hydrated lipid deteriorates, i.e., reduced apparent mass, while becoming more viscoelastic, i.e., less rigid.
4 Conclusion
This study expanded on previous research focused on the hydration and lipolysis of triglyceride films (Snabe and Petersen, 2003; Stamm et al., 2018) by considering the influence of the reaction products such as glycerol, mono- and diglycerides and free fatty acids (or their salts) on the physical properties of the films. Herein we investigated the initial hydration and subsequent TLL digestion of nanosized triolein films on planar substrates in an aqueous TRIS buffer solvent at pH 7 and 8.5; either side of the
For the lipolysis of the triolein films, it was shown that increasing the pH of the buffer solution from 7 to 8.5 significantly influenced the changes in physical properties. Firstly, the lag phase duration was approximately halved while the initial rate of hydrolysis was also increased. However, the prolonged TLL activity and, therefore, the final degree of digestion was significantly impeded at the higher pH. It is proposed that the calcium oleate complex produced at pH 8.5 performed a significant role in these observed differences. A similar response to solvent pH was also observed for the diolein and monoolein experiments. However, reducing the number of acyl chains of the glycerol backbone also appreciably influenced the subsequent lipolytic reaction. Firstly, the reduced number of olein chains on the glycerol backbone enabled the lipase easier access the targeted ester bonds, which resulted in a decrease in the lag phase.
Furthermore, the magnitude of the changes to the physical properties of the thin films throughout the digestion was also reduced due to the decreased content of oleic acid chains present in the films. The outcomes from this study highlight the impact of solvent pH, the number of acyl chains on the glyceride, and specific reaction products on crucial processes in the lipolysis of glycerides. Therefore, it would be possible to manipulate biological or industrial processes involving triglyceride films by taking advantage of particular conditions to enhance a desirable enzymatic process.
Data Availability Statement
The raw data supporting the conclusions of this article will be made available by the authors, without undue reservation.
Author Contributions
BH: Conceptualization, Investigation, Writing–review and editing, JC-T: Investigation, Supervision, Writing–review and editing, TA: Conceptualization, Writing–review and editing, LB: Conceptualization, Writing–review and editing, JV: Conceptualization, Writing–review and editing, CD: Conceptualization, Supervision, Writing–review and editing, TN: Conceptualization, Supervision, Writing–review and editing.
Conflict of Interest
The authors declare that the research was conducted in the absence of any commercial or financial relationships that could be construed as a potential conflict of interest.
Publisher’s Note
All claims expressed in this article are solely those of the authors and do not necessarily represent those of their affiliated organizations, or those of the publisher, the editors and the reviewers. Any product that may be evaluated in this article, or claim that may be made by its manufacturer, is not guaranteed or endorsed by the publisher.
Acknowledgments
We are grateful for the financial support from Swedish Research Council (2018–05013). JC-T acknowledge financial support from LINXS-Lund Institute of Advanced Neutron and X-Ray Science for a sabbatical in Lund.
Supplementary Material
The Supplementary Material for this article can be found online at: https://www.frontiersin.org/articles/10.3389/frsfm.2022.929104/full#supplementary-material
References
Barauskas, J., Anderberg, H., Svendsen, A., and Nylander, T. (2016). Thermomyces Lanuginosus Lipase-Catalyzed Hydrolysis of the Lipid Cubic Liquid Crystalline Nanoparticles. Colloids Surfaces B Biointerfaces 137, 50–59. doi:10.1016/j.colsurfb.2015.04.052
Barig, S., Alisch, R., Nieland, S., Wuttke, A., Gräser, Y., Huddar, M., et al. (2011). Monoseptic Growth of Fungal Lipase Producers under Minimized Sterile Conditions: Cultivation of Phialemonium Curvatum in 350 L Scale. Eng. Life Sci. 11, 387–394. doi:10.1002/elsc.201000219
Bohr, S. S. R., Lund, P. M., Kallenbach, A. S., Pinholt, H., Thomsen, J., Iversen, L., et al. (2019). Direct Observation of Thermomyces Lanuginosus Lipase Diffusional States by Single Particle Tracking and Their Remodeling by Mutations and Inhibition. Sci. Rep. 9, 16169. doi:10.1038/s41598-019-52539-1
Borné, J., Nylander, T., and Khan, A. (2002a). Effect of Lipase on Different Lipid Liquid Crystalline Phases Formed by Oleic Acid Based Acylglycerols in Aqueous Systems. Langmuir 18, 8972–8981. doi:10.1021/la020377d
Borné, J., Nylander, T., and Khan, A. (2002b). Effect of Lipase on Monoolein-Based Cubic Phase Dispersion (Cubosomes) and Vesicles. J. Phys. Chem. B 106, 10492–10500. doi:10.1021/jp021023y
Brzozowski, A. M., Derewenda, U., Derewenda, Z. S., Dodson, G. G., Lawson, D. M., Turkenburg, J. P., et al. (1991). A Model for Interfacial Activation in Lipases from the Structure of a Fungal Lipase-Inhibitor Complex. Nature 351, 491–494. doi:10.1038/351491a0
Brzozowski, A. M., Savage, H., Verma, C. S., Turkenburg, J. P., Lawson, D. M., Svendsen, A., et al. (2000). Structural Origins of the Interfacial Activation in Thermomyces (Humicola) Lanuginosa Lipase. Biochemistry 39, 15071–15082. doi:10.1021/bi0013905
Caboi, F., Borné, J., Nylander, T., Khan, A., Svendsen, A., and Patkar, S. (2002). Lipase Action on a Monoolein/Sodium Oleate Aqueous Cubic Liquid Crystalline Phase-A NMR and X-Ray Diffraction Study. Colloids Surfaces B Biointerfaces 26, 159–171. doi:10.1016/s0927-7765(02)00035-8
Cistola, D. P., Hamilton, J. A., Jackson, D., and Small, D. M. (1988). Ionization and Phase Behavior of Fatty Acids in Water: Application of the Gibbs Phase Rule. Biochemistry 27, 1881–1888. doi:10.1021/bi00406a013
Cistola, D. P., Small, D. M., and Hamilton, J. A. (1982). Ionization Behavior of Aqueous Short-Chain Carboxylic Acids: A Carbon-13 NMR Study. J. Lipid Res. 23, 795–799. doi:10.1016/s0022-2275(20)38114-1
Doan, V., Köppe, R., and Kasai, P. H. (1997). Dimerization of Carboxylic Acids and Salts: An IR Study in Perfluoropolyether Media. J. Am. Chem. Soc. 119, 9810–9815. doi:10.1021/ja970304u
Edmondson, S., Nguyen, N. T., Lewis, A. L., and Armes, S. P. (2010). Co-Nonsolvency Effects for Surface-Initiated Poly(2-(Methacryloyloxy)ethyl Phosphorylcholine) Brushes in Alcohol/Water Mixtures. Langmuir 26, 7216–7226. doi:10.1021/la904346j
Fernandez-Lafuente, R. (2010). Lipase from Thermomyces Lanuginosus: Uses and Prospects as an Industrial Biocatalyst. J. Mol. Catal. B Enzym. 62, 197–212. doi:10.1016/j.molcatb.2009.11.010
Filipe, H. A. L., Almeida, M. C. F., Teixeira, R. R., Esteves, M. I. M., Henriques, C. A., Antunes, F. E., et al. (2021). Dancing with Oils - the Interaction of Lipases with Different Oil/Water Interfaces. Soft Matter 17, 7086–7098. doi:10.1039/d1sm00590a
Freedman, B., Pryde, E. H., and Mounts, T. L. (1984). Variables Affecting the Yields of Fatty Esters from Transesterified Vegetable Oils. J. Am. Oil Chem. Soc. 61, 1638–1643. doi:10.1007/bf02541649
Hyde, S. T., and Andersson, S. (1984). A Cubic Structure Consisting of a Lipid Bilayer Forming an Infinite Periodic Minimum Surface of the Gyroid Type in the Glycerolmonooleat-Water System. Z. für Kristallogr. - Cryst. Mater. 168, 213–220. doi:10.1524/zkri.1984.168.14.213
Intarakumhaeng, R., Shi, Z., Wanasathop, A., Stella, Q. C., Wei, K. S., Styczynski, P. B., et al. (2018). In Vitro Skin Penetration of Petrolatum and Soybean Oil and Effects of Glyceryl Monooleate. Int. J. Cosmet. Sci. 40, 367–376. doi:10.1111/ics.12469
Ivanin, S. N., Buz’ko, V. Y., Goryachko, A. I., and Panyushkin, V. T. (2020). Synthesis, Structure, and Electromagnetic Characteristics of Gadolinium Stearate. Russ. J. Inorg. Chem. 65, 880–886. doi:10.1134/s0036023620060066
Ivanova, M., Detcheva, A., Verger, R., and Panaiotov, I. (2004). Action of Humicola Lanuginosa Lipase on Long-Chain Lipid Substrates. Colloids Surfaces B Biointerfaces 33, 89–100. doi:10.1016/j.colsurfb.2003.08.017
Khay Fong, W., Salentinig, S., Prestidge, C. A., Mezzenga, R., Hawley, A., and Boyd, J. B. (2014). Generation of Geometrically Ordered Lipid-Based Liquid-Crystalline Nanoparticles Using Biologically Relevant Enzymatic Processing. Langmuir 30, 5373–5377. doi:10.1021/la5003447
Lambert, J. B., Shurvell, H. F., Lightner, D., and Cooks, R. G. (1998). Organic Structural Spectroscopy. Upper Saddle River, New Jersey: Prentice-Hall.
Laszlo, J. A., Compton, D. L., and Vermillion, K. E. (2008). Acyl Migration Kinetics of Vegetable Oil 1,2-Diacylglycerols. J. Am. Oil Chem. Soc. 85, 307–312. doi:10.1007/s11746-008-1202-5
Lee, D. H., and Condrate, R. A. (1999). FTIR Spectral Characterization of Thin Film Coatings of Oleic Acid on Glasses: I. Coatings on Glasses from Ethyl Alcohol. J. Mater. Sci. 34, 139–146. doi:10.1023/a:1004494331895
Mele, S., Söderman, O., Ljusberg-Wahrén, H., Thuresson, K., Monduzzi, M., and Nylander, T. (2018). Phase Behavior in the Biologically Important Oleic Acid/Sodium Oleate/Water System. Chem. Phys. Lipids 211, 30–36. doi:10.1016/j.chemphyslip.2017.11.017
Moses, M. E., Lund, P. M., Bohr, S. S.-R., Iversen, S. F., Kæstel-Hansen, J., Kallenbach, A. S., et al. (2021). Single-Molecule Study of Thermomyces Lanuginosus Lipase in a Detergency Application System Reveals Diffusion Pattern Remodeling by Surfactants and Calcium. ACS Appl. Mat. Interfaces 13, 33704–33712. doi:10.1021/acsami.1c08809
Murgia, S., Caboi, F., Monduzzi, M., Ljusberg-Wahren, H., and Nylander, T. (2002). “Acyl Migration and Hydrolysis in Monoolein-Based Systems,” in Lipid and Polymer-Lipid Systems, Progress in Colloid and Polymer Science. Editors T. Nylander, and B. Lindman (Berlin, Heidelberg: Springer), 120, 41–46. doi:10.1007/3-540-45291-5_6
Muth, M., Rothkötter, S., Paprosch, S., Schmid, R. P., and Schnitzlein, K. (2017). Competition of Thermomyces Lanuginosus Lipase with its Hydrolysis Products at the Oil-Water Interface. Colloids Surfaces B Biointerfaces 149, 280–287. doi:10.1016/j.colsurfb.2016.10.019
Nielsen, L. K., Risbo, J., Callisen, T. H., and Bjørnholm, T. (1999). Lag-burst Kinetics in Phospholipase A2 Hydrolysis of DPPC Bilayers Visualized by Atomic Force Microscopy. Biochim. Biophys. Acta (BBA) - Biomembr. 1420, 266–271. doi:10.1016/s0005-2736(99)00103-0
Reis, P., Holmberg, K., Miller, R., Krägel, J., Grigoriev, D. O., Leser, M. E., et al. (2008a). Competition between Lipases and Monoglycerides at Interfaces. Langmuir 24, 7400–7407. doi:10.1021/la800531y
Reis, P., Holmberg, K., Miller, R., Leser, M. E., Raab, T., and Watzke, H. J. (2009a). Lipase Reaction at Interfaces as Self-Limiting Processes. Comptes Rendus Chim. 12, 163–170. doi:10.1016/j.crci.2008.04.018
Reis, P., Holmberg, K., Watzke, H., Leser, M. E., and Miller, R. (2009b). Lipases at Interfaces: A Review. Adv. Colloid Interface Sci. 147-148, 237–250. doi:10.1016/j.cis.2008.06.001
Reis, P., Miller, R., Leser, M., Watzke, H., Fainerman, V. B., and Holmberg, K. (2008b). Adsorption of Polar Lipids at the Water−Oil Interface. Langmuir 24, 5781–5786. doi:10.1021/la704043g
Reis, P. M., Raab, T. W., Chuat, J. Y., Leser, M. E., Miller, R., Watzke, H. J., et al. (2008c). Influence of Surfactants on Lipase Fat Digestion in a Model Gastro-Intestinal System. Food Biophys. 3, 370. doi:10.1007/s11483-008-9091-6
Reis, P., Watzke, H., Leser, M., Holmberg, K., and Miller, R. (2010). Interfacial Mechanism of Lipolysis as Self-Regulated Process. Biophys. Chem. 147, 93–103. doi:10.1016/j.bpc.2010.01.005
Salentinig, S., Phan, S., Hawley, A., and Boyd, B. J. (2015a). Self-Assembly Structure Formation during the Digestion of Human Breast Milk. Angew. Chem. Int. Ed. 54, 1600–1603. doi:10.1002/anie.201408320
Salentinig, S., Sagalowicz, L., and Glatter, O. (2010). Self-Assembled Structures and pKa Value of Oleic Acid in Systems of Biological Relevance. Langmuir 26, 11670–11679. doi:10.1021/la101012a
Salentinig, S., Sagalowicz, L., Leser, M. E., Tedeschi, C., and Glatter, O. (2011). Transitions in the Internal Structure of Lipid Droplets during Fat Digestion. Soft Matter 7, 650–661. doi:10.1039/c0sm00491j
Salentinig, S., Yepuri, N. R., Hawley, A., Boyd, B. J., Gilbert, E., and Darwish, T. A. (2015b). Selective Deuteration for Molecular Insights into the Digestion of Medium Chain Triglycerides. Chem. Phys. Lipids 190, 43–50. doi:10.1016/j.chemphyslip.2015.06.007
Sarda, L., and Desnuelle, P. (1958). Action de la lipase pancréatique sur les esters en émulsion. Biochim. Biophys. Acta 30, 513–521. doi:10.1016/0006-3002(58)90097-0
Schmid, R. D., and Verger, R. (1998). Lipases: Interfacial Enzymes with Attractive Applications. Angew. Chem. Int. Ed. 37, 1608–1633. doi:10.1002/(sici)1521-3773(19980703)37:12<1608::aid-anie1608>3.0.co;2-v
Singh, A. K., and Mukhopadhyay, M. (2012). Overview of Fungal Lipase: A Review. Appl. Biochem. Biotechnol. 166, 486–520. doi:10.1007/s12010-011-9444-3
Snabe, T., Neves-Petersen, M. T., and Petersen, S. B. (2005). Enzymatic Lipid Removal from Surfaces-Lipid Desorption by a pH-Induced "Electrostatic Explosion". Chem. Phys. Lipids 133, 37–49. doi:10.1016/j.chemphyslip.2004.08.005
Snabe, T., and Petersen, S. B. (2003). Lag Phase and Hydrolysis Mechanisms of Triacylglycerol Film Lipolysis. Chem. Phys. Lipids 125, 69–82. doi:10.1016/s0009-3084(03)00072-0
Stamm, A., Svendsen, A., Skjold-Jørgensen, J., Vissing, T., Berts, I., and Nylander, T. (2018). The Triolein/Aqueous Interface and Lipase Activity Studied by Spectroscopic Ellipsometry and Coarse Grained Simulations. Chem. Phys. Lipids 211, 37–43. doi:10.1016/j.chemphyslip.2017.10.011
Sutton, C. C. R., da Silva, G., and Franks, G. V. (2015b). Modeling the IR Spectra of Aqueous Metal Carboxylate Complexes: Correlation between Bonding Geometry and Stretching Mode Wavenumber Shifts. Chem. Eur. J. 21, 6801–6805. doi:10.1002/chem.201406516
Sutton, C. C. R., Franks, G. V., and da Silva, G. (2015a). Modeling the Antisymmetric and Symmetric Stretching Vibrational Modes of Aqueous Carboxylate Anions. Spectrochim. Acta A Mol. Biomol. Spectrosc. 134, 535–542. doi:10.1016/j.saa.2014.06.062
Vazquez, R., Nogueira, R., Orfão, M., Mata, J.L., and Saramago, B. (2006). Stability of Triglyceride Liquid Films on Hydrophilic and Hydrophobic Glasses. J. Colloid Interface Sci. 299 (1), 274–282. doi:10.1016/j.jcis.2006.02.015
Verger, R. (1997). 'Interfacial Activation' of Lipases: Facts and Artifacts. Trends Biotechnol. 15, 32–38. doi:10.1016/s0167-7799(96)10064-0
Wadsäter, M., Barauskas, J., Nylander, T., and Tiberg, F. (2014). Formation of Highly Structured Cubic Micellar Lipid Nanoparticles of Soy Phosphatidylcholine and Glycerol Dioleate and Their Degradation by Triacylglycerol Lipase. ACS Appl. Mater. Interfaces 6, 7063–7069. doi:10.1021/am501489e
Warren, D. B., Anby, M. U., Hawley, A., and Boyd, B. J. (2011). Real Time Evolution of Liquid Crystalline Nanostructure during the Digestion of Formulation Lipids Using Synchrotron Small-Angle X-Ray Scattering. Langmuir 27, 9528–9534. doi:10.1021/la2011937
Willems, N., Lelimousin, M., Skjold-Jørgensen, J., Svendsen, A., and Sansom, M. S. P. (2018). The Effect of Mutations in the Lid Region of Thermomyces Lanuginosus Lipase on Interactions with Triglyceride Surfaces: A Multi-Scale Simulation Study. Chem. Phys. Lipids 211, 4–15. doi:10.1016/j.chemphyslip.2017.08.004
Keywords: thermomyces lanuginosus lipase, triolein, diolein, monoolein, spectroscopic ellipsometry, QCM-D, ATR-FTIR
Citation: Humphreys BA, Campos-Terán J, Arnold T, Baunsgaard L, Vind J, Dicko C and Nylander T (2022) The Influence of pH on the Lipase Digestion of Nanosized Triolein, Diolein and Monoolein Films. Front. Soft. Matter 2:929104. doi: 10.3389/frsfm.2022.929104
Received: 26 April 2022; Accepted: 07 June 2022;
Published: 28 June 2022.
Edited by:
Kai Yang, Soochow University, ChinaReviewed by:
Jennifer Martins Noro, University of Minho, PortugalQingmei Yuan, Yunnan University, China
Copyright © 2022 Humphreys, Campos-Terán, Arnold, Baunsgaard, Vind, Dicko and Nylander. This is an open-access article distributed under the terms of the Creative Commons Attribution License (CC BY). The use, distribution or reproduction in other forums is permitted, provided the original author(s) and the copyright owner(s) are credited and that the original publication in this journal is cited, in accordance with accepted academic practice. No use, distribution or reproduction is permitted which does not comply with these terms.
*Correspondence: Ben A. Humphreys, ben.humphreys@fkem1.lu.se