 C. Manuel Carlevaro
 Ryan Kozlowski
 Luis A. Pugnaloni
- 1Instituto de Física de Líquidos y Sistemas Biológicos, CONICET−Universidad Nacional de La Plata, and Departamento de Ingeniería Mecánica, Facultad Regional La Plata, Universidad Tecnológica Nacional, La Plata, Argentina
- 2Physics Department, College of the Holy Cross, Worcester, MA, United States
- 3Departamento de Física, Facultad de Ciencias Exactas y Naturales, Universidad Nacional de La Pampa, CONICET, Santa Rosa, Argentina
A long-standing debate regarding the dynamics of silo discharge revolves around the use of mono-dispersed circular or spherical grains in simplified two-dimensional models. It is well-known that granular systems composed of particles of the same size can generate crystal or quasi-crystal domains with specific structural and dynamic behaviors. Can this ordering affect the flow rate to an extent that monosized systems cannot be good models for realistic materials? In this work, we present simulations of the discharge of two-dimensional silos filled with binary mixtures of circular grains that conserve the same mean particle size. We address the question of how ordering affects the mass flow rate, in particular considering the limit of mono-sized systems. We find that the typical hexagonal order observed does not affect the flow rate significantly. However, the flow rate does exhibit a weak, nonmonotonic dependence on packing bidispersity that correlates with changes in the outpouring speed of grains in the vicinity of the orifice.
1 Introduction
In many studies of soft materials, model systems (in the laboratory or in silico) are built using monosized entities. Such systems are prone to structural ordering (An et al., 2011). This is so for bubbles (which form foams), colloidal particles (which form gels), cells (which form tissues), and grains (which form bulk solids) alike. Ordering is particularly evident in two-dimensional (2D) systems (Dickinson et al., 1989). In conventional solids, ordering influences strength and deformation under shear; in granular systems, ordering generally increases packing fraction and creates well-defined failure planes under shear. At the same time, the apparent ordering of grains in a granular packing does not correspond to well-defined ordering of contacts and forces between grains. As discussed by Duran (Sands, 2000), a “stack of cannon balls” may look like a very ordered geometrical arrangement. However, if the balls are rigid, not all neighboring balls need to be in contact to have a stable stack since the isostatic point is achieved with only four contacts per particle. There are thus many different contact configurations compatible with a given ordered arrangement (Grindlay and Opie, 1995); geometrical ordering does not imply ordering at the contact level, and by extension, the transmission of forces (Radjaï et al., 1996; Geng et al., 2003).
Since contacts are responsible for the transmission of forces and ultimately for the resulting dynamics of the system, it is natural to wonder if geometrical ordering–that is, ordering of particle positions which is visible to the naked eye–is at all meaningful to the flow of grains beyond the obvious effect on packing fraction. Recently, attention has been paid to the ordered domains during flow (Cervantes-Álvarez et al., 2023). These authors consider a monosized system of disks in a quasi-2D experiment and identify ordered domains that compete during discharge. The main objective of this work was to identify some signature in the dynamics of the ordered domains that may serve as precursors to clogging; the emphasis was not on the discharge rate of grains between clogs.
Prompted by the concern that clearly visible ordering in monosized systems may provide results that are not representative of more realistic situations, researchers tend to implement strategies to prevent ordering, typically by introducing some degree of polydispersity to the size of the components of the material (Tsuchikusa et al., 2023). There are many open questions around this approach, however. How much polydispersity is needed to eliminate ordering? Does ordering need to be eliminated fully? Is polydispersity affecting the results in ways not related to ordering (e.g., size segregation (Gray, 2018))?
The mass flow rate W of a discharging silo is mostly independent of the height of the granular column in the silo and is well-described by the Beverloo correlation (Beverloo et al., 1961). In a 2D system this is
where D is the length of the orifice,
The discharge of monosized disks has been considered in a number of experimental and simulation studies (Sakaguchi et al., 1993; Langston et al., 1995; Mankoc et al., 2007; Aguirre et al., 2010; Goldberg et al., 2015; Tang and Behringer, 2016; Ashour et al., 2017; Cervantes-Álvarez et al., 2023). In all cases the Beverloo scaling with the 3/2 power of the orifice size has been confirmed. The Beverloo exponent remains the same for polydisperse systems (Zhou et al., 2015; Madrid et al., 2017; Reddy et al., 2021; Anyam and Anki Reddy, 2022) and even for non-circular particles (Liu et al., 2014; Goldberg et al., 2015; Börzsönyi et al., 2016; Gao et al., 2023), with one known exception being elongated grains in narrow silos that may display a flow rate which increases as the silo discharges (Pongó et al., 2022).
The flow of polydisperse mixtures has also been studied, though not in connection with the state of ordering. Zhou et al. (2015) considered the discharge of 2D binary mixtures of disks using Discrete Element Method (DEM) simulations. As other authors have done in 3D experiments and simulations (Artega and Tüzün, 1990; Humby et al., 1998; Benyamine et al., 2014; Madrid et al., 2017), these authors consider the change in flow rate when fine grains are added into the mixture. Naturally, ordering of the initially monosized system has to be altered by the addition of fine grains. However, since the mean particle size in the mixtures is not kept constant when fine grains are added, the differences in the flow rate cannot be directly attributed to a change in ordering but mainly to the effective reduction of the mean particle size. More recently, Jacobs-Capdeville et al. (2023) studied the discharge of log-normal polydisperse systems of spheres in 3D silos. In this case, the authors varied the spread of the particle sizes but held the median particle diameter fixed, an approach that inspires the current work as a way to decouple the effects of ordering from the effect of mean particle size
In this work we study the flow rate of 2D binary systems of disks discharging from a rectangular flat-bottom silo, varying bidispersity with fixed mean particle size in order to directly isolate the effects that spatial ordering of particles in the silo has on the outpouring rate. The limiting case of monosized disks presents clear ordered regions. To consider the effect of such ordering, we simulate binary mixtures with the same mean particle size as the monosized reference system; experiments varying dispersity in such a well-controlled manner are not as feasible as computational simulations. We vary the size dispersion within a narrow range in fine increments in order to observe the flow rate with dispersity as the system smoothly varies from a highly ordered state to a disordered, liquid-like state. We use the Q6 bond order parameter (Steinhardt et al., 1983) to characterize ordering and show that there exists a nonmonotonic correlation with the flow rate. We then measure the density and velocity profiles along the orifice to evaluate if the origin of our observed changes in the flow rate are connected to packing fraction–another indicator of spatial ordering in granular systems–or changes in the outpouring velocity of grains at the orifice.
2 Simulations
We simulate the discharge of disks from a 2D rectangular silo using a nonsmooth rigid body DEM implemented with the Box2D library (Catto, 2005). A typical snapshot of our simulation is presented in Figure 1. For a monosized system, disks have diameter d and mass m, and the discharge is driven by the acceleration of gravity g pointing in the downward direction. The silo has dimensions of 180d in height and 71d in width, with an exit hole of diameter D = 16.9 d located at the center of the base. (While we primarily focus on this large orifice size in the analysis to follow, in Section 3.4 we include results for a much smaller orifice in order to demonstrate the robustness of our findings with orifice size.) For binary mixtures, we introduce in the silo two types of disks: NL large disks with a diameter of dL and NS small disks with a diameter of dS. We define the size ratio of the packing as α = dL/dS. The mass of a grain mS,L is proportional to its area, and the area density for both species is set to 4m/(πd2) = 4/π. In the rest of the paper we will use d and m for the monosized system as unit length and unit mass, respectively. The friction and restitution coefficients are the same for the interaction between particles (regardless of their species) and between particles and walls, with values of μ = 0.5 for friction and ϵ = 0.1 for restitution.
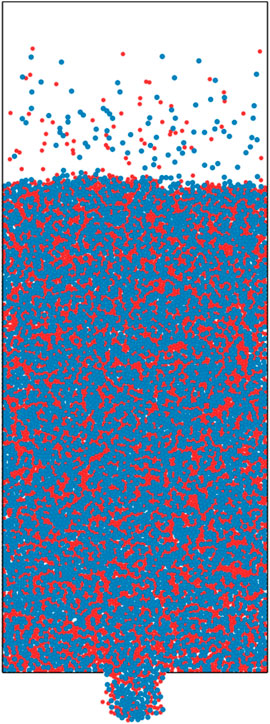
FIGURE 1. Snapshot of a simulation with a α = 1.31 binary mixture composed of 5,000 large (dL = 1.1239, blue) and 5,000 small (dS = 0.8584, red), disks. The exiting grains are re-injected at the top at random locations above the free surface in the silo.
The Box2D library employs a constraint solver to handle the dynamics of interacting rigid bodies (Catto, 2005). Box2D is an implementation of a nonsmooth DEM (Moreau, 1988), in which the contact between particles is only defined by a restitution coefficient and friction coefficient instead of a force law, and the particles are considered to be infinitely stiff. In our simulations, we perform a maximum of 60 iterations at each time step to resolve contact dynamics between particles using a Lagrange multiplier scheme. The equations of motion are then advanced (with a time step of
In a single trial, the grains are poured into the silo with the orifice plugged, and the system is allowed to settle until all grains come to rest. The system is defined to be at rest once every grain’s translational speed drops below a threshold of
In order to make the flow rate of different binary mixtures (as well as the monosized system) comparable, we keep the mean particle diameter
• Case I (NL = NS): In this case we set the number of grains of each species the same. The total mass of each species varies and depends on the selected value of the free parameter (dL). Table 1 summarizes the set of simulations that were run for this case.
• Case II (ML = MS): In this case we set the total mass of each species (
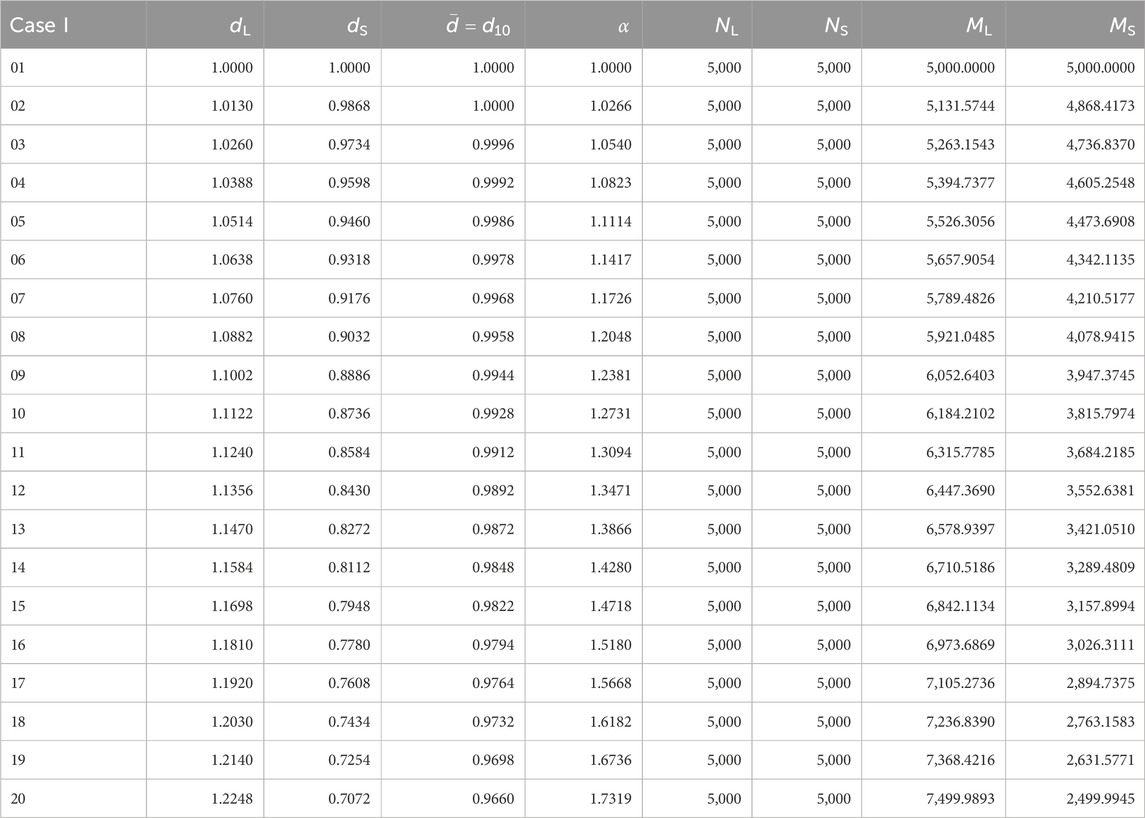
TABLE 1. Set of parameters of the mixtures prepared for simulations of Case I, i.e., NL = NS. The diameter di of each species and the mean diameter
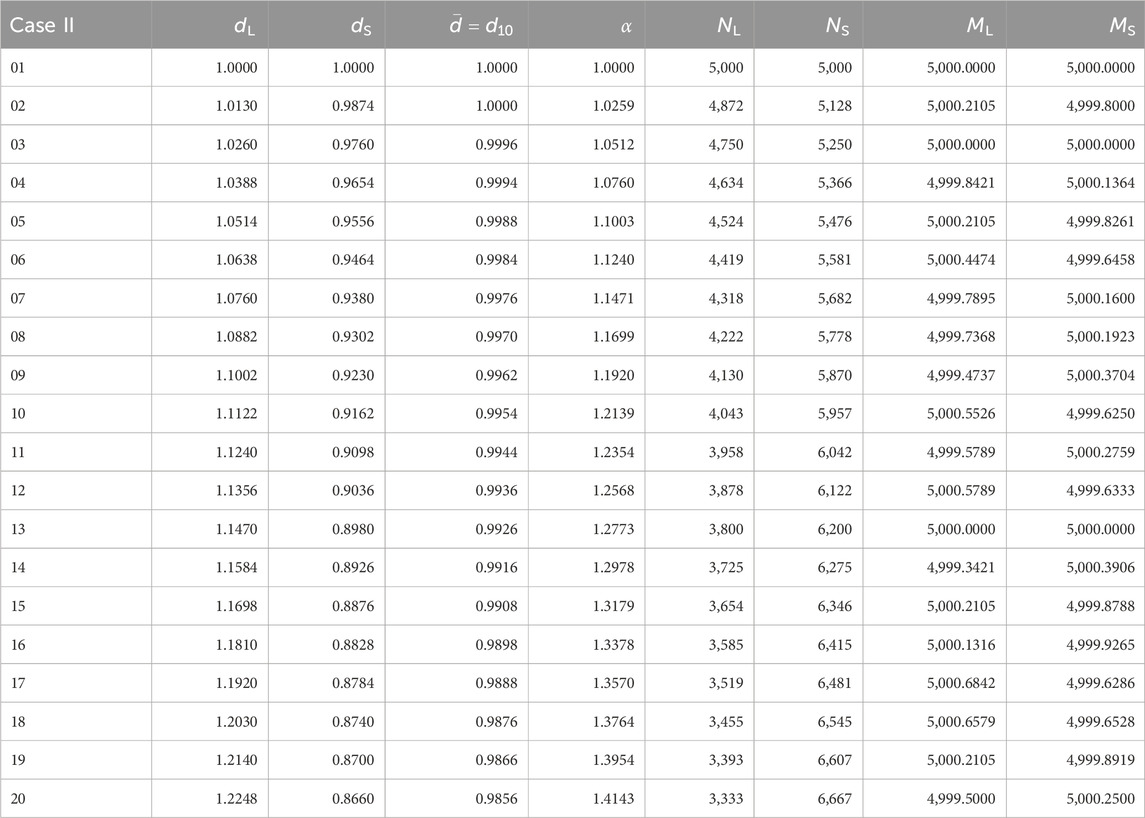
TABLE 2. Set of parameters of the mixtures prepared for simulations of Case II, i.e., ML = MS. The diameter di of each species and the mean diameter
We have run simulations of the binary mixtures listed in Tables 1, 2 corresponding to Cases I and II keeping
3 Results
3.1 Ordering
To quantify the order in the system we use the Q6 bond order parameter, which characterize the local order around a given particle (Steinhardt et al., 1983). For a grain, the bond order parameter can be defined either through the contact vectors (the vectors from its center to each contact with its touching neighbors) or through the nearest neighbor (NN) vectors (the vectors from the particle center to the center of each nearest neighbor, irrespective of whether the particles touch). As we mentioned in Section 1, the ordering that usually concerns researchers is appreciated by naked eye in the systems of interest and does not take into account the real contacts. Therefore, we use the NN vectors for the calculation of Q6. For any given particle with NN vectors r, Q6 is defined as
Figure 2A shows a snapshot from one of the monosized simulations with particles colored according to their Q6 value, as calculated from Eq. 2. This snapshot shows large regions with the typical, clearly visible hexagonal order observed in such systems. The probability distribution function (PDF) of Q6 taken over all particles in this snapshot is shown in Figure 2B. The peak at around 0.75 correspond to the large number of particles with neighbors in hexagonal arrangement: a hexagonal arrangement yields Q6 ≈ 0.740829 (Steinhardt et al., 1983).
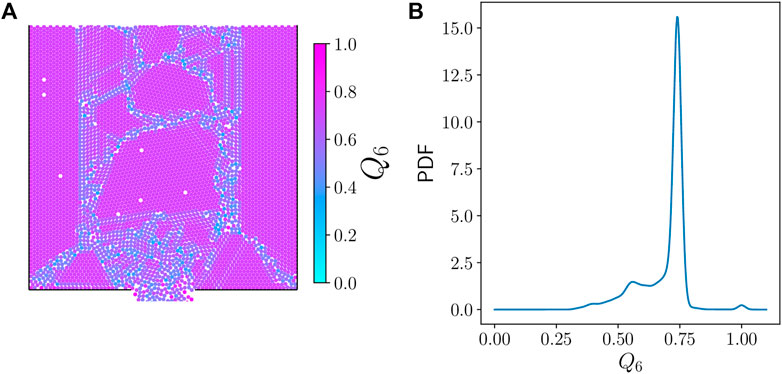
FIGURE 2. (A) Snapshot of a simulation of 10,000 disks of the same diameter d. Particles are colored according to their Q6 bond order parameters. (B) Probability distribution function (PDF) of Q6 in the snapshot shown in part a.
In Figure 3 we show some snapshots of monosized and binary systems during the steady state of the discharge with particles colored according to their Q6 values. Monodisperse systems show clear ordered regions, especially at the stagnant zones at each side of the orifice and upstream away from the orifice. Close to the orifice, the system needs to dilate to be able to flow, and this leads to disorder. For binary systems, the ordering is significantly reduced: the larger the particle size ratio, the less order is observed. The PDFs of Q6 for each mixture simulated are shown in Figure 4. These PDFs are built from the set of snapshots taken during the simulations in the steady-state discharge. For α close to one, the PDF displays a clear peak at Q6 ≈ 0.74 that corresponds to a hexagonal arrangement of the neighbors (Steinhardt et al., 1983). As α increases, this peak drops quickly and lower Q6 values are populated, indicating a loss of hexagonal order in the bulk of the material.
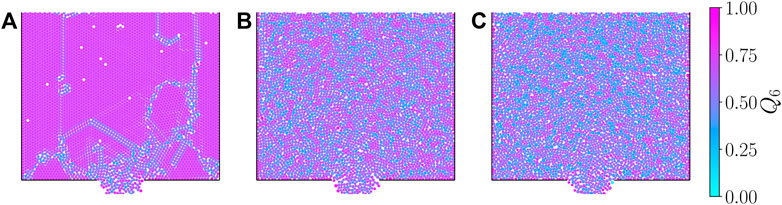
FIGURE 3. Snapshots of simulations with binary mixtures of same
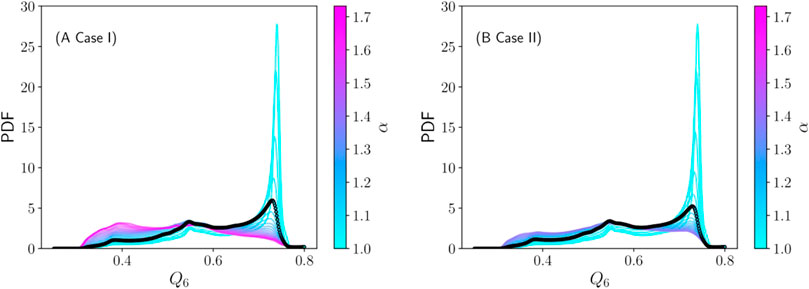
FIGURE 4. PDF of Q6 for mixtures with NL = NS (A, Case I) and ML = MS (B, Case II) for varying α (see color scale). The thick black line corresponds to the α-value at which the maximum flow rate is observed (see Figure 7).
To quantify ordering globally, we measure the height of the peak of the Q6 PDF at
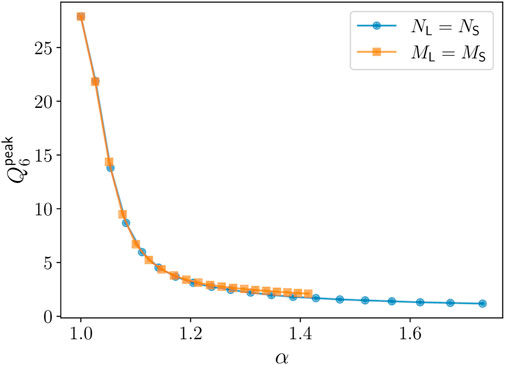
FIGURE 5. Height
3.2 Flow rate and mean particle diameter
The mass flow rate is measured by plotting the mass of grains that crosses the orifice plane as a function of time, as shown in Figure 6, and fitting a straight line to the portion of the curve where the flow rate is constant to avoid the initial transient.
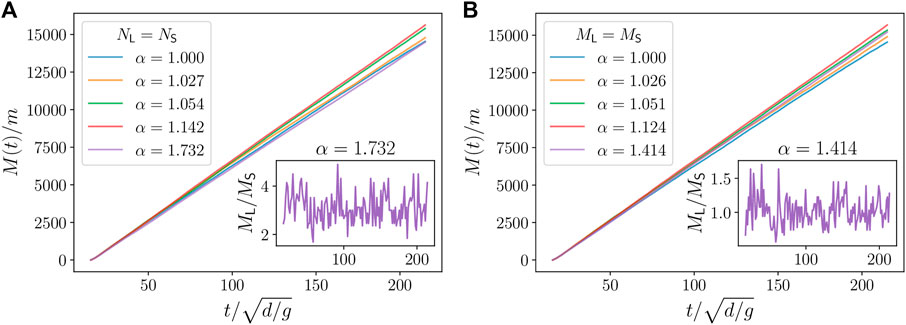
FIGURE 6. Discharged mass as a function of time for different α for some sample simulations of Case I (A) and Case II (B), with the mixtures as defined in Tables 1, 2, respectively. Inset: “Instantaneous” mass ratio ML/MS discharged as a function of time for the largest value of α studied in each case. The instantaneous mass ratio is sampled over short intervals of time during which roughly 100 particles flow out.
In Figure 7 we show the total mass flow rate W as a function of α for cases I and II, determined both from the mass of grains crossing the orifice over time and from spatial analysis, as described in Section 3. Beyond run-to-run fluctuations, W clearly varies nonmonotonically with α despite the mean particle size being roughly the same in all mixtures. Given that hexagonal order decays monotonically with α, we therefore cannot conclude that there is a correlation between ordering and flow rate. The variation of W is about 8%, which is discernible considering the error bars (standard deviation over realizations) and beyond the variations in mean particle size from 1.0 discussed in Section 2. Monosized (or close to monosized) systems present the lowest flow rate and a maximum is observed at α ≈ 1.15. Interestingly, for the largest size ratios the flow rate cannot be distinguished from that of the monosized system considering the fluctuations among realizations. It is important to note, however, that the monosized system presents larger run-to-run fluctuations in comparison with bidisperse mixtures with α > 1.2.
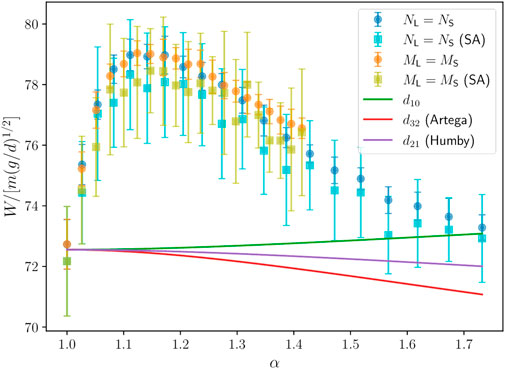
FIGURE 7. Total flow rate W as a function of α for Case I (NL = NS) and Case II (ML = MS). Error bars correspond to the standard deviation over 20 realizations of each mixture. The flow rate is calculated both via the slope in Figure 6 (circles) and via the spatial analysis (SA) of density and velocity profiles in Figure 10 (squares). Solid lines correspond to the Beverloo equation corrected by setting the mean particle diameter
Jacobs-Capdeville et al. (2023) has shown a monotonic variation for constant median particle size as the width of the log-normal particle distribution (in the log-normal distribution the size ratio is defined by the sizes of the 10th and 90th percentiles of the distribution) is increased for 3D silos. However, the size ratios investigated (2.0 < α < 8.0) in their study are outside the range we consider here, which are closer to the monodisperse limit. (And, of course, we study a 2D system.) Interestingly, in Ref. (Jacobs-Capdeville et al., 2023). the flow rate increases with α if the size distribution is particle number-based (equivalent to our Case I) but decreases with α if it is particle volume-based (equivalent to our Case II).
The Beverloo equation (Eq. 1) can be used to estimate the flow rate of a mixture using
As we mentioned in Section 2, the mean particle size can be defined in many different ways. Artega and Tüzün (1990) used a volume (area in 2D) weighted definition
Figure 8 depicts the flow rate as a function of the global hexagonal order
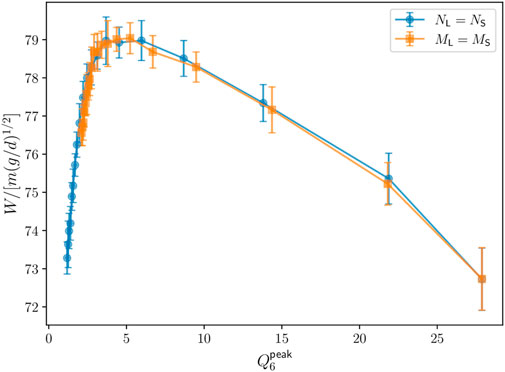
FIGURE 8. Total flow rate W as a function of the descriptor of global order
Before proceeding, we note here that we do not observe segregation during discharge as we vary the dispersity of the system. As a demonstration, in the insets to Figure 6, we show the instantaneous ratio between the discharged mass of each species (ML/MS) as a function of time for the largest α simulated in each case. As we can see, this ratio remains constant, albeit fluctuating, during the simulation.
3.3 Spatial analysis: packing fraction and velocity profiles along orifice
In order to investigate the origin of the small effect on flow rate caused by size dispersion in binary systems, we have measured the packing fraction ϕ(x) and vertical velocity v⊥(x) profile at the plane of the orifice. For a continuum, the mass flow rate is calculated from the integral
where ρ is the 2D material density of the particles. To estimate W from simulation data, we measure packing fraction and velocity profiles along the orifice and carry out a discrete summation.
The packing fraction and velocity profiles at the orifice are obtained from a series of snapshots saved during the simulations (as described in Section 2) which contain the particle positions and velocities. The orifice cross-section is binned in rectangles d/2-wide and d/2-tall, with the top edge of each bin along the orifice plane, as depicted in Figure 9. The packing fraction in each bin in a single snapshot is determined as the area occupied by grains that overlap with the bin divided by the area of the bin. The average packing fraction in a given bin is then computed across all snapshots. The velocity of grains in each bin in a single snapshot is determined by averaging the velocities of any grains that intersect with the bin area. Then, as with packing fraction, the average velocity vector for the steady state flow is computed across snapshots. We note that the mass flow rate obtained using this method will depend on the height of the sampling box and its vertical position with respect to the orifice. If the bins fall within the silo area, not all of the flow rate in the plane at the bottom of the silo is captured.
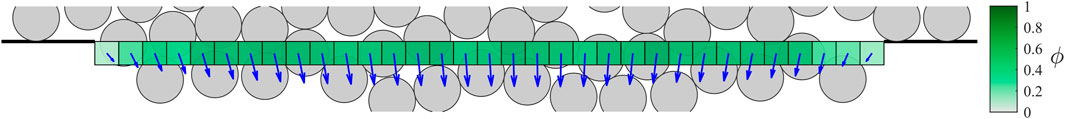
FIGURE 9. Sample diagram of the binning used to calculate the velocity and packing fraction profiles through spatial analysis. The blue vectors correspond to the average velocity in a bin for a single simulation realization; shading of the bin indicates the average packing fraction for a single realization.
Figure 7 serves as a validation that the flow rate extracted from the profiles coincides with that obtained from the count of particles crossing the orifice line over time. From Figures 10A, C it is apparent that the packing fraction profile is not affected by α nor the mix rate used (see also Figure 10E). Indeed, the main difference caused by the size dispersion is variation in the velocity profiles (Figures 10B, D). The velocity profile conserves its functional form as α grows, but the maximum velocity (at the center of the outlet) varies (see Figure 10F) in the same proportion as the flow rate (cf. Figure 7). This observation is consistent with previous studies that show a stronger change in particle velocity at the orifice than in packing fraction as the composition of a binary mixture is varied, even with non-constant
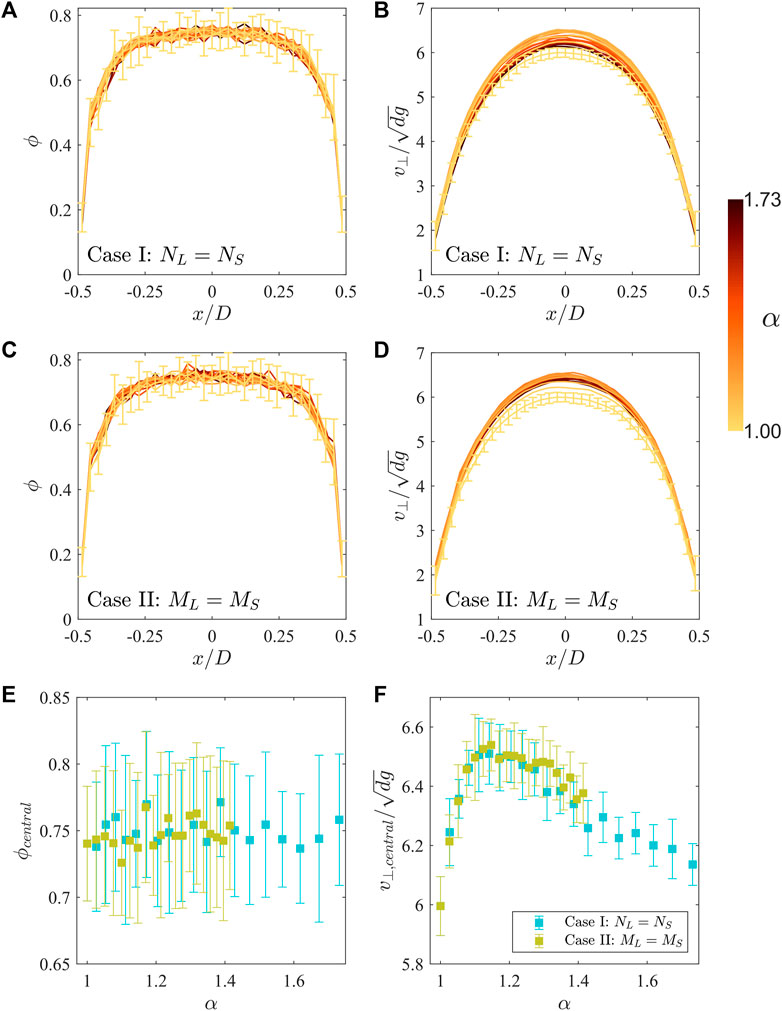
FIGURE 10. Spatial analysis profiles across the silo orifice of the packing fraction (A,C) and the vertical velocity (B,D) in Cases I and II. Error bars, computed as the standard deviation across all 20 realizations per condition, are shown for the α = 1 profiles and are representative of the scale of error bars on the other profiles. (E,F) show the packing fraction and vertical velocity at the center of the orifice profile as a function of α; error bars denote standard deviation across realizations.
A constant packing fraction profile at the orifice plane is a strong indication that some intuitive predictions for mixed particle sizes are unwarranted. A mix of particle sizes tends to produce higher packing fractions in the bulk (Artega and Tüzün, 1990). Naturally, this may mislead us to expect a higher flow rate. However, Figures 10A, C clearly show that the relevant packing fraction that defines flow rate, i.e., that measured at the orifice plane, is in fact unaffected.
Currently, we cannot offer a plausible mechanism for the nonmonotonic variation of the particle velocities at the outlet with size ratio α. However, we argue that this cannot be related with hexagonal ordering in the bulk. The particle velocities at the orifice–a region were the material is dilated–are likely not determined by the existence or lack of ordering in the bulk of the container.
3.4 Small orifice size
The results shown in the preceding sections correspond to discharges through an orifice of size D = 16.9d, large enough to be well beyond the clogging regime. To assess if our main observations hold for small orifices, we have run simulations for Case I using the smallest orifice for which we observed steady-state flow without clogging across all α: D = 7.3d. In Figure 11A, we show the PDF of Q6 for each α during the steady state. The trends observed for the larger orifice are also present here, though we do observe a smaller height of the main peak for the monosized case in comparison with the larger orifice. As observed in the snapshot displayed in the inset to Figure 11A, this smaller peak seems to be associated with a large number of small, ordered regions with boundary defects in-between. The flow through larger orifices is likely to help “anneal” these defects and increase the size of the ordered domains. However, detailed study of these domains is beyond the scope of the current work.
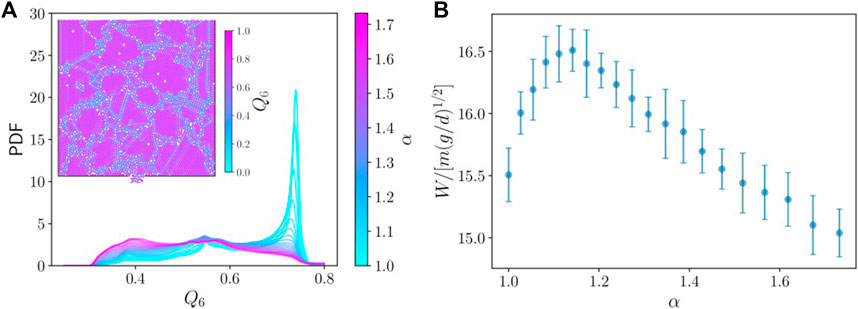
FIGURE 11. (A) PDF of Q6 for mixtures with NL = NS (Case I) with D = 7.3d for varying α (see color scale). Inset: Snapshot during the discharge of a monosized sample. Particles are colored according to their Q6 bond order parameters. (B) Total flow rate W as a function of α for Case I. Error bars correspond to the standard deviation over 20 realizations of each mixture.
We plot the flow rate through the small orifice as a function of α in Figure 11B. As for the large orifice, the flow rate is nonmonotonic and presents a maximum at α ≈ 1.15. Again, the difference between the maximum flow rate and the monosized case is around 8%, and for larger values of α the flow rate is indistinguishable from the monosized system. Therefore all of the features presented in this work for a larger orifice hold even for a small orifice near the clogging regime.
4 Conclusion
We have simulated 2D binary systems of granular disks discharging through an orifice at the bottom of a silo. We have prepared systems with a fixed (number weighted or mass weighted) mean particle diameter. Bidisperse systems can prevent the formation of hexagonal order regions in 2D systems. However, the flow rate is only partially affected. Some binary mixtures (with a little hexagonal order) present up to 8% higher flow rates. Interestingly, other mixtures with no hexagonal order display the same flow rate as a monosized system that presents highly ordered domains. These observations are valid, both for large and small orifices.
The small change in flow rate when varying size ratio seems to be entirely due to a change in the velocity of the flow rather than different packing fractions at the orifice. For a static sample, when a monosized system is replaced by a bidisperse mixture, one expects an increase in packing fraction. However, the packing fraction of a granular material flowing through a constriction does not need to follow this rule. Since the local packing fraction at the orifice is not correlated with ordering in the bulk, we argue that changes in the flow rate, which are only explained by particle velocities, are not likely to be correlated with ordering that is observed away from the outlet. Our results suggest that, for some purposes, using a monosized system of grains that displays clear ordering may be as representative of a realistic system as a mixture that shows no obvious ordering.
Data availability statement
The raw data supporting the conclusion of this article will be made available by the authors, without undue reservation.
Author contributions
MC: Conceptualization, Formal Analysis, Funding acquisition, Investigation, Methodology, Software, Writing–original draft, Writing–review and editing. RK: Conceptualization, Formal Analysis, Funding acquisition, Software, Writing–original draft, Writing–review and editing. LP: Conceptualization, Formal Analysis, Funding acquisition, Writing–original draft, Writing–review and editing.
Funding
The author(s) declare that financial support was received for the research, authorship, and/or publication of this article. This work was partially funded by CONICET (Argentina) through grant PIP-717 and UNLPam (grant F65). MC is thankful for the financial support from CONICET (Grant No. PUE 2018 229 20180100010 CO) and UTN (Grant No. MAUTILP0007746TC). RK thanks College of the Holy Cross for financial support.
Acknowledgments
We are indebted to Douglas J. Durian for valuable discussions during the course of this research.
Conflict of interest
The authors declare that the research was conducted in the absence of any commercial or financial relationships that could be construed as a potential conflict of interest.
The author(s) declared that they were an editorial board member of Frontiers, at the time of submission. This had no impact on the peer review process and the final decision.
Publisher’s note
All claims expressed in this article are solely those of the authors and do not necessarily represent those of their affiliated organizations, or those of the publisher, the editors and the reviewers. Any product that may be evaluated in this article, or claim that may be made by its manufacturer, is not guaranteed or endorsed by the publisher.
References
Aguirre, M. A., Grande, J. G., Calvo, A., Pugnaloni, L. A., and Géminard, J. C. (2010). Pressure independence of granular flow through an aperture. Phys. Rev. Lett. 104, 238002. doi:10.1103/physrevlett.104.238002
An, X., Yang, R., Dong, K., and Yu, A. (2011). Dem study of crystallization of monosized spheres under mechanical vibrations. Comput. Phys. Commun. 182, 1989–1994. doi:10.1016/j.cpc.2011.02.006
Anyam, V. K. R., and Anki Reddy, K. (2022). Granular mixtures discharging through a silo with lateral orifice. Phys. Fluids 34. doi:10.1063/5.0086936
Artega, P., and Tüzün, U. (1990). Flow of binary mixtures of equal-density granules in hoppers—size segregation, flowing density and discharge rates. Chem. Eng. Sci. 45, 205–223. doi:10.1016/0009-2509(90)87093-8
Ashour, A., Trittel, T., Börzsönyi, T., and Stannarius, R. (2017). Silo outflow of soft frictionless spheres. Phys. Rev. Fluids 2, 123302. doi:10.1103/physrevfluids.2.123302
Benyamine, M., Djermane, M., Dalloz-Dubrujeaud, B., and Aussillous, P. (2014). Discharge flow of a bidisperse granular media from a silo. Phys. Rev. E 90, 032201. doi:10.1103/physreve.90.032201
Beverloo, W., Leniger, H., and van de Velde, J. (1961). The flow of granular solids through orifices. Chem. Eng. Sci. 15, 260–269. doi:10.1016/0009-2509(61)85030-6
Börzsönyi, T., Somfai, E., Szabó, B., Wegner, S., Mier, P., Rose, G., et al. (2016). Packing, alignment and flow of shape-anisotropic grains in a 3d silo experiment. New J. Phys. 18, 093017. doi:10.1088/1367-2630/18/9/093017
Carlevaro, C., and Pugnaloni, L. (2011). Steady state of tapped granular polygons. J. Stat. Mech. Theory Exp. 11, 01007. doi:10.1088/1742-5468/2011/01/P01007
Carlevaro, C. M., Kozlowski, R., Pugnaloni, L. A., Zheng, H., Socolar, J. E. S., and Kondic, L. (2020). Intruder in a two-dimensional granular system: effects of dynamic and static basal friction on stick-slip and clogging dynamics. Phys. Rev. E 101, 012909. doi:10.1103/PhysRevE.101.012909
Catto, E. (2005). Iterative dynamics with temporal coherence. Available at: https://box2d.org/publications/.
Cervantes-Álvarez, A., Pacheco-Martínez, H., Acosta, C., and Carvente, O. (2023). Dynamics of a 2d silo discharge: a competition between structural domains before clogging. Phys. A Stat. Mech. its Appl. 619, 128729. doi:10.1016/j.physa.2023.128729
Dickinson, E., Milne, S., and Patel, M. (1989). Ordering in simulated packed beds formed from binary mixtures of particles in two dimensions: implications for ceramic processing. Powder Technol. 59, 11–24. doi:10.1016/0032-5910(89)80091-9
Gao, Q. Q., Chen, Y. C., and Hu, L. (2023). Effect of particle shape on packing fraction and velocity profiles at outlet of a silo. Chin. Phys. B 32, 064702. doi:10.1088/1674-1056/aca204
Geng, J., Reydellet, G., Clément, E., and Behringer, R. (2003). Green’s function measurements of force transmission in 2D granular materials. Phys. D. Nonlinear Phenom. 182, 274–303. doi:10.1016/S0167-2789(03)00137-4
Goldberg, E., Carlevaro, C. M., and Pugnaloni, L. A. (2015). Flow rate of polygonal grains through a bottleneck: interplay between shape and size. Pap. Phys. 7, 070016. doi:10.4279/pip.070016
Gray, JMNT (2018). Particle segregation in dense granular flows. Annu. Rev. Fluid Mech. 50, 407–433. doi:10.1146/annurev-fluid-122316-045201
Grindlay, J., and Opie, A. (1995). Contact force distribution in a pile of rigid disks. Phys. Rev. E 51, 718–723. doi:10.1103/physreve.51.718
Humby, S., Tüzün, U., and Yu, A. (1998). Prediction of hopper discharge rates of binary granular mixtures. Chem. Eng. Sci. 53, 483–494. doi:10.1016/s0009-2509(97)00326-6
Jacobs-Capdeville, P., Kuang, S., Gan, J., and Yu, A. (2023). Micromechanical analysis of granular dynamics and energy dissipation during hopper discharging of polydisperse particles. Powder Technol. 422, 118462. doi:10.1016/j.powtec.2023.118462
Langston, P. A., Tüzün, U., and Heyes, D. M. (1995). Discrete element simulation of granular flow in 2d and 3d hoppers: dependence of discharge rate and wall stress on particle interactions. Chem. Eng. Sci. 50, 967–987. doi:10.1016/0009-2509(94)00467-6
Liu, S., Zhou, Z., Zou, R., Pinson, D., and Yu, A. (2014). Flow characteristics and discharge rate of ellipsoidal particles in a flat bottom hopper. Powder Technol. 253, 70–79. doi:10.1016/j.powtec.2013.11.001
Madrid, M., Asencio, K., and Maza, D. (2017). Silo discharge of binary granular mixtures. Phys. Rev. E 96, 022904. doi:10.1103/physreve.96.022904
Mankoc, C., Janda, A., Arevalo, R., Pastor, J., Zuriguel, I., Garcimartín, A., et al. (2007). The flow rate of granular materials through an orifice. Granul. Matter 9, 407–414. doi:10.1007/s10035-007-0062-2
Moreau, J. J. (1988). “Unilateral contact and dry friction in finite freedom dynamics,” in Nonsmooth mechanics and applications (Berlin, Germany: Springer), 1–82.
Pongó, T., Fan, B., Hernández-Delfin, D., Török, J., Stannarius, R., Hidalgo, R. C., et al. (2022). The role of the particle aspect ratio in the discharge of a narrow silo. New J. Phys. 24, 103036. doi:10.1088/1367-2630/ac9923
Pytlos, M., Gilbert, M., and Smith, C. C. (2015). Modelling granular soil behaviour using a physics engine. Géotechnique Lett. 5, 243–249. doi:10.1680/jgele.15.00067
Radjaï, F., Jean, M., Moreau, J. J., and Roux, S. (1996). Force distributions in dense two-dimensional granular systems. Phys. Rev. Lett. 77, 274–277. doi:10.1103/PhysRevLett.77.274
Reddy, A. V. K., Kumar, S., and Reddy, K. A. (2021). Granular particle-shape heterogeneous mixtures discharging through a silo. J. Fluid Mech. 912, A22. doi:10.1017/jfm.2020.1071
Sakaguchi, H., Ozaki, E., and Igarashi, T. (1993). Plugging of the flow of granular materials during the discharge from a silo. Int. J. Mod. Phys. B 7, 1949–1963. doi:10.1142/s0217979293002705
Sands, D. J. (2000). “Powders, and grains: an introduction to the physics of granular materials,” in Partially ordered systems (New York: Springer-Veriag).
Steinhardt, P. J., Nelson, D. R., and Ronchetti, M. (1983). Bond-orientational order in liquids and glasses. Phys. Rev. B 28, 784–805. doi:10.1103/physrevb.28.784
Tang, J., and Behringer, R. P. (2016). Orientation, flow, and clogging in a two-dimensional hopper: ellipses vs. disks. Europhys. Lett. 114, 34002. doi:10.1209/0295-5075/114/34002
Tsuchikusa, K., Yamamoto, K., Katsura, M., de Paula, C., Modesto, J., Dorbolo, S., et al. (2023). Disordering two-dimensional magnet-particle configurations using bidispersity. J. Chem. Phys. 158, 214501. doi:10.1063/5.0149803
Keywords: granular matter, silo discharge, bidispersity, ordering, flow rate
Citation: Carlevaro CM, Kozlowski R and Pugnaloni LA (2024) Flow rate in 2D silo discharge of binary granular mixtures: the role of ordering in monosized systems. Front. Soft Matter 4:1340744. doi: 10.3389/frsfm.2024.1340744
Received: 18 November 2023; Accepted: 02 January 2024;
Published: 12 January 2024.
Edited by:
Payman Jalali, Lappeenranta University of Technology, FinlandCopyright © 2024 Carlevaro, Kozlowski and Pugnaloni. This is an open-access article distributed under the terms of the Creative Commons Attribution License (CC BY). The use, distribution or reproduction in other forums is permitted, provided the original author(s) and the copyright owner(s) are credited and that the original publication in this journal is cited, in accordance with accepted academic practice. No use, distribution or reproduction is permitted which does not comply with these terms.
*Correspondence: C. Manuel Carlevaro, bWFudWVsQGlmbHlzaWIudW5scC5lZHUuYXI=