A supervisory Volt/Var control scheme for coordinating voltage regulators with smart inverters on a distribution system
 Valliappan Muthukaruppan
 Yue Shi2
 - 1Exelon Corporation, Chicago, IL, United States
- 2Boston Energy Trading and Marketing LLC, Boston, MA, United States
- 3Department of Electrical and Computer Engineering, North Carolina State University, Raleigh, NC, United States
This paper concentrates on the efficient utilization of smart inverters for Volt/Var control (VVC) within a distribution system. Although new smart inverters possess Var support capability, their effective deployment necessitates coordination with existing Volt/Var schemes. To address this, a novel VVC scheme is proposed to facilitate such synchronization. The proposed scheme bifurcates the issue into two levels. The initial level involves utilizing Load Tap Changer (LTC) and Voltage Regulators (VRs), coordinating their control with smart inverters to regulate the circuit's voltage levels within the desired range. The subsequent level determines the Var support required from smart inverters to minimize overall power loss in the circuit. The supervisory control results are communicated to the respective devices equipped with their local controllers. To minimize frequent dispatch, smart inverters are supervised by adjusting their Volt/Var characteristics as necessary. This approach enables the smart inverters to operate near their optimal control while meeting the limited communication prerequisites in a distribution system. A case study employing the IEEE 34 bus system illustrates the efficacy of this supervisory control scheme in contrast to traditional Volt/Var schemes.
1 Introduction
Current Volt/Var control (VVC) schemes, widely employed by numerous utilities, rely on legacy control devices like capacitor banks, load tap changers, and voltage regulators. Their primary objective is to maintain voltage levels across the feeder within the ANSI limit (ANSI, 2020). However, the recent surge in the deployment of distributed energy resources (DERs) within the distribution system poses challenges to the efficacy of these traditional VVC schemes (Sharma et al., 2020). Conversely, it has been acknowledged that the inverters utilized in most DERs possess the capability to offer Var support. In order to promote the utilization of this new capability, IEEE Std. 1547 underwent revision, leading to the development of new operating modes featuring varying Volt-Var characteristics (VVar-C) tailored for these advanced smart inverters (SIs) (IEEE, 2018). Nonetheless, for these SIs to significantly contribute to VVC, careful selection and periodic updating of their VVar-C according to evolving system conditions are crucial (Singhal et al., 2019).
The VVar-C based control for SIs represents a widely accepted local control framework integrated into the IEEE 1547 standard (IEEE, 2018) and adopted by Rule 21 in California (CPUC, 2022). In Jahangiri and Aliprantis (2013), the author highlights the effectiveness of local control in addressing voltage rise problems stemming from high Photovoltaic (PV) penetration. However, the author also underscores the occurrence of oscillatory issues, even when employing a single SI with a droop control scheme. In Singhal et al. (2019), the author tackles issues related to low steady-state error (SSE) and stability/convergence in droop control by dynamically adjusting the droop parameters. Additionally, Ding et al. (2018) introduces a VVC scheme utilizing legacy devices while integrating SIs with fixed VVar-C characteristics.
An alternative strategy involves treating Smart Inverters as controllable Var sources, framing the issue as an Optimal Power Flow (OPF) problem (Farivar et al., 2013; Dall'Anese et al., 2014; Robbins and Domínguez-García, 2016). Addressing the computational complexities, Jha et al. (2019) and Xu et al. (2019) propose two control loops operating on different timescales. The slower update loop manages the dispatch of legacy devices, while the faster update loop focuses on dispatching SIs through a separate Var optimization problem. However, this method encounters a significant computational burden due to the substantial number of discrete variables required to represent VR operations. To resolve this challenge, we propose an efficient search algorithm aimed at determining the optimal tap positions of VRs.
An obstacle in deploying an OPF-based scheme is the limitation posed by the distribution-level communication infrastructure, making frequent dispatching signals impractical (Neal and Bravo, 2011; Manbachi et al., 2015; Muthukaruppan and Baran, 2020).
This paper addresses these challenges by introducing a new coordinated VVC scheme. Instead of directly dispatching Var requirements, this approach involves periodic adjustments to the Volt-Var settings of SIs. Moreover, the paper proposes a computationally efficient VVC method, designed to ease implementation in real-world applications. This method not only reduces the reliance on legacy devices but also capitalizes on the rapid response capabilities of smart inverters. The primary contributions of this paper can be summarized as follows:
• The original Volt-VAR Optimization (VVO) problem, a variant of the optimal power flow problem, is classified as NP-hard. Some methods proposed involve convex relaxation of the non-convex problem, leading to semi-definite (Zhang et al., 2015) or second-order cone programming problems (Zheng et al., 2016). However, while these approaches can find a global optimal solution under certain system conditions, they fail to manage discrete or integer variables linked with LTC and VR control (Bazrafshan et al., 2019). Conversely, linearizing the initial power flow problem permits the integration of LTC/VR control, enabling complete device coordination. Nonetheless, the exponential increase in discrete variables due to LTC/VR control may be unmanageable for larger systems (Jha et al., 2019). To resolve these issues, this work proposes a gradient-based two-stage optimization framework. This framework coordinates LTC and VR device control with smart inverters to minimize overall power loss in the circuit. It introduces an efficient search algorithm for VR/LTC control, reducing the search space of tap positions. This coordination offers multiple advantages, such as efficient voltage regulation with minimal tap changes compared to traditional VVO schemes.
• In response to the limited communication infrastructure available in the field, a new dispatching scheme is proposed to send optimal Var commands to inverters by adjusting existing Volt/Var curves. This approach reduces reliance on a central controller for voltage regulation and optimizes reactive power injections under various operating conditions. The dispatch scheme is structured to minimize communication requirements. With this approach, smart inverters can continue injecting reactive power close to the optimal value between dispatch intervals.
• Although fixed VVar-C curves effectively regulate local voltage, they can escalate the required var injections due to the lack of coordination among inverters. This increased injection leads to higher overall power loss in the circuit during regulation. Shifting the Volt/Var curves based on the optimal solution from the central VVO problem demonstrates improved coordination among inverters. This enhancement allows for efficient utilization of devices based on their size and location, subsequently reducing overall reactive power requirements and losses incurred during voltage regulation.
The subsequent sections of this paper are structured as follows: Section 2 introduces our proposed coordination strategy for simultaneous dispatching of LTC/VR and smart inveters. In Section 2.2, we present the strategy of shifting curves for dispatching smart inverters, aiming to mitigate the issue of frequent dispatch. The performance evaluation of the proposed control is conducted using a test system in Section 3.
2 Supervisory VVO
The integration of DERs, particularly PVs, into distribution systems poses challenges for existing VVC schemes. The high penetration of PVs introduces power fluctuations caused by factors like cloud movements, leading to rapid voltage fluctuations. Conventional voltage control devices, such as VRs and LTCs, are forced to switch frequently in response to these deviations (Seguin et al., 2016), resulting in a shortened device lifespan and an increased risk of premature failure.
The introduction of VVar-C curves through Smart Inverters provides an opportunity to mitigate above mentioned issues in current VVC schemes. The focus of this study centers on implementing a VVC scheme within a utility's distribution system, specifically integrating Smart Inverters. This proposed VVC scheme serves two main objectives: (i) coordinating the operation of SIs with the utility's Volt-Var devices and (ii) ensuring computational efficiency for seamless practical implementation.
In this scenario, a centralized VVC scheme emerges as the most effective approach to ensure smooth coordination between utility VVC tools and SIs. Given the critical necessity for rapid controller response at the distribution level, communication infrastructure typically relies on radio-mesh/cellular-based systems. Moreover, the intermittent nature of DERs requires swift dispatch actions. In this work, it is assumed that the utility possesses a robust distribution Supervisory Control and Data Acquisition (SCADA) system capable of gathering field data for control cycles.
The proposed centralized scheme oversees both conventional VVC devices and SIs under utility control, providing supplementary Var support. To handle computational complexities efficiently, a two-stage optimization scheme is adopted. Stage-1 involves the use of smart inverters and conventional devices to establish a feasible operating point, setting the stage for Stage-2, which optimizes smart inverters to minimize the total power loss in the circuit.
The flowchart depicted in Figure 1 illustrates the proposed architecture. Initially, smart inverters take charge of circuit voltage regulation. If these inverters reach their limits while attempting voltage regulation, legacy devices step in. During Stage-1, the primary goal is to bring the voltage within ANSI limits. However, if certain inverters hit their reactive power limits during voltage regulation, Stage-2 encounters challenges in finding an optimal solution for minimizing total circuit loss using reactive power. Consequently, VR/LTC devices regulate voltage while maintaining zero inverter injections, enabling Stage-2 to determine an optimal set point for the inverters to minimize total loss.
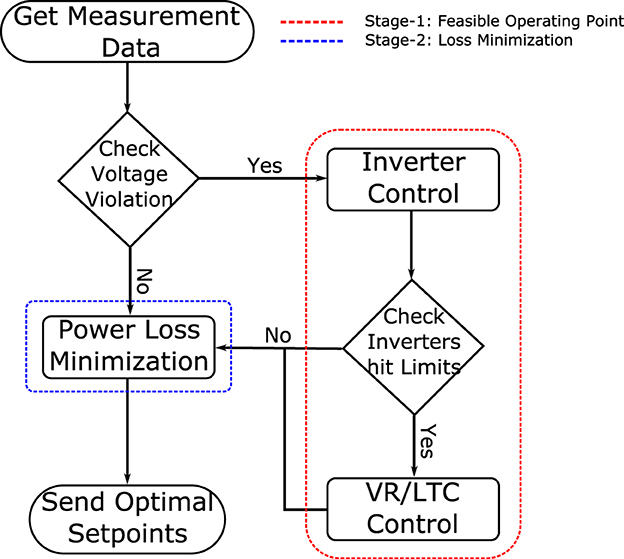
Figure 1. Flowchart of proposed coordinated Volt/Var control algorithm.
2.1 Stage-1: feasible operating point
This phase involves updating supervisor-set points for the LTC, VRs, and inverters to effectively manage voltage regulation. The primary objective of stage-1 is to establish an attainable operating point, essential for stage-2 to swiftly derive an optimal solution aiming to minimize overall power loss within the system.
To mitigate the usage of legacy devices, which are prone to mechanical wear and tear due to frequent operation, a strategic approach is adopted. Initially, priority is given to smart inverters in the voltage control process, striving to bring the voltage within ANSI limits (V ∈ [0.95, 1.05]p.u.). Legacy devices, specifically LTCs and VRs, are employed for voltage regulation only if the smart inverters reach their power limits or if voltage violations persist despite the initial inverter operation.
2.1.1 Inverter control
The objective of inverter control in stage-1 is to flatten the voltage across the system. Let g(v, q) denote the power flow constraints which is a set of equations as shown in Equations (1, 2) where is the set of system nodes.
Where, is the real power generation from PV at node i, is the real power consumption at node i, is the reactive power injection from smart inverters, and is the reactive power consumption. θij = θi − θj is the voltage difference between node i and j, Gij + jBij = Yij is the element of Y-bus matrix. The mathematical formulation of this problem is given in Equation (3) which is solved using a gradient-descent approach.
Here, vref is the desired voltage profile through out the system, generally fixed at 1.0 p.u., and v is the vector of voltage magnitudes and q is the vector of reactive power injections.
2.1.2 VR/LTC control
As mentioned earlier, the control of LTC/VR devices is employed only when smart inverters are unable to effectively regulate the voltage. Both LTC and VR tap positions are discrete, typically having 33 taps (including the zero-tap position), with each tap representing a 0.00625 p.u. voltage change. While LTCs at substations are commonly gang-operated in three phases, VRs are typically controlled on a per-phase basis to enable independent voltage adjustments for each phase.
Due to the discrete nature of tap control, performing an exhaustive search for possible tap settings can be computationally daunting. For R single-phase controlled regulators and K three-phase controlled regulators, the total search space expands to 333R+K. For instance, in a system equipped with one LTC and one VR, the total possible tap combinations amount to 33 × 33 × 33 × 33 = 1,185,921. To mitigate this exhaustive search, a method based on Ozdemir et al. (2016) has been devised. This method capitalizes on the observation that minor tap adjustments are usually sufficient. Instead of exploring all 33 taps, the method reduces the feasible search space to a maximum of two to three taps up or down, denoted as ΔTap = {0, ±1, ±2, ±3}.
In this study, the search space is further constrained by applying additional rules, as illustrated in Figure 2. As depicted, voltage calculations involve varying the voltage control device closest to the substation (e.g., LTC) with a tap adjustment TapLTC(k)∈ΔTap, while maintaining a constant tap position for downstream voltage control devices. Over-voltage violations trigger a search for downward taps in downstream devices, whereas under-voltage violations prompt searches for upward taps in downstream devices. Here, “p” represents the corresponding phase of the voltage regulator. A backward-forward three-phase distribution power flow solver is utilized to determine voltages for various tap combinations during the search. This approach reduces the overall search space to an average of 33R + K and a worst-case scenario of 73R + 3K.
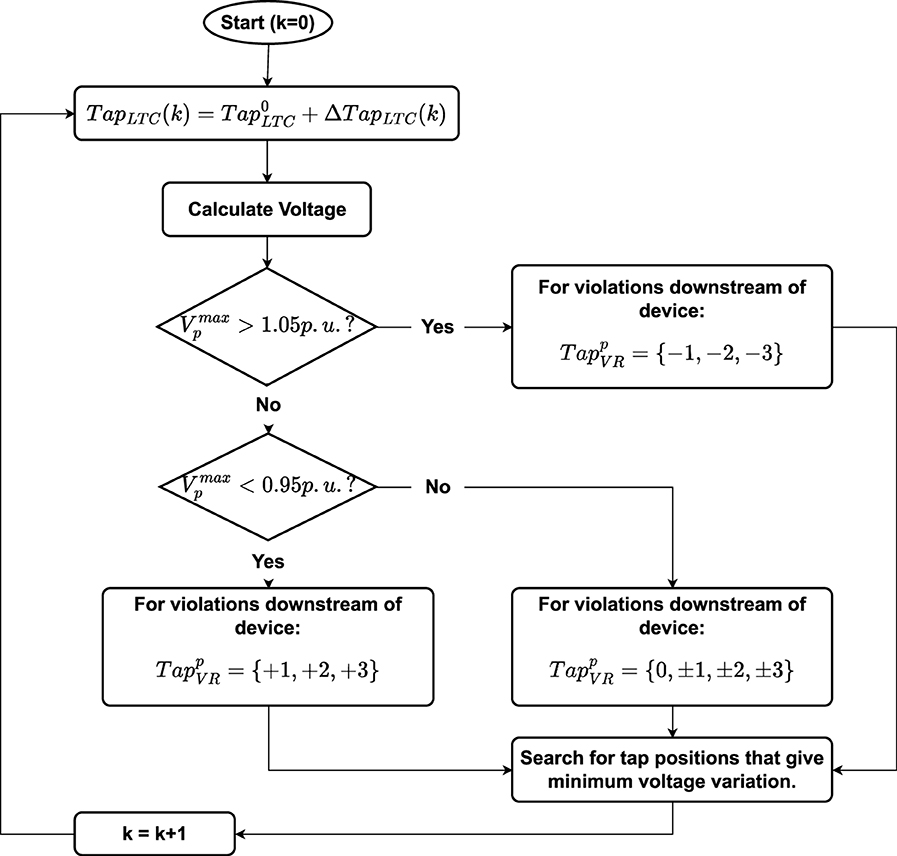
Figure 2. Flowchart of VR/LTC module.
Given numerous tap settings that bring voltages within limits, a criterion is essential to determine preferred legacy device settings. In our approach, maintaining a flat voltage profile is chosen as the criterion, aligning with the preferred voltage profile for a feeder. Consequently, during the search, feasible VR settings are ranked using the voltage variance criterion as expressed in Equation (4). Post-search, VR tap settings producing the best voltage profile are selected as the new settings for VRs. Typically, Vref is chosen as 1.0 p.u., and achieving a flat voltage profile can potentially lead to reduced power loss and consumption in the circuit through Conservation Voltage Reduction (CVR) (Jha et al., 2019).
2.2 Stage-2: loss minimization
The Var compensation loop aims to optimally dispatch reactive power injections from inverters to minimize total power loss within the circuit while maintaining voltages within specified limits. The mathematical formulation of this objective is described in Equation (5), solved using a gradient-descent approach:
However, due to limited communication infrastructure and bandwidth constraints, utilities face challenges in frequently dispatching optimal var commands to inverters. Solely relying on a local control approach using VVar-C significantly impacts operational optimality since they are primarily designed to bring voltages within limits without an optimal control strategy.
This study proposes a novel dispatch strategy for inverters. It integrates var commands derived from a centralized optimization problem into the current VVar-C of inverters, ensuring minimal communication requirements.
Typically, VVar-C is characterized by a slope ΔQ and a reference point Vref using four defining points (V1, Q1), (V2, Q2), (V3, Q3), and (V4, Q4) as illustrated in Figure 3. Here, Q1 and Q4 correspond to the inverter's Qlim, while Q2 and Q3 are generally 0.
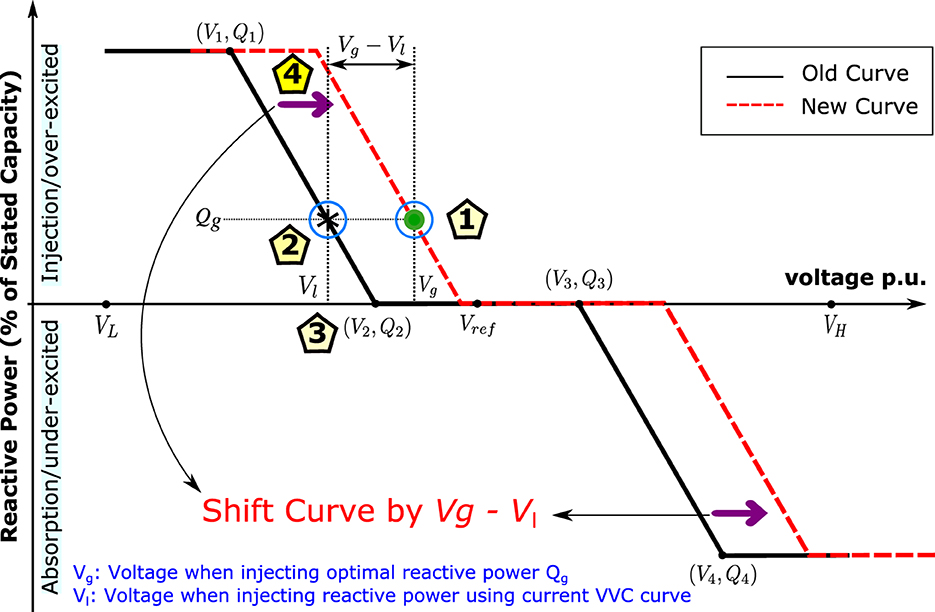
Figure 3. VVar-C shifting strategy.
In Zhou et al. (2021), the author elaborates on local control engineering and presents a framework for interpreting the dynamic nature of VVar-C as a distributed optimization problem. This approach aims to minimize system voltage deviation from nominal value (vref) while simultaneously reducing required reactive power provisioning at each inverter.
Furthermore, Zhou et al. (2021) demonstrates that the equilibrium point of this curve (v*, q*) satisfies both the power flow equations g(v*, q*) and the VVar-C curve q* = f(v*). This theorem is utilized to shift the VVar-C from the current curve to a new curve based on the optimal solution (v*, q*) obtained from the centralized optimization problem. The Theorem (2.1) affirms that by shifting the curve, the new equilibrium point of the curve post-dynamics will be the optimal setpoint (v*, q*).
Theorem 2.1. For a given optimal power flow solution (vg, qg) corresponding to an operating point, if we shift the existing Volt/Var curves q = f1(v − vref), where represents the collection of Volt/Var functions for all inverters in the system, along the voltage axis by vg − vl, and denotes the voltage corresponding to qg on the existing Volt/Var curve f1, this action will yield a new set of Volt/Var curves f2. Notably, the equilibrium point for these shifted curves f2 will precisely align with (vg, qg) as described in Equation (6).
Proof. Let g(v, q) = 0 denote the three-phase power flow solution of an unbalanced distribution system.
Let q = f(v − vref) denote the Volt/Var control function where f: Rn→Ω denote the set of individual inverter Volt/Var functions fi: R→Ωi. Note that q∈Ω and where, is determined by the inverter limits. Generally, qi is 0 and is the available reactive power determined by the current real power output and inverter size.
A point (v*, q*) is an equilibrium point of control function f if it satisfies Equation (7) (Zhou et al., 2021):
Given an optimal power flow solution (vg, qg) which implies g(vg, qg) = 0. This point will not be an equilibrium point of f but we can still find a voltage vl corresponding to qg since qg ∈ Ω as the inverter limits are included as a constraint in optimal power flow problems. This implies or qg = f(vl − vref), note that f−1 exist since f is non-increasing. (vl, qg) will not be an equilibrium point since it does not solve the power flow equations, g(vl, qg) ≠ 0.
By shifting the function f along the voltage axis by vg−vl we have,
Equation (8) shows that (vg, qg) is a solution of the shifted function f(v − vref + vg − vl) and it is also the equilibrium point of the system since it satisfies the power flow equations g(vg, qg) = 0. The direction of shift will be implicitly taken care by the sign of vg − vl.
This shows that the optimal inverter set point can be dispatched to inverters without modeling the Volt/Var curves in the opitmal power flow problem which can become computationally intesive. There are no restrictions on the Volt/Var curve f and the optimal power flow problem, so any objective can be utilized and the Volt/Var function f can be continuously shifted by using the previous curve information.
The Theorem 2.1 asserts that by shifting the four setpoints of the curve by vg − vl, the new equilibrium point will indeed converge to (vg, qg). It's crucial to note that the direction of shift is intrinsically handled by the sign of the difference vg − vl. The dispatching algorithm, expounded in Algorithm 1, is elucidated in Figure 3. This algorithm encapsulates the process of shifting the VVar-C setpoints to achieve the desired equilibrium point (vg, qg).
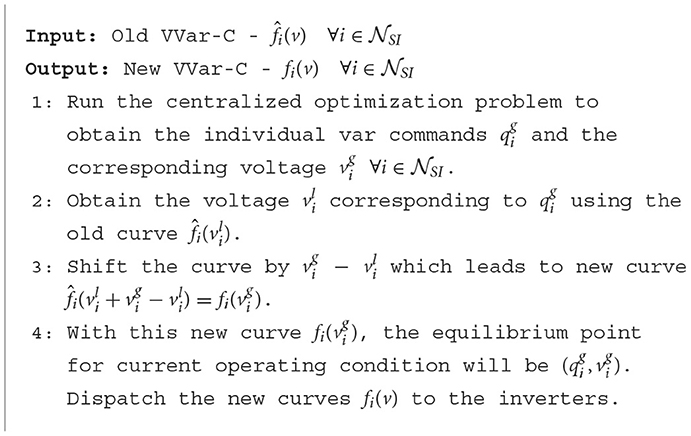
Algorithm 1. VVar-C shifting algorithm.
In this framework, only the shift in the curve (vg−vl) needs to be communicated to each individual inverter instead of dispatching all four setpoints. This significantly reduces the communication overhead required. Moreover, when the value of qg is very small (e.g., below 0.1 p.u), the new curve is not dispatched, and that specific inverter remains at the old curve. This approach further diminishes the communication burden.
It's important to emphasize that with this shifting strategy, modifications are made solely to the vref of the inverters, while retaining the same slope for the VVar-C. This approach effectively mitigates any stability issues in the control system.
3 Case study
A modified version of the IEEE 34 node system is utilized for simulating the test cases as shown in Figure 4. This altered test feeder replicates an actual rural Arizona feeder, with the removal of the transformer between nodes 832 and 888 from the original configuration. Additionally, a three-phase controlled LTC is installed at the substation, while VR1 remains at its initial location; however, VR2 between nodes 852 and 832 is eliminated. Both VR1 and the LTC are equipped with a ±16 tap position range, allowing for a ±10% maximum voltage change. Notably, the three phases of the VRs are controlled independently, and all shunt capacitors from the original system are excluded. In the 34 node system, there are 20 nodes initially connected with loads. For the simulation, 10 nodes are linked with PV systems, of which 6 nodes are furnished with smart inverter VVar-C capability, highlighted in Figure 4.
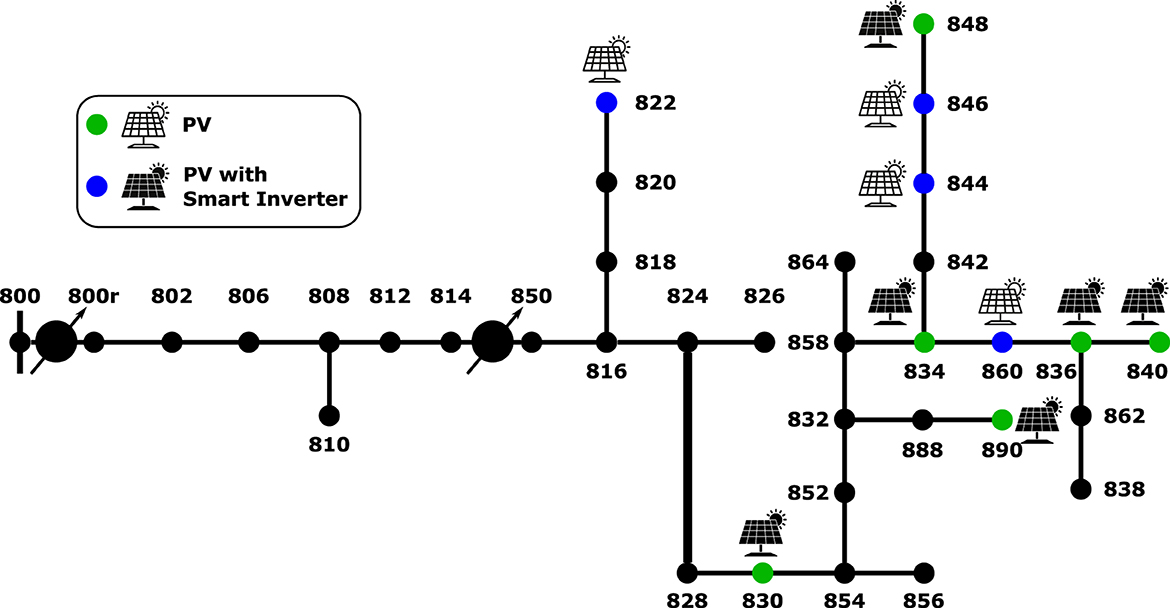
Figure 4. Test system with location of PV and smart inverters.
The simulation considers 24-h profiles of both total load and PV output, illustrated in Figure 5. Four distinct operating conditions are evaluated: a high-load scenario during summer, a light-load scenario in winter, a cloudy day with considerable intermittency in PV output, and a clear, sunny day displaying peak PV output. The proposed algorithm's performance is assessed across these diverse conditions to gauge its efficacy.
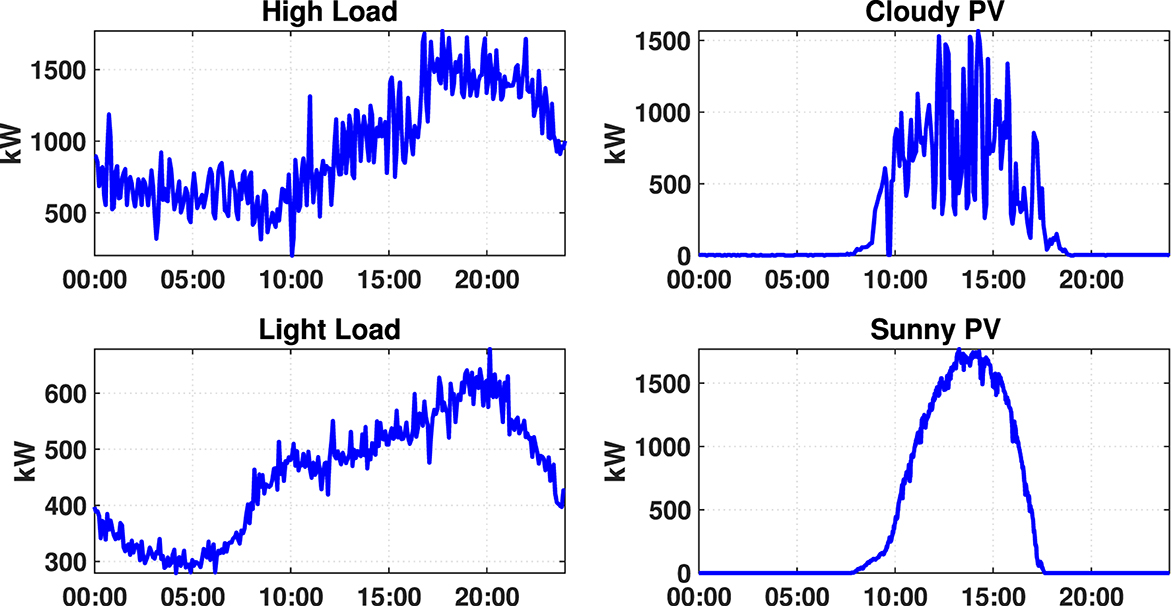
Figure 5. Load and PV profiles used in the case study.
3.1 Test cases
To assess the performance of the proposed scheme four test cases are setup based on the functionality of each device which will be discussed in detail in following sections:
• Case-1: LTC and VR operate under local control. PV system are present in the circuit but they donot have any smart inverter capability and hence do not provide any VAR support.
• Case-2: LTC and VR act under local control. PV system have smart inverter capability and act under local control with a fixed VVC curve.
• Case-3: Proposed coordinated VVO scheme with coordination between legacy devices and smart inverters. Also the proposed dispatch scheme is used to dispatch VVar-C curves.
3.1.1 Case-1
In this case, only conventional devices participate in the Volt/Var control. The control is purely based on local measurements (Short, 2004). The LTC and VR control settings are highlighted in Table 1.
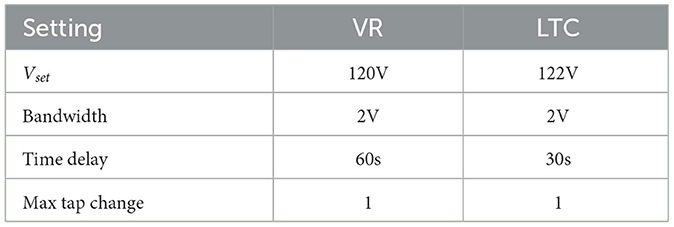
Table 1. Set points for legacy devices.
Even though PV inverters are shown in Figure 4 they do not participate in the Volt/Var control. The objective of setting up this case is to show that legacy devices are not capable of restricting voltage violations in presence of high PV.
3.1.2 Case-2
This case is an addition to case-1. Here apart from the LTC and VR, the smart inverters in the system also participate in the Volt/Var control. All devices operate based on local measurements and the control strategy of LTC and VR are same as case-1. All the smart inverters here will have a fixed Volt/Var curve as shown in Figure 6 and operate based on the local voltage measurements at the inverter terminals. We create two sub cases where all inverters are either operate on fitted curves or relaxed curves as shown in the figure.
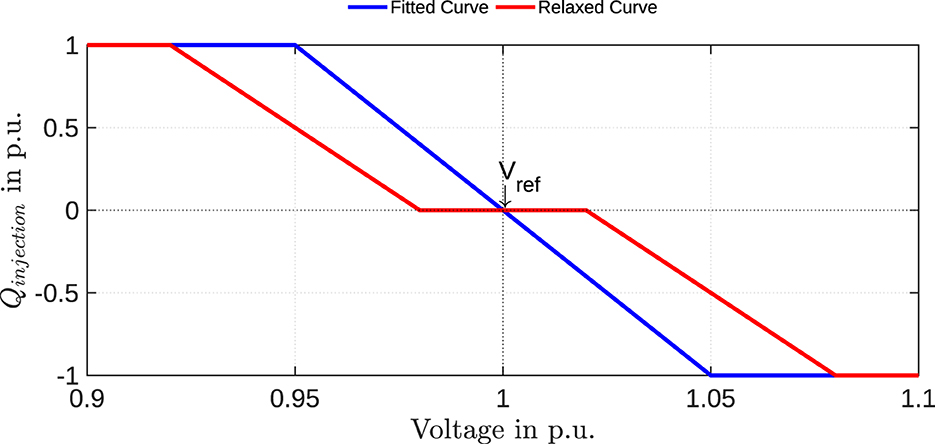
Figure 6. Default VVar-C for smart inverters.
3.1.3 Case-3
Case-3 is the proposed coordinated VVO with curve shifting dispatch scheme. All inverters are intialized with the fitted curve as shown in Figure 6 but will be shifted based on the optimal var injections obtained from the var optimization module every 5 min using Algorithm 1. The simulation is setup in such a way that the VVO module runs every 5 min where it dispatches voltage set points to legacy devices and the shifted VVar-C to smart inverters. The smart inverters will use the new VVar-C and the local voltage measurements to inject necessary reactive power in the sub 5-min interval. The 5 min interval is most suitable for system with high intermittent PV generation. If we choose a 15-min time interval, the solar variation can be so high that the dispatched voltage curves may lead to voltage violations while time intervals <5 min will lead to frequent communication, overloading the communication network.
As explained in Section 2.2, to avoid frequent shifting of VVar-C a threshold of 10% total var is introduced in the shifting algorithm. Whenever the optimal var injection Qg for an inverter is <10% of total var limit of the inverter, the VVar-C is retained at old curve and no shifting is applied to that inverter.
3.2 Test results
We use various metrics to evaluate the performance of the proposed VVO scheme. During the 24 h simulation:
1. NUV is the number of under voltage violations.
2. NOV is the number of over voltage violations.
3. Loss (kWh) is the total loss realized in the network.
4. NLTC is the number of LTC tap operations.
5. NVR is the number of VR tap operations.
6. Ntotal = NLTC + NVR is the total number of legacy device operation.
7. Vmax is the maximum voltage recorded in the system.
8. Vmin is the minimum voltage recorded in the system.
The results are summarized in Tables 2, 3 for four different operating conditions as per Figure 5. The key insights are summarized below:
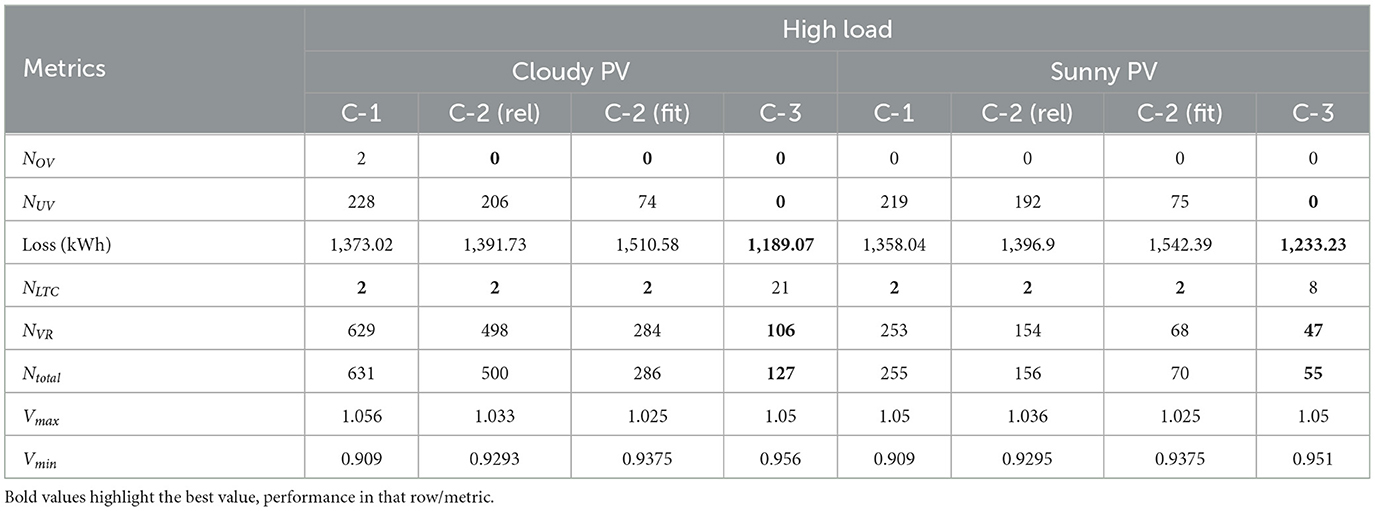
Table 2. Case study comparison under high load and different PV operating conditions.
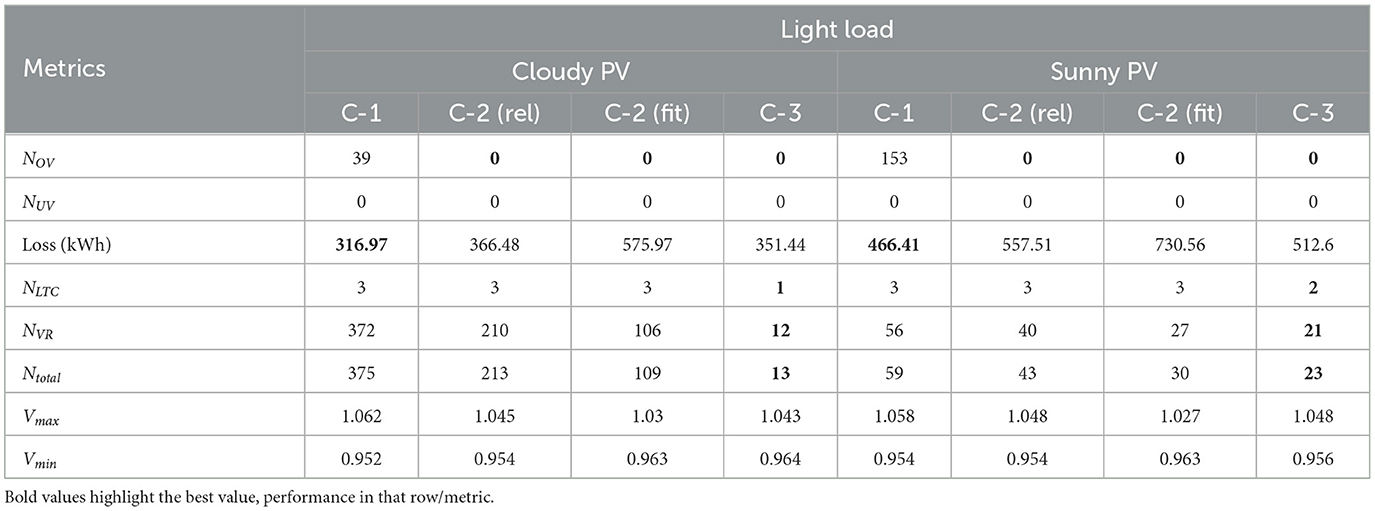
Table 3. Case study comparison under light load and different PV operating conditions.
In Case-2, both relaxed and fitted curve sub cases have similar results but with fitted curve there is lot lower legacy device operation and better voltage regulation at the cost of higher loss. This is primarily because in the relaxed curve there is a voltage deadband where inverters do not inject any reactive power which leads to lower loss at the cost of poor overall voltage regulation and higher dependence on legacy devices. In the rest of the paper we will compare Case-3 against Case-2 fitted curve since the results are similar between relaxed and fitted curve and it is fairer comparison as the fitted curves are used for shifting in Case-3 since it has better voltage regulation. In the rest of the paper when we refer Case-2 we refer to only the fitter curve results.
Under all operating conditions the proposed VVO scheme (case-3) eliminates over voltage and under voltage issues indicated by the NUV and NOV values. Case-1 performs poorly as it can neither address the under voltage issues during peak load condition nor the over voltage issues during peak PV condition which indicates that the legacy devices are incapable of addressing voltage issues in presence of PV. Even though case-2 with fixed VVar-C is capable of drastically reducing these violations, it still cannot completely eliminate the violations. But case-2 still performs really well in eliminating the over-voltage issues caused by PV as highlighted in the results of light load operating conditions.
Another major advantage of the proposed VVO scheme is the significant reduction in operation of legacy devices. In case-1 the overall operation of LTC and VR is significantly high since in the absence of smart inverter capability all the intermittency in PV is handled by these devices. The VR operations are higher than LTC due to the time delay between them. On the other hand, case-2 manages to reduce the overall tap operations from case-1 but still the Ntotal is significantly high due to lack of coordination between the inverter control and legacy device control. Moreover, even with such high tap operations both the cases perform poorly in eliminating the voltage issues. The proposed scheme manages to considerably reduce the overall number of tap operations while completely eliminating any voltage violations in the circuit. The reduction is extensively highlighted during cloudy PV days where proposed scheme reduces operation by about 90% compared to case-1 and 70% compared to case-2.
Since, in the proposed scheme we optimize the var injections for overall power loss minimization, we can observe a considerable reduction in the total power loss realized during the 24 h simulation. During high load condition we can see that the proposed scheme has the lowest loss compared to case-1 and case-2. Case-2 has particularly high loss because local control approach is known to increase the power loss because of lack of coordination in control between the inverters. This is also evident from case-1 loss which is lower than case-2 in the absence of inverter control. During light load condition the power loss of case-1 is lower than proposed scheme because the overall reactive load in the circuit is low and with inverter control in proposed scheme the loss is higher due to var injections from the smart inverters.
Figure 7 shows the reactive power injections from inverter at node 840 during high load cloudy PV condition between case-2 and case-3. In all three phases of the inverter case-3 manages to use very low var to regulate the voltage which leads to much less power loss as seen in Tables 2, 3. This shows the advantage of shifting the curves compared to case-2. Another interesting observation is that during later part of the day (after 16:00) when PV ramps down and load is high case-2 tries to inject reactive power as the reactive power demand is high but interestingly case-3 stills absorbs reactive power even though there is already high reactive power demand.
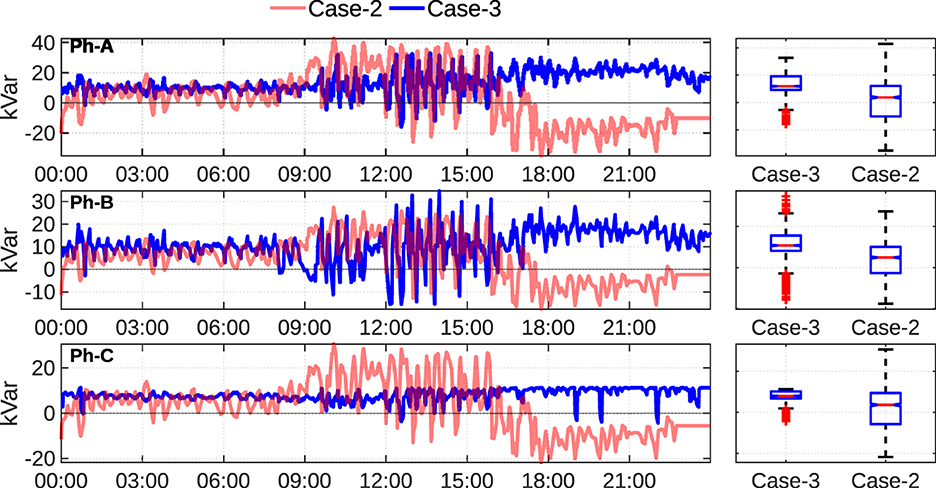
Figure 7. Comparison of reactive power injections from inverter at node 840 for high load cloudy PV condition.
Further investigation shows that by shifting the curves we are managing the reactive power requirements from the inverters strategically depending on size and location of the inverters on the circuit. As highlighted in Figure 8 the reactive power from the inverter at node 890 which has a large PV system in the middle of the circuit is utilized as conventional VVar-C device injecting reactive power at high load condition while inverters toward the end at node 836, 840, and 848 with comparatively lower size are operated as reactive power absorbing devices. While in case-2 the reactive power requirements are equally distributed among the inverters which all act as reactive power injecting devices during high load condition.
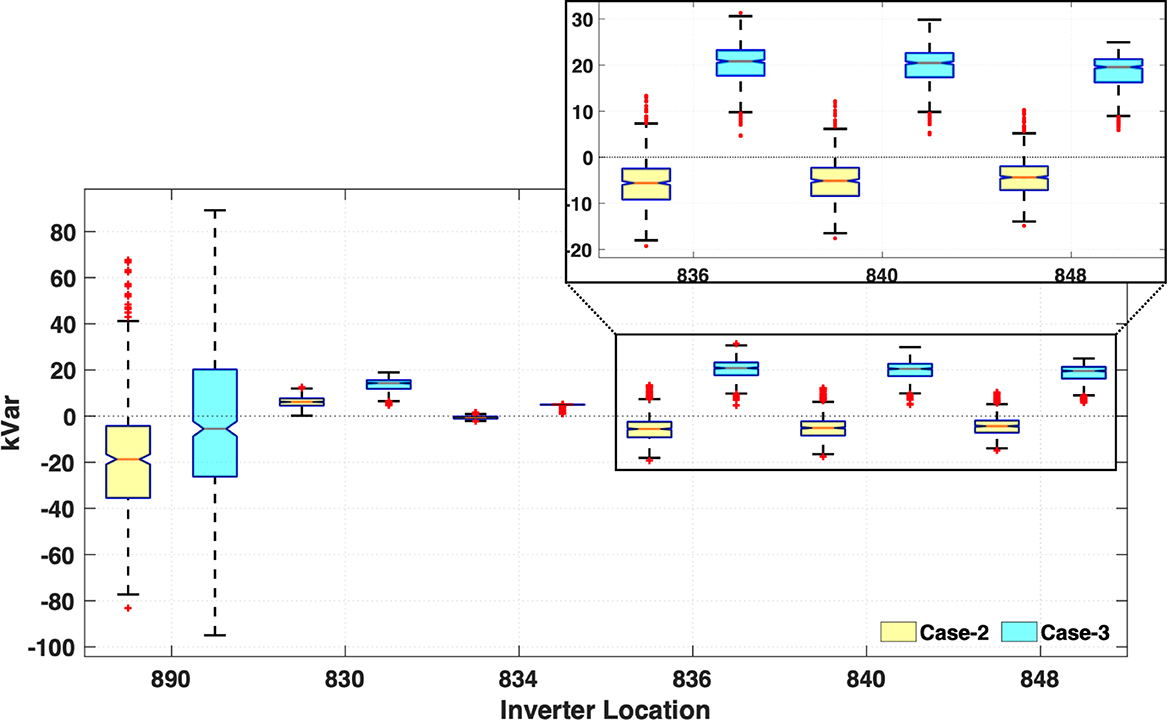
Figure 8. Distribution of reactive power injections after 16:00 for high load condition.
The voltage drop issue associated with absorbing reactive power during high load condition is mitigated by keeping the LTC taps at maximum position as shown in Figure 9 compared to case-2 and case-1. This also highlights the advantage of coordinated control between the devices.
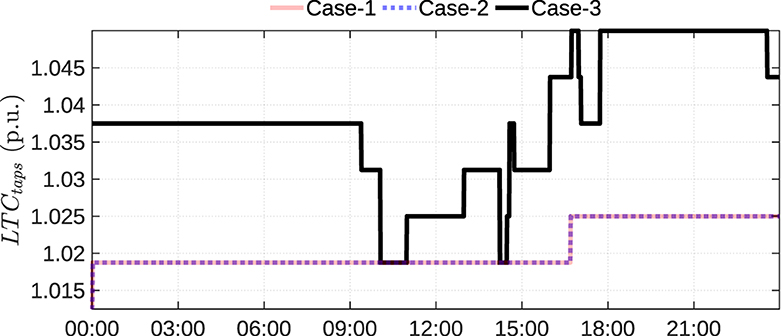
Figure 9. LTC tap change for high load cloudy PV condition.
Apart from the reduction in the reactive power usage, the main advantage of shifting the VVar-C is the smoothing of system voltage profile. Figure 10 shows the distribution of voltage at end node 840, which shows that proposed case has a much tighter voltage profile compared to case-2. This is beneficial to utilities while applying CVR.
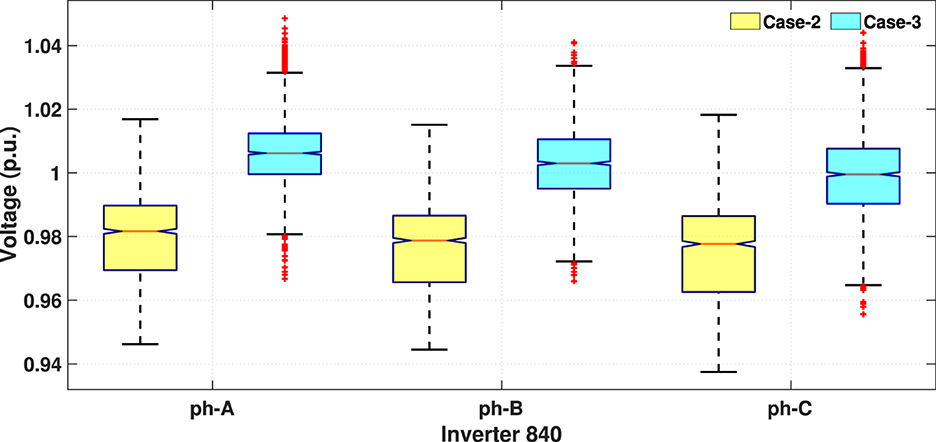
Figure 10. Comparison of 24 h voltage profile at end node 840 for high load cloudy PV condition.
To validate the claim that by shifting the curve the equilibrium point of new curve is infact the optimal solution from central VVO problem we show the error between the optimal var command against the var injection from new curve for same operating points at 5-min intervals in Figure 11. We can see that the error is very low about 7% average which is predominantly from the accumulation of inherent steady state error of Volt/Var curve from all inverters in the system which leads to a maximum voltage error of 0.4%.
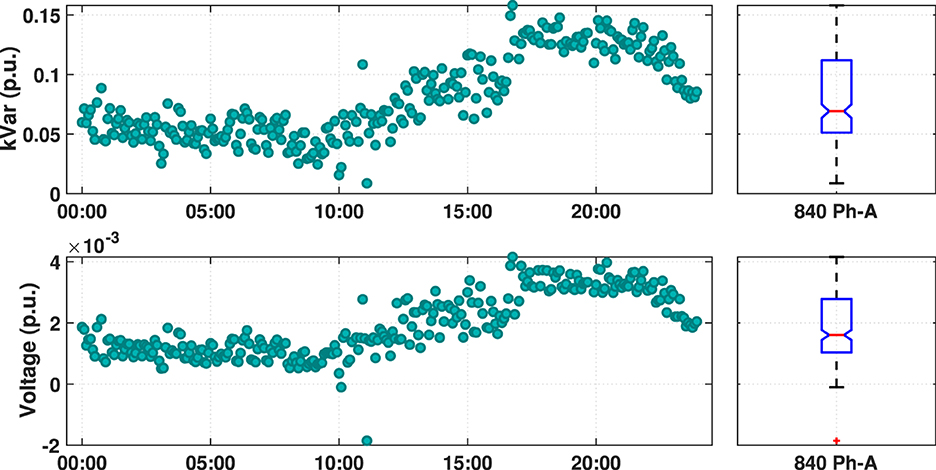
Figure 11. Error in reactive power injections (top) and measured voltage (bottom) vs. optimal command at inverter 840 on phase-A at 5-min control intervals.
Time taken for optimization problem to converge at every 5-min interval is shown in Figure 12. Under all operating conditions the maximum time taken to converge is only 1 s which indicates that the proposed algorithm can easily be applied to larger systems with multiple voltage regulators and smart inverters while still dispatching with 5-min control interval.
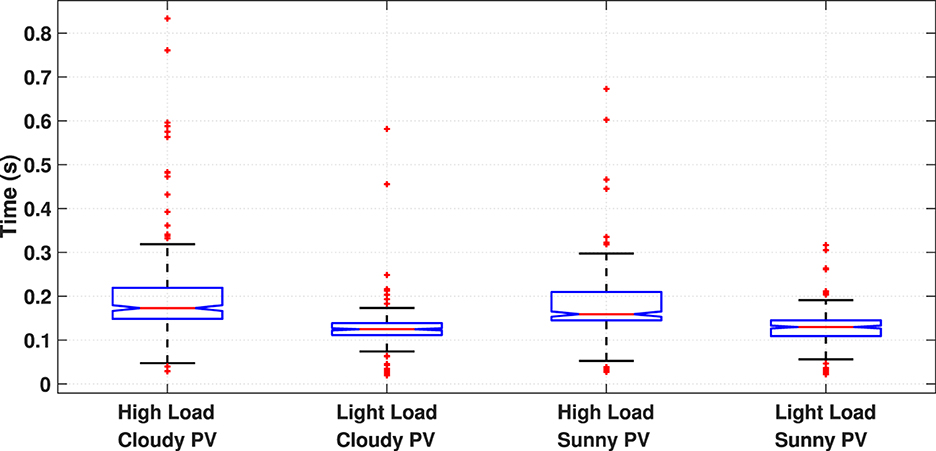
Figure 12. Time taken for two-stage optimization problem to converge.
4 Conclusion
This paper proposes a new VVO scheme that coordinates the control of legacy devices like voltage regulators and load tap-changers with smart inverters for real-time implementation. A new dispatching scheme for smart inverters is proposed that utilizes the optimal var injections obtained from the coordinated VVO to shift the existing Volt/Var curves in the inverters laterally thereby minimizing the communication requirement as well as reduce the dependency on centralized VVO for voltage regulation. Validation of proposed scheme on a test feeder shows that the new VVO is superior to conventional Volt/Var control schemes based on local measurements in eliminating the voltage violations, provide better voltage regulation, significant reduction in tap operation which will reduce the wear and tear of the mechanical devices, and overall reduction in power loss in the circuit. In future work we would like to analyze the impact of communication failure on the performance of proposed scheme.
Data availability statement
The raw data supporting the conclusions of this article will be made available by the authors, without undue reservation.
Author contributions
VM: Conceptualization, Data curation, Formal analysis, Investigation, Methodology, Resources, Software, Supervision, Validation, Visualization, Writing – original draft, Writing – review & editing. YS: Conceptualization, Data curation, Resources, Software, Validation, Writing – review & editing. MB: Funding acquisition, Investigation, Methodology, Project administration, Supervision, Writing – review & editing.
Funding
The author(s) declare that no financial support was received for the research, authorship, and/or publication of this article.
Conflict of interest
VM was employed by Exelon Corporation. YS was employed by Boston Energy Trading and Marketing LLC.
The remaining author declares that the research was conducted in the absence of any commercial or financial relationships that could be construed as a potential conflict of interest.
Publisher's note
All claims expressed in this article are solely those of the authors and do not necessarily represent those of their affiliated organizations, or those of the publisher, the editors and the reviewers. Any product that may be evaluated in this article, or claim that may be made by its manufacturer, is not guaranteed or endorsed by the publisher.
References
ANSI (2020). ANSI C84.1-2020 - Electric Power Systems and Equipment - Voltage Ratings (60 Hz). Available online at: https://webstore.ansi.org/Standards/NEMA/ANSIC842020?source=blog&_ga=2.2269.797492529.1641.74212465.1641567512 (accessed January 11, 2023).
Bazrafshan, M., Gatsis, N., and Zhu, H. (2019). Optimal power flow with step-voltage regulators in multi-phase distribution networks. IEEE Trans. Power Syst. 34, 4228–4239. doi: 10.1109/TPWRS.2019.2915795
CPUC (2022). Rule 21 Interconnection. Standard, CA. Available online at: https://www.cpuc.ca.gov/rule21/ (accessed January 11, 2023).
Dall'Anese, E., Dhople, S. V., and Giannakis, G. B. (2014). Optimal dispatch of photovoltaic inverters in residential distribution systems. IEEE Trans. Sustain. Energy 5, 487–497. doi: 10.1109/TSTE.2013.2292828
Ding, T., Sun, K., Huang, C., Bie, Z., and Li, F. (2018). Mixed-integer linear programming-based splitting strategies for power system islanding operation considering network connectivity. IEEE Syst. J. 12, 350–359. doi: 10.1109/JSYST.2015.2493880
Farivar, M., Chen, L., and Low, S. (2013). “Equilibrium and dynamics of local voltage control in distribution systems,” in 52nd IEEE Conference on Decision and Control (Firenze: IEEE), 4329–4334. doi: 10.1109/CDC.2013.6760555
IEEE (2018). “IEEE standard for interconnection and interoperability of distributed energy resources with associated electric power systems interfaces,” in IEEE Std 1547-2018 (Revision of IEEE Std 1547-2003) (New York City), 1–138.
Jahangiri, P., and Aliprantis, D. C. (2013). Distributed Volt/VAr control by PV inverters. IEEE Trans. Power Syst. 28, 3429–3439. doi: 10.1109/TPWRS.2013.2256375
Jha, R. R., Dubey, A., Liu, C.-C., and Schneider, K. P. (2019). Bi-level Volt-VAR optimization to coordinate smart inverters with voltage control devices. IEEE Trans. Power Syst. 34, 1801–1813. doi: 10.1109/TPWRS.2018.2890613
Manbachi, M., Sadu, A., Farhangi, H., Monti, A., Palizban, A., Ponci, F., et al. (2015). “Real-time communication platform for Smart Grid adaptive Volt-VAR optimization of distribution networks,” in 2015 IEEE International Conference on Smart Energy Grid Engineering (SEGE) (Oshawa, ON: IEEE), 1–7. doi: 10.1109/SEGE.2015.7324592
Muthukaruppan, V., and Baran, M. E. (2020). “AMI based communication scheme for decentralized Volt/VAR control,” in 2020 IEEE Power & Energy Society General Meeting (PESGM) (Montreal, QC: IEEE), 1–5. doi: 10.1109/PESGM41954.2020.9281702
Neal, R., and Bravo, R. (2011). “Advanced Volt/VAr control element of Southern California Edison's Irvine smart grid demonstration,” in 2011 IEEE/PES Power Systems Conference and Exposition (Phoenix, AZ: IEEE), 1–3. doi: 10.1109/PSCE.2011.5772575
Ozdemir, G., Emiroglu, S., and Baran, M. (2016). “Supervisory control for coordinating Volt/Var control devices on a distribution system,” in 2016 IEEE Power & Energy Society Innovative Smart Grid Technologies Conference (ISGT) (Minneapolis, MN: IEEE), 1–5. doi: 10.1109/ISGT.2016.7781162
Robbins, B. A., and Domínguez-García, A. D. (2016). Optimal reactive power dispatch for voltage regulation in unbalanced distribution systems. IEEE Trans. Power Syst. 31, 2903–2913. doi: 10.1109/TPWRS.2015.2451519
Seguin, R., Woyak, J., Costyk, D., Hambrick, J., and Mather, B. (2016). High-Penetration PV Integration Handbook for Distribution Engineers. Technical Report NREL/TP-5D00-63114, 1235905. Golden, CO: NREL. doi: 10.2172/1235905
Sharma, V., Aziz, S. M., Haque, M. H., and Kauschke, T. (2020). Effects of high solar photovoltaic penetration on distribution feeders and the economic impact. Renew. Sustain. Energy Rev. 131:110021. doi: 10.1016/j.rser.2020.110021
Short, T. A. (2004). Electric Power Distribution Handbook. Electric Power Engineering Series. Boca Raton, FL: CRC Press. doi: 10.1201/9780203486504
Singhal, A., Ajjarapu, V., Fuller, J., and Hansen, J. (2019). Real-time local Volt/Var control under external disturbances with high PV penetration. IEEE Trans. Smart Grid 10, 3849–3859. doi: 10.1109/TSG.2018.2840965
Xu, W., Tang, Q., Li, T., Lei, Y., Liu, F., Jia, Z., et al. (2019). “Optimal investment of mobile energy storage based on life cycle cost-benefit analysis,” in 2019 IEEE 3rd Conference on Energy Internet and Energy System Integration (EI2) (Changsha: IEEE), 508–513. doi: 10.1109/EI247390.2019.9062020
Zhang, B., Lam, A. Y., Domínguez-García, A. D., and Tse, D. (2015). An optimal and distributed method for voltage regulation in power distribution systems. IEEE Trans. Power Syst. 30, 1714–1726. doi: 10.1109/TPWRS.2014.2347281
Zheng, W., Wu, W., Zhang, B., Sun, H., and Liu, Y. (2016). A fully distributed reactive power optimization and control method for active distribution networks. IEEE Trans. Smart Grid 7, 1021–1033. doi: 10.1109/TSG.2015.2396493
Keywords: Volt/Var optimization, coordinated control, smart inverters, Volt/Var curve, active distribution system, smart grid
Citation: Muthukaruppan V, Shi Y and Baran M (2024) A supervisory Volt/Var control scheme for coordinating voltage regulators with smart inverters on a distribution system. Front. Smart Grids 3:1356074. doi: 10.3389/frsgr.2024.1356074
Received: 15 December 2023; Accepted: 11 March 2024;
Published: 16 April 2024.
Edited by:
Nikos Hatziargyriou, National Technical University of Athens, GreeceReviewed by:
Lei Yang, Zhejiang Energy R & D Institute Co., Ltd, ChinaShunfu Lin, Shanghai University of Electric Power, China
Copyright © 2024 Muthukaruppan, Shi and Baran. This is an open-access article distributed under the terms of the Creative Commons Attribution License (CC BY). The use, distribution or reproduction in other forums is permitted, provided the original author(s) and the copyright owner(s) are credited and that the original publication in this journal is cited, in accordance with accepted academic practice. No use, distribution or reproduction is permitted which does not comply with these terms.
*Correspondence: Valliappan Muthukaruppan, vmuthuk4@gmail.com