Quantifying generalized trust in individuals and counties using language
 Salvatore Giorgi1*
  Jason Jeffrey Jones2
  Anneke Buffone3 Johannes C. Eichstaedt4 Patrick Crutchley5
  David B. Yaden6 Jeanette Elstein3 Mohammadzaman Zamani7
  Jennifer Kregor3 Laura Smith3
  Martin E. P. Seligman3
  Margaret L. Kern8 Lyle H. Ungar1
  H. Andrew Schwartz7*
- 1Department of Computer and Information Science, University of Pennsylvania, Philadelphia, PA, United States
- 2Department of Sociology, Stony Brook University, Stony Brook, NY, United States
- 3Department of Psychology, University of Pennsylvania, Philadelphia, PA, United States
- 4Department of Psychology, Stanford University, Stanford, CA, United States
- 5SonderMind, Denver, CO, United States
- 6Department of Psychiatry and Behavioral Sciences, Johns Hopkins University School of Medicine, Baltimore, MD, United States
- 7Department of Computer Science, Stony Brook University, Stony Brook, NY, United States
- 8Melbourne Graduate School of Education, University of Melbourne, Parkville, VIC, Australia
Trust is predictive of civic cooperation and economic growth. Recently, the U.S. public has demonstrated increased partisan division and a surveyed decline in trust in institutions. There is a need to quantify individual and community levels of trust unobtrusively and at scale. Using observations of language across more than 16,000 Facebook users, along with their self-reported generalized trust score, we develop and evaluate a language-based assessment of generalized trust. We then apply the assessment to more than 1.6 billion geotagged tweets collected between 2009 and 2015 and derive estimates of trust across 2,041 U.S. counties. We find generalized trust was associated with more affiliative words (love, we, and friends) and less angry words (hate and stupid) but only had a weak association with social words primarily driven by strong negative associations with general othering terms (“they” and “people”). At the county level, associations with the Centers for Disease Control and Prevention (CDC) and Gallup surveys suggest that people in high-trust counties were physically healthier and more satisfied with their community and their lives. Our study demonstrates that generalized trust levels can be estimated from language as a low-cost, unobtrusive method to monitor variations in trust in large populations.
1 Introduction
In 2017, the Edelman Trust Barometer survey reported an unprecedented international decrease in trust in business, media, government, and non-government organizations (Harrington, 2017). In 2018, the same survey reported another drop in trust in the United States (Friedman, 2018). Imagining low and falling levels of trust leading to negative social, political, and economic outcomes is easy. Therefore, measuring trust consistently, persistently, and at scale is crucial. Here, we take a step in that direction by proposing and applying a machine learning method to transform observable online text data into estimates of generalized trust.
The broadest conceptualization of trust is generalized trust, or one's expectation of the trustworthiness of others. Generalized trust is responsive to circumstances yet is relatively stable and trait-like (Nannestad, 2008; Dinesen and Bekkers, 2017). Generalized trust influences the wellbeing, prosperity, and health of both individuals and communities (Colquitt and Scott, 2007; Nannestad, 2008; Helliwell and Wang, 2011; Dinesen and Bekkers, 2017). We endeavored to estimate trust with language data at the individual level and use the relationships discovered to infer levels of trust at a population level.
At the individual level, multiple observational and self-report measures of trust exist with very high levels of correlation between one another (Couch and Jones, 1997; Colquitt and Scott, 2007; Glanville and Paxton, 2007; Nannestad, 2008; Delhey et al., 2011; Dinesen and Bekkers, 2017). The most common measure of trust is the social trust question (i.e., “Generally speaking, would you say that most people can be trusted or that you can't be too careful in dealing with people?”; Nannestad, 2008; Eldblom and Jarl, 2012). Generalized trust (hereafter referred to simply as “trust”) is the basic assumption that unknown others are generally good, trustworthy, and more likely to help us than harm us (Yamagishi and Yamagishi, 1994). While other forms of trust concern specific institutions or the government (Dinesen and Bekkers, 2017), generalized trust is about confidence in non-specific others (Rousseau et al., 1998).
At the population level, studies on regional variation in trust have focused almost exclusively on comparisons between countries (Nannestad, 2008; Helliwell and Wang, 2011) and states within the United States (Fairbrother and Martin, 2013). Despite the profound differences in culture between intrastate regions (such as counties) in the United States, little is known about variation in trust at this level. Social scientists have only just begun focusing on counties as a level of analysis, and the only available studies focus on measures of social capital—a broader and more contentious category than trust (Rupasingha et al., 2006).
The current research seeks to expand the understanding of trust at individual and community levels through a novel measurement approach. We first develop a language-based assessment of trust using ~16,000 individuals' social media language across an average of 19 months as data. This is done by training and validating a machine learning model that predicts trust from language. Next, we apply the trust-based model at the community level (U.S. counties) to explore regional health and behavioral correlates of social trust and distrust. Finally, we explore associations between political partisanship, or fractionalization within communities, and county-level trust.
1.1 Prior research on trust
Some scholars view trust as an innate psychological disposition that is rigid (Nannestad, 2008; Van Lange et al., 2014; Dinesen and Bekkers, 2017) or fixed in childhood and not affected by day-to-day experiences later in life (Bowlby, 1969; Couch and Jones, 1997; Uslaner, 1999, 2002). Others believe that trust shifts daily or is impacted by life events and experiences (Rotter, 1971; Hardin, 2002; Glanville and Paxton, 2007; Paxton and Glanville, 2015). Supporting the latter perspective, trust has been found to increase with a breadth of foreign travel experience (Cao et al., 2014) and decrease after job loss (Laurence, 2015) or when frequently moving between neighborhoods within a 5-year period (Helliwell and Wang, 2011). First-generation immigrants moving from a less trusting to a more trusting country display higher levels of trust than do individuals in their countries of origin (Dinesen and Bekkers, 2017). As a whole, it seems likely that generalized trust has both malleable and stable components (Van Lange, 2015; Dinesen and Bekkers, 2017).
Studies across a range of fields indicate numerous individual- and community-level benefits associated with higher levels of trust. At the individual level, trust is positively associated with traits such as social and emotional intelligence, self-esteem, sense of control, attachment security, optimism, tolerance, and acceptance of dissimilar others, as well as lower suspiciousness, jealousy, and shyness (Yamagishi, 2001; Hooghe et al., 2012; Oskarsson et al., 2012; Carl and Billari, 2014; Dinesen and Bekkers, 2017). Trust also predicts a variety of prosocial behaviors, such as civic engagement, volunteering, and integration into one's neighborhood (Marschall and Stolle, 2004; Helliwell and Wang, 2011; Dinesen and Bekkers, 2017). Personal relationships are positively impacted by higher levels of trust (e.g., Larzelere and Huston, 1980; Simpson, 2007; Murray et al., 2012). In contrast, distrust is associated with poorly differentiated self-concepts, loneliness, social phobia, and Machiavellianism (Couch and Jones, 1997; Simpson, 2007; Rotenberg et al., 2010). Low levels of trust also predict depression, anxiety, and poor physical health (Bienvenu et al., 2004; Helliwell and Wang, 2011; Qualter et al., 2013; Widiger, 2015).
Several studies have considered trust differences across demographic groups. Croson and Buchan (1999) showed that women tend to be less trusting than men, despite women being more trusted (Cappelen et al., 2020). The positive relationship between age and trust has been shown to be robust across several measures of trust and holds across countries (Li and Fung, 2013). It has been suggested that this could be associated with prioritizing social and emotional connectedness later in life or even physical and cognitive decline, as older people tend to rely more on others (Li and Fung, 2013). A computational linguistics framework could reveal these signals through mentions of family, support, events, and even physical/cognitive decline.
At the community level, trust features prominently in several definitions of social capital. Putnam defined social capital as “social networks and the associated norms of reciprocity and trustworthiness” (Putnam, 2007, p. 137; see also Stolle et al., 2008). Trust has been measured as a facet of social capital by the social trust question (Claibourn and Martin, 2000; Grootaert et al., 2004), and there are large differences in social trust across different countries (Halpern, 2005) and states within the United States (Fairbrother and Martin, 2013).
Other work has considered differences in trust across cultural and ethnic groups, comparing individualistic and collectivistic cultures (e.g., Bond and Cheung, 1983; Yuki et al., 2005). At these larger aggregated levels, trust has been named a crucial social attribute in an increasingly globalized world economy, where interactions with unfamiliar others are inevitable (Dinesen and Bekkers, 2017). It is highly predictive of economic growth and more effective governments (Knack and Zak, 2003; Delhey and Newton, 2005), civic engagement (Uslaner and Brown, 2005), and cooperation with strangers (Dinesen and Bekkers, 2017). Trust further correlates with wellbeing and lower rates of suicide (Helliwell and Wang, 2011).
Social, political, ethnic, and economic diversity have been found to decrease generalized trust in some studies—although this effect is moderated by the quantity and quality of social interactions across these intra-community differences (Stolle et al., 2008). One might expect increased immigration into European countries to predict decreases in trust, but a study aiming to measure this relationship found no evidence (Hooghe et al., 2009). Other studies have shown that while immigration can reduce trust, the effect is substantially smaller than other factors, such as economic difficulties and levels of social connectedness (Sturgis et al., 2011). The dramatic shifts in trust in the United States and abroad noted at the beginning of this article may be occurring in response to an increasingly diverse population, or other factors could be at work. Researchers investigating these domestic and international shifts in generalized trust would be greatly aided by the ability to measure trust at larger scales and in shorter time intervals.
The relationship between trust and politics has been shown to be complex and contested. Van Ingen and Bekkers (2015) showed very small or non-significant causal effects between generalized trust and civic engagement despite the two being highly correlated. Although the correlations are robust, work has suggested that trust is not the direct mechanism behind increased engagement, but the increase of both trust and civic engagement seems due to an increase in underlying prosociality (Van Ingen and Bekkers, 2015). Others have found that trust (political and social), at both the individual and community levels, is associated with an increased likelihood of voting and voter turnout (Grönlund and Setälä, 2007; Rahn et al., 2009). It has also been shown that increased welfare programs and social spending are linked to higher levels of trust (Brewer et al., 2014). Other aspects of politics, such as partisanship, also have multifaceted relationships with trust. Hooghe and Oser (2017) showed that partisanship (strength of party affiliation) is positively related to political trust (i.e., trust in political institutions) but negatively linked to generalized trust. This relationship between political trust and partisanship is independent of party affiliation (e.g., Democrats and Republicans) and has remained stable over time. The negative relationship between generalized trust and partisanship shows that partisanship decreases social cohesion, which is in line with literature showing that increased party divisions contribute to polarization. Several of these studies examined trust across larger spatial units, such as countries, and thus, a finer grained county-level analysis may add additional context to this line of research.
Characterizing traits at the regional level is an emerging trend made possible by access to larger data sets and computational techniques. Regional personality traits, measured using a large-scale online survey, were found to have strong associations with social involvement, demographics, crime, religiosity, occupation, and health-promoting behaviors (Rentfrow et al., 2008; Ebert et al., 2022; Giorgi et al., 2022). In the subfield sometimes referred to as “geographical psychology,” regions are thought to differ, in aggregate, across personality and other characteristics based on selective migration patterns. That is, individuals often move to areas in which individuals better match one's own traits. In some cases, individuals can collectively develop characteristics that are advantageous in a given physical environment (e.g., climate, population density, and the availability of resources; Rentfrow et al., 2008). Social influence—that is, assimilating to the traits that are valued in one's region—and environmental influence may also lead to “regional traits.”
1.2 Measuring trust
Trust has been primarily assessed through experimental observations, self-report scales, and single items in large national surveys (Nannestad, 2008). Lab-based experiments typically involve a task in which individuals can decide whether or not to cooperate (Berg et al., 1995). An illustrative example of experimental research in the field involves the dropped-wallet paradigm, in which a wallet containing personally identifying information and money is dropped in a public place and the rates of wallet return serve as a behavioral measure of trust in communities (Nannestad, 2008; Helliwell and Wang, 2011).
A variety of generalized trust scales exist, such as the Faith in People scale (Rosenberg, 1957) or Yamagishi and Yamagishi's (1994) Trust Scale. These scales, however, have been criticized for including factors of other constructs (e.g., optimism), combining assessments of one's own perceived trustworthiness with the trustworthiness of others, and including related but distinct aspects, such as trust in another's competence (Nannestad, 2008; Dinesen and Bekkers, 2017). Several studies have successfully used the trust items from the Agreeableness factor of Big Five personality questionnaires, as agreeableness reflects an interpersonal approach orientation coupled with a desire to attain closeness with others despite costs to the self, which amounts to a close approximation of trust (Costa and McCrae, 1992; Colquitt and Scott, 2007; Graziano and Tobin, 2017).
In large-scale surveys, self-report measures of trust are also commonly used, ranging from single-item measures that have been included in national (e.g., Gallup, Pew, and the General Social Survey) and international (e.g., European Social Survey, Pew Global, and Our World in Data) surveys for several decades to longer self-report measures for use in smaller studies (e.g., Rotter, 1967; Yamagishi and Yamagishi, 1994; Couch and Jones, 1997). The most widely used assessment of trust is the social trust question, originating from Rosenberg's (1957) classic Faith in People scale: “Generally speaking, would you say that most people can be trusted or that you can't be too careful in dealing with people?” To remedy the specificity problem, some researchers have added items asking about the trustworthiness of neighbors, strangers, friends, and other types of individuals directly (Helliwell and Wang, 2011).
In sum, trust has been adequately assessed in behavioral observations, psychometric scales, and single items in large surveys. However, experimental and survey research, when adequately powered, are costly to conduct, in addition to being potentially obtrusive. Recognizing the usefulness of measuring trust but being cognizant of barriers to large-scale measurement, researchers have urged for better assessment methods (Nannestad, 2008; Dinesen and Bekkers, 2017).
1.3 The current study
The advent of large online repositories of linguistic data and machine learning methods are now beginning to make measuring trust unobtrusively at scale possible. Automatic language-based assessments using social media data have provided valuable insights into people's personalities, emotions, and behaviors (Kern et al., 2014; Park et al., 2015; Curtis et al., 2018); identity (Rogers and Jones, 2021); mental health (Preotiuc-Pietro et al., 2015a); wellbeing (Schwartz et al., 2013a, 2016); and physical health (Eichstaedt et al., 2015). On social media, people frequently report their in-the-moment attitudes, feelings, and thoughts about the events that occur in their lives. Once a language model has been trained on scores for a given construct, linguistic patterns can be used to predict scores on that construct over other users using language alone (Schwartz et al., 2013b; Park et al., 2015; Preotiuc-Pietro et al., 2015b). We follow this approach to measure trust based on language shared on Facebook.
The current study examines the possibility of measuring trust at scale by developing and validating a language-based assessment of generalized trust. This is done in five stages. First, we derive a measure of self-reported trust. Second, we explore the language of trust by looking at how language varies across trusting and distrusting individuals, as well as variation across age and gender. Third, we build and validate a language-based machine learning model of trust. Fourth, this model is then applied to ~6 million geotagged Twitter users, providing a large-scale assessment of trust at the county level (i.e., regions within the United States), which we then validate. Finally, we use the county-level trust measure to gain new insights into community-level health, wellbeing, and political ideology.
2 Data
2.1 Participants
The analytic sample was drawn from 154,000 users who directly consented to take a personality survey and share their Facebook language data (Kosinski et al., 2015). After consenting, participants completed a Big-Five personality questionnaire based on the International Personality Item Pool proxy for the NEO Personality Inventory (NEO-PI-R; Costa and McCrae, 2008), ranging from 20 to 336 items. Participants could choose to share their own Facebook statuses across the past 4 years for research purposes. Facebook statuses are short autobiographical posts that contain salient personal or emotional information, customarily shared only with individuals designated as “friends.” The use of the de-identified data set, including consenting users only (not their friends), was approved by the University of Pennsylvania's institutional review board (protocol #813820). The institutional review board deemed this low risk and granted exemption status, including no special requirements for adolescents beyond the same assent that all participants gave. The current study included a subset of users who (a) indicated English as a primary language, (b) completed the 100-item version of the International Personality Item Pool (IPIP) survey (which includes trust-relevant items), (c) indicated their age and gender, and (d) had at least 1,000 words across all of their status updates, as this threshold is common in order to have an adequate sample of each participant's language (Schwartz et al., 2013b; Kern et al., 2016). The resulting sample included 16,487 users (56.8% female; mean age 23.3 years, SD = 9.4 years, range = 13–80) who had shared 3,300,928 Facebook status updates (median status updates = 150) from January 2009 to November 2011.
2.2 Individual-level self-report measures
2.2.1 Trust
To measure self-reported trust, we adopted an approach taken by other trust researchers (Colquitt and Scott, 2007; Graziano and Tobin, 2017) by averaging three trust items from the 100-item version of the IPIP personality questionnaire. The trust items are (1) “I believe that others have good intentions,” (2) “I trust what people say,” and (3) “I suspect hidden motives in others” (reverse-coded). These items have strong content validity and have been used successfully in other trust studies (Colquitt and Scott, 2007; Graziano and Tobin, 2017).
We then collected an additional sample of 1,041 participants from Amazon Mechanical Turk to confirm convergent validity with other trust measures. These individuals took four trust questionnaires: (a) the 3 generalized trust items from the 100-item IPIP questionnaire (Cronbach's alpha in this sample = 0.73), (b) the 10 trust items from the 336-item IPIP measure of the NEO-PI-R (seven additional items beyond 3 trust items; α = 0.91), (c) the six items from the Yamagishi generalized trust scale (Yamagishi and Yamagishi, 1994; α = 0.87), and (d) the three trust items from the National Opinion Research Center General Social Survey (NORC-GSS; Davis and Smith, 1991; α = 0.59).
2.2.2 Other individual-level variables
2.2.2.1 Age
Age was included both as a continuous variable indicating age and, after being separated into terciles, as three binary indicator variables: pre- and early college: 18 years and younger (n = 5,472), college-aged: 19–23 (n = 5,853), and post-college: 24 and older (n = 5,162). The terciles allow for the models to pick up on non-linear relationships.
2.2.2.2 Gender
Gender was available as a self-reported dichotomous variable for male (N = 7,120) and female (N = 9,367) users.
2.2.2.3 Other demographics not available
Both race and education are suspected to correlate with trust but were only available for a small number of participants within our data. Research has shown that Facebook is widely used by individuals of all races (Pew Research Center, 2015). For a small subsample of the data set, self-reported race was available, indicating a moderate, yet biased, racial diversity (551 White, 131 Asian, 40 Black, 17 other). Education levels are also diverse on Facebook (Pew Research Center, 2015), and we have no reason to believe our sample would differ substantially.
2.2.2.4 IPIP Big 5 Questionnaire
All 16,487 participants completed at least the 100-item version of the IPIP. The 20 items for each domain (extraversion, conscientiousness, neuroticism, openness) were averaged to create composite scores. For agreeableness, the composite score was based on 17 Agreeableness items, excluding the three trust items.
2.2.2.5 Perceived physical symptoms
Three health items indicating physical health (Pennebaker, 1982), physician visits, days sick, and days of inactivity were completed by 846 participants.
2.2.2.6 Orpheus personality questionnaire
The fair-mindedness and self-disclosure subscales of the Orpheus Personality Questionnaire (Rust and Golombok, 2009) were completed by 926 participants. The fair-mindedness subscale assesses impartiality and fairness in decision-making; the self-disclosure subscale assesses self-disclosure and transparency in self-presentation.
2.2.2.7 Satisfaction with Life Scale
The Satisfaction with Life Scale (Diener et al., 1985), a 5-item measure assessing life satisfaction, was completed by 1,229 users.
2.2.2.8 Self-monitoring
The Self-Monitoring Scale (Snyder, 1974), a 25-item scale assessing the degree to which one regulates self-presentation using situational cues, was completed by 1,102 users.
2.2.2.9 Public profile information
In addition to self-reports of personality, we also collected information from consenting users' public Facebook profiles. Public profile information was available for all 16,487 users. We used this to determine the normalized number of likes from users and the normalized number of tags of others in users' photos (no other user data was included).
2.2.2.10 Facebook status updates
Facebook status updates were collected from the 16,487 participants, totaling 3,300,928 [more properties of the status updates are discussed in Park et al. (2015)].
2.3 County-level data
We gathered publicly accessible data on geographic regions via Twitter and from national surveys (e.g., CDC and Gallup).
2.3.1 Twitter language
We use the County Tweet Lexical Bank (CTLB; Giorgi et al., 2018), which is an open-source data set of county-level language features extracted from a large U.S. county-mapped Twitter corpus. Full details of the data set can be found in Giorgi et al. (2018), but high-level details are described later to aid the reader. A random 10% sample of Twitter language (called the Gardenhose) was collected between July 2009 and April 2014, which was then supplemented with a random 1% sample from May 2014 to February 2015. Individual tweets were geolocated to U.S. counties via self-reported location information in user profiles and latitude/longitude coordinates (Schwartz et al., 2013a). This was done in a way that minimizes the number of false mappings at the expense of the total number of mapped tweets. The total sample contains ~37.6 billion tweets, of which 1.64 billion English tweets could be geolocated to U.S. counties. Language features (words, phrases, and topics; described later) were first extracted for each user within a county and then averaged (mirroring the process of taking the mean of a survey sample). For this user extraction–county aggregation pipeline, we only consider users with 30 or more posts and counties with 100 or more such users. A total of 2,041 U.S. counties were included.
2.3.2 Gallup
We obtained 2.2 million responses from the Gallup–Sharecare Wellbeing Index between 2009 and 2016. The survey involved a telephone interview using a dual-frame random-digit-dial methodology that included cell phone numbers from all 50 U.S. states. Approximately 1,000 interviews were completed every day from January 2 through December 30, 2012, and 500 were completed every day from January 2, 2013, through December 30, 2016. Questions were chosen such that we predicted a positive association with trust after recoding several variables. Individual responses were averaged to counties. County variables were included in the analysis if a minimum of Nr people responded to a single item. Since all questions in the Gallup-Sharecare Wellbeing index are not available for each year, we adjusted Nr based on the total number of years the question was available (Nr = 200 for <4 years or Nr = 300 for 5-plus years).
2.3.3 Other county-level variables
We drew on information available for U.S. counties to consider demographic and health correlates of trust at the regional level.
2.3.3.1 Demographics
The percentage of females (N = 2,041), median age (N = 2,041), and log-transformed population density (N = 2,041) were taken from the 2010 Census (US Census Bureau, 2010a,b).
2.3.3.2 Socioeconomics
We collected median household income (log-transformed to reduce skewness, N = 2,041) from the U.S. Census Bureau's American Community Survey (US Census Bureau, 2010c). Educational level was based on the percentage of people within the county that completed high school (N = 2,041; US Census Bureau, 2010d). The Gini index of income inequality was collected from the 2010–2014 American Community Survey (US Census Bureau, 2010e).
2.3.3.3 Health and wellbeing
Several health and behavioral measures were available (County Health Rankings Roadmaps, 2012): the percentage of people in the county who were obese (N = 2,041), excessively drinking (N = 1,869), and smokers (N = 1,832); the rate of potential life lost (N = 2,037); and self-reported health (N = 1,924). Life satisfaction (N = 1,749) is measured as the average response to the question, “In general, how satisfied are you with your life?” (1 = very dissatisfied and 5 = very satisfied; estimates are averaged across 2009 and 2010; Lawless and Lucas, 2011).
2.3.3.4 Lifestyle
Based on their current living/marital status, the percentage of people in the county who were married, separated, or same-sex households was indicated (N = 2,041; US Census Bureau, 2010f,g).
2.3.3.5 Mental health
Self-reported mentally unhealthy days (out of the last 30 days; N = 2,016; County Health Rankings Roadmaps, 2012) were used as a subjective mental health variable.
2.3.3.6 Politics
Presidential election results were gathered for 2000–2016 (Leip, n.d.). In addition to Republican voting percentages, we also look at the difference between Donald Trump's (2016 election) and Mitt Romney's (2012 election) vote shares as well as the difference between Trump's and the average Republican vote share at the previous four presidential elections (2000–2012). Turnout was defined as the total number of votes over the total population (according to the 2010 Census).
2.3.3.7 Donations
Donation data were gathered from the Database on Ideology, Money in Politics, and Elections (Bonica, 2016). Donation partisanship is calculated as the absolute difference in the number of Republican and Democrat donations divided by the sum of donations to both parties. We used donations from 2012 only, as 2016 donation data were not available. Each county needed a minimum of 500 donations to be considered (N = 1,655).
2.3.3.8 Disadvantage
The Childhood Opportunity Index (COI) is a composite index, built from 29 U.S. Census variables, designed to identify disadvantaged communities (Acevedo-Garcia et al., 2020). This index is used in real-world settings, such resource allocation and policy decisions (Lou et al., 2023), and is used here to contextualize the effect sizes of the language-based county-level trust measure.
3 Methods
We proceed in five stages: (1) develop and validate a measure of self-reported trust, (2) explore linguistic correlates of trusting and distrusting individuals, (3) build and validate a language-based model of trust, (4) estimate and validate county-level trust scores by applying the language model at scale, and (5) explore county-level correlates of trust.
3.1 Developing and validating a measure of self-reported trust
The self-reported trust measure is derived from three trust items in the 100-item version of the IPIP personality questionnaire (as described earlier). We assess convergent validity by comparing our measure to other trust measures: the Yamagishi inventory and the NORC-GSS inventory. Next, we correlate the trust measure with external criteria: Big 5 personality, wellbeing and health measures, self-monitoring, and impulsivity. Finally, we explore how trust is related to social media activity, such as likes, friend network size, and tags in photos. All external criteria are described in Section 2.2.2.
3.2 Exploring the language of trust
We used both top-down and bottom-up computational linguistic analysis approaches to identify linguistic correlates of trust. A top-down approach uses an established dictionary, or set of words that reflect categories, which are developed a priori based on theory. The most commonly used set of dictionaries in psychological science comes from the Linguistic Inquiry Word Count (LIWC) program (Pennebaker et al., 2015). The LIWC is a text analysis application developed to capture multiple psychological dimensions by counting the frequencies of words in a wide variety of categories. These frequencies can then be correlated with other constructs or used as predictors (Pennebaker and King, 1999). We used the LIWC 2015 dictionaries and considered correlations between trust and each category's frequency.
We also used a bottom-up approach—differential language analysis (DLA; Schwartz et al., 2013b)—which identifies language that characterizes generalized trust through semantically similar language clusters. DLA consists of three main steps: linguistic feature extraction, correlational analysis, and visualization, which are described in the following subsections (see Schwartz et al., 2013b; Kern et al., 2016, for further details). Both the top-down and bottom-up approaches use the open-source Differential Language Analysis ToolKit (Schwartz et al., 2017) for linguistic feature extraction, correlation analysis, and visualization.
3.2.1 Linguistic feature extraction
We extract two types of features from each participant's status updates: (a) words and phrases and (b) topics. Each status update is split into words, capturing the oddities of social media language (e.g., misspellings, shortened words, emoticons). Two- and three-word phrases (or n-grams) are retained if the words within are more likely to appear together than expected by chance (a “collocation”; Kern et al., 2016). To focus on common language and reduce the occurrence of spurious correlations, features are retained only if they are used by at least 10% of participants. The features are encoded as the relative frequency of that word or phrase per user (i.e., the number of times the word or phrase appears out of all word appearances). Topics refer to clusters of related words, which have been generated using latent Dirichlet allocation (LDA; Blei et al., 2003), estimated using Gibbs sampling (Gelfand and Smith, 1990) with the MALLET software package (McCallum, 2002) on the complete Facebook data set [the same 2,000 topic set used in Schwartz et al. (2013b) and Kern et al. (2016)].
3.2.2 Correlation analysis
Once extracted, we employ least-squares linear regression to find the correlation between each feature and trust scores, controlling for age, gender, and other non-trust related items of the Agreeableness factor (uncontrolled results can be found in the Supplementary material). This procedure produces tens of thousands of correlations, so we correct for multiple comparisons using a Benjamini–Hochberg false discovery rate (FDR) correction of p-values (Benjamini and Hochberg, 1995). We consider coefficients significant if they have a two-tailed p-value less than α = 0.05 after correction.
3.2.3 Visualization
The final DLA step visualizes the resulting correlations. Words and phrases are combined into a modified word cloud, where the size of the word indicates the strength of the correlation (the coefficient from standardized multiple linear regression) with trust (bigger words have a stronger correlation), and color indicates their frequency of use (gray is low frequency, blue is moderate frequency, dark red is high frequency). For topics, visualizations display the top 15 most prevalent words within a topic, sized according to their posterior likelihood (how often they appear as a representative of the topic).
3.2.4 Linguistic correlations with demographics categories
To understand the differential correlations between language and trust across groups of users, we employed a novel visualization technique. First, we divided the users by (a) gender (male vs. female users), and (b) age (tercile bins). We then repeated the DLA process, controlling for agreeableness and age (for gender) or gender (for age). We separated positive and negative feature correlations and ranked the magnitude of the correlation within each group (i.e., separate correlations of trust for females and males). We next calculated a rank difference score, which indicates how many ranks higher that feature was for female users vs. male users (in the three age bins, each feature's rank was compared to the average rank in the other two bins). To visualize the results, words with a negative or zero rank difference (i.e., lower or equal rank than the other group or groups) are colored gray and words with a positive rank difference (i.e., higher rank than the other group or groups) are colored green, with darker shades as the rank difference increases. Thus, the colored words are more predictive of trust for the given gender as compared to the other gender (which also means that gender moderates the relationship between the feature and trust).
3.3 Establishing a language-based model of trust
To develop a language-based assessment of trust, we used techniques from statistical learning theory based on penalized (ridge) regression (Hastie et al., 2009). Following the well-validated approach of Park et al. (2015), we use three types of information as features (i.e., independent variables) for the statistical model: (1) relative frequencies of the 1- to 3-word phrases, (2) binary-transformed 1- to 3-grams (1 meaning the user used the word/phrase at least once, zero otherwise), and (3) relative frequencies of topics. We extracted these features from the 19,445 users that had three-item trust scores. We note that the features are extracted across the lifetime of posts across each user and, thus, assess trait-level trust for each person.
We used the same feature selection steps as Park et al. (2015), which consist of (1) selecting features with at least a small univariate correlation with the trust score (based only on the training data) and (2) performing a principal components analysis on the remaining features and limiting dimensions to 10% of the number of observations. These steps were performed independently for each of the three types of features (1- to 3-gram frequencies, binary 1- to 3-grams, and topics).
We established model accuracy by evaluating it over a hold-out set of N = 438 users that took the longer, 10-item version of trust (a so-called test set; Zamani et al., 2018). The “training set” used to fit the model consisted of the other N = 19,445 users. We use the larger three-item trust data for training, as it is often worthwhile to accept some error in the training set (i.e., due to answering fewer trust items) for a larger sample of observations (Schwartz and Ungar, 2015; Kern et al., 2016), while the more reliable less erroneous 10-item trust is used to establish the accuracy of the model. Accuracy is reported as the mean squared error (MSE) and the disattenuated product-moment correlation coefficient between our model's predictions of trust score and the trust score according to the 10-item questionnaire over the 438 held-out test-set users.
To consider test–retest reliability, we separated time into four periods (time 1: July–December 2009; time 2: January–June 2010; time 3: July–December 2010; time 4: January–June 2011), with an equal number of users (n per bin = 2,370).
Finally, we consider convergent and divergent validity by examining the relationship between our trust measure and the facets of agreeableness: trust, morality, altruism, cooperation, modesty, and sympathy. This was done in a sample of 414 individuals who completed the 336-item IPIP.
3.4 Applying and validating at scale across U.S. counties
After establishing the validity of the language-based assessment of trust at the individual level, we applied that model to domains and data sets for which collecting generalized trust measures with traditional methods is infeasible, in this case feature sets extracted from location-mapped Twitter data at the U.S. county level (the CTLB, described earlier). This data set contains county-level language features, identical to the features described in Section 3.3: 1- to 3-gram words and phrases, both relative frequencies and binarized, and normalized topic usage (using the same LDA topic model). The language-based trust model described earlier (i.e., a trained regression model) can then be applied to the county-level language features, producing a trust score for each county.
To validate these county trust estimates, we compared our county-level language estimates against the Gallup–Sharecare Wellbeing Index. Items were chosen such that we predicted a positive relationship with trust.
3.5 County-level insights
We then correlated the language model-based estimate of community-level generalized trust with other community-level outcomes from large-scale census/survey, demographic, and environmental data. We use the same correlation method as at the individual level: a linear regression between estimated generalized trust as the independent variable and the county-level outcomes as dependent variables. The magnitude of standardized beta represents the effect size of the relationship, and their corresponding p-values are corrected for multiple comparisons using the FDR procedure (Benjamini and Hochberg, 1995). As defined previously, these outcomes include sociodemographic information (income, education, etc.), health (percent obese, mortality rates, etc.), and voting trends (percentage voting Republican in the 2016 presidential election as compared to 2012, voter turnout, etc).
4 Results
4.1 A measure of self-reported trust
The trust measure demonstrated adequate reliability (α = 0.73) and was strongly correlated with other trust measures (Table 1), such as the Yamagishi inventory (r = 0.77) and the NORC-GSS inventory (r = 0.70; correlations with individual items in Supplementary Table S1, including the trust item from Rosenberg's Faith in People Scale) in a separate sample (N = 1,041, mean age = 33.3, 55% female).
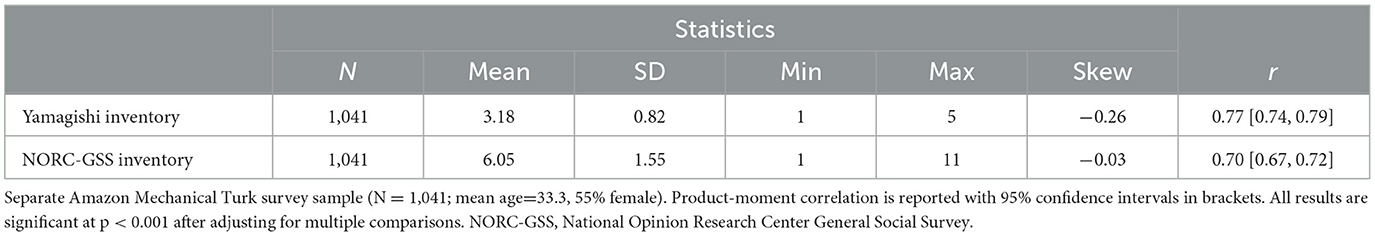
Table 1. Convergent validity: correlations with the three-item trust measure.
For the Facebook sample (N = 16,487), Table 2 provides descriptive information for the three items and the other variables available in the data set and correlations between these measures and survey-based, as well as language-based, trust. Here again, we observed strong convergent validity. As expected, trust is positively associated with related constructs such as fair-mindedness and self-disclosure. Among personality traits, the largest association is with overall agreeableness (agreeableness with the trust-facet items removed), although this correlation also demonstrates substantial independence between agreeableness and trust. Emotional stability was also strongly related to trust. Individual-level trust showed expected associations with health (physician visits, days sick) and wellbeing (life satisfaction). Our data also allowed for the exploration of some weak yet interesting associations with social behavior on the platform.
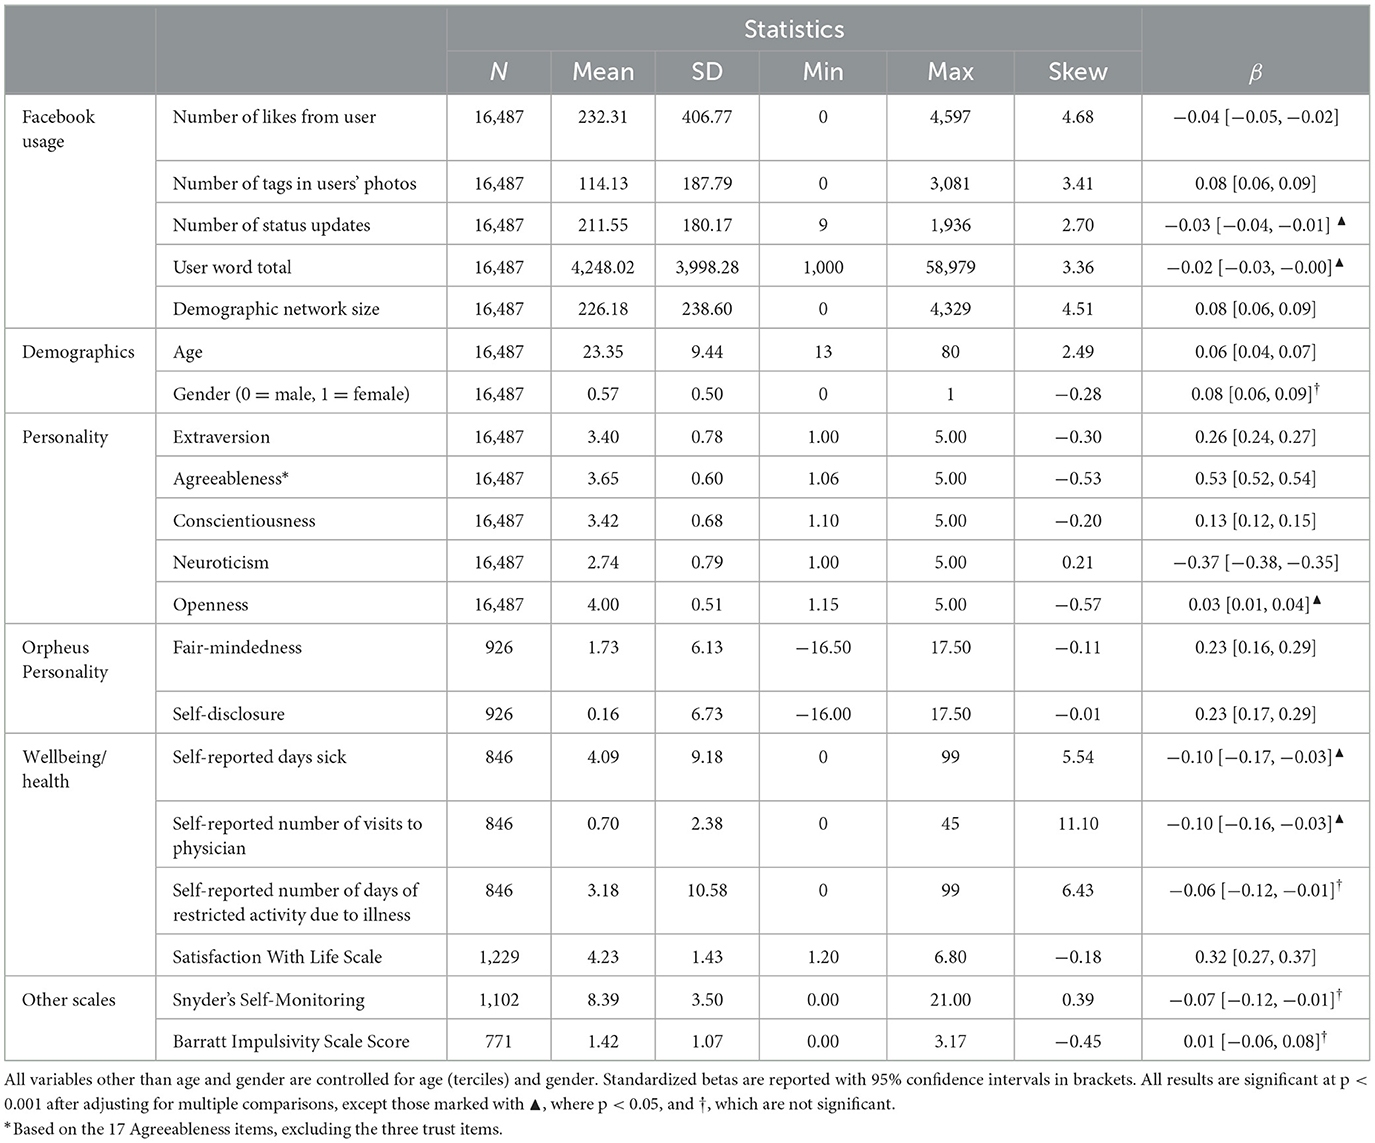
Table 2. Descriptives and correlations with the three-item trust measure in the Facebook sample.
4.2 The language of trust
4.2.1 Top-down correlates
Using the top-down computational linguistic analysis approach (LIWC 2015), the categories most associated with trust (see Table 3) were “positive emotions” (most frequent words in corpus: :), love, and good), followed by the “affiliation” (love, we, and friends) category. Other categories (in descending correlational strength order) were “time” (now, when, and back), “leisure” (fun, Facebook, and family), “work” (work, school, and class), “relative” (in, on, and at), “home” (home, house, bed, family, and room), “friend” (friends, dear, date, and contact), “achieve” (work, first, and lost), and “drives” (love, get, and good).
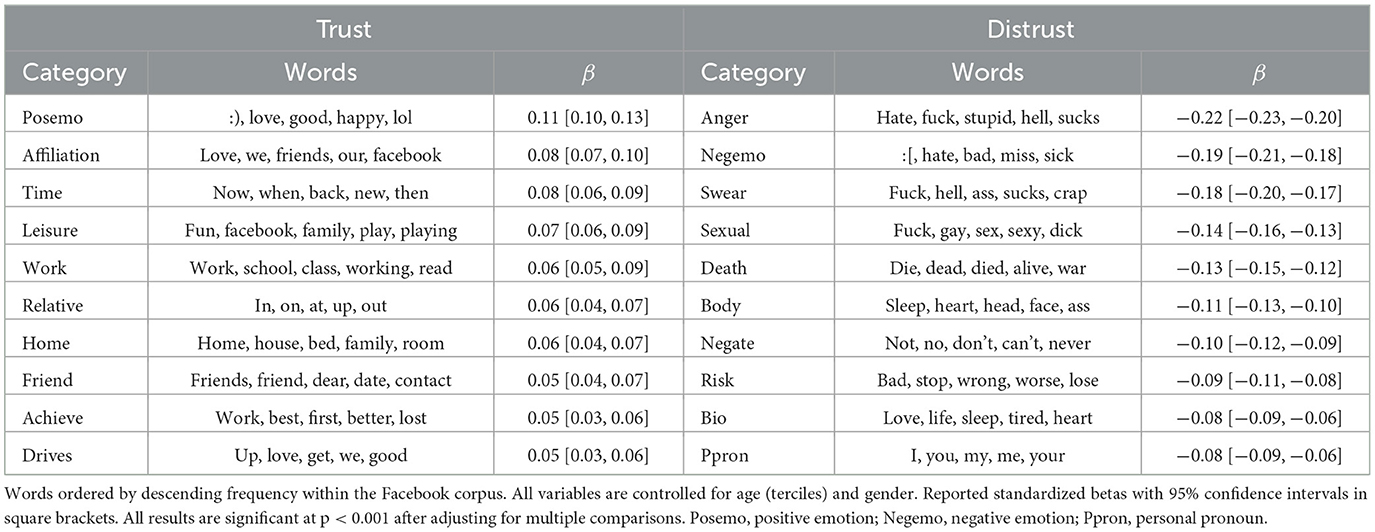
Table 3. Significant correlates of trust and distrust with Linguistic Inquiry and Word Count categories (p < 0.001, adjusted for multiple comparisons).
Distrust (operationalized as lower values on the three-item trust scale) showed overall stronger associations with LIWC categories (i.e., negative correlations between the trust scale and LIWC categories are considered associations between distrust and LIWC categories). It was correlated (in decreasing order) with “anger” (hate, fuck, and stupid), “negative emotions” (:(, hate, and bad), “swear” (fuck, hell, and ass), “sexual” (fuck, gay, and sex), “death” (die, dead, and died), followed by the “body” category (sleep, heart, head, and face), negation (no, don't, and can't), the “risk” category (bad, wrong, stop, lose, and worse), “bio” (life, tired, and heart), and personal pronouns (I, you, me, and your).
As the LIWC dictionaries are broad categories, this approach can sometimes be opaque due to aggregation. However, a look at the most frequent words within those categories suggests that trusting individuals appear to write more about relationships with others, leisure time activities, and achievement, while those lower in trust express anger and negativity, swear, and discuss bodily matters and problems.
4.2.2 Words and phrases associated with trust
The bottom-up computational linguistic analysis approach yielded similar results. Figure 1 visualizes the words and phrases most strongly related to trust (Figure 1A) and distrust (Figure 1B) based on the DLA. The language of trusting individuals was characterized by positivity (amazing, great, awesome, and wonderful), positive anticipation (next, forward to, and excited), and future orientation (tomorrow, afternoon, tomorrow morning, after, tonight, and Saturday). They referenced family and social events (camp, Christmas, party, tickets, meeting, and home), talked about travel (flight, packing, camp, trip, and airport), and appeared to act prosocially when congratulating others on their accomplishments and giving thanks (congrats, great performance, cheers, and proud).
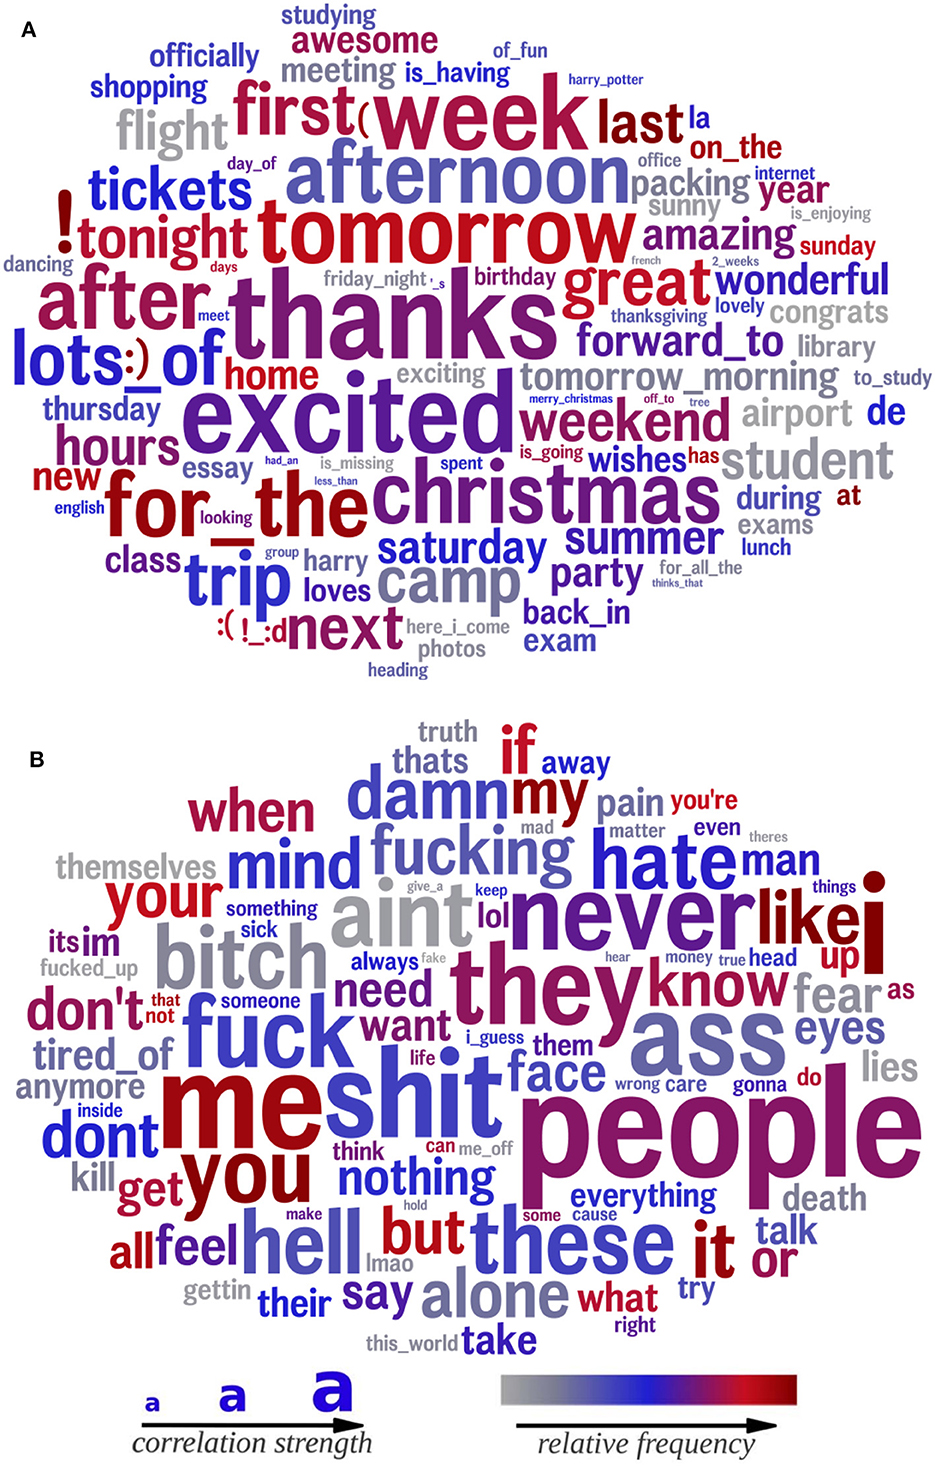
Figure 1. Words and phrases significantly correlated with trust (top; A) and distrust (bottom; B). Size indicates the relative strength of the correlation (larger = stronger correlation). The color indicates the frequency of use (gray = low frequency, blue = moderate frequency, red = high frequency). Age (terciles), gender, and non-trust agreeableness are controlled for. (A) Trust. (B) Distrust.
The language of individuals higher in distrust was characterized by greater negativity (never, hell, shut, fucking, and damn) and aggression (kill, bitch, and ass). The most frequent and highly correlated word of those higher in distrust is “people,” indicating frequent mention of unspecific others and making dehumanized generalizations. Notably, in addition to general negativity, distrusting individuals are negative about people (hate, bitch, people, and kill). They appear unhappy, fearful, and lonely (alone, fear, pain, and tired of ). They mention trust and honesty directly (trust, truth, wrong, and lies) and indirectly (face and eyes).
Figure 2 summarizes the topics most strongly correlated with trust and distrust. Supporting the word and phrase patterns, those higher in generalized trust referenced social events (couples, retreat, and buds) and family (kids, dinner, family, and lunch), and happy anticipation of future events, many of them social in nature (Saturday, party, and weekend). They referred to not only meals and traveling but also leadership roles (board, council, and leadership).
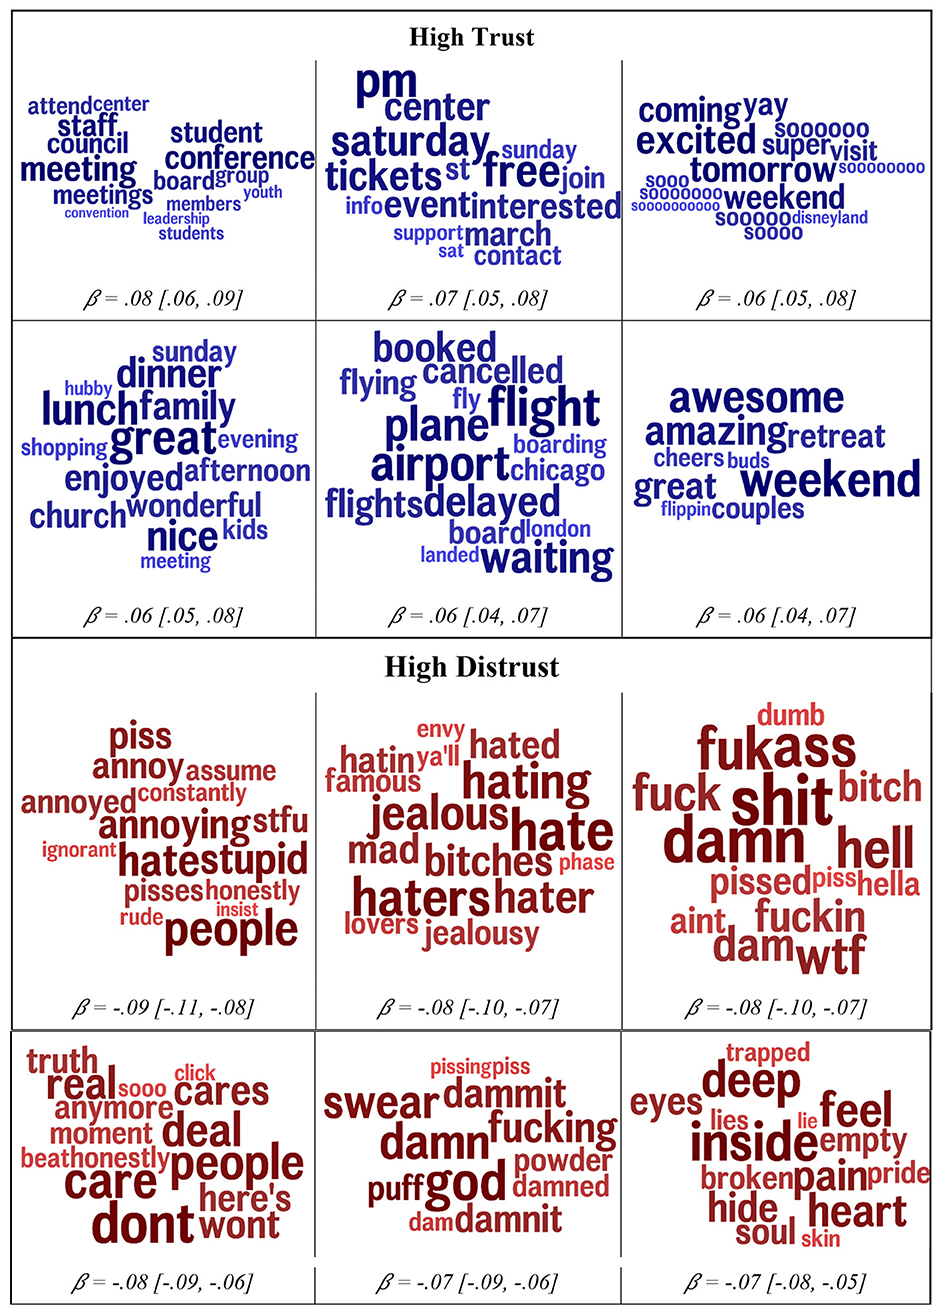
Figure 2. The automatically derived topics that were most strongly correlated with trust (top) and distrust (bottom). The size of the word indicates the relative contribution of each word to that topic. The color (darkness) is proportional to size. Age (terciles), gender, and non-trust agreeableness are controlled for. Standardized betas with 95% confidence intervals are reported.
Topics for distrust again reflected the single-word correlations. Those higher in distrust swore more, especially at or about others. The topics are generally negative in nature and express views of others as stupid, annoying, rude, ignorant, and uncaring (don't care). The word people is strongly correlated with low trust—it may be the case that referring to people en masse often reflects negative attitudes (e.g., “people are so rude”), whereas positive attitudes are more localized to persons or smaller communities.
Importantly, these words and phrases are used primarily to build language models for the purpose of prediction, yet the content of these correlates provides a rich source for hypothesis generation. We conjecture that the reference to planning, tickets, marches, and events may indicate that those higher in trust function as the planners and social engineers of their groups, taking a leadership role in their social worlds.
4.2.2.1 Investigating the relationship between trust and social language
Given that trust is characterized by more social behavior, we would expect the LIWC “social” category to be strongly associated with trust, which it is not (see Table 3). Therefore, we investigated the presence of the social words people and they as a marker of distrust, suspecting their use is more common in a negative context. Might those low in trust use people as a way to express their misanthropy, like in “those people”? We automatically computed an affective score for each message (Preotiuc-Pietro et al., 2016), normalized across the full corpus, and then selected a subset of the LIWC “social” category. If a message contained one of these words, it was tagged as a “social” message, while those containing the word people were tagged as “people” messages, and those containing the word they are tagged as “they” messages (note that “people” and “they” messages are subsets of all social messages). We calculated the mean affect of all social messages, as well as the subset of social messages containing people and they. As illustrated in Figure 3, social messages tended to be slightly more positive on average. However, the subset of those social messages that included people or they were significantly more negative in affect, demonstrating that the words people and they are more commonly used in negative social messages.
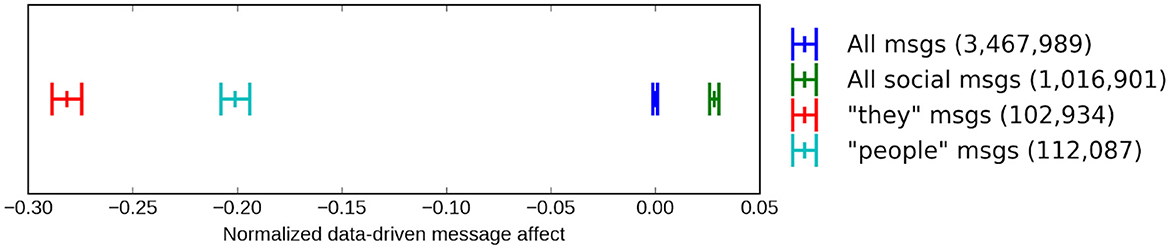
Figure 3. Mean affect score of messages containing, from left to right, they (red), people (light blue), all messages (blue; the baseline), and any of the 12 Linguistic Inquiry Word Count social words including people and they (green). The larger bars to the left and right of each indicate a 95% confidence interval.
We then create two versions of the LIWC “social” category: (1) one with people and they words alone and (2) one with people and they words removed. These two categories are then correlated with self-reported trust in an analysis identical to that in Section 4.2.1. LIWC “social” with people and they words alone correlated with trust at β = −0.10 (−0.11, −0.08), p < 0.001, while “social” with people and they words removed correlated with trust at β = −0.01 (−0.02, 0.01), p = 0.34. Thus, people who use people and they less scored higher in generalized trust. Social words other than people and they show no relationship with trust.
4.2.3 Language of trust across gender and age
Next, we examined the language of trust across gender and age groups. Figure 4 illustrates the words and phrases used more by trusting and distrusting males and females. The gray words indicate the similarities across gender in the language that distinguishes trust and distrust. The green words indicate a greater gender difference. Trusting males spoke of social plans and events (tickets, meet, dinner, and off to) and positive anticipation of future events (tonight and looking forward). Trusting females reflect positive sentiment (great time and excited) in anticipation of (excited to), during (is having), and as a result of events (great time and a great time) and speak of learning (studying).
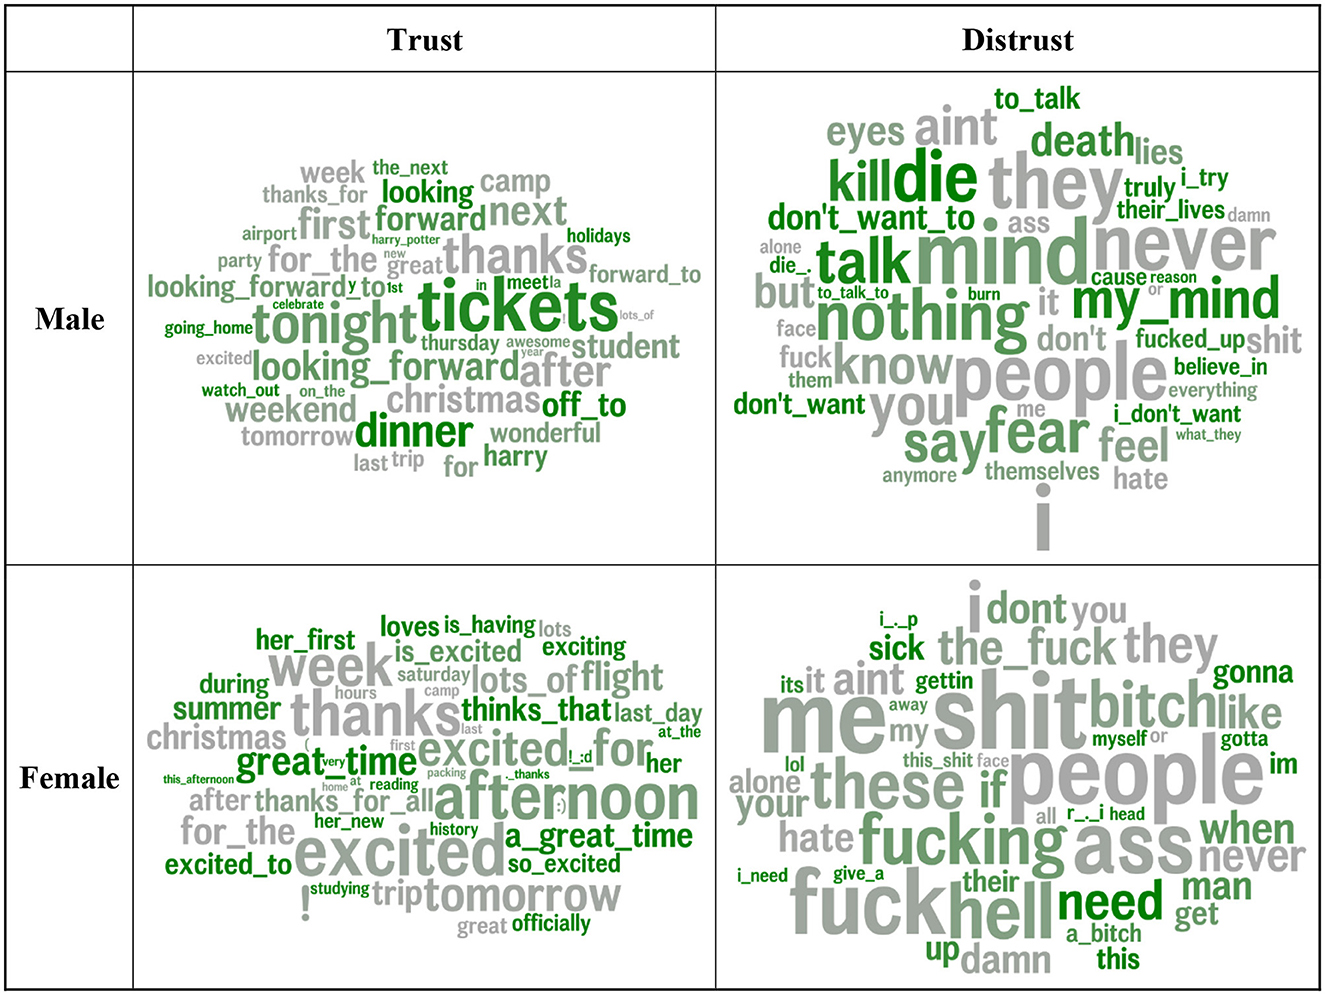
Figure 4. Word and multi-word phrases that were correlated most strongly with trust by gender. Word size corresponds to correlation magnitude. Features are colored by difference in effect size rank vs. other gender. Greener words (e.g., tickets for high-trust male users or need for low-trust female users) have relatively stronger correlations with trust compared to the correlation strength in the other gender. Gray words (e.g., people in low-trust and thanks in high-trust for both females and males), have similar correlation strengths across genders. Age and non-trust agreeableness are controlled for.
Distrusting males are characterized by aggression (kill, die, and death) and apathy (don't want to and nothing). Distrusting females express need (need, when, and I need). Notably, distrusting females tend to appear more masculine in their language, as swearing on social media tends to be indicative of masculinity (Schwartz et al., 2013b; Park et al., 2016).
Figure 5 distinguishes trusting and distrusting language across age groups. Words and phrases in gray are similarly associated with trust in all age groups, while those in green indicate a higher effect size rank in that age group compared to the average of the other two age groups. Expressions of gratitude (thanks), excitement, and general future orientation (tomorrow) were associated with trust in all age groups. People consistently correlated with distrust, with a similar rank across the age categories. Younger trusting users expressed wonder (can't believe), emotions (emojis), and arousal (! and !!!), holidays (tree and holidays), and school (test, exams, English, and science). Trusting individuals aged 19–23 were distinguished by positive anticipation (looking forward and looking forward to). Trusting individuals older than 23 mentioned places (home and office), travel (flight, ticket, and heading), and social events (party).
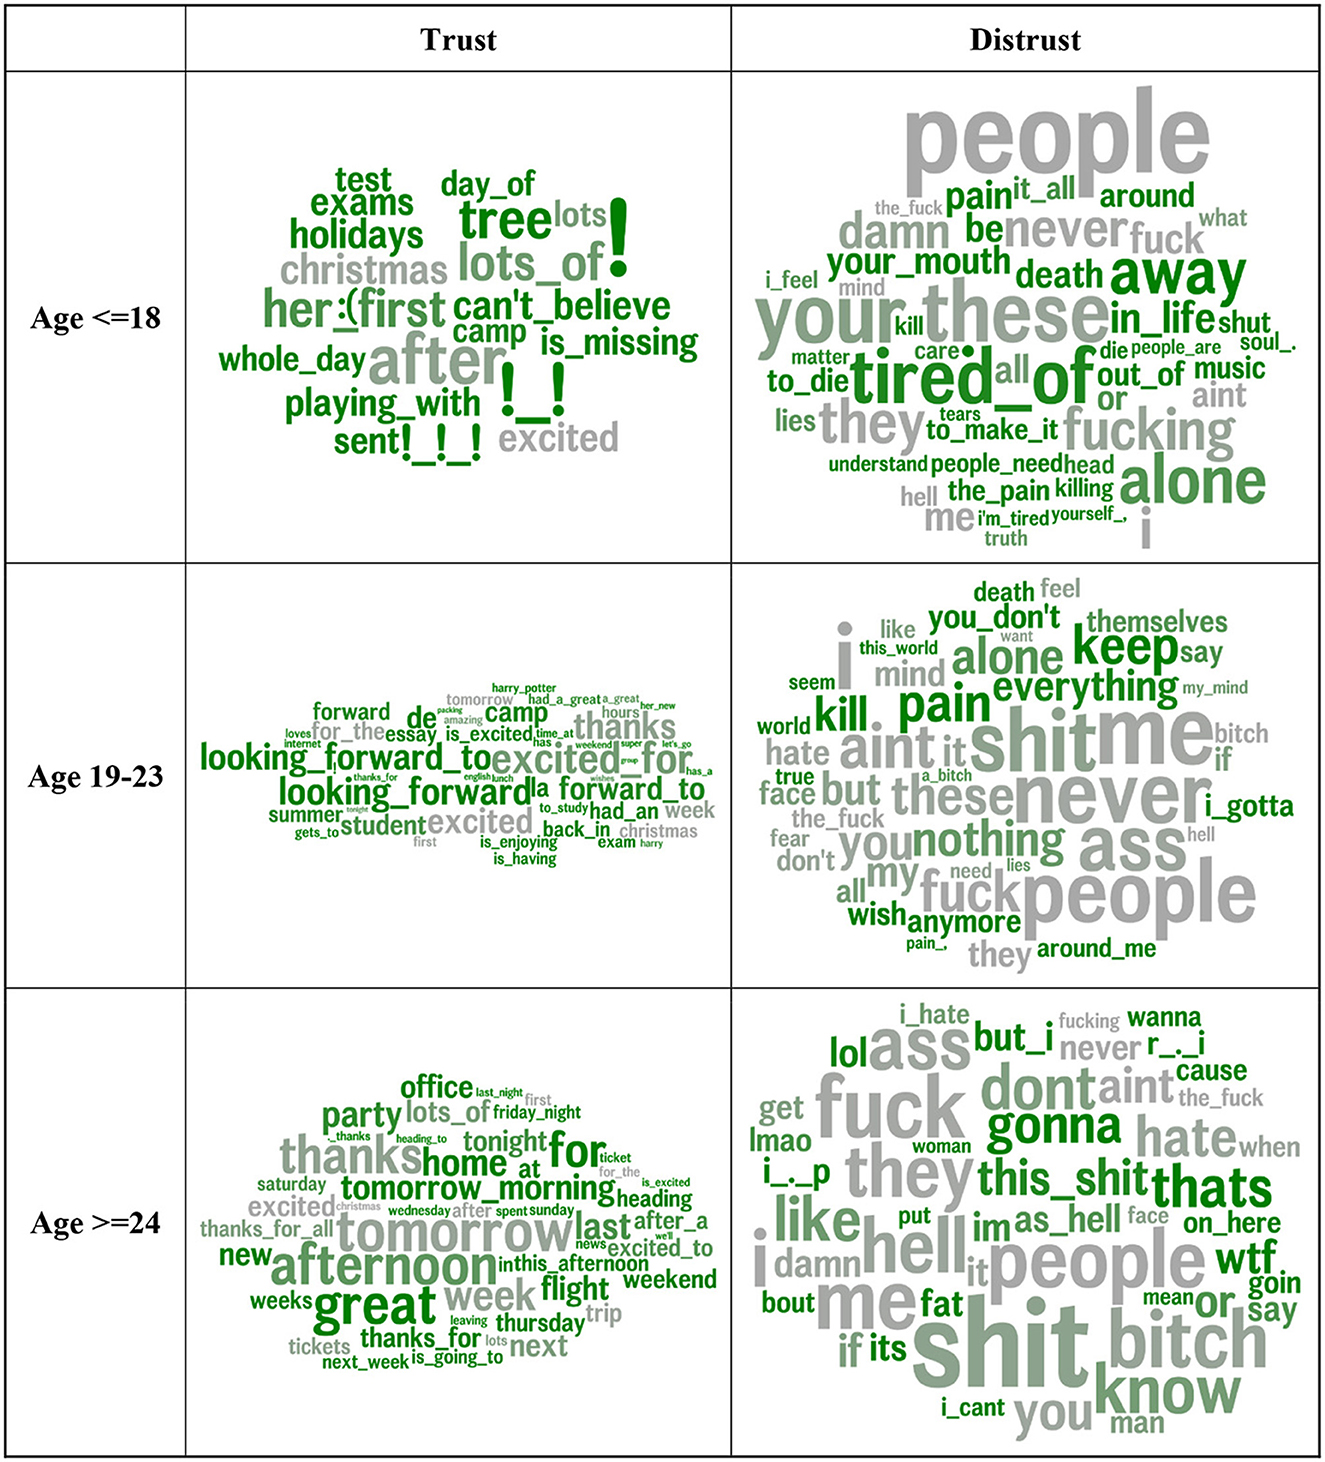
Figure 5. Word and multi-word phrases most strongly correlated with trust by age tertile. Word size corresponds to correlation magnitude. Features are colored by difference in effect size rank vs. other age bins. Green indicates relatively higher effect size rank in that age compared to the average of the other two bins. Gray words have similar correlation strengths across age groups. Gender and non-trust agreeableness are controlled for.
Younger distrusting individuals noted loneliness (alone), confusion (don't understand), and feeling bad (pain, worst, and i'm tired, to die). Distrusting individuals aged 19–23 spoke of aggression (kill) and emptiness (pain and nothing). The 24-and-older age group expressed profound negativity [this shit, wtf (“what the fuck”), and the hell].
The word size corresponds to correlation magnitude. Features are colored by the difference in effect size rank vs. the other gender. Greener words (e.g., tickets for high-trust male users or need for low-trust female users) have relatively stronger correlations with trust compared to the correlation strength in the other gender. Gray words (e.g., people in low-trust and thanks in high-trust females and males) have similar correlation strengths across genders. Age and non-trust agreeableness are controlled for.
4.3 A language-based model of trust
To assess the model accuracy, we compare the language-based trust estimates to self-reported trust in the test set. Results show that the model is accurate at MSE = 0.66 and product-moment correlation =0.49 (0.42, 0.56). These results are in line with accuracies predicting psychological constructs from social media text. Park et al. (2015) showed correlations between 0.35 and 0.43 between language-based personality estimates and self-reported personality.
For test–retest reliability, results are shown in Table 4 and were comparable to longitudinal correlations for other personality characteristics (Park et al., 2015). Scores were strongly correlated across the time points (range = 0.57–0.74), with decreasing strength over time.
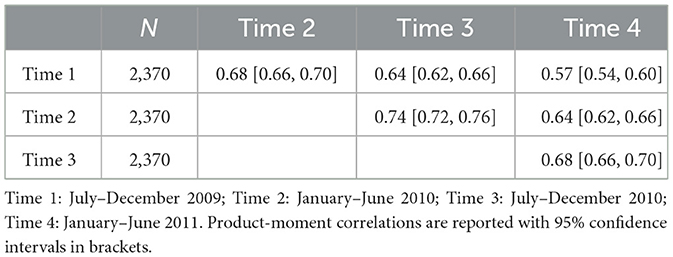
Table 4. Cross-time correlations of individual-level language-based assessments of trust.
In terms of convergent and divergent validity (i.e., comparing our trust measures to facets of agreeableness), the language-based measure was very strongly correlated with trust (βsurvey = 0.77) and moderately correlated with overall Agreeableness (βsurvey = 0.53), with the strongest correlation with the trust facet, and the weakest correlation with modesty (βsurvey = 0.12) and mortality (βsurvey = 0.12; see Table 5).
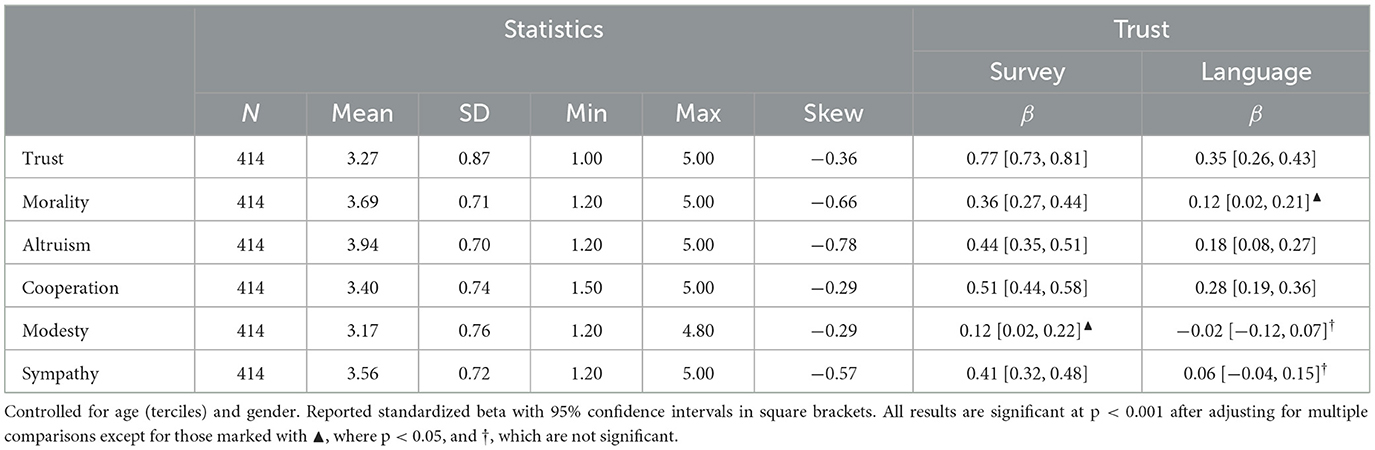
Table 5. Product-moment correlation with facets of agreeableness.
4.4 Validating a county-level trust assessment
We applied the Facebook-derived model to geotagged Tweets and mapped them to U.S. counties (see Figure 6), with higher trust in blue and lower trust in red. Strong regional variations emerge (see Supplementary Figure S5 for a map in which sex, age, race, population, log density, and log income are controlled for).
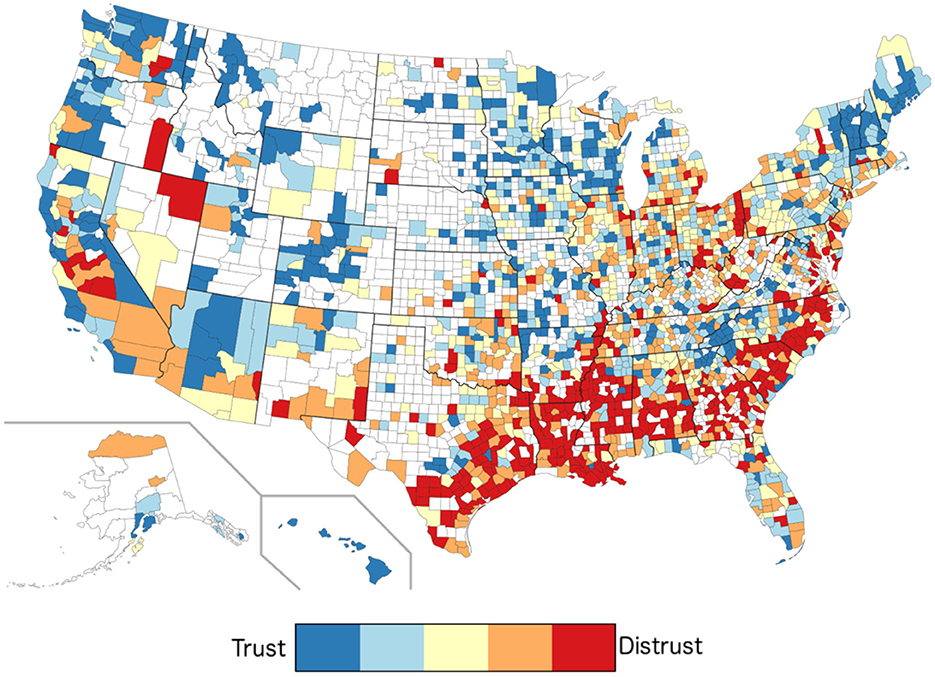
Figure 6. Levels of trust by U.S. counties. Red indicates higher levels of distrust; blue indicates higher levels of trust. White counties did not have sufficient Twitter language information available.
We compared our county-level language estimates against the Gallup–Sharecare Wellbeing Index. Items were chosen such that we predicted a positive relationship with trust. Table 6 shows the items with their predicted and actual relationships with trust. All but two items (Someone in your life encourages you to be healthy and Hours spent socially) matched our predictions.
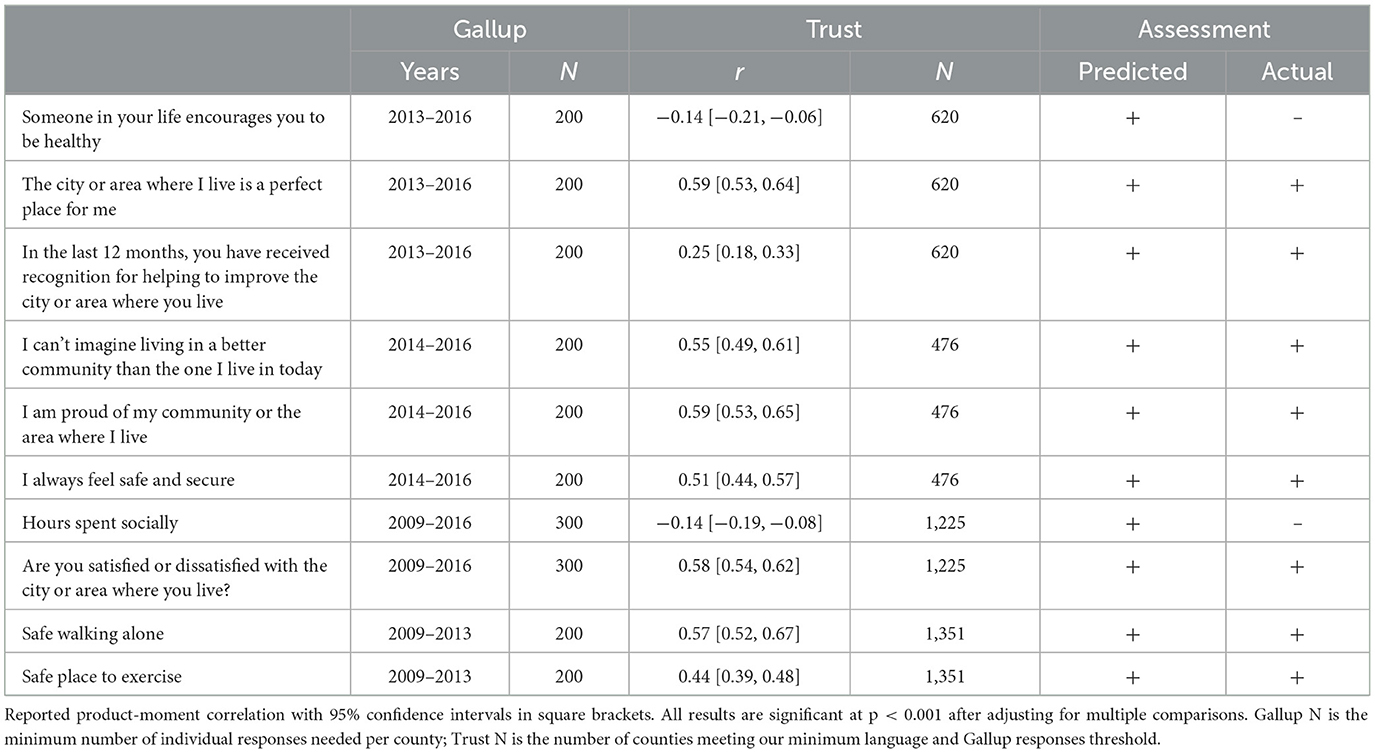
Table 6. Gallup–Sharecare Wellbeing Index and county-level language-based trust.
4.5 County-level trust correlates
Further county-level analyses (see Table 7) revealed that trust was associated with more education (greater rate of high school graduation), higher income, and greater population density. More trusting counties had a greater percentage of individuals living in committed, stable relationships, as indexed by higher marriage and same-sex household rates, while less trusting counties had a greater percentage of separated individuals. This mirrors findings at the individual level (Helliwell and Wang, 2011). Areas with more Evangelical Protestants were lower in trust, while areas with more mainline Protestants and Catholics were more trusting, again confirming previous findings at the individual level (see Supplementary Table S3; Welch et al., 2004). Counties with more income inequality showed lower trust, in agreement with previous findings (Kawachi et al., 1997). These results suggest that trusting communities are generally more affluent, educated, and religious. Importantly, trust is low in counties with ethnic, economic, and political diversity.
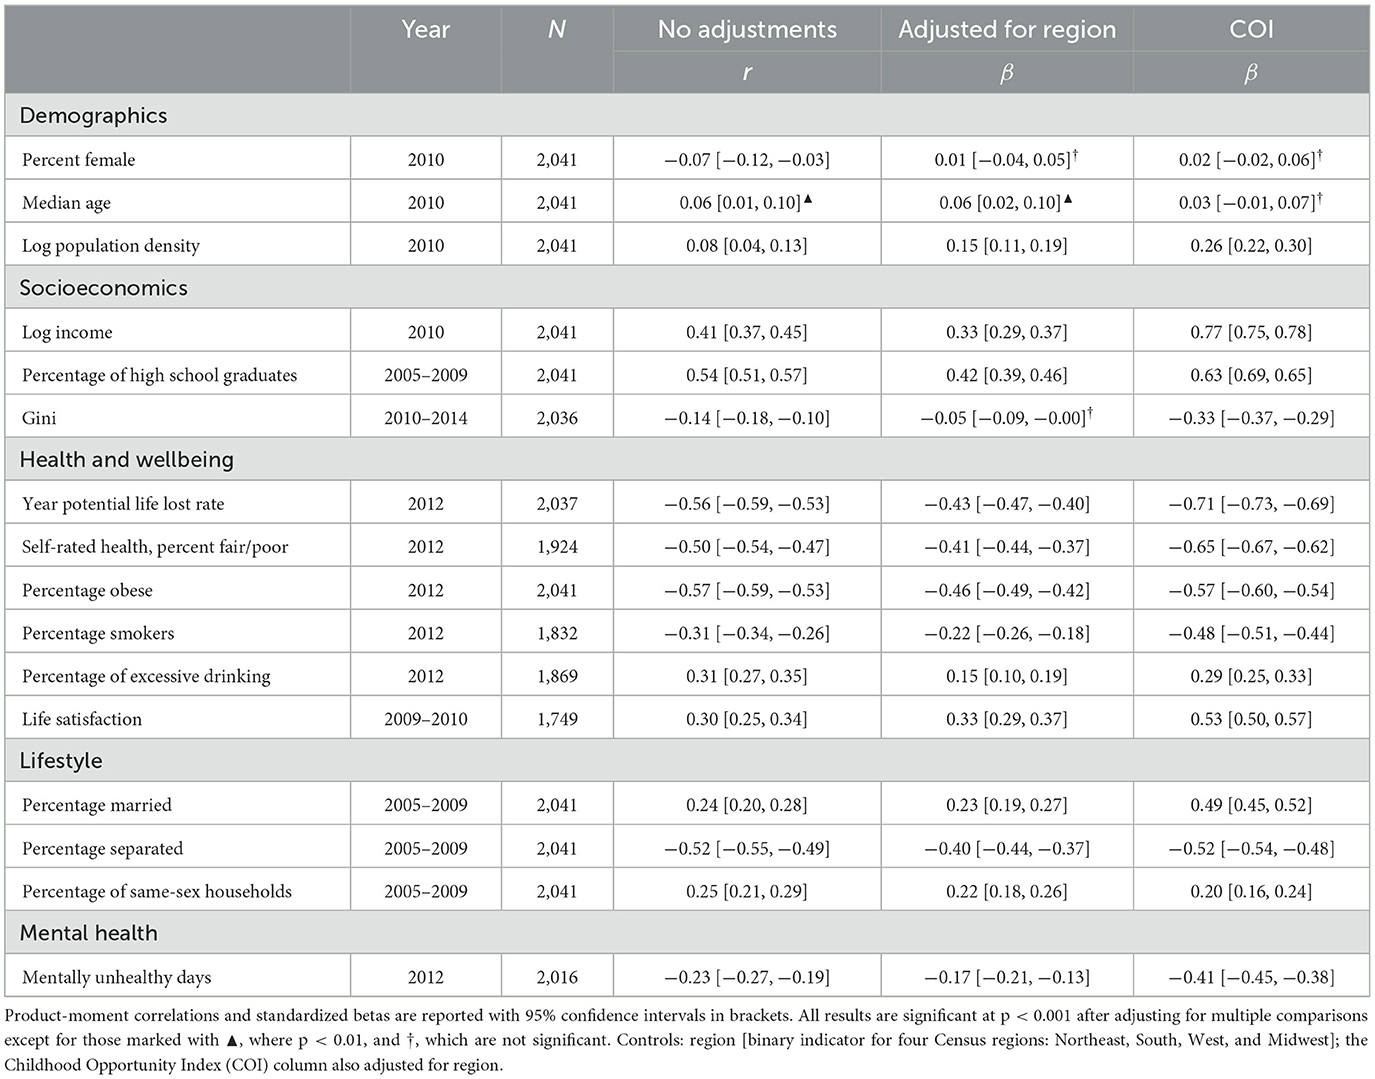
Table 7. County-level correlations between language-based trust and sociodemographics.
Strong links to health and wellbeing were evident as well. Trusting counties had better self-rated mental and physical health, confirming what has previously been observed at the state level (Abbott and Freeth, 2008). Trust was also associated with healthier lifestyles (including obesity and percentage of smokers) and greater longevity. Unlike individual-level research that found social capital to be protective against excessive drinking (Takakura, 2011), counties with greater rates of excessive drinking tend to be higher in trust. Counties with greater trust also enjoy greater life satisfaction (congruent with findings at the individual level; Helliwell and Wang, 2011).
Finally, we examined county trust in relation to county political factors (see Table 8). Trusting counties had higher voter turnout in the 2012 and 2016 presidential elections. Distrusting counties had a higher Trump vote gain vs. both the Romney vote (2012) and the average Republican vote in the previous four elections (2000, 2004, 2008, and 2012). Donation partisanship (more donations associated with a single party) was associated with more trust.
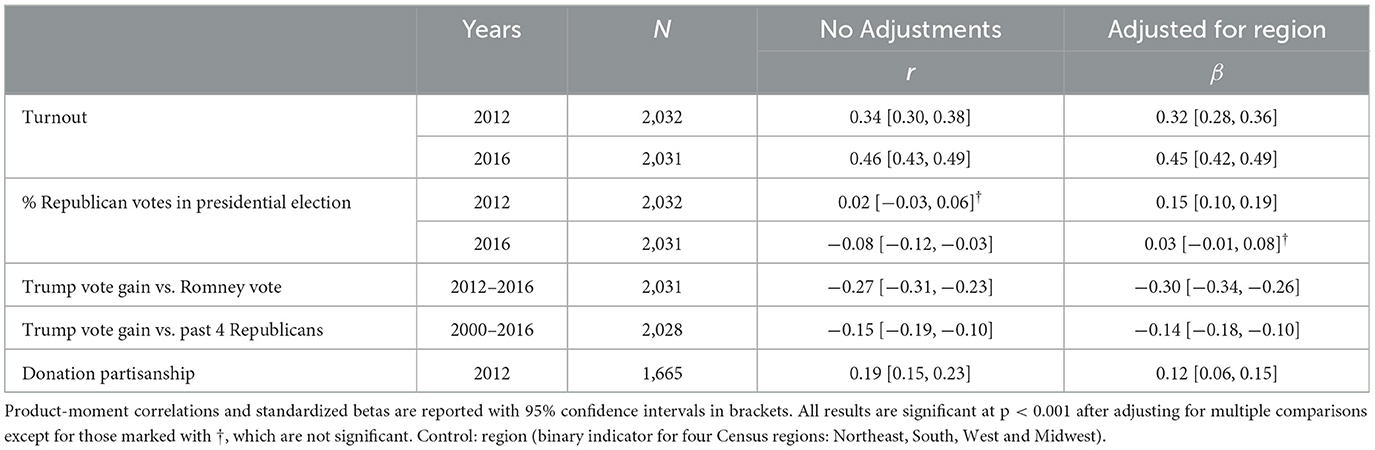
Table 8. County-level correlations between language-based trust and politics.
5 Discussion
Trust is a central topic in contemporary discourse on a number of social, political, and economic issues. To better understand and unobtrusively measure trust, we combined self-report questionnaires and linguistic data from Facebook to build a language-based assessment to measure trust at scale. We provided insights into the psychological characteristics of trusting and distrusting individuals and observed the correlational profile of trusting and distrusting communities. We demonstrated that social media language can be used to understand and measure trust and that the measurement can be scaled to estimate the trust of large populations.
Methods for estimating regional traits can be derived from combining text and psychometric data at an individual level, as demonstrated here. Spontaneous, in-the-moment reports of a person's thoughts and behaviors (e.g., social media posts) are a rich source of data. Such assessment provides emotional, cognitive, behavioral, and personality correlates of a construct quickly and inexpensively by revealing the words, phrases, and topics associated with one's score on a given construct. Here, we gained a broader, more accurate understanding of trust as a trait, as well as generated hypotheses regarding what may cause shifts in generalized trust. Our method can be used to complement traditional methods by providing researchers with a tool to measure trust at scale.
5.1 Individual-level correlates of trust
Consistent with prior research, age and gender correlations with trust were relatively weak (Feingold, 1994; Helliwell and Wang, 2011). The positive association found with fair-mindedness is congruent with the previously suggested association between trust in others and one's own trustworthiness (Ben-Ner and Putterman, 2001; Hardin, 2004). Consistent with prior research, those higher in trust were higher in subjective wellbeing (Helliwell and Wang, 2011) and reported fewer sick days and physician visits, suggesting that more trusting individuals also may be healthier.
We also explored the association of trust with Facebook behaviors. Users may “tag” other users in posts being shared (including images and posts referencing social events). We found that more trusting individuals “tagged” more people and had more “friends,” perhaps suggesting that trusting users are comfortable sharing personal content with more people.
5.2 The language of trust
Associations with LIWC 2015 categories provide a parsimonious overview of the language of trusting individuals, suggesting that those higher in trust express more positive emotions and reference more interpersonal affiliations. They seem to be both engaged in their social and professional lives, referencing not only work life as well as achievement but also relaxation, home, and family time. LIWC results are in line with trusting individuals leading relatively balanced lives. Those lower in trust express anger and negativity, swear, and discuss risk. Of particular note, greater generalized trust was not associated strongly with greater use of social words, in contrast with previous work suggesting trusting individuals are more social (Hardin, 2002). However, upon closer inspection, it turned out that the lack of association with social terms was driven by the negative effect of othering terminology (they and people were associated with distrust) that countered positive associations with other social words (e.g., we). This motivates the idea of observing open-vocabulary analyses that do not make a priori assumptions about words and group membership (Schwartz et al., 2013b).
Open-vocabulary approaches yielded more specific language associations. We found that trusting individuals mentioned travel (flight, packing, and airport), supporting recent evidence that a breadth of travel (number of times traveled) is associated with generalized trust (Cao et al., 2014). Trusting individuals appeared integrated into cohesive social networks due to their more frequent mention of them (family, kids, and couples), which seemed to involve initiating or participating in social outings (free, pm, interested, and march) and taking an optimistic, happy, and future-oriented outlook on life (excited and tomorrow) when approaching others. Trusting individuals appeared to be more socially engaged (meeting, event, board, and council) and prosocial (amazing, great, and cheers), perhaps taking an active role in making a positive difference for their social networks, communities, or causes they care about, for example, being a council member and attending meetings. This suggests the benefits of trust not just for the individual but also for employers and the greater community through positive effects on health, wellbeing, and overall flourishing.
The language of distrusting individuals was different, marked by misanthropy (stupid, annoyed, people, and bitches), hatred (hate, hating, and hatin), and swearing (fuck, damn, and ass) about or at others, but it was also indicative of social isolation, emotional pain, and sadness (pain, broken, inside, and empty), suggesting that these negative views of others are deeply upsetting and alienating. It is possible that those who experience rejection or alienation from others (e.g., bullying, discrimination, and rejection) develop lower levels of generalized trust. As to be expected, individuals low in trust also appeared to be preoccupied with others' flaws, such as lying and selfishness (eyes, truth, and lies), and to frequently experience conflict and discord in their relationships with others (people, don't care, and rude). A focus on the self is also characteristic of those low in trust (I and I'm).
Distrusting adolescents mentioned loneliness, disappointments, and feeling misunderstood, as well as thoughts about pain and death. During early adulthood, for those low in trust, pain topics still prevailed but were joined by expressions of not caring (anymore) and some aggression, while post-college aggressive sentiment dominates along with swearing. From adolescence into young adulthood, distrust appeared to shift from being more self-focused to being more other-focused, suggesting that individuals low in trust might perceive themselves as the cause for their discord with others and then blame others and become disillusioned later in life. These patterns align with theory and research suggesting that the younger years are more important for the formation of trust (Erikson, 1963; Inglehart, 1997; Putnam, 2000) before pain and disappointment morph into disengagement and anger. Those lower in trust also mentioned the words people and they more, which tends to be mentioned more in negative contexts. This holds for distrusting males and females (Figure 4) and all age groups (Figure 5). Following the construal level theory of psychological distance (Trope and Liberman, 2010), it is possible that those lower in trust think more often about people as abstract and larger collectives, while those higher in trust are more prone to focusing on individuals.
Future research could directly explore the malleable aspects of generalized trust (Glanville and Paxton, 2007). It would be interesting to examine changes in the level of trust within individuals over time, both as a function of key life events and as impacted by changes in the individual's social network. Whereas such an analysis would be almost impossible with self-reported information, requiring an intensive longitudinal design, the temporal and network-based structure of social media can allow such a dynamic analysis. Using multilevel modeling approaches, it would be possible to identify the factors that lead to the rise or demise of the social trust of individuals and communities, individual–community fit based on trust, and the success of interventions aimed at increasing social trust. A deeper understanding of how social trust is negotiated, maintained, reduced, and increased as a function of time will be crucial for determining how social trust can be improved both for individuals and for communities.
5.3 Correlates of county-level trust
County-level correlations (see Table 7) showed that more affluent areas and those with greater income equality are higher in trust, consistent with prior research (Nannestad, 2008). Trusting communities were also generally healthier and happier than distrusting communities, suggesting the importance of social cohesion and cooperation on regional health. A culture of mutual trust and respect may affect the health of its residents in a myriad of ways, from relying on health care and increasing one's family income to visiting doctors and following doctor's orders to taking advantage of public parks and other spaces to socialize and exercise. It has been suggested that building communities that are safe, walkable, and encourage positive social interactions may benefit both the sense of trust and the economic, physical, and mental wellbeing of the community (Jackson, 2003; Mason, 2010).
A notable exception of these positive effects of generalized trust at the community level is seen in a positive association with excessive drinking, a generally socially negative health behavior (Kuntsche et al., 2017). While it is possible that some third variable explains this relationship [although we controlled for socioeconomic status (SES) and region], it is plausible that trust may make people more comfortable to drink, as they are less concerned about interpersonal risks or that trusting communities celebrate together more. The role of alcohol in forming social bonds and trust is worth further study.
Otherwise, areas with greater distrust were those at greater risk of being unhealthy and premature death. It might be that these communities are marked by infrastructural deficits that do not allow for easy access to social interaction (e.g., long distances to recreational centers for social activity and exercise coupled with poor walkability and access to public transportation, a lack of social events, and a lack of safe, public places for gathering; Cohen and Inagami, 2005; Diez Roux and Mair, 2010) or that a culture of negativity makes it unattractive to spend time being active and interacting with others (Eichstaedt et al., 2015). This would be in line with suggestions that designing public spaces to make walking and socializing with others attractive will encourage embeddedness in social groups and promote health and longevity (Buettner, 2008).
Finally, Table 7 shows the relationship between the COI and the county-level outcomes. This index (and similar disadvantage indices) is currently used to allocate resources and guide policy decisions (Lou et al., 2023). The effect sizes for the COI are slightly larger, which is to be expected because this is a composite index built from 29 U.S. Census variables, as opposed to a language-based psychological construct. Nevertheless, the magnitude and direction effect sizes for the language-based trust measure and the COI are comparable, showing that our trust measure could be used in similar real-world settings to help develop effective interventions or even guide policy decisions. For example, the language of highly trusting individuals contains references to traveling, community events, and time with friends and family. This may suggest that for trust to be built, individuals may need to connect both with their own community more as well as travel outside of it, although more research is needed to draw firm conclusions on this point. Furthermore, continuous monitoring through language assessment could be deployed in aid to those who wish to reverse the general decrease in trust in the United States. Best practices for fostering trust across social, economic, and political divisions need to be established, shared, and tested. While causality has not been addressed here, the correlations suggest that fostering trust may well be important for improving the health and prosperity of communities. This may be particularly the case in highly fractionalized communities.
5.4 Politics and trust
In the United States, confidence in institutions has been on the decline over the past several decades (Gallup, 2022). One way to examine the implications of this trend is to consider the relationship between trust and voter preference. We found the relationship between trust and party preference shifted between the 2012 and the 2016 presidential elections. The correlation between trust and Republican vote share moved away from the positive toward the negative. More aligned were the county trust levels and the votes gained by the 2016 Republican candidate (Donald Trump) over previous Republican candidates. Trump was supported more in counties that used language indicative of high distrust.
Donald Trump's election win was surprising to many (Flegenheimer and Barbaro, 2016). Early work to explain the result employed postelection surveys and focused on demographic segments (especially the “white working class”), ascribing motives based on personal identity (Morgan and Lee, 2018; Schaffner et al., 2018). The prospective data-driven approach employed here, however, enabled a window into trust based on verbal behavior during the campaigns. Together, the open-vocabulary method and large social media language data set covered orders of magnitude more people and more open-ended themes for hypothesis testing. Importantly, the data are longitudinal, providing data before, during, and after the election.
Two possible hypotheses follow from the pattern of results. First, communities lower in generalized trust prefer populist candidates (those that attempt to appeal directly to voters and circumvent parties, the media, and other institutions) to establishment candidates. Second, decreasing levels of generalized trust lead to lower vote shares for incumbent and incumbent-party candidates. These predictions are speculative—based on one surprising election result, but the real-time and local nature of the social media data could allow for future evaluations to be tested in a principled way—by predicting which type of candidate will be unexpectedly popular both locally and nationally.
5.5 Limitations
Several limitations of this study should be acknowledged. First, at the time of data collection, social media users tended to be younger than the general population (Duggan and Smith, 2013), and, accordingly, most participants in our sample were young adults (median age = 20, range = 13–80). Still, we are able to control for age in our analyses, and due to the overall size of our data, we still have more participants 30 and older (N = 3,354) than most samples in trust research, which primarily occurs with university students.
Second, the current article is based on a survey-based measure of trust that utilizes trust items taken from the NEO-PI-R (Costa and McCrae, 1992). This scale is one of the most established measures of trust and has been used in previous research (Colquitt and Scott, 2007; Graziano and Tobin, 2017) and was highly correlated with other established trust scales. However, it is possible that if we fit our language-based model to a different scale, then it would have slightly different properties. Trust research has been criticized in general for its flawed assessment (e.g., Glaeser et al., 2000; Evans and Revelle, 2008; Nannestad, 2008), and a social media approach provides a valid alternative for future research that reduces problems with traditional self-report survey measures, including recency effects, recall bias, difficulty accessing diverse populations, and cost (Park et al., 2015; Vazire, 2015).
Third, a key question and potential limitation for all online behavior-based research is whether it reflects their offline personality and whether behavior online is consistent with offline behavior. Research establishing the validity of social media methods has demonstrated that there is a good indication that users tend to present themselves accurately to their social network (Kosinski et al., 2013).
Fourth, we identified a variety of correlates at the individual and community levels. While the multi-test corrections to significance give confidence to the reliability of these results, they do not suggest causal relationships. Other studies, using a variety of methodologies and samples, would replicate and refine the pattern of results revealed through our analyses using more targeted hypotheses.
6 Conclusion
Trust is a topic at the center of contemporary social, economic, and political discourse. In this study, we systematically identified reliable correlations between individuals' language and their scores on traditional generalized trust scales. Additionally, we introduced a social media language-based assessment of trust that can be used to estimate the level of trust or distrust within communities. This measure demonstrated meaningful regional variation across U.S. counties. This work provides insights into how individuals higher vs. lower in generalized trust differ, suggests a method to consistently and persistently monitor trust in large populations, and identifies key correlates of trust at the community level.
Data availability statement
The data analyzed in this study is subject to the following licenses/restrictions: due to the sensitive and potentially identifying nature of Facebook language data, we are unable to share the individual-level data. The county-level trust estimates are available at: https://osf.io/ap8rx/. Requests to access these datasets should be directed at: SG, sal.giorgi@gmail.com.
Ethics statement
The studies involving humans were approved by the University of Pennsylvania's Institutional Review Board (protocol #813820). The studies were conducted in accordance with the local legislation and institutional requirements. The participants provided their written informed consent to participate in this study.
Author contributions
SG: Data curation, Formal analysis, Software, Visualization, Writing – original draft. JJ: Writing – original draft, Methodology, Validation. AB: Writing – original draft, Conceptualization, Methodology, Project administration, Supervision. JCE: Writing – review & editing, Validation. PC: Data curation, Formal analysis, Software, Visualization, Writing – review & editing. DY: Writing – review & editing. JE: Writing – review & editing, Project administration. MZ: Writing – review & editing, Formal Analysis. JK: Writing – review & editing, Project administration. LS: Writing – review & editing, Project administration. MS: Writing – review & editing, Funding acquisition. MK: Writing – review & editing. LU: Writing – review & editing, Funding acquisition, Methodology, Supervision. HS: Conceptualization, Formal Analysis, Funding acquisition, Methodology, Supervision, Writing – original draft.
Funding
The author(s) declare that financial support was received for the research, authorship, and/or publication of this article. This work was funding in part by the National Institutes of Health through grants, R01 AA028032-01: NIH-NIAAA and R01 MH125702-01: NSF-NIH Smart and Connected Health, the National Science Foundation under grants IIS-1927227 and CCF-2208664, and the Templeton Religion Trust.
Conflict of interest
The authors declare that the research was conducted in the absence of any commercial or financial relationships that could be construed as a potential conflict of interest.
The author(s) declared that they were an editorial board member of Frontiers, at the time of submission. This had no impact on the peer review process and the final decision.
Publisher's note
All claims expressed in this article are solely those of the authors and do not necessarily represent those of their affiliated organizations, or those of the publisher, the editors and the reviewers. Any product that may be evaluated in this article, or claim that may be made by its manufacturer, is not guaranteed or endorsed by the publisher.
Supplementary material
The Supplementary Material for this article can be found online at: https://www.frontiersin.org/articles/10.3389/frsps.2024.1384262/full#supplementary-material
References
Abbott, S., and Freeth, D. (2008). Social capital and health: starting to make sense of the role of generalized trust and reciprocity. J. Health Psychol. 13, 874–883. doi: 10.1177/1359105308095060
Acevedo-Garcia, D., Noelke, C., McArdle, N., Sofer, N., Hardy, E. F., Weiner, M., et al. (2020). Racial and ethnic inequities in children's neighborhoods: evidence from the New Child Opportunity Index 2.0: study uses the Child Opportunity Index 2.0 to examine geographic and racial/ethnic inequities children are exposed to in the one hundred largest metropolitan areas of the United States. Health Aff. 39, 1693–1701. doi: 10.1377/hlthaff.2020.00735
Benjamini, Y., and Hochberg, Y. (1995). Controlling the false discovery rate: a practical and powerful approach to multiple testing. J. R. Stat. Soc. B 57, 289–300. doi: 10.1111/j.2517-6161.1995.tb02031.x
Ben-Ner, A., and Putterman, L. (2001). Trusting and trustworthiness. Boston Univ. Law Rev. 81, 523–552.
Berg, J., Dickhaut, J., and McCabe, K. (1995). Trust, reciprocity, and social history. Games Econ. Behav. 10, 122–142. doi: 10.1006/game.1995.1027
Bienvenu, O. J., Samuels, J. F., Costa, P. T., Reti, I. M., Eaton, W. W., Nestadt, G., et al. (2004). Anxiety and depressive disorders and the five-factor model of personality: a higher-and lower-order personality trait investigation in a community sample. Depress. Anxiety 20, 92–97. doi: 10.1002/da.20026
Blei, D. M., Ng, A. Y., and Jordan, M. I. (2003). Latent dirichlet allocation. J. Mach. Learn. Res. 3, 993–1022. doi: 10.5555/944919.944937
Bond, M. H., and Cheung, T. S. (1983). College students' spontaneous self-concept: the effect of culture among respondents in Hong Kong, Japan, and the United States. J. Cross-Cult. Psychol. 14, 153–171. doi: 10.1177/0022002183014002002
Bonica, A. (2016). Database on Ideology, Money in Politics, and Elections: Public version 2.0. Stanford, CA: Stanford University Libraries. Available online at: https://data.stanford.edu/dime
Brewer, K. B., Oh, H., and Sharma, S. (2014). “Crowding in” or “crowding out”? An examination of the impact of the welfare state on generalized social trust. Int. J. Soc. Welf. 23, 61–68. doi: 10.1111/ijsw.12019
Buettner, D. (2008). The Blue Zone: Lessons for Living Longer from the People Who've Lived the Longest. Washington, DC: National Geographic.
Cao, J., Galinsky, A. D., and Maddux, W. W. (2014). Does travel broaden the mind? Breadth of foreign experiences increases generalized trust. Soc. Psychol. Personal. Sci. 5, 517–525. doi: 10.1177/1948550613514456
Cappelen, C., Linde, J., and Olander, P. (2020). Gen(d)eralized trust: an experimental approach to interpersonal trust and gender sensitivity. Comp. Sociol. 19, 237–258. doi: 10.1163/15691330-BJA10010
Carl, N., and Billari, F. C. (2014). Generalized trust and intelligence in the United States. PLoS ONE 9:e91786. doi: 10.1371/journal.pone.0091786
Claibourn, M. P., and Martin, P. S. (2000). Trusting and joining? An empirical test of the reciprocal nature of social capital. Polit. Behav. 22, 267–291. doi: 10.1023/A:1010688913148
Cohen, D., and Inagami, S. (2005). Neighborhood effects and the role of communities in restructuring. Rand Health Working Papers (no WR-310). Available online at: https://www.rand.org/content/dam/rand/pubs/working_papers/2005/RAND_WR310.pdf
Colquitt, J. A., and Scott, B. A. LePine, J. A. (2007). Trust, trustworthiness, and trust propensity: a meta-analytic test of their unique relationships with risk taking and job performance. J. Appl. Psychol. 92, 909–927. doi: 10.1037/0021-9010.92.4.909
Costa, P. T., and McCrae, R. R. (1992). Normal personality assessment in clinical practice: the NEO Personality Inventory. Psychol. Assess. 4, 5–13. doi: 10.1037/1040-3590.4.1.5
Costa, P. T., and McCrae, R. R. (2008). “The revised NEO personality inventory (NEO-PI-R),' in The SAGE Handbook of Personality Theory and Assessment, eds. G. J. Boyle, G. Matthews, and D. H. Saklofske, Vol. 2 (Thousand Oaks, CA: Sage), 179–198. doi: 10.4135/9781849200479.n9
Couch, L. L., and Jones, W. H. (1997). Measuring levels of trust. J. Res. Pers. 31, 319–336. doi: 10.1006/jrpe.1997.2186
County Health Rankings and Roadmaps (2012). Rankings Data. Available online at: http://www.countyhealthrankings.org/explore-health-rankings/rankings-data-documentation/national-data-documentation-2010-2016
Croson, R., and Buchan, N. (1999). Gender and culture: international experimental evidence from trust games. Am. Econ. Rev. 89, 386–391. doi: 10.1257/aer.89.2.386
Curtis, B., Giorgi, S., Buffone, A. E., Ungar, L. H., Ashford, R. D., Hemmons, J., et al. (2018). Can Twitter be used to predict county excessive alcohol consumption rates? PLoS ONE 13:e0194290. doi: 10.1371/journal.pone.0194290
Davis, J. A., and Smith, T. W. (1991). General Social Surveys, 1972-1991: Cumulative Codebook (No. 12). Chicago, IL: National Opinion Research Center (NORC).
Delhey, J., and Newton, K. (2005). Predicting cross-national levels of social trust: global pattern or nordic exceptionalism? Eur. Sociol. Rev. 21, 311–327. doi: 10.1093/esr/jci022
Delhey, J., Newton, K., and Welzel, C. (2011). How general is trust in “most people”? Solving the radius of trust problem. Am. Sociol. Rev. 76, 786–807. doi: 10.1177/0003122411420817
Diener, E. D., Emmons, R. A., Larsen, R. J., and Griffin, S. (1985). The satisfaction with life scale. J. Pers. Assess. 49, 71–75. doi: 10.1207/s15327752jpa4901_13
Diez Roux, A. V., and Mair, C. (2010). Neighborhoods and health. Ann. N. Y. Acad. Sci. 1186, 125–145. doi: 10.1111/j.1749-6632.2009.05333.x
Dinesen, P. T., and Bekkers, R. (2017). “‘The Foundations of Individuals' generalized social trust: a review,” in Trust in Social Dilemmas. Series in Human Cooperation, Volume 2, eds. P. A. M. Van Lange, B. Rockenbach, and T. Yamagishi (Oxford: Oxford University Press).
Duggan, M., and Smith, A. (2013). Social media update 2013. Pew Research Center's Internet and American Life Project. Available online at: http://www.pewinternet.org/2013/12/30/social-media-update-2013/
Ebert, T., Götz, F. M., Mewes, L., and Rentfrow, P. J. (2022). Spatial analysis for psychologists: how to use individual-level data for research at the geographically aggregated level. Psychol. Methods. 28, 1100–1121. doi: 10.1037/met0000493
Eichstaedt, J. C., Schwartz, H. A., Kern, M. L., Park, G., Labarthe, D. R., Merchant, R. M., et al. (2015). Psychological language on Twitter predicts county-level heart disease mortality. Psychol. Sci. 26, 159–169. doi: 10.1177/0956797614557867
Eldblom, E., and Jarl, T. (2012). Can we Trust the Measurement of Trust? Investigating the Validity of the Standard Trust Question [Bachelor's dissertation]. Available online at: http://lup.lub.lu.se/student-papers/record/3054958
Evans, A. M., and Revelle, W. (2008). Survey and behavioral measurements of interpersonal trust. J. Res. Pers. 42, 1585–1593. doi: 10.1016/j.jrp.2008.07.011
Fairbrother, M., and Martin, I. W. (2013). Does inequality erode social trust? Results from multilevel models of US states and counties. Soc. Sci. Res. 42, 347–360. doi: 10.1016/j.ssresearch.2012.09.008
Feingold, A. (1994). Gender differences in personality: a meta-analysis. Psychol. Bull. 116, 429–456. doi: 10.1037/0033-2909.116.3.429
Flegenheimer, M., and Barbaro, M. (2016). Donald Trump is Elected President in Stunning Repudiation of the Establishment. Available online at: https://www.nytimes.com/2016/11/09/us/politics/hillary-clinton-donald-trump-president.html
Friedman, U. (2018). Trust is collapsing in America. The Atlantic. available online at: https://www.theatlantic.com/international/archive/2018/01/trust-trump-america-world/550964/
Gallup (2022). Average Confidence in Major US Institutions, 1979-2022. Available online at: https://news.gallup.com/poll/394283/confidence-institutions-down-average-new-low.aspx
Gelfand, A. E., and Smith, A. F. (1990). Sampling-based approaches to calculating marginal densities. J. Am. Stat. Assoc. 85, 398–409. doi: 10.1080/01621459.1990.10476213
Giorgi, S., Nguyen, K. L., Eichstaedt, J. C., Kern, M. L., Yaden, D. B., Kosinski, M., et al. (2022). Regional personality assessment through social media language. J. Pers. 90, 405–425. doi: 10.1111/jopy.12674
Giorgi, S., Preotiuc-Pietro, D., Buffone, A., Rieman, D. Ungar, L., and Schwartz, H. A. (2018). “The remarkable benefit of user-level aggregation for lexical-based population-level predictions,” in Proceedings of the 2018 Conference on Empirical Methods in Natural Language Processing (EMNLP) (Brussels). doi: 10.18653/v1/D18-1148
Glaeser, E. L., Laibson, D. I., Scheinkman, J. A., and Soutter, C. L. (2000). Measuring trust. Q. J. Econ. 115, 811–846. doi: 10.1162/003355300554926
Glanville, J. L., and Paxton, P. (2007). How do we learn to trust? A confirmatory tetrad analysis of the sources of generalized trust. Soc. Psychol. Q. 70, 230–242. doi: 10.1177/019027250707000303
Graziano, W. G., and Tobin, R. M. (2017). “Agreeableness and the five-factor model,” in The Oxford Handbook of the Five Factor Model of Personality, eds. T. Widiger (New York, NY: Oxford University Press). doi: 10.1093/oxfordhb/9780199352487.013.17
Grönlund, K., and Setälä, M. (2007). Political trust, satisfaction and voter turnout. Comp. Eur. Polit. 5, 400–422. doi: 10.1057/palgrave.cep.6110113
Grootaert, C., Narayan, D., Jones, V. N., and Woolcock, M. (2004). Measuring social capital: an integrated questionnaire. World Bank. Available online at: https://documents1.worldbank.org/curated/ru/515261468740392133/pdf/281100PAPER0Measuring0social0capital.pdf
Hardin, R. (2002). Trust and Trustworthiness: A Volume in the Russell Sage Foundation series on Trust. New York, NY: Russell Sage Foundation.
Harrington, M. (2017). Survey: People's Trust has Declined in Business, Media, Government, and Ngos. Brighton, MA: Harvard Business Review.
Hastie, T., Tibshirani, R., and Friedman, J. (2009). The Elements of Statistical Learning: Data Mining, Inference and Prediction. Berlin: Springer. doi: 10.1007/978-0-387-84858-7
Helliwell, J. F., and Wang, S. (2011). Trust and well-being. Int. J. Wellbeing 1, 42–78. doi: 10.5502/ijw.v1i1.3
Hooghe, M., Marien, S., and de Vroome, T. (2012). The cognitive basis of trust. The relation between education, cognitive ability, and generalized and political trust. Intelligence 40, 604–613. doi: 10.1016/j.intell.2012.08.006
Hooghe, M., and Oser, J. (2017). Partisan strength, political trust and generalized trust in the United States: an analysis of the General Social Survey, 1972–2014. Soc. Sci. Res. 68, 132–146. doi: 10.1016/j.ssresearch.2017.08.005
Hooghe, M., Reeskens, T., Stolle, D., and Trappers, A. (2009). Ethnic diversity and generalized trust in Europe: a cross-national multilevel study. Comp. Polit. Stud. 42, 198–223. doi: 10.1177/0010414008325286
Inglehart, R. (1997). Modernization and Postmodernization. Princeton, NJ: Princeton University Press. doi: 10.1515/9780691214429
Jackson, L. E. (2003). The relationship of urban design to human health and condition. Landsc. Urban Plan. 64, 191–200. doi: 10.1016/S0169-2046(02)00230-X
Kawachi, I., Kennedy, B. P., Lochner, K., and Prothrow-Stith, D. (1997). Social capital, income inequality, and mortality. Am. J. Public Health 87, 1491–1498. doi: 10.2105/AJPH.87.9.1491
Kern, M. L., Eichstaedt, J. C., Schwartz, H. A., Dziurzynski, L., Ungar, L. H., Stillwell, D. J., et al. (2014). The online social self an open vocabulary approach to personality. Assessment 21, 158–169. doi: 10.1177/1073191113514104
Kern, M. L., Park, G., Eichstaedt, J. C., Schwartz, H. A., Sap, M., Smith, L. K., et al. (2016). Gaining insights from social media language: methodologies and challenges. Psychol. Methods 21, 507–525. doi: 10.1037/met0000091
Knack, S., and Zak, P. J. (2003). Building trust: public policy, interpersonal trust, and economic development. Supreme Court Econ. Rev. 10, 91–108. doi: 10.1086/scer.10.1147139
Kosinski, M., Matz, S. C., Gosling, S. D., Popov, V., and Stillwell, D. (2015). Facebook as a research tool for the social sciences: opportunities, challenges, ethical considerations, and practical guidelines. Am. Psychol. 70, 543–566. doi: 10.1037/a0039210
Kosinski, M., Stillwell, D., and Graepel, T. (2013). Private traits and attributes are predictable from digital records of human behavior. Proc. Nat. Acad. Sci. USA. 110, 5802–5805. doi: 10.1073/pnas.1218772110
Kuntsche, E., Kuntsche, S., Thrul, J., and Gmel, G. (2017). Binge drinking: health impact, prevalence, correlates and interventions. Psychol. Health 32, 976–1017. doi: 10.1080/08870446.2017.1325889
Larzelere, R. E., and Huston, T. L. (1980). The dyadic trust scale: toward understanding interpersonal trust in close relationships. J. Marriage Fam. 42, 595–604. doi: 10.2307/351903
Laurence, J. (2015). (Dis) placing trust: the long-term effects of job displacement on generalised trust over the adult lifecourse. Soc. Sci. Res. 50, 46–59. doi: 10.1016/j.ssresearch.2014.11.006
Lawless, N. M., and Lucas, R. E. (2011). Predictors of regional well-being: a county-level analysis. Soc. Indic. Res. 101, 341–357. doi: 10.1007/s11205-010-9667-7
Leip D. (n.d.). Dave Leip's Atlas of US Presidential Elections. Available online at: http://uselectionatlas.org.
Li, T., and Fung, H. H. (2013). Age differences in trust: An investigation across 38 countries. J. Gerontol. B Psychol. Sci. Soc. Sci. 68, 347–355. doi: 10.1093/geronb/gbs072
Lou, S., Giorgi, S., Liu, T., Eichstaedt, J. C., and Curtis, B. (2023). Measuring disadvantage: a systematic comparison of United States small-area disadvantage indices. Health Place 80:102997. doi: 10.1016/j.healthplace.2023.102997
Marschall, M. J., and Stolle, D. (2004). Race and the city: neighborhood context and the development of generalized trust. Polit. Behav. 26, 125–153. doi: 10.1023/B:POBE.0000035960.73204.64
Mason, S. (2010). Can community design build trust? A comparative study of design factors in Boise, Idaho neighborhoods. Cities 27, 456–465. doi: 10.1016/j.cities.2010.07.003
McCallum, A. K. (2002). MALLET: A machine learning for language toolkit [Computer software]. Available online at: http://mallet.cs.umass.edu
Morgan, S. L., and Lee, J. (2018). Trump voters and the white working class. Sociol. Sci. 5, 234–245. doi: 10.15195/v5.a10
Murray, S. L., Lupien, S. P., and Seery, M. D. (2012). Resilience in the face of romantic rejection: the automatic impulse to trust. J. Exp. Soc. Psychol. 48, 845–854. doi: 10.1016/j.jesp.2012.02.016
Nannestad, P. (2008). What have we learned about generalized trust, if anything? Ann. Rev. Polit. Sci. 11, 413–436. doi: 10.1146/annurev.polisci.11.060606.135412
Oskarsson, S., Dawes, C., Johannesson, M., and Magnusson, P. K. (2012). The genetic origins of the relationship between psychological traits and social trust. Twin Res. Hum. Genet 15, 21–33. doi: 10.1375/twin.15.1.21
Park, G., Schwartz, H. A., Eichstaedt, J. C., Kern, M. L., Kosinski, M., Stillwell, D. J., et al. (2015). Automatic personality assessment through social media language. J. Pers. Soc. Psychol. 108, 934–952. doi: 10.1037/pspp0000020
Park, G., Yaden, D. B., Schwartz, H. A., Kern, M. L., Eichstaedt, J. C., Kosinski, M., et al. (2016). Women are warmer but no less assertive than men: gender and language on Facebook. PLoS ONE 11:e0155885. doi: 10.1371/journal.pone.0155885
Paxton, P., and Glanville, J. L. (2015). Is trust rigid or malleable? A laboratory experiment. Soc. Psychol. Q. 78, 194–204. doi: 10.1177/0190272515582177
Pennebaker, J. W. (1982). “The Pennebaker inventory of limbic languidness (the PILL),” in The Psychology of Physical Symptoms, ed. J. W. Pennebaker (New York, NY: Springer-Verlag), 169–170. doi: 10.1037/t05558-000
Pennebaker, J. W., Boyd, R. L., Jordan, K., and Blackburn, K. (2015). The Development and Psychometric Properties of LIWC2015. Austin, TX: University of Texas at Austin.
Pennebaker, J. W., and King, L. A. (1999). Linguistic styles: language use as an individual difference. J. Pers. Soc. Psychol. 77:1296. doi: 10.1037/0022-3514.77.6.1296
Pew Research Center (2015). Demographics of Key Social Media Platforms. Available online at: http://www.pewinternet.org/2015/01/09/demographics-of-key-social-networking-platforms-2/
Preotiuc-Pietro, D., Eichstaedt, J., Park, G., Sap, M., Smith, L., Tobolsky, V., et al. (2015a). The role of personality, age and gender in tweeting about mental illnesses. NAACL HLT 2015 (Denver, CO), 21–30. doi: 10.3115/v1/W15-1203
Preotiuc-Pietro, D., Lampos, V., and Aletras, N. (2015b). “An analysis of the user occupational class through Twitter content,” in Proceedings of the 53rd Annual Meeting of the Association for Computational Linguistics and the 7th International Joint Conference on Natural Language Processing (Beijing), 1754–1764. doi: 10.3115/v1/P15-1169
Preotiuc-Pietro, D., Schwartz, H. A., Park, G., Eichstaedt, J., Kern, M., Ungar, L., et al. (2016). “Modelling valence and arousal in Facebook posts,” in Proceedings of the Workshop on Computational Approaches to Subjectivity, Sentiment and Social Media Analysis (WASSA), NAACL (San Diego, CA). doi: 10.18653/v1/W16-0404
Putnam, R. D. (2000). Bowling Alone: The Collapse and Revival of American Community. New York, NY: Simon and Schuster. doi: 10.1145/358916.361990
Putnam, R. D. (2007). E pluribus unum: diversity and community in the twenty-first century the 2006 Johan Skytte Prize Lecture. Scan. Polit. Stud. 30, 137–174. doi: 10.1111/j.1467-9477.2007.00176.x
Qualter, P., Brown, S. L., Rotenberg, K. J., Vanhalst, J., Harris, R. A., Goossens, L., et al. (2013). Trajectories of loneliness during childhood and adolescence: predictors and health outcomes. J. Adolesc. 36, 1283–1293. doi: 10.1016/j.adolescence.2013.01.005
Rahn, W. M., Yoon, K. S., Garet, M., Lipson, S., and Loflin, K. (2009). Geographies of trust. Am. Behav. Sci. 52, 1646–1663. doi: 10.1177/0002764209331531
Rentfrow, P. J., Gosling, S. D., and Potter, J. (2008). A theory of the emergence, persistence, and expression of geographic variation in psychological characteristics. Perspect. Psychol. Sci. 3, 339–369. doi: 10.1111/j.1745-6924.2008.00084.x
Rogers, N., and Jones, J. J. (2021). Using twitter bios to measure changes in self-identity: are americans defining themselves more politically over time? J. Soc. Comput. 2, 1–13. doi: 10.23919/JSC.2021.0002
Rotenberg, K. J., Addis, N., Betts, L. R., Corrigan, A., Fox, C., Hobson, Z., et al. (2010). The relation between trust beliefs and loneliness during early childhood, middle childhood, and adulthood. Pers. Soc. Psychol. Bull. 36, 1086–1100. doi: 10.1177/0146167210374957
Rotter, J. B. (1967). A new scale for the measurement of interpersonal trust. J. Pers. 35, 651–665. doi: 10.1111/j.1467-6494.1967.tb01454.x
Rotter, J. B. (1971). Generalized expectancies for interpersonal trust. Am. Psychol. 26, 443–452. doi: 10.1037/h0031464
Rousseau, D. M., Sitkin, S. B., Burt, R. S., and Camerer, C. (1998). Not so different after all: a cross-discipline view of trust. Acad. Manag. Rev. 23, 393–404. doi: 10.5465/amr.1998.926617
Rupasingha, A., Goetz, S. J., and Freshwater, D. (2006). The production of social capital in US counties. J. Socio Econ. 35, 83–101. doi: 10.1016/j.socec.2005.11.001
Rust, J., and Golombok, S. (2009). Modern Psychometrics: The Science of Psychological Assessment. New York, NY: Routledge.
Schaffner, B. F., MacWilliams, M., and Nteta, T. (2018). Understanding white polarization in the 2016 vote for president: the sobering role of racism and sexism. Polit. Sci. Q. 133, 9–34. doi: 10.1002/polq.12737
Schwartz, H. A., Eichstaedt, J. C., Kern, M. L., Dziurzynski, L., Lucas, R. E., Agrawal, M., et al. (2013a). “Characterizing geographic variation in well-being using tweets,” in ICWSM (Cambridge, MA), 583–591. doi: 10.1609/icwsm.v7i1.14442
Schwartz, H. A., Eichstaedt, J. C., Kern, M. L., Dziurzynski, L., Ramones, S. M., Agrawal, M., et al. (2013b). Personality, gender, and age in the language of social media: the open-vocabulary approach. PLoS ONE 8:e73791. doi: 10.1371/journal.pone.0073791
Schwartz, H. A., Giorgi, S., Sap, M., Crutchley, P., Eichstaedt, J. C., Ungar, L., et al. (2017). “DLATK: differential language analysis ToolKit,” in Proceedings of the 2014 Conference on Empirical Methods in Natural Language Processing (EMNLP) (Copenhagen). doi: 10.18653/v1/D17-2010
Schwartz, H. A., Sap, M., Kern, M. L., Eichstaedt, J. C., Kapelner, A., Agrawal, M., et al. (2016). “Predicting individual well-being through the language of social media,” in Social Media Mining for Public Health Monitoring and Surveillance. Paper presented at Biocomputing 2016: Proceedings of the Pacific Symposium, ed. H. A. Schwartz (Kohala Coast, Hawaii). doi: 10.1142/9789814749411_0047
Schwartz, H. A., and Ungar, L. H. (2015). Data-driven content analysis of social media: a systematic overview of automated methods. Ann. Am. Acad. Polit. Soc. Sci. 659, 78–94. doi: 10.1177/0002716215569197
Simpson, J. A. (2007). Psychological foundations of trust. Curr. Dir. Psychol. Sci. 16, 264–268. doi: 10.1111/j.1467-8721.2007.00517.x
Snyder, M. (1974). Self-monitoring of expressive behavior. J. Pers. Soc. Psychol. 30, 526–537. doi: 10.1037/h0037039
Stolle, D., Soroka, S., and Johnston, R. (2008). When does diversity erode trust? Neighborhood diversity, interpersonal trust and the mediating effect of social interactions. Polit. Stud. 56, 57–75. doi: 10.1111/j.1467-9248.2007.00717.x
Sturgis, P., Brunton-Smith, I., Read, S., and Allum, N. (2011). Does ethnic diversity erode trust? Putnam's ‘hunkering down' thesis reconsidered. Br. J. Polit. Sci. 41, 57–82. doi: 10.1017/S0007123410000281
Takakura, M. (2011). Does social trust at school affect students' smoking and drinking behavior in Japan? Soc. Sci. Med. 72, 299–306. doi: 10.1016/j.socscimed.2010.11.003
Trope, Y., and Liberman, N. (2010). Construal-level theory of psychological distance. Psychol. Rev. 117:440. doi: 10.1037/a0018963
US Census Bureau (2010a). Profile of General Population and Housing Characteristics: 2010. Available online at: http://factfinder.census.gov/faces/tableservices/jsf/pages/productview.xhtml?pid=DEC_10_SF1_SF1DP1&prodType=table
US Census Bureau (2010b). Population, housing units, area, and density: 2010 - state – county/county equivalent 2010. Available online at: http://factfinder.census.gov/faces/tableservices/jsf/pages/productview.xhtml?pid=DEC_10_SF1_GCTPH1.ST05andprodType=table
US Census Bureau (2010c). Selected economic characteristics: 2005-2009 American Community Survey 5-year estimates. Available online at: http://factfinder.census.gov/faces/tableservices/jsf/pages/productview.xhtml?pid=ACS_09_5YR_DP5YR3&prodType=table
US Census Bureau (2010d). Educational attainment: 2005-2009 American Community Survey 5-year estimates. Available online at: http://factfinder.census.gov/faces/tableservices/jsf/pages/productview.xhtml?pid=ACS_09_5YR_S1501andprodType=table
US Census Bureau (2010e). Gini Index of Income Inequality: Households 2010-2014 American Community Survey 5-Year Estimates. Available online at: https://factfinder.census.gov/bkmk/table/1.0/en/ACS/14_5YR/B19083/0100000US.04000
US Census Bureau (2010f). Households and families: 2005-2009 American Community Survey 5-year estimates. Available online at: http://factfinder.census.gov/faces/tableservices/jsf/pages/productview.xhtml?pid=ACS_09_5YR_S1101andprodType=table
US Census Bureau (2010g). Selected social characteristics in the United States: 2005-2009 American Community Survey 5-year estimates. Available online at: http://factfinder.census.gov/faces/tableservices/jsf/pages/productview.xhtml?pid=ACS_09_5YR_DP5YR2andprodType=table
Uslaner, E. M. (1999). “Democracy and social capital,” in Democracy and Trust, ed. M. E. Warren (Cambridge, UK: Cambridge University Press), 121–150. doi: 10.1017/CBO9780511659959.005
Uslaner, E. M. (2002). The Moral Foundations of Trust. Cambridge: Cambridge University Press. doi: 10.2139/ssrn.824504
Uslaner, E. M., and Brown, M. (2005). Inequality, trust, and civic engagement. Am. Polit. Res. 33, 868–894. doi: 10.1177/1532673X04271903
Van Ingen, E., and Bekkers, R. (2015). Generalized trust through civic engagement? Evidence from five national panel studies. Polit. Psychol. 36, 277–294. doi: 10.1111/pops.12105
Van Lange, P. A. (2015). Generalized trust: four lessons from genetics and culture. Curr. Dir. Psychol. Sci. 24, 71–76. doi: 10.1177/0963721414552473
Van Lange, P. A., Vinkhuyzen, A. A., and Posthuma, D. (2014). Genetic influences are virtually absent for trust. PLoS ONE 9:e93880. doi: 10.1371/journal.pone.0093880
Vazire, S. (2015). Experimental philosophy: the view from social/personality psychology. Jpn. Assoc. Philos. Sci. 23, 45–52. doi: 10.4288/jafpos.23.0_45
Welch, M. R., Sikkink, D., Sartain, E., and Bond, C. (2004). Trust in god and trust in man: the ambivalent role of religion in shaping dimensions of social trust. J. Sci. Study Relig. 43, 317–343. doi: 10.1111/j.1468-5906.2004.00238.x
Widiger, T. A. (2015). The consequential outcomes of personality dysfunction. Personal. Ment. Health 9, 8–9. doi: 10.1002/pmh.1283
Yamagishi, T. (2001). “Trust as a form of social intelligence,” in Trust in Society, ed. K. S. Cook (New York, NY: Russell Sage Foundation), 121–147.
Yamagishi, T., and Yamagishi, M. (1994). Trust and commitment in the United States and Japan. Motiv. Emot. 18, 129–166. doi: 10.1007/BF02249397
Yuki, M., Maddus, W. W., Brewer, M. B., and Takemura, K. (2005). Cross-cultural differences in relationship and group-based trust. Pers. Soc. Psychol. Bull. 31, 48–62. doi: 10.1177/0146167204271305
Keywords: generalized trust, social media, social epidemiology, language analysis, data driven approaches
Citation: Giorgi S, Jones JJ, Buffone A, Eichstaedt JC, Crutchley P, Yaden DB, Elstein J, Zamani M, Kregor J, Smith L, Seligman MEP, Kern ML, Ungar LH and Schwartz HA (2024) Quantifying generalized trust in individuals and counties using language. Front. Soc. Psychol. 2:1384262. doi: 10.3389/frsps.2024.1384262
Received: 09 February 2024; Accepted: 08 May 2024;
Published: 07 June 2024.
Edited by:
Friedrich Götz, University of British Columbia, CanadaReviewed by:
Elisabeta Militaru, University of Cambridge, United KingdomEric Mercadante, New York University, United States
Copyright © 2024 Giorgi, Jones, Buffone, Eichstaedt, Crutchley, Yaden, Elstein, Zamani, Kregor, Smith, Seligman, Kern, Ungar and Schwartz. This is an open-access article distributed under the terms of the Creative Commons Attribution License (CC BY). The use, distribution or reproduction in other forums is permitted, provided the original author(s) and the copyright owner(s) are credited and that the original publication in this journal is cited, in accordance with accepted academic practice. No use, distribution or reproduction is permitted which does not comply with these terms.
*Correspondence: Salvatore Giorgi, sal.giorgi@gmail.com; H. Andrew Schwartz, has@cs.stonybrook.edu