PET and polyolefin plastics supply chains in Michigan: present and future systems analysis of environmental and socio-economic impacts
 Utkarsh S. Chaudhari1*
  Kamand Sedaghatnia2 Barbara K. Reck3 Kate Maguire4 Anne T. Johnson4
  David W. Watkins5
  Robert M. Handler1 Tasmin Hossain6
  Damon S. Hartley6
  Vicki S. Thompson7 Alejandra Peralta8
  Jenny L. Apriesnig9
  David R. Shonnard1
- 1Department of Chemical Engineering, Michigan Technological University, Houghton, MI, United States
- 2Department of Chemistry, Michigan Technological University, Houghton, MI, United States
- 3Center for Industrial Ecology, School of the Environment, Yale University, New Haven, CT, United States
- 4Resource Recycling Systems, Ann Arbor, MI, United States
- 5Department of Civil, Environmental, and Geospatial Engineering, Michigan Technological University, Houghton, MI, United States
- 6Operations Research and Analysis, Idaho National Laboratory, Idaho Falls, ID, United States
- 7Bioenergy Feedstock Technologies, Idaho National Laboratory, Idaho Falls, ID, United States
- 8Chemstations Inc., Houston, TX, United States
- 9College of Business, Michigan Technological University, Houghton, MI, United States
Many actions are underway at global, national, and local levels to increase plastics circularity. However, studies evaluating the environmental and socio-economic impacts of such a transition are lacking at regional levels in the United States. In this work, the existing polyethylene terephthalate and polyolefin plastics supply chains in Michigan were compared to a potential future (‘NextCycle’) scenario that looks at increasing Michigan’s overall recycling rate to 45%. Material flow analysis data was combined with environmental and socio-economic metrics to evaluate the sustainability of these supply chains for the modeled scenarios. Overall, the NextCycle scenario for these supply chains achieved a net 14% and 34% savings of greenhouse gas (GHG) emissions and energy impacts, when compared with their respective baseline values. Additionally, the NextCycle scenario showed a net gain in employment and wages, however, it showed a net loss of revenue generation outside of Michigan due to the avoided use of virgin resins in Michigan.
1 Introduction
Plastics have become an integral part of our day-to-day life (Walker et al., 2021; Plastics Europe, 2022), but are currently being mismanaged globally at their end-of-life (EOL) (Kan et al., 2023). In 2019, about 385 million metric tons (MMT) of plastic waste was generated globally (Nordic Council of Ministers, 2023). About 29 MMT (8%) of this total ended up as recycled plastic resins and the remaining 356 MMT (92%) contributed to plastic pollution or left the plastics economy via landfilling and incineration (Nordic Council of Ministers, 2023). The plastic waste problem poses a significant threat to our environment and hinders our progress toward meeting sustainable development goals (SDGs), particularly 12 (Responsible consumption and production), 13 (Climate action), and 14 (Life below water) (De Sousa, 2021; Gusheva et al., 2022).
Various actions are being taken at a global level to address this issue (Ellen MacAurthur Foundarion, 2022). For example, in March 2022, the resolution (5/14) by the United Nations Environment Assembly (UNEA) was adopted to develop an international legally binding agreement (“global plastics treaty”) by the end of 2024 to end plastic pollution by addressing the entire life cycle of plastics (March et al., 2022; United Nations Environment Programme, 2022; Islam et al., 2023). Along with addressing environmental impacts, it also calls for socio-economic assessments related to plastic pollution [paragraph 3(i)] and stresses the urgent need to take actions at local, regional, and global levels.
Additionally, many plastics recycling and circularity goals, strategies, and roadmaps are being envisioned at local, regional, national, and global levels to address the plastic waste problem and transition toward a sustainable circular economy for plastics (European Commission, 2018; Canada Plastics Pact, 2021; Ellen MacArthur Foundation, 2021; Duke University, 2023; Karasik et al., 2023; United States Plastics Pact, 2023). For example, the United States Environmental Protection Agency (EPA) published a National Recycling Strategy reaffirming the goal to increase the United States recycling rate to 50% by 2030 and to support the actions toward a circular economy of plastics (United States EPA, 2021; United States Department of State, 2022). Similarly, additional efforts are underway to strengthen the circular economy of United States plastics at state and local levels (United States EPA, 2023; Wilbur, 2023). However, to track progress quantitatively toward such initiatives and to potentially understand system-wide changes (“consequential effects”) due to transitioning toward a circular economy (Aguilar-Hernandez et al., 2021), there is a need to establish a baseline systems analysis of plastics at different spatial levels.
Our previously published systems analysis framework for plastics combines material flow analysis (MFA) with life cycle assessment (LCA) tools along with other socio-economic indicators to evaluate the sustainability of circular plastics supply chains in the United States (Shonnard et al., 2019; Chaudhari et al., 2021). This framework can help in understanding the system-wide changes and identify potential trade-offs or benefits. Such studies at a state level have been lacking, potentially hindering the understanding of state-level supply and demand of material flows, required supply chain infrastructure, regional revenue generation, potential employment opportunities, and progress toward meeting envisioned plastics recycling goals.
Most of the prior MFA studies have been conducted at a global or national level with only a few looking at local or regional levels (Geyer et al., 2017; Islam and Huda, 2019; Harris et al., 2021; Barkhausen et al., 2023). Additionally, only a few studies have integrated both LCA and socio-economic indicators with MFA to establish a baseline and identify potential trade-offs or consequential effects of plastics in a circular economy (Zaghdaoui et al., 2017). A brief summary of the identified literature is provided in Table 1. Cimpan et al. (2023) showed positive effects on employment but found reduced value addition to the system due to circular plastics flows. Gavrilescu et al. (2023) studied the environmental and socio-economic impacts of only the EOL management of packaging waste in Romania but did not assess any potential trade-offs among the indicators. Bourtsalas et al. (2023) studied the state-level international exports of plastic waste from the United States and their associated environmental and economic implications but lacked social impacts. Chaudhari et al. (2022) established a 2019 national baseline greenhouse gas (GHG) emissions and cumulative energy demand (CED) of polyethylene terephthalate (PET) and polyolefin (PO) plastics supply chains in the U.S. without accounting for socio-economic indicators and trade-offs. However, the novelty in this work is that no U.S. state-level studies were found that integrated MFA with both environmental and socio-economic indicators for a complete plastics supply chain.
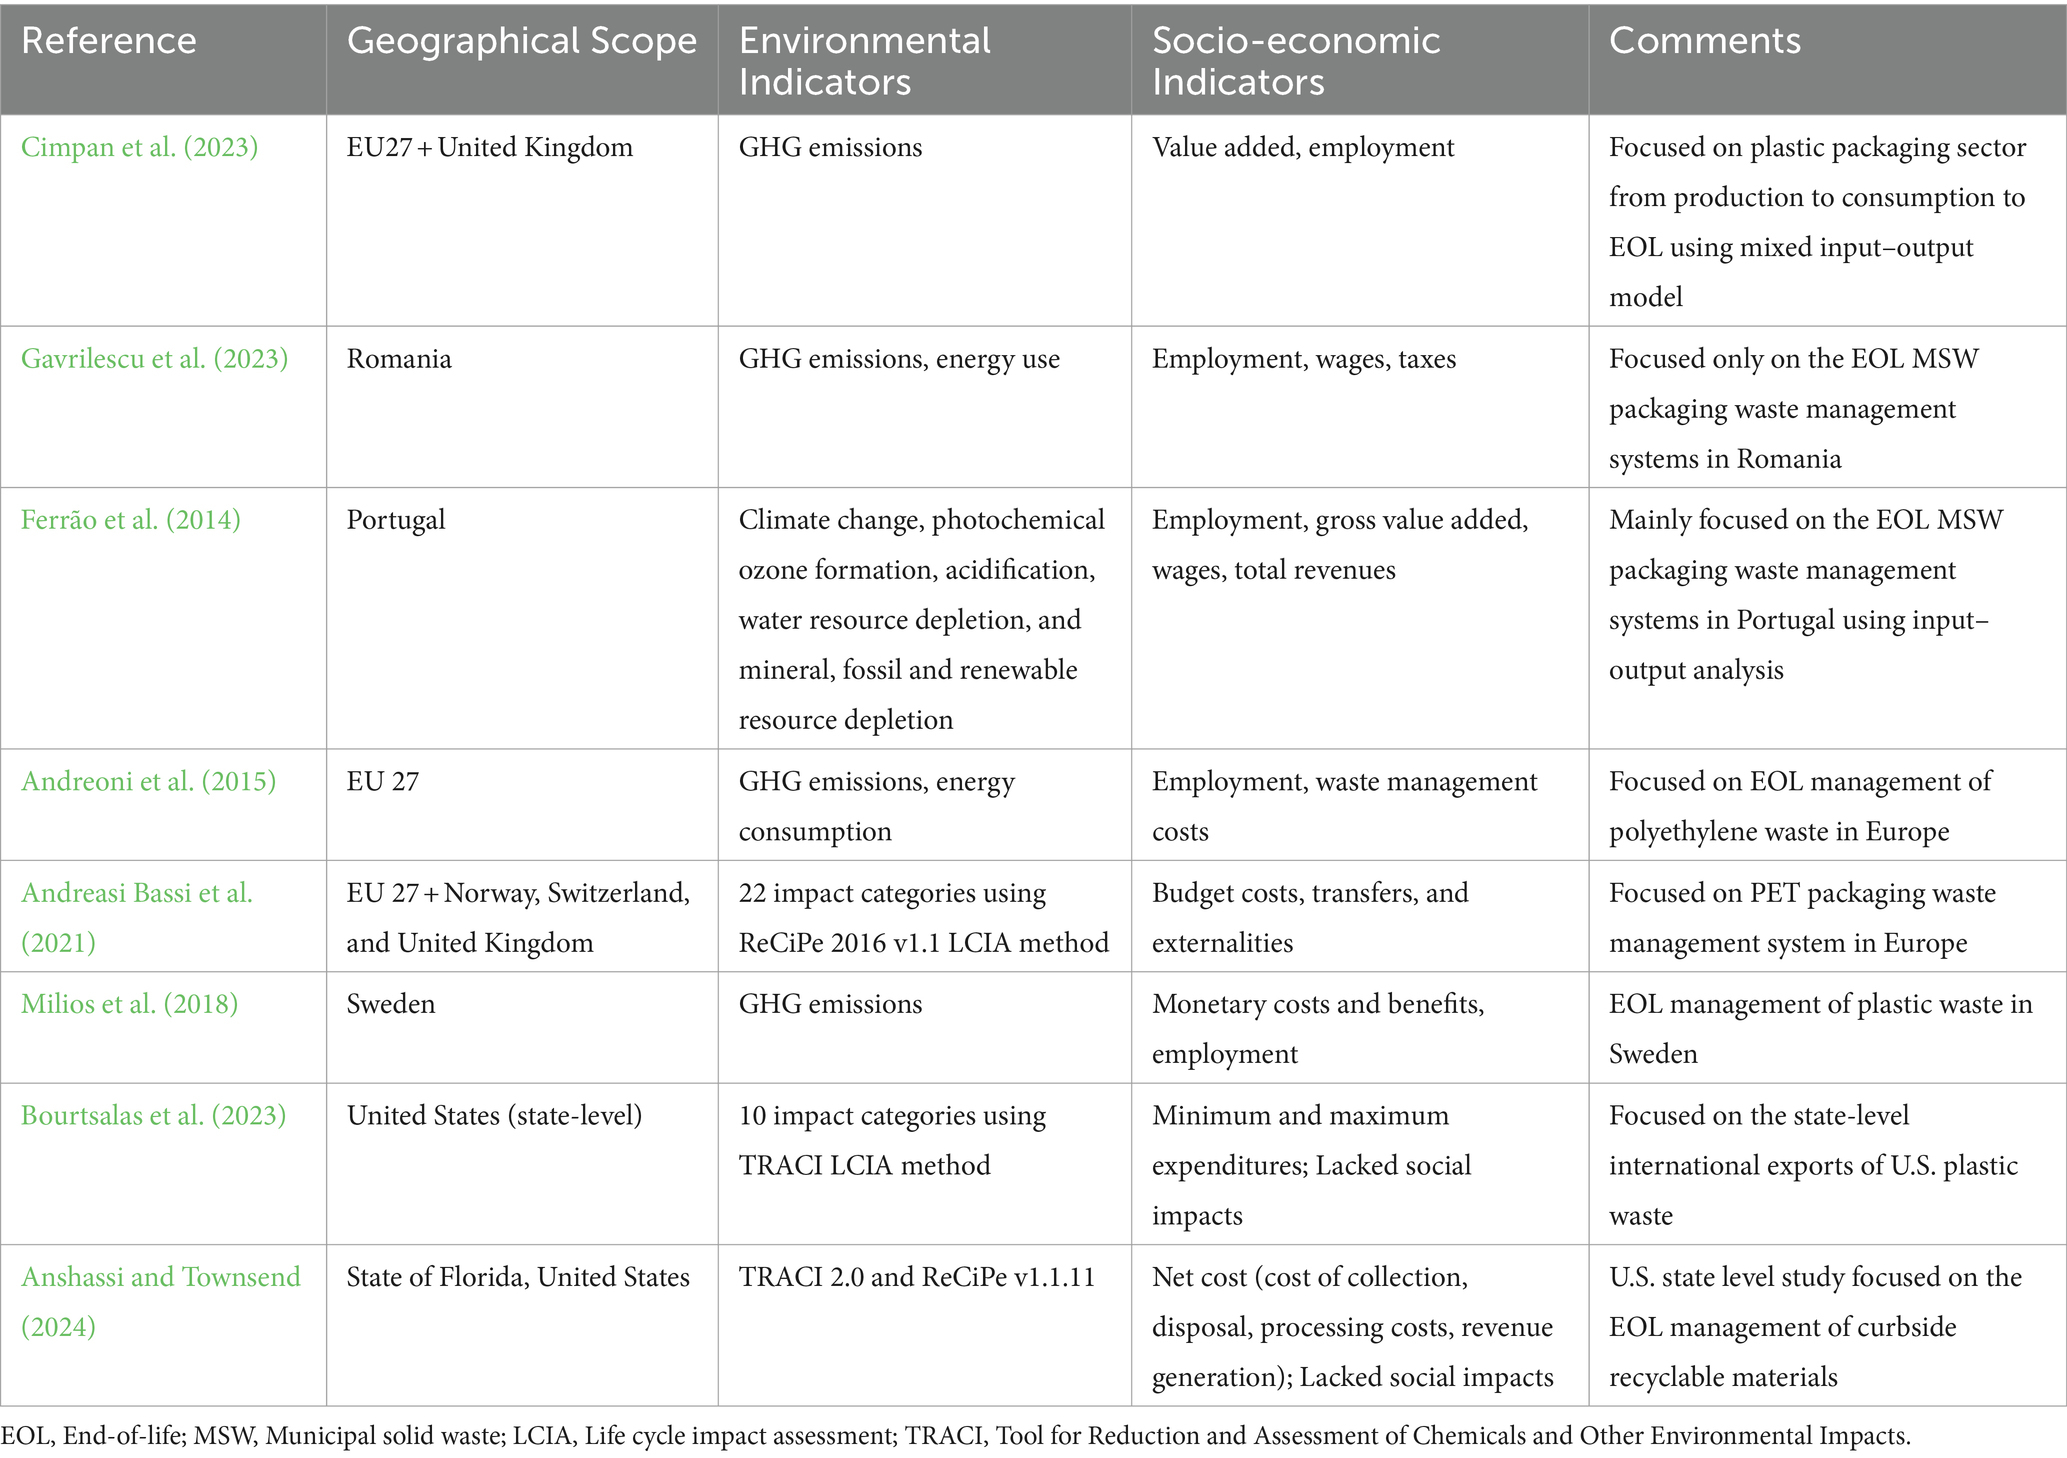
Table 1. Summary of identified literature review on environmental and socio-economic impacts of plastics waste supply chains.
The state of Michigan contributed about 2.5% to the United States gross domestic product (GDP) in 2019 and ranked 13th out of all the 50 states and the District of Columbia (United States Bureau of Economic Analysis, 2019a). Also, Michigan contributed about 5% and ranked 6th in terms of the United States plastics and rubber product manufacturing industry (United States Bureau of Economic Analysis, 2019b). In terms of the EOL management of plastics in Michigan, only 6% of the plastics [mainly PET and high density polyethylene (HDPE)] were recycled in 2015, and the remaining 94% were disposed to landfill or incineration facilities (Michigan Department of Environmental Quality, 2016).
In light of increased circular economy initiatives for plastics at the state level in the U.S. and the above-mentioned research gaps, the present study focuses on evaluating two environmental and three socio-economic indictors for PET and PO plastics supply chains in the state of Michigan. The first research objective is to establish a baseline (“base case”) systems analysis for these supply chains in Michigan (U.S.) for 2019. The second research objective is to compare a future (“NextCycle”) systems analysis scenario with the baseline scenario and identify system-wide changes including any potential environmental and socio-economic benefits or trade-offs. This future scenario is based on the NextCycle Michigan program, which aims to boost the state’s overall recycling rates from 15 to 45% by 2030 (Michigan Department of Environmental Quality, 2016; NextCycle Michigan, 2021; Kamczyc, 2021). This study focuses on PET and PO plastics, such as high density polyethylene (HDPE), low or linear low density polyethylene (LDPE/LLDPE), and polypropylene (PP).
2 Methods
2.1 Principles of systems analysis applied in this study
The systems analysis framework presented in the Introduction section, and that we applied to this study, was implemented with the following principles.
• Material Flow Analysis (MFA) is the foundation of systems analysis, following the mass balance principle (Brunner and Rechberger, 2016). MFA provides the baseline and future plastics material flows and importantly the processes that the material flows through. The material flows through different processes involved within the system generate relevant environmental and socio-economic impacts (Wagner, 2002; Krausmann et al., 2017).
• Define whether the system is an open or closed system. In this study, the baseline plastics material flows in Michigan were open to imports and exports, thus representing an open system (Brunner and Rechberger, 2016). However, only the processes within Michigan were included in the impact assessments. In the future NextCycle scenario, increased recycling resulted in more material processed inside Michigan, but with the consequential effect outside of Michigan of reduced import of virgin resin, which was taken into account in the impact assessment.
• Impact assessment data must be expressed on a material flow basis. In this study the LCIA factors were carefully reviewed to assure that the original studies followed accepted ISO standards and that they were assembled with their system boundaries keeping in mind to avoid over counting or undercounting of impacts. The socioeconomic impacts included in this study were converted to a material flow basis through a series of conversion steps as outlined in the Supplementary material S2 (SI-2) document.
2.2 Material flow analysis (MFA)
The present study applied previously published material flow analysis for PET and polyolefin plastics supply chains in the United States (Chaudhari et al., 2022), which was also based on an earlier study (Di et al., 2021). This MFA was applied at the state level to conduct the baseline and scenario analysis of PET and polyolefin plastics in the state of Michigan for the year 2019. Briefly, the major baseline PET and PO plastics supply chain processes include: (1) production of virgin resins; (2) semi-manufacturing (“fabrication” or “conversion”) processes; (3) EOL processes such as landfilling, incineration with energy recovery, material recovery facilities (MRFs), and mechanical recycling. The following paragraphs provide information on the sources of data and assumptions used in our MFA.
After communication with experts from the plastics industry, it was determined that there is no production of virgin PET and PO plastic resins in the state of Michigan. Therefore, these resins must be imported into Michigan from other countries and, predominantly, other states within the United States to be converted to products. We found no publicly available information and sources of data at the state level on the demand of virgin resins and their applications by different semi-manufacturing (“conversion”) processes. Due to this lack of data, national level data from (Chaudhari et al., 2022) was used to make certain estimates for these material flows at the state level, as explained below.
To estimate this state-level demand for virgin PET and PO resins and their flows through different semi-manufacturing processes, an allocation approach was used based on Michigan employment and Gross Domestic Product (GDP) data for the plastics and product manufacturing industry, and then compared to the similar national U.S. data. This data can be extracted from the United States Census Bureau (United States Census Bureau, 2022) and United States Bureau of Economic Analysis (BEA) (United States Bureau of Economic Analysis, 2019c) based on the standard North American Industry Classification System (NAICS) codes, which are also used by Federal agencies for collecting and analyzing the statistics related to United States economy. The employment and GDP statistics of plastics and product manufacturing industry were found for Michigan and at the national level based on NAICS codes 326 and 3261 (United States Bureau of Economic Analysis, 2019c; United States Census Bureau, 2022). These calculations are provided in the Supplementary material S1 (SI-1) Excel document in each Excel tab named after each resin type along with the entire MFA dataset.
The conversion of virgin resin demand through semi-manufacturing processes were the same as our U.S. baseline study (Chaudhari et al., 2022), except for PET resin. The semi-manufacturing processes for PET in Michigan are mainly dominated by thermoforming and some by bottle manufacturing (RRS Inc., 2023). The PET material flows through these two processes were determined in a similar manner, as mentioned above, but based on the employment and revenue of NAICS codes 32619 and 32616 (United States Census Bureau, 2022; IBIS World, 2023), and the calculations are also shown in the SI-1 Excel file (Tab ‘PET_MFA’).
Because no state-level domestic trade data is available at a granular level of detail, the 2019 international import and export (trade) data for Michigan was gathered from the United States Trade Online database provided by the United States Census Bureau (United States Census Bureau, 2023). This data was gathered based on Harmonized Tariff Schedule (HTS) codes consistent with our previously published baseline study (Chaudhari et al., 2022). Please refer to the SI-1 Excel File (‘Trade Data’ Excel Tab) for the data.
The EOL data was gathered from the NextCycle Michigan gap analysis report, which provided the amounts of PET and PO plastic product wastes that are landfilled and recovered for recycling (NextCycle Michigan, 2021). The types of products considered in that report included PET bottles, colored HDPE and natural HDPE bottles, LDPE/LLDPE films, and PP containers. For the products not covered in the NextCycle report, national level Per capita waste generation data from the United States EPA waste management report (United States EPA, 2020a) was used to estimate waste generation in Michigan. Due to lack of other sources of local data (United States Census Bureau, 2020). The amount of plastic waste incinerated was determined by using the conventional disposal of municipal solid waste (MSW) in Michigan that is not collected for recycling, which is 98% landfilled and 2% incinerated in 2019 (NextCycle Michigan, 2021). The state of Michigan has only one incinerator (NextCycle Michigan, 2021), which explains the relatively low 2% rate of incineration. Most of the Michigan plastic reclaimers process the waste obtained from the semi-manufacturing processes (i.e., post-industrial plastic waste; EGLE RRS, 2019; RRS NextCycle Michigan, 2021). However, there is a lack of information on the management of this material flow stream. Due to the lack of data, we assumed the EOL management of this post-industrial stream to be the same as that of the EOL management of post-consumer plastic waste in Michigan. Please refer to section 1 of the SI-2 word document for a review of MFA datasets identified for Michigan.
2.3 NextCycle future scenario analysis
A future scenario analysis was conducted to look at a tripling of Michigan’s current recycling rate to reach Michigan’s overall recycling rate goal of 45%. The NextCycle gap analysis report provided the additional amounts of PET and PO plastic products to be collected for recycle to help reach this recycling goal (NextCycle Michigan, 2021). The plastic products considered for increased recycling were today’s commonly recycled plastic products such as PET bottles, natural and colored HDPE bottles, as well as others not commonly recycled, such as LDPE/LLDPE films, and rigid PP containers. Using this information on the EOL material flows (summarized in SI-1 Excel file, ‘NextCycle_Scenario’ Excel Tab), the baseline MFA was updated to represent the increased collection of these products, consequently reducing the disposal rates. Additionally, because of the relatively modest increases in material flows to achieve the NextCycle targets, only mechanical recycling technology (no advanced/chemical recycling) was assumed to be used in the future to recycle and process these EOL plastic products in Michigan that were otherwise exported to other states in the base case (e.g., LDPE/LLDPE and PP resins). It was also assumed that the additional recycled resin produced in Michigan would avoid the need of virgin resin in Michigan, while maintaining the same demand for the semi-manufacturing processes as with base case (future is the same as the present in terms of total material flow). Doing this allows us to assess whether increased circularity of these EOL plastic types is more sustainable relative to the current baseline material flows.
2.4 Integration of life cycle assessment data into systems analysis
The goal of this study was to assess the change in the environmental impacts of the PET and polyolefin plastic material flows due to increased recycling of these materials in the state of Michigan. Particularly, the study was limited to only two of the environmental indicators, namely greenhouse gas (GHG) emissions and cumulative energy demand (CED), which are among the most widely used in decision making and reported in the literature (Zanghelini et al., 2018; Stillitano et al., 2021; Zhao et al., 2021; Subal et al., 2024). The scope of the study was “cradle-to-grave” (European Environment Agency, 2024) considering the major life cycle processes as mentioned in the Section 2.2. The functional unit for this study was the total amount of PET and polyolefin materials processed in Michigan. The literature environmental impact factors were critically evaluated, and they aligned with the International Organization for Standardization (ISO) 14,040 and 14,044 standards (International Organization for Standardization, 2006a,b).
The GHG emissions and CED impacts of the PET and PO plastics supply chains were estimated by multiplying the material flows through the different plastics supply chain processes with their respective GHG emission and CED factors (see Section S2, Supplementary Figure S1 of the SI-2 Word document for sample calculations), consistent with the methodology used in the national baseline study by (Chaudhari et al., 2022). The process-specific GHG emission factors utilized in this study were calculated using the Intergovernmental Panel on Climate Change (IPCC) 2021 global warming potential (GWP) over 100-year timeframe (version 1.01) life cycle impact assessment (LCIA) method. Similarly, the energy demand factors used in this study were estimated using the Cumulative Energy Demand (version 1.11) LCIA method. These factors are summarized in Table 2 along with the reference to the source of data and are also provided in the SI-1 Excel file.
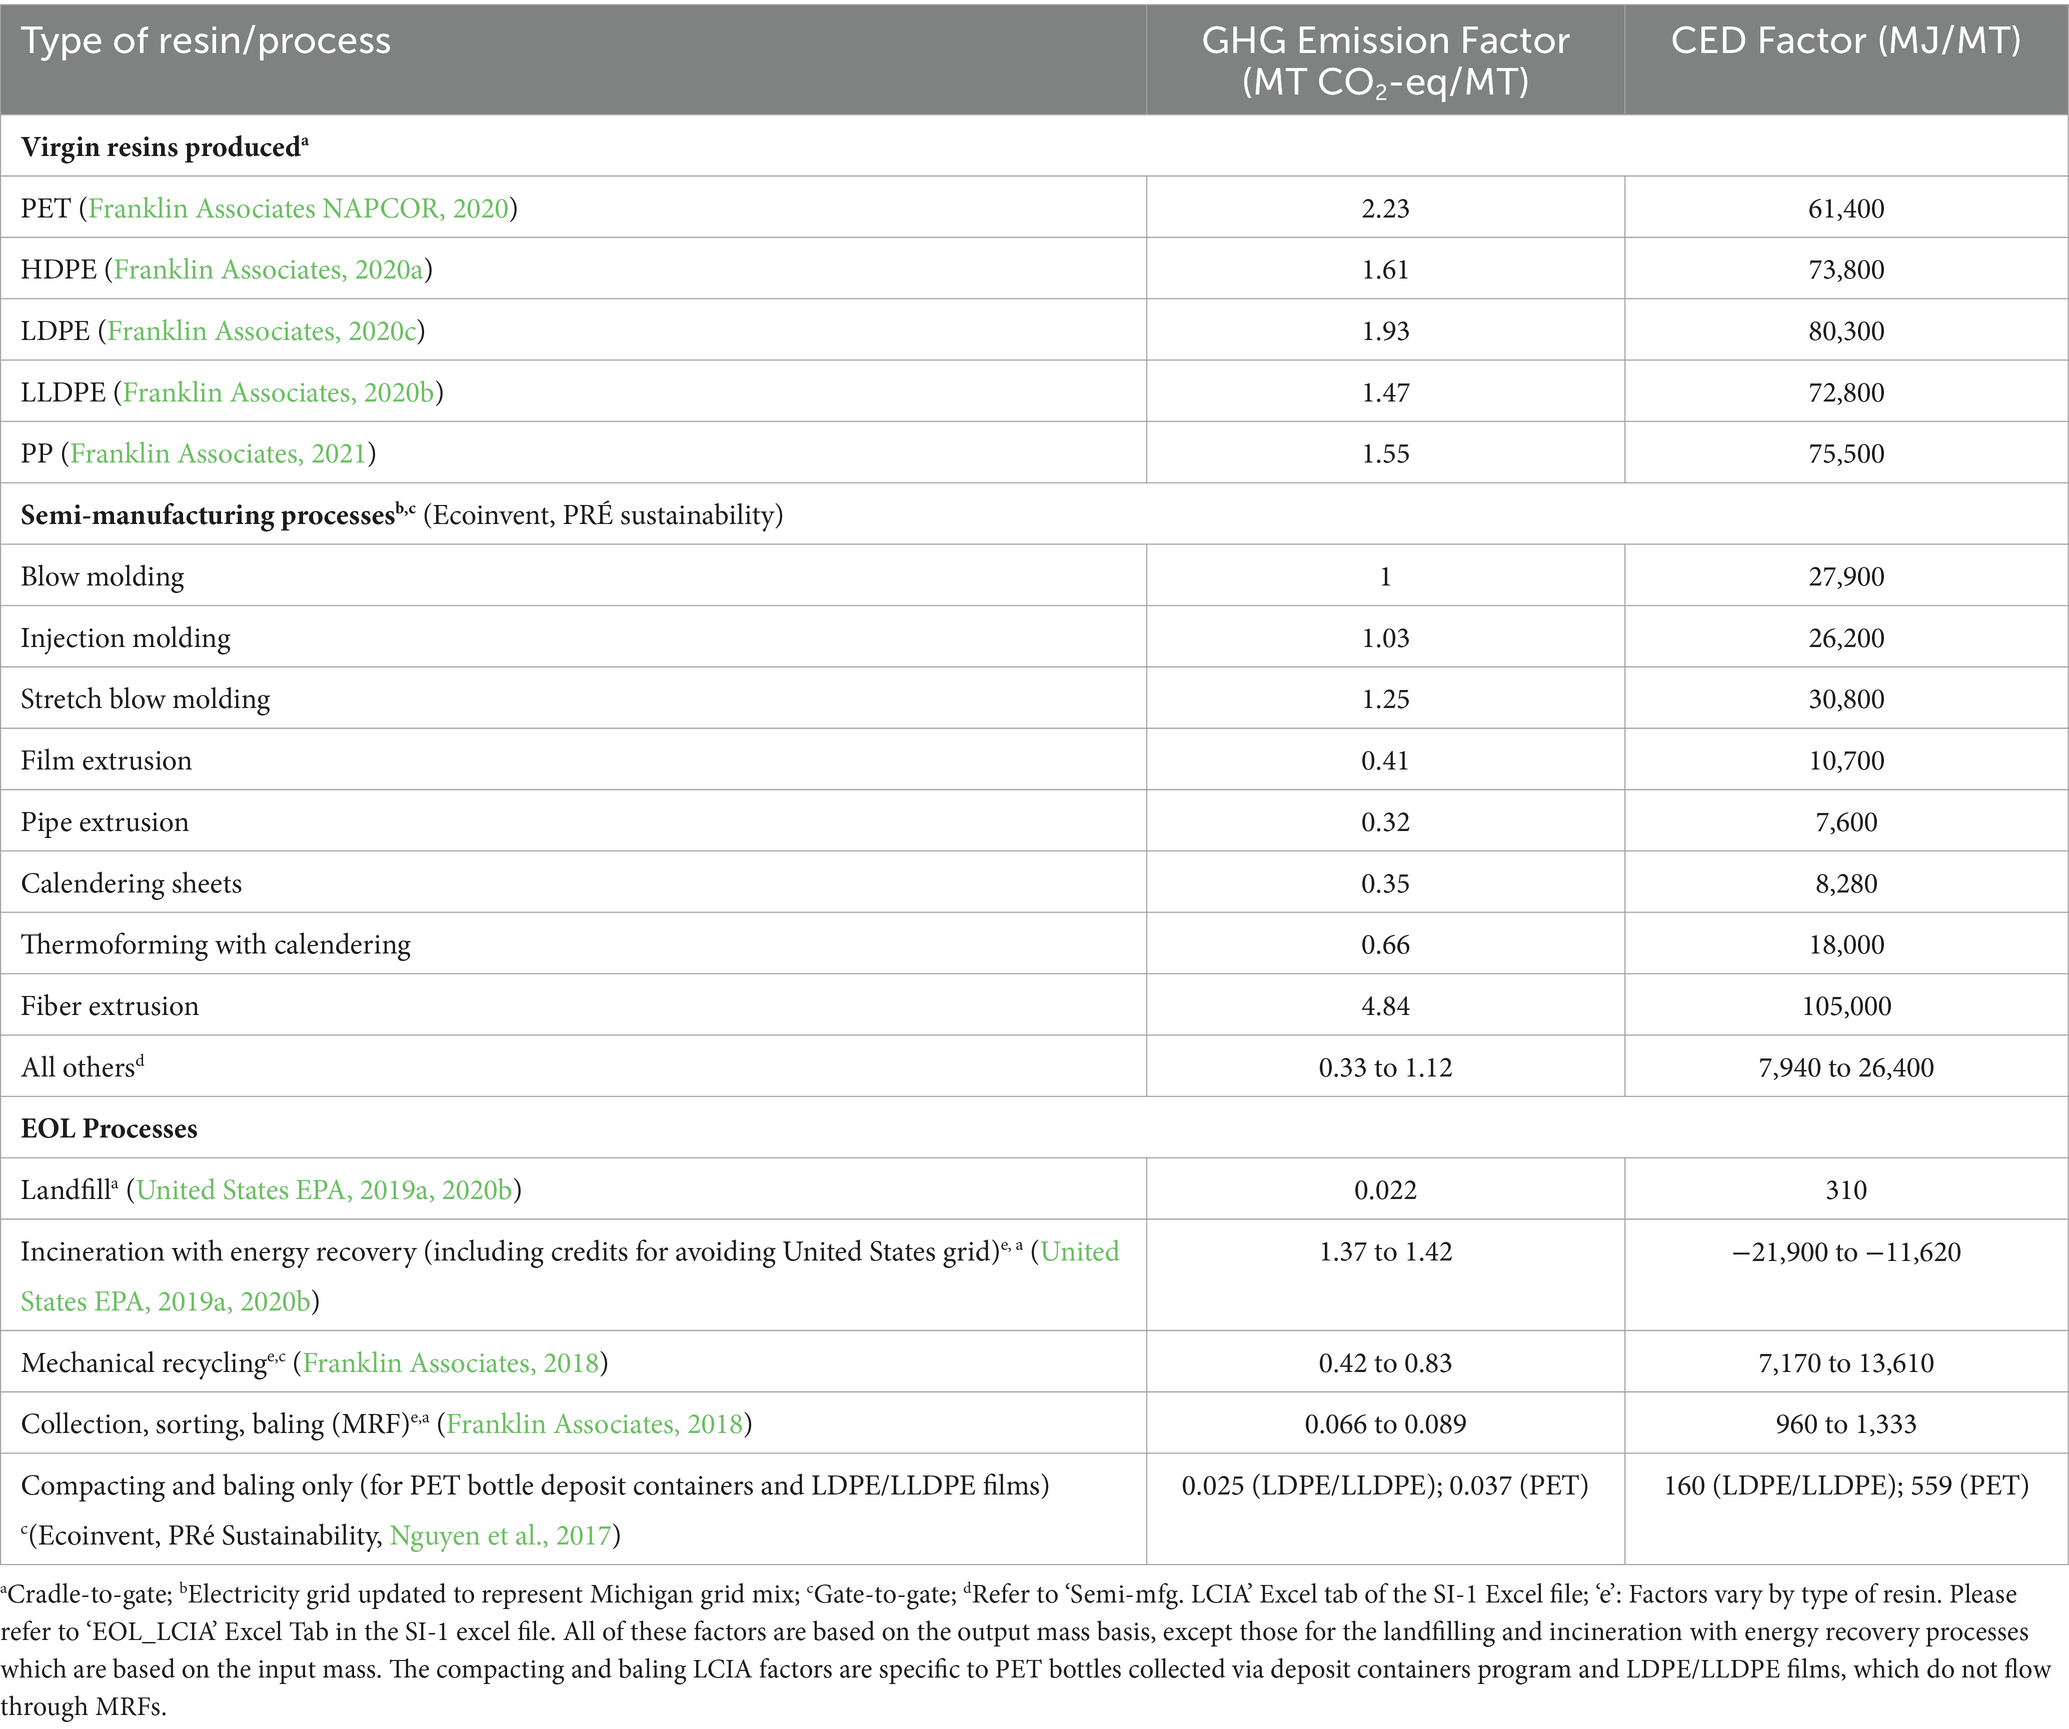
Table 2. Summarized GHG emissions and CED factors across PET and PO plastics supply chains.
Briefly, the data used for semi-manufacturing processes were “gate-to-gate” and were gathered from the Ecoinvent database (Ecoinvent, 2023) obtained from the LCA software, SimaPro v9.4.0.2 (PRÉ Sustainability, 2023). The electricity grid used for semi-manufacturing processes was updated to reflect the Michigan average grid mix for the year 2020 (United States EIA, 2020). Please refer to Section S2 of the SI-2 document for the grid mix. The “cradle-to-gate” GHG emission and CED factors for the landfilling and incineration with energy recovery were gathered from U.S. EPA WARM reports, which also includes the impacts associated with collection and transportation steps (United States EPA, 2019a). The “gate-to-gate” LCIA factors for collection, sorting and baling at a material recovery facility (MRF) were based on the Franklin and Associates report (Franklin Associates, 2018). The “gate-to-gate” LCIA factors for mechanical recycling processes includes the impacts of transporting bales to reclaimer and reclaimer operations to produce recycled resins (Franklin Associates, 2018). For post-industrial sources of recycled resin, and due to lack of U.S. LCIA factors on recycling of the post-industrial waste stream, we assumed 50% of the total “cradle-to-gate” impacts reported in the (Franklin Associates, 2018) to estimate the relevant GHG emissions and CED impacts. This stream is relatively cleaner and would require less intense processing than the post-consumer waste stream. Additional future research is needed to fully understand the impacts of post-industrial recycling streams for plastics.
The total GHG emissions and CED impacts calculated in this study included only the impacts of the materials being processed and produced in the state of Michigan. The consequential effects of avoided virgin resin due to increased recycling in Michigan NextCycle scenario were also included. The transportation related GHG emissions and CED in Michigan for each resin specific plastic supply chain were estimated based on the impacts calculated in the national baseline study (Chaudhari et al., 2022). These impacts were allocated to Michigan based on the transportation activity of plastic products in Michigan by NAICS code 326, compared to the United States data (United States Census Bureau, 2017; United States Dot Bureau of Transportation Statistics, 2021). This allocation factor was estimated to be 1.4% and the calculation for this is shown in the SI-1 Excel document in each of the Excel tabs named after resin type. For the NextCycle scenario, this factor was updated to 1.5% to reflect the additional change in material transported in Michigan, compared to the United States. Additionally, the environmental impacts associated with retrofitting the existing facility or building a new infrastructure that would be required for increased recovery of plastics were not considered, as these impacts generally become negligible when averaged over the total output of product over its useful life (Franklin Associates, 2018).
2.5 Integration of socio-economic data into systems analysis
The objective of socio-economic impact analysis in our study is to evaluate process-specific employment, wages, and sales/revenue generation across the entire PET and PO plastics supply chain in Michigan. The employment considered in our study is the number of permanent, full-time, temporary and seasonal employees, working proprietors, managers, partners, and executives within the respective industry (IBIS World, 2023). The wages are gross total wages and salaries of all employees in the respective industry (IBIS World, 2023). The revenues represent the total industry sales of goods and services (excluding excise and sales tax) (IBIS World, 2023). These impacts were estimated for the baseline and NextCycle scenarios to analyze the socio-economic implications due to increased recycling in Michigan. The socio-economic factors shown in Table 3 were used to estimate the socio-economic performance for the relevant processes in Michigan.

Table 3. Summary of socio-economic factors used in our study by supply chain processes.
The employment/MT factors were based on the Tellus Institute report (Goldstein and Electris, 2011). The wages/MT and revenue/MT factors were derived based on the employment/MT factor. For example, a ratio of revenues per employment was multiplied by the employment per MT factor to generate revenue per MT factor. A similar approach was taken to estimate wages per MT, which used a ratio of wages per employment instead. These ratios were obtained from the state-level IBIS World reports based on the NAICS codes for the relevant supply chain processes in Michigan (IBIS World, 2023). The NAICS codes considered in this study and the underlying data are shown in the SI-1 Excel file under ‘NAICS Codes Data_2019’ Excel Tab. The socio-economic factors are “gate-to-gate,” except for virgin resins which is “cradle-to-gate” and are summarized along with calculations in the SI-1 Excel (‘Socio-economic Impacts’ Excel Tab). Due to the lack of information on the socio-economic factors per metric ton for the United States virgin resin production processes in United States, we estimated these factors by combining the life cycle inventory data, material flow data, and NAICS code data as described in the Section S3 of the SI-2 Word document. Please refer to Section S3 of the SI-2 Word document for sample calculations on estimating these impacts and literature review of socio-economic factors. Moreover, all of the socio-economic impact calculations are also shown in the SI-1 Excel file under the ‘Socio-economic Impacts’ Excel Tab.
3 Results and discussion
3.1 Baseline MFA
Figure 1 shows the baseline 2019 material flows of PET and PO plastics in the state of Michigan. This diagram shows the sources of virgin resin coming into Michigan, the semi-manufacturing process for converting these resins to shaped products, the different aggregate end uses of the plastic product, and end-of-life treatment processes. The demand for virgin PET and PO resins in Michigan was determined to be 1,843 kilo metric tons (KMT). About 43% of these total resins were used for extrusion processes, 11% for injection molding, 8% blow molding, 2% injection stretch blow molding (ISBM), and 37% for all other semi-manufacturing processes. The total amount of post-industrial waste generated from these semi-manufacturing processes was estimated to be 28 KMT with 11 KMT of LDPE/LLDPE, 8 KMT of PET, 5 KMT of PP, and 4 KMT of HDPE resin, representing about 2% of the total post-industrial and post-consumer PET and PO waste generation. In addition, Michigan was found to be a net importer of semi-finished PET and PO plastic products, internationally. The net change to the in-use stocks resulted in an addition of 703 KMT of PET and PO materials.
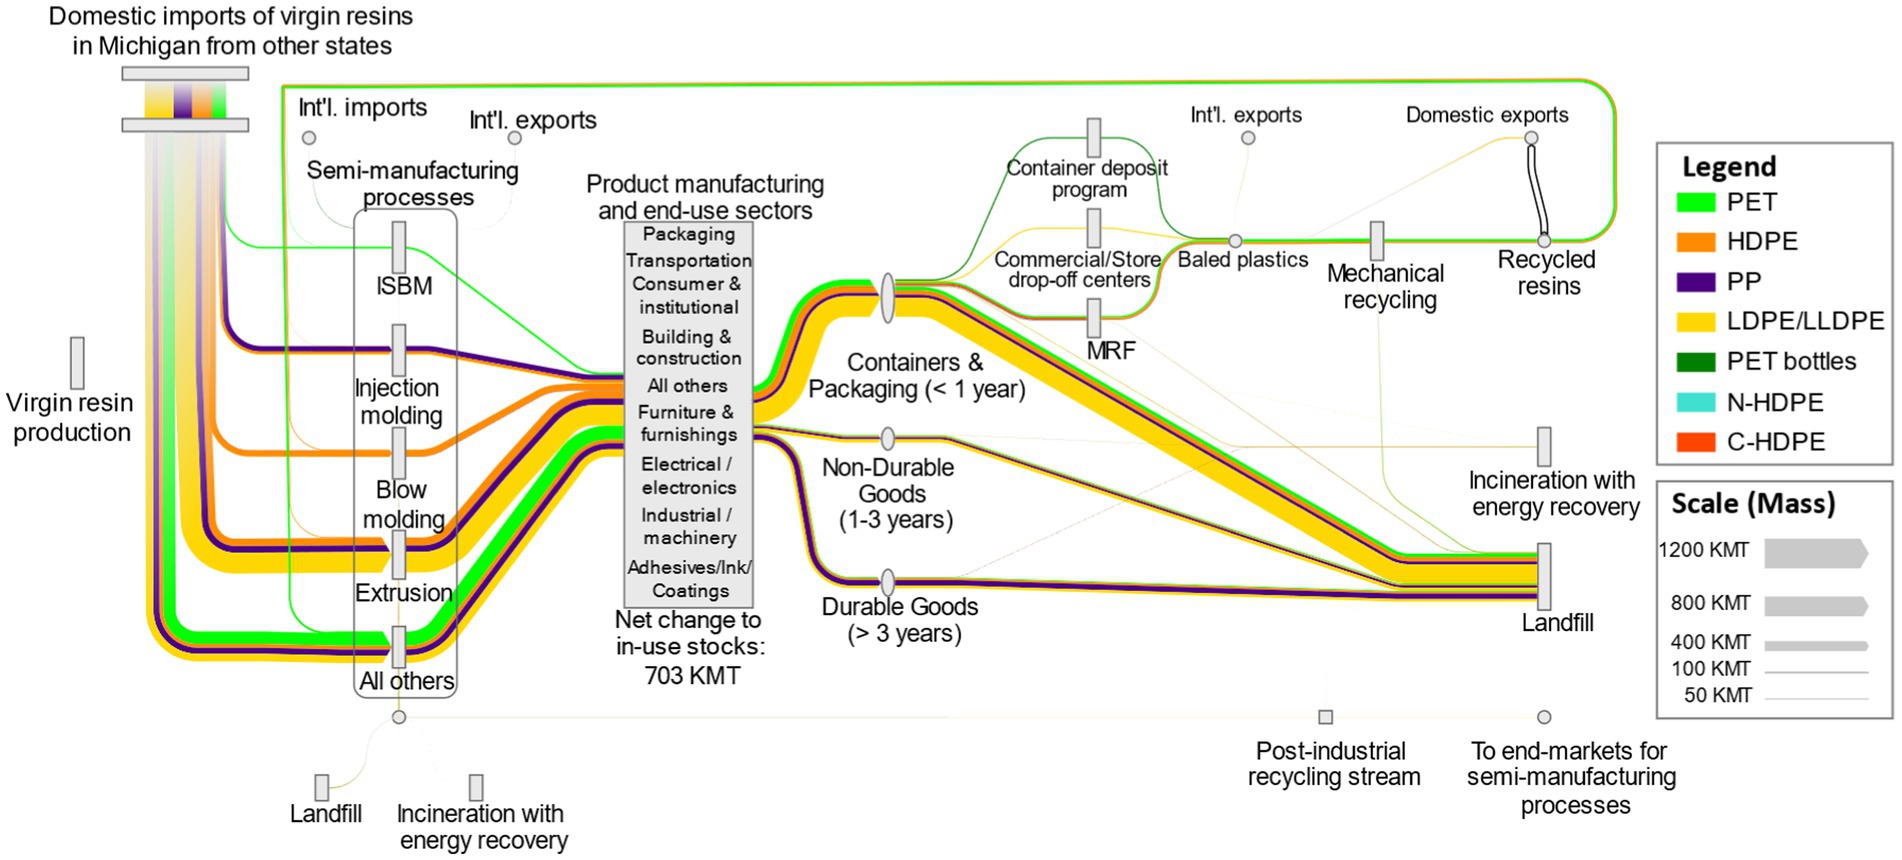
Figure 1. Baseline material flow analysis of PET and polyolefin plastics supply chains in the state of Michigan (2019). The magnitude of material flow is directly proportional to the width of the arrow; ISBM, Injection stretch blow molding; Int’l, International; MRF, Materials recovery facility; Units, kilo metric tons (KMT). The color gradient starting from light shade (“source”) to dark shade (“destination”) represents the direction of flow of materials. The dashed arrow at the EOL from recycled resins to domestic exports shows potential material flow but the magnitude is not known due to lack of data.
The recycled content, as defined previously by (Di et al., 2021), is the ratio of recycled resins to the total (virgin and recycled) resins processed by semi-manufacturing processes. The recycled content of PET and PO supply chains in Michigan was found to be only 4.3%. By resin type, this was the highest for the PET resin (12.1%), followed by the HDPE (7.3%), LDPE/LLDPE (0.2%), and PP resin (0.1%). The recycled content for LDPE/LLDPE and PP resins included only the post-industrial recycled resin, because the post-consumer LDPE/LLDPE and PP resins are domestically exported to the neighboring states to Michigan such as Indiana, Ohio, Illinois, and Wisconsin, thus not accounted for in Michigan’s recycled content.
At the EOL, a total of 1,199 KMT of post-consumer PET and PO waste was generated in Michigan, with most of it being the LDPE/LLDPE resin (47%), followed by PP (20%), HDPE (18%), and PET resin (14%). About 65% of this total waste was found in the ‘containers and packaging’ EOL product category, 21% in ‘durable goods’, and the remainder 14% in the ‘non-durable goods’ EOL product category. At a national (U.S.) level, this distribution at EOL is different: 41% in ‘containers and packaging’, 38% in ‘durable goods’, and 21% in ‘non-durable goods’ EOL product categories (Chaudhari et al., 2022). These differences are due to the use of different sources of EOL data such as the NextCycle report (NextCycle Michigan, 2021) used in this study, while U.S. EPA data is used in the national study, especially for the ‘containers and packaging’ category.
Of this total post-consumer PET and PO plastic waste generated in Michigan, 86% was landfilled (1,034 KMT), 12% collected for recycling (144 KMT), and 2% incinerated with energy recovery (21 KMT). The incineration rate in Michigan is lower than the national average as there is only one incineration facility in the state. The resin-specific recycling rates were found to be the highest for PET resin (35%), followed by HDPE (25%), LDPE/LLDPE (4%), and PP resin (2%). These rates were calculated by dividing the total amount of resin collected for sorting and recycling by the total resin specific waste generated in Michigan. Approximately, 5.6 KMT of the baled PET and PO plastic waste was estimated to be exported internationally from Michigan to other countries. A majority (over 80%) of these exports in 2019 were to Malaysia, India, South Korea, and Hong Kong (United States Census Bureau, 2023). All the remaining baled PET and HDPE post-consumer plastics were mechanically recycled in Michigan to produce a total of 79 KMT of recycled PET and HDPE resins. The total post-consumer PET and HDPE reclamation capacity is 114 KMT in the state of Michigan. There are 18 reclaimers in Michigan, as of July 2023, with the majority of them processing post-industrial plastic waste, and only a few processing post-consumer plastic waste (EGLE RRS, 2019, RRS NextCycle Michigan, 2021, Closed Loop Partners (CLP)). Also, the remaining post-consumer LDPE/LLDPE and PP waste are likely to be exported to other neighboring states such as Indiana, Ohio, etc. due to lack of end markets for these post-consumer resins in Michigan (Closed Loop Partners, 2022).
The PET and PO plastic product-specific recycling rates are shown in Figure 2. Overall, rigid plastic products such as PET and HDPE bottles exhibit higher recycling rates than other plastic products such as flexible PE films. At the EOL, all of the PE films collected for recycle in Michigan are via commercial/retail store drop-off centers, rather than through curbside collection. The recycling rate of PET bottles in Michigan is the highest among other products, principally due to the Michigan bottle deposit program. Additionally, this recycling rate is nearly twice as high compared to the national recycling rate of PET bottles (29%) (United States EPA, 2020a). Approximately, 45% of the total PET bottles collected for recycle in Michigan are via the bottle deposit program, while the remaining 55% are collected via the curbside programs (NextCycle Michigan, 2021). The curbside collected PET bottles are further sent to a MRF to separate it from other curbside recyclables such as cardboard, paper, metals, other plastic resins etc. It is interesting that recycling rates of rigid HDPE products are nearly as high at PET bottles, despite HDPE not having a deposit program. A favorable comparison of our baseline recycling rates of PET and PO plastic products with another recent report (The Recycling Partnership, 2024) is provided in Figure 3 further validating our baseline results.
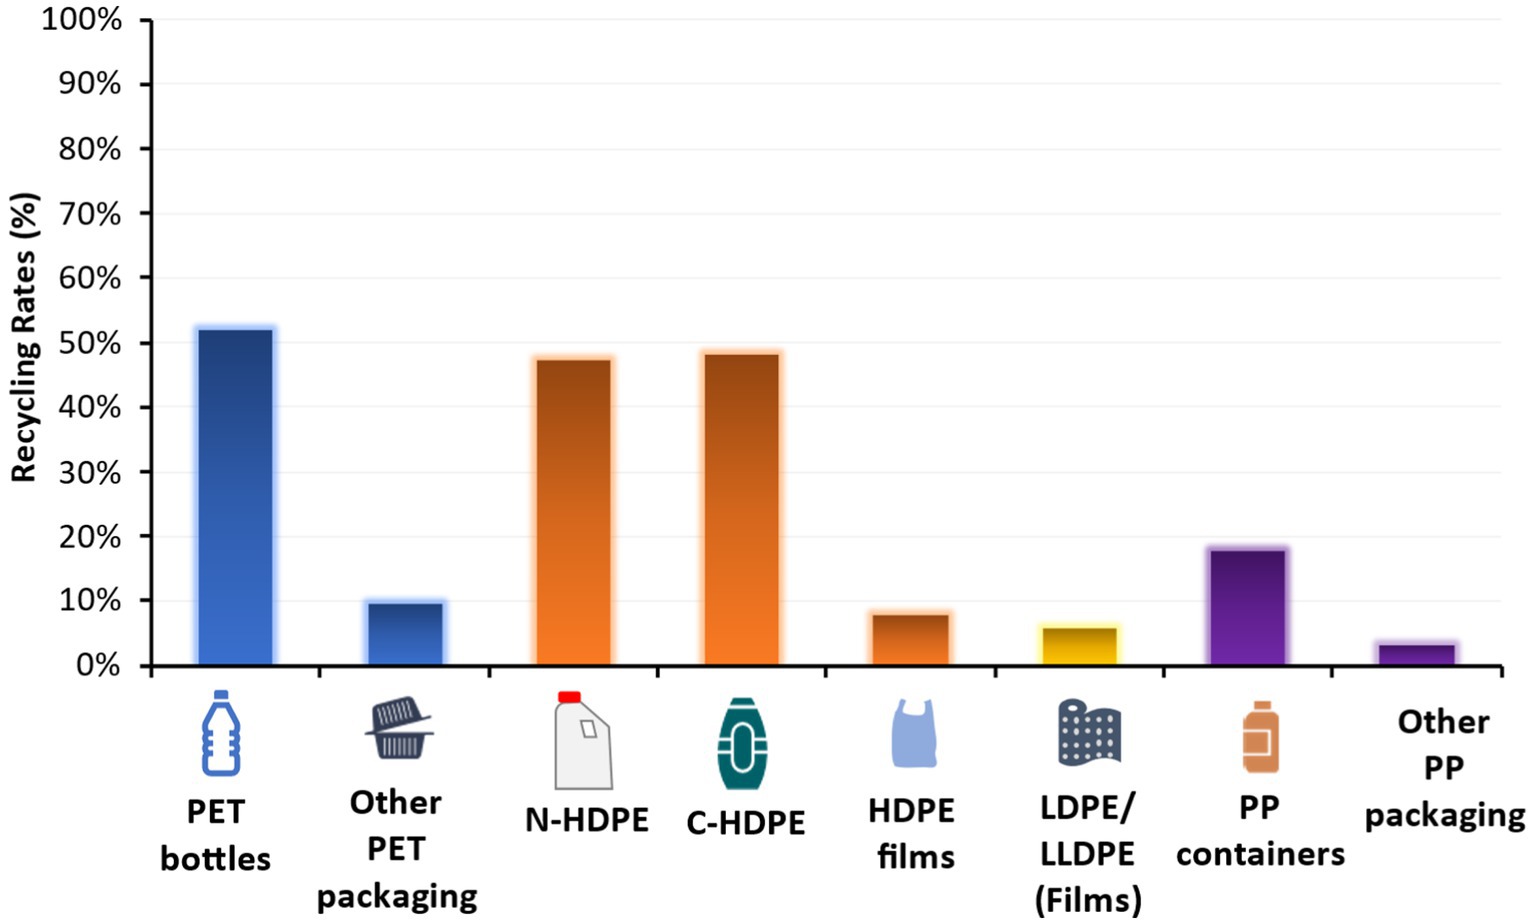
Figure 2. PET and PO plastics product-specific recycling rates for the Michigan base case. These rates were calculated by dividing the total amount of product collected for sorting and recycling by the total product-specific waste generation in Michigan. Data for PET bottles, natural and colored HDPE bottles, LDPE/LLDPE films, and PP containers based on (NextCycle Michigan, 2021), and that for others as mentioned in the Section 2.2.
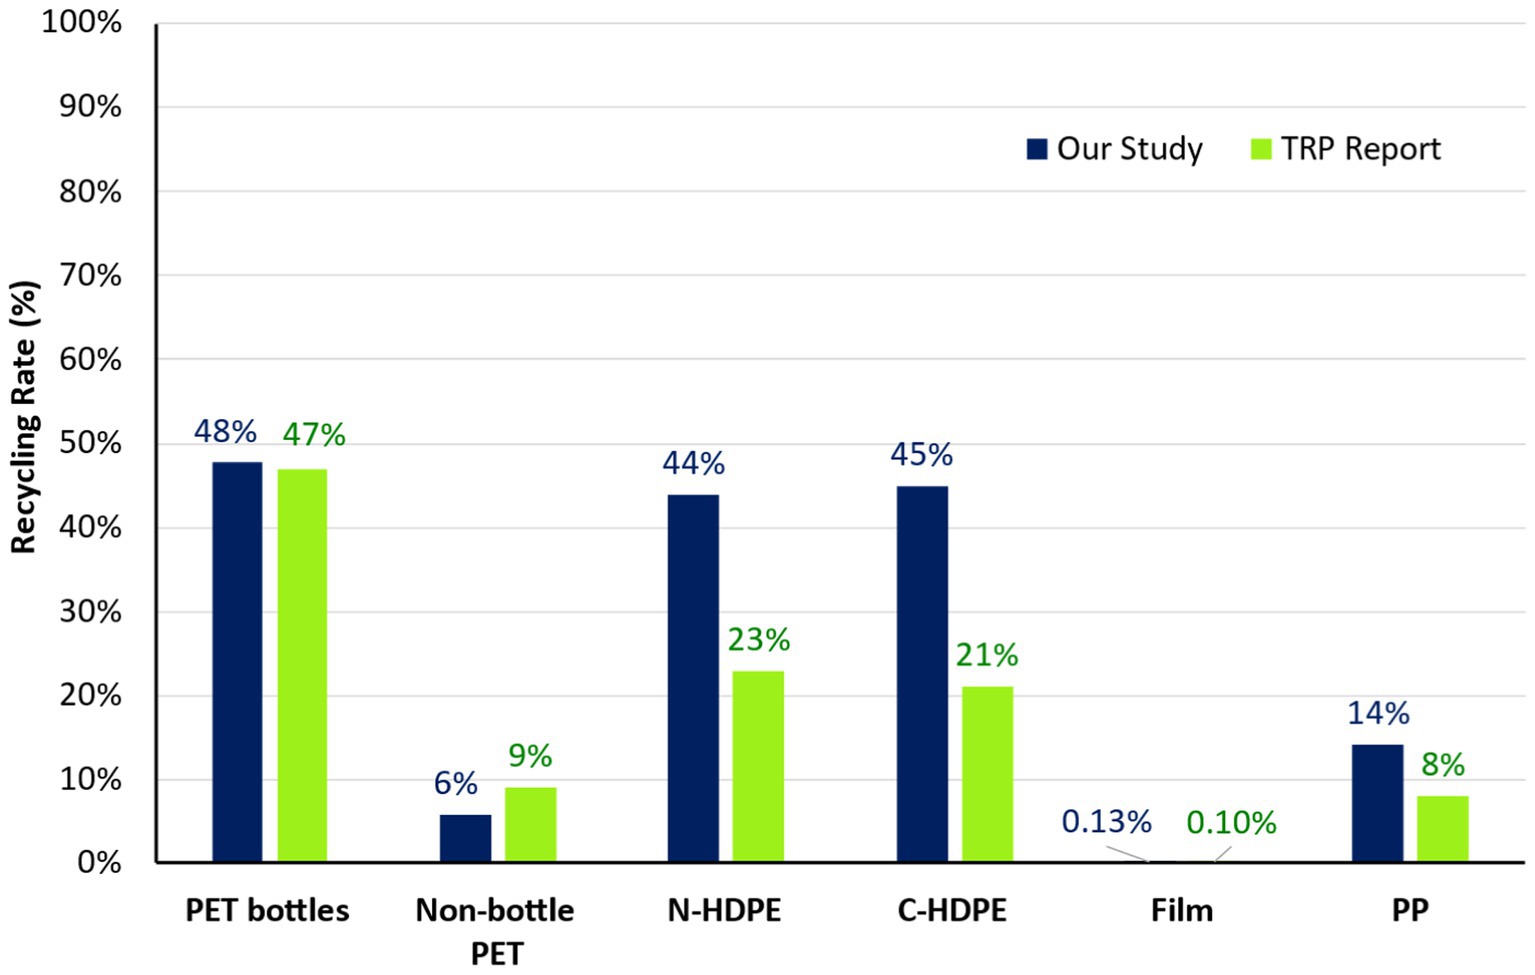
Figure 3. Comparison of baseline recycling rates of plastic products from our study with TRP report. The recycling rate shown in this figure was calculated based on the definition given in the (The Recycling Partnership (TRP), 2024). The calculations behind this figure are shown in Section S4.1 of the SI-2 Word document; N-HDPE, Natural HDPE; C-HDPE, Colored HDPE; Film includes both LDPE/LLDPE and HDPE films.
Overall, the recycling rates based on the definition of TRP report (The Recycling Partnership, 2024) and calculated from our Michigan material flow data align well with that from the TRP report, with some exceptions for N-HDPE, C-HDPE, and PP. The recycling rates for N-HDPE, C-HDPE, and PP based on our study are almost twice that of the ones depicted in the (The Recycling Partnership, 2024) report. The main reason could be due to the differences in the dataset used in our study and the TRP report, which is that our study includes recyclable materials collected via residential as well as commercial and institutional collection programs. The TRP report excludes recyclable material collected from commercial and institutional sources, and in Michigan, it is believed that more than half of the recyclable materials recovered for recycling are to be collected from the commercial and institutional sources (NextCycle Michigan, 2021). However, the exact percentage distribution between residential and commercial collection programs for recovery of different plastic products would require additional data collection efforts (NextCycle Michigan, 2021). The recycling rates for PET bottles align very well with that in TRP report as PET bottles are mainly collected via curbside and drop off recycling programs including state deposit container programs, which is consistent in our study and the (The Recycling Partnership, 2024) report.
3.2 Baseline GHG emissions and cumulative energy demand
The total GHG emissions and net CED of Michigan PET and PO plastic supply chains were estimated to be 1,680 KMT CO2-eq/year (Figure 4A) and 39 PJ/year (Figure 4B), respectively. As seen from Figure 4, these impacts were mainly dominated by the semi-manufacturing processes (1,493 KMT CO2-eq; 37 PJ), followed by EOL processes (116 KMT CO2-eq; 0.85 PJ), then transportation (70 KMT CO2-eq; 0.94 PJ). These total GHG emissions represent ~0.9% of the total Michigan GHG emissions (190,889 KMT CO2-eq/year; excluding land use and forestry carbon stock change) and 5.7% of the industry sector GHG emissions (29,454 KMT CO2-eq/year; excluding electricity consumption emissions) (United States EPA, 2019b). Similarly, the net CED shown in Figure 4B represents 1.3 and 5.2% of the total energy (3,039 PJ) and industrial energy (744 PJ) consumed in Michigan, respectively (United States EIA, 2023).
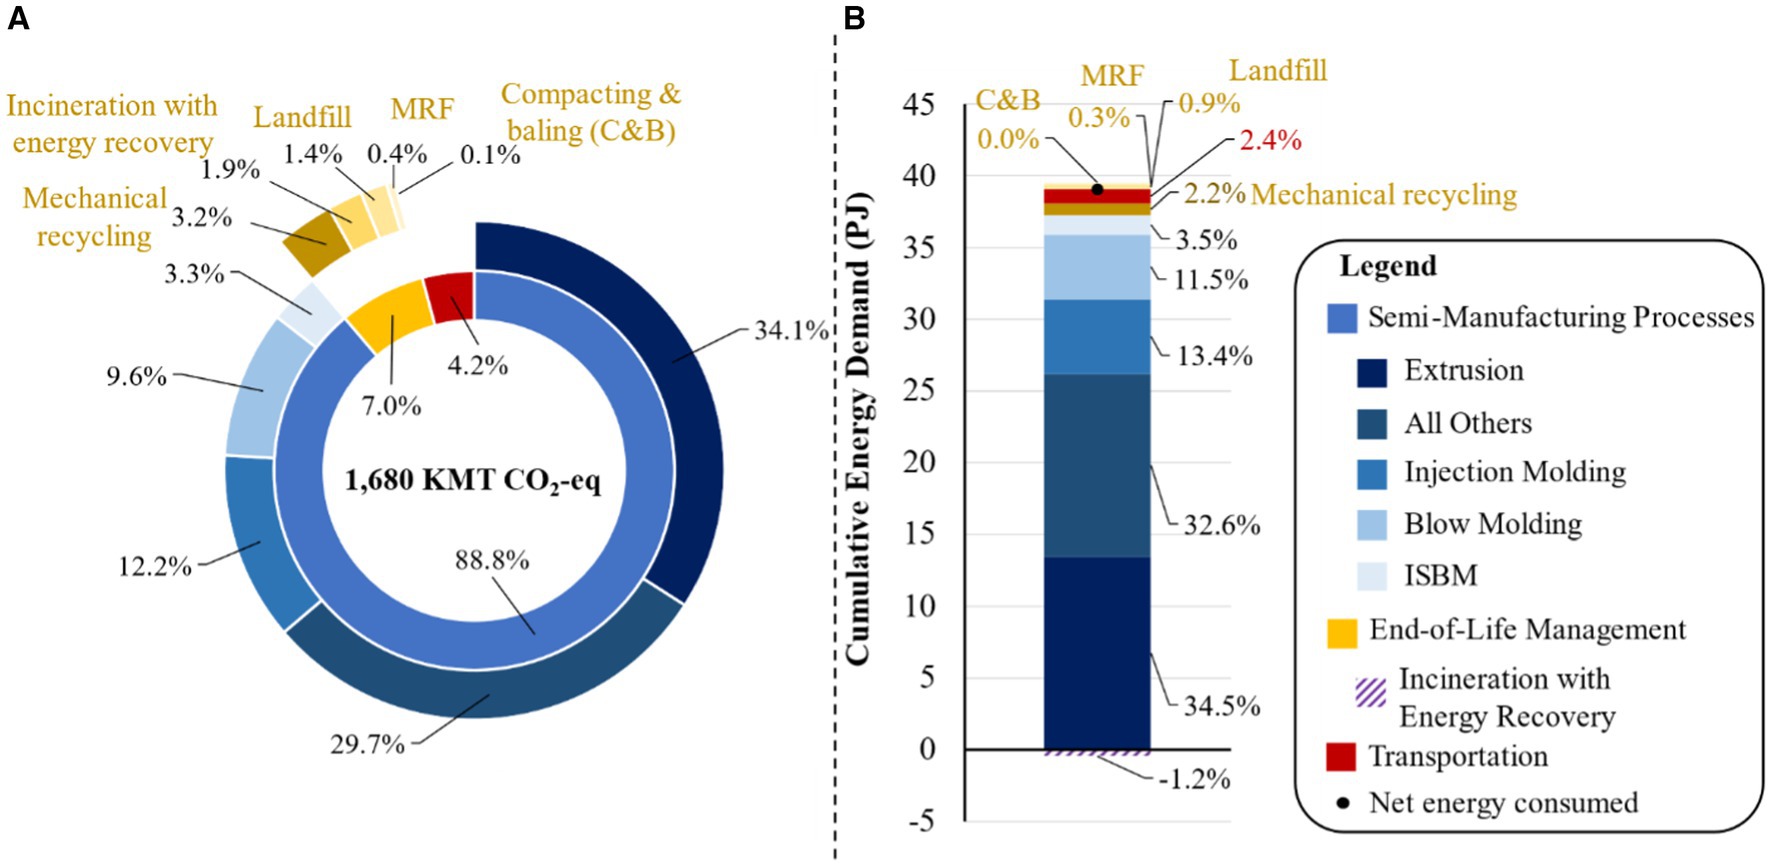
Figure 4. Baseline total GHG emissions (A) and CED (B) of PET and PO plastic supply chains in the state of Michigan (2019).
The impacts shown in Figure 4 can also be compared against the national PET and PO plastics supply chains in the United States. For example, the total GHG emissions of Michigan PET and PO plastic supply chains (Figure 4A) contributed 1.7% to the national PET and PO plastics supply chain GHG emissions in 2019, which also includes the impacts of United States virgin resin production (Chaudhari et al., 2022). It is important to note that the impacts of imported virgin PET and PO resins were not included toward the Michigan total GHG emissions because they occur outside of Michigan. The CED shown in Figure 4B represented about 1.2% of the total energy consumed by United States PET and PO plastics supply chains in 2019 (Chaudhari et al., 2022). These GHG and CED contributions to United States totals are low relative to Michigan’s population and economic impact due to the lack of virgin production in Michigan.
Most of the impacts related to semi-manufacturing process were dominated by the extrusion processes. As for the EOL processes, they contributed 7% to the total GHG emissions, with mechanical recycling contributing the most (3.2%), followed by incineration with energy recovery (2%). This is because Michigan has only one incinerator, and the material flows going to incineration are also small, which can be seen from Figure 1. The GHG emissions of landfilling plastics contributed only 1.4%, despite the higher magnitude of material flows to landfills. This is mainly because plastics do not degrade in landfills and have no biodegradable carbon to contribute to methane emissions. The only impacts associated with landfilling plastics include the collection and transportation of the materials to the landfill facility, and landfill operating equipment. The GHG emissions associated with the MRF operations includes only the rigid plastic material such as PET, HDPE, and PP being collected via curbside collection program. Similarly, the compacting and baling processes outside a MRF applies only to flexible PE films material being collected at store drop-off centers, and the PET bottles collected via deposit container systems. Both of these processes contributed less than 0.5% to both of the impact categories. The transportation related impacts were found to be less than 5% in both of the impact categories, consistent with our previous national level analysis (Chaudhari et al., 2022).
3.3 Michigan NextCycle scenario: MFA
The complete MFA Sankey diagram for the NextCycle scenario is shown in Figure 5, which shows the increased EOL recovery and recycling of PET and PO plastic products based on (NextCycle Michigan, 2021). Comparing Figure 5 with the base case MFA shown in Figure 1, the amount of virgin resins imported into Michigan reduced due to increased recycling as well as reduced disposal rates of these plastics. The total amount of virgin resins avoided was found to be 245 KMT. About 32% of the total PET and PO waste was collected for sorting and recycling, 66% was landfilled, and 2% was incinerated with energy recovery.
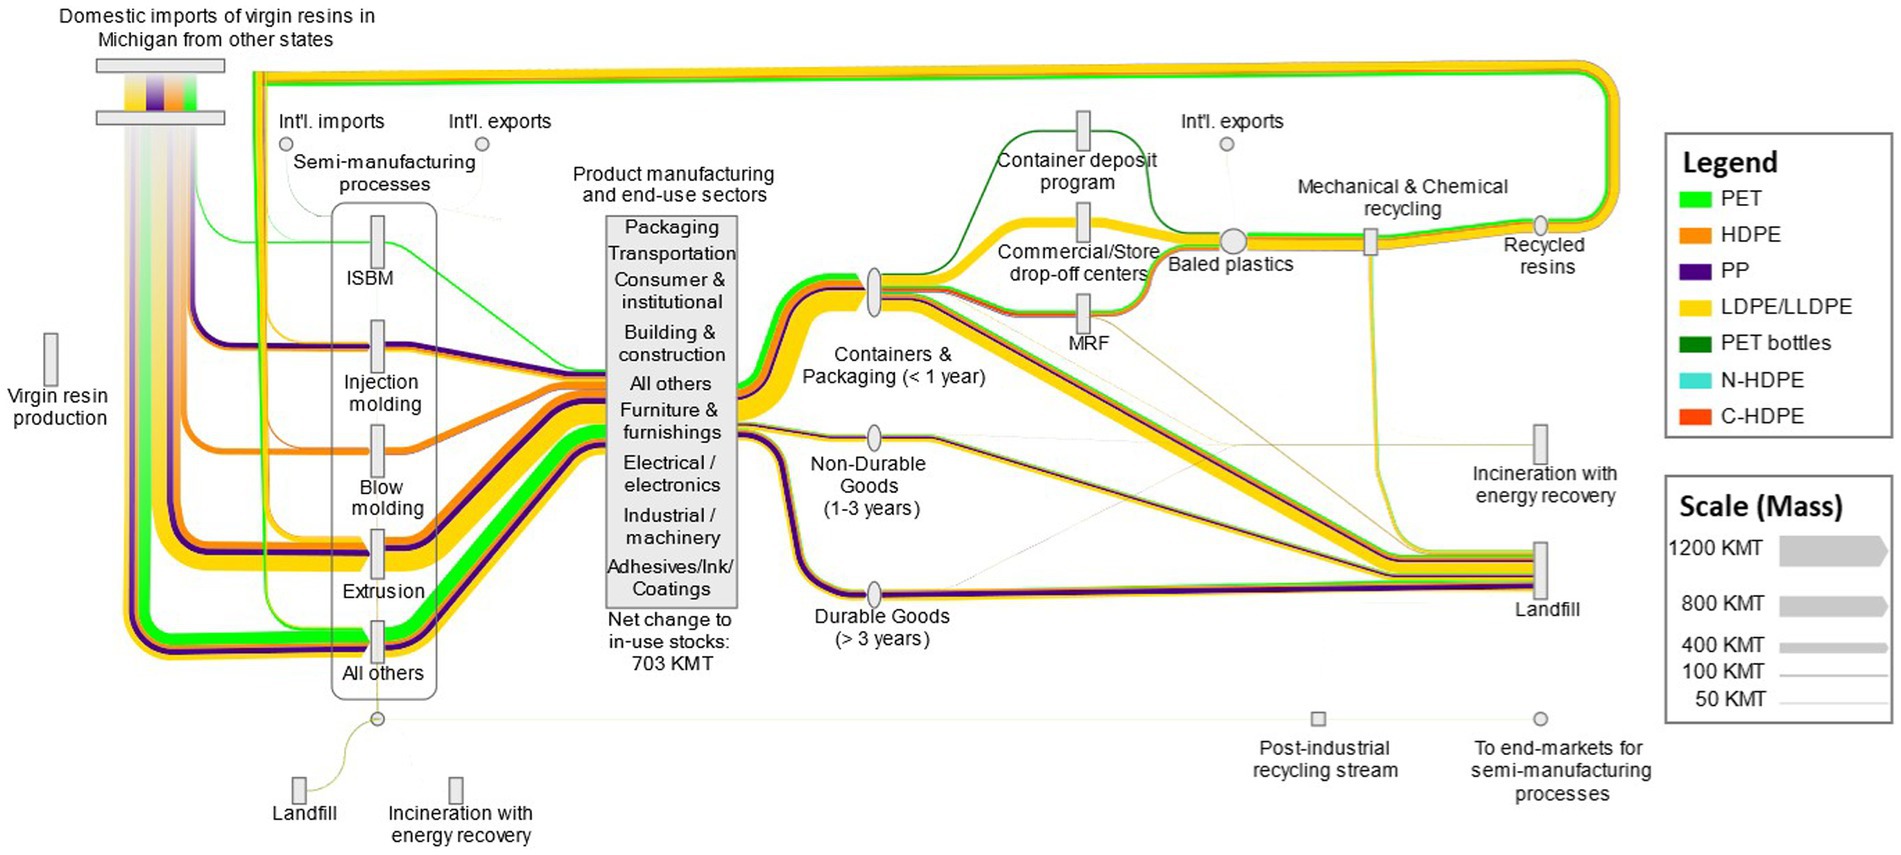
Figure 5. Material flow analysis of PET and polyolefin plastics supply chains in Michigan for the NextCycle Scenario.
Figure 6A compares the base case and NextCycle recycled amounts (in KMT) and recycling rates (%) that are specific to post-consumer PET and PO plastic products. Similarly, Figure 6B shows the overall recycling rate (%) and recycled content (%) that are specific to the type of post-consumer resin, which include all types of plastic products.
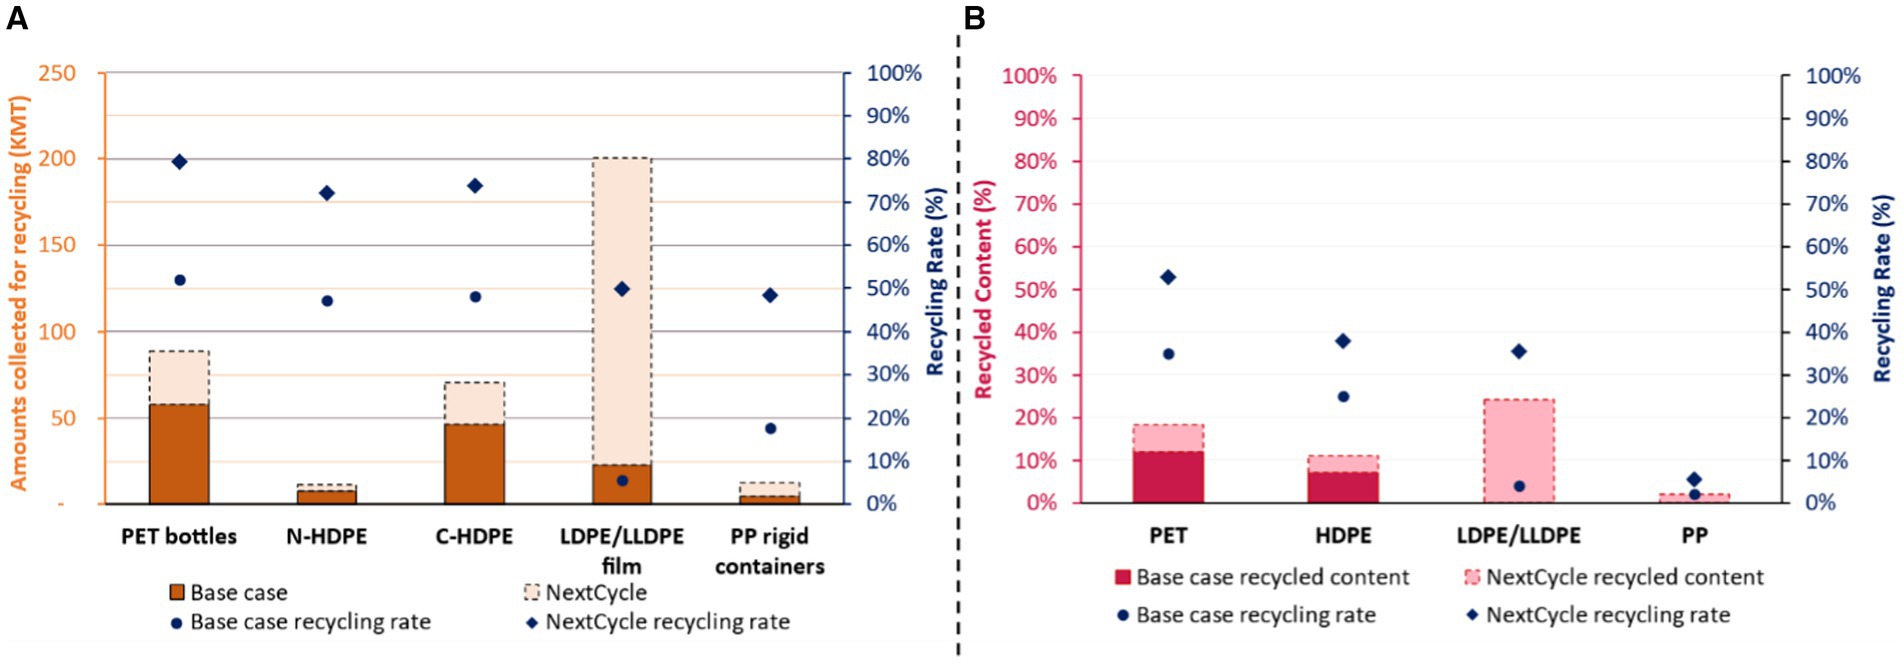
Figure 6. Amounts collected for recycling, potential recycling rates and recycled content of post-consumer PET and PO materials in Michigan. (1) For (A) the data shown in orange color is for the primary Y-axis and that in blue color is for the secondary Y-axis; (2) For (B), the data shown in dark pink color is for the primary Y-axis and that in blue color is for the secondary Y-axis.
A total of additional 245 KMT of post-consumer PET and PO plastic products are needed to be recovered to reach the Michigan’s overall recycling goal of 45%, As shown in Figure 6A (NextCycle Michigan, 2021). This is about a 75% increase compared to the currently recovered amount of 139 KMT of PET and PO plastic products, with a huge opportunity seen for The LDPE/LLDPE films and the least for rigid PP. In total, this equates to a total potential recovery of 384 KMT of these plastic products. While the product specific recycling rates are shown in Figure 6A, the overall potential recycling rates of these plastic products were found to be 59%, up by 38% from the base case recycling rate of 21%, with reduced potential landfilling and incineration rates of 40 and 1%, respectively. Similarly, from Figure 6B, the overall potential recycling rates and recycled content for these resins were found to be 32 and 15%, respectively, up by 21 and 11% from their respective base cases. It can also be noted from Figure 6B that the post-consumer recycled content for each resin type is lower than the maximum limit of recycled content for mechanically recycled plastics across different applications (Eriksen et al., 2020). As noted previously (Chaudhari et al., 2021), advanced recycling technologies would need to be integrated with existing EOL supply chain processes after exceeding the maximum limit of recycled content, and to avoid the use of virgin resins.
3.4 NextCycle scenario: systems-level GHG emissions and CED
Figure 7 shows a comparison of base case and NextCycle GHG emissions (Figure 7A) and CED (Figure 7B) of PET and PO plastic supply chains in Michigan. Overall, the NextCycle scenario for PET and PO plastics supply chains achieved a net 14 and 34% savings of GHG emissions and CED impacts, respectively, when compared with their respective base cases. Even though there is an increase in both total impacts inside Michigan due to increased recycling activities in the NextCycle scenario, there is a net decrease on a system level in both GHG emissions and CED due to a reduced need for virgin resins imported into Michigan. The credits for avoided virgin resin were included in the NextCycle scenario to reflect the consequential effects and show the net change to the environment. Most of these avoided impacts were due to the LDPE/LLDPE supply chain, as it had the highest potential recovery, thereby avoiding the use of virgin LDPE/LLDPE resin the most, when compared with other resins. The net GHG emission savings of 0.23 MMTCO2-eq between baseline and NextCycle scenario was found to be aligning with a report (EGLE RRS, 2019), which showed GHG emission savings of 0.25 MMTCO2-eq due to increased recycling of plastics to meet the state’s recycling goal. However, that report lacked insights on savings of energy.
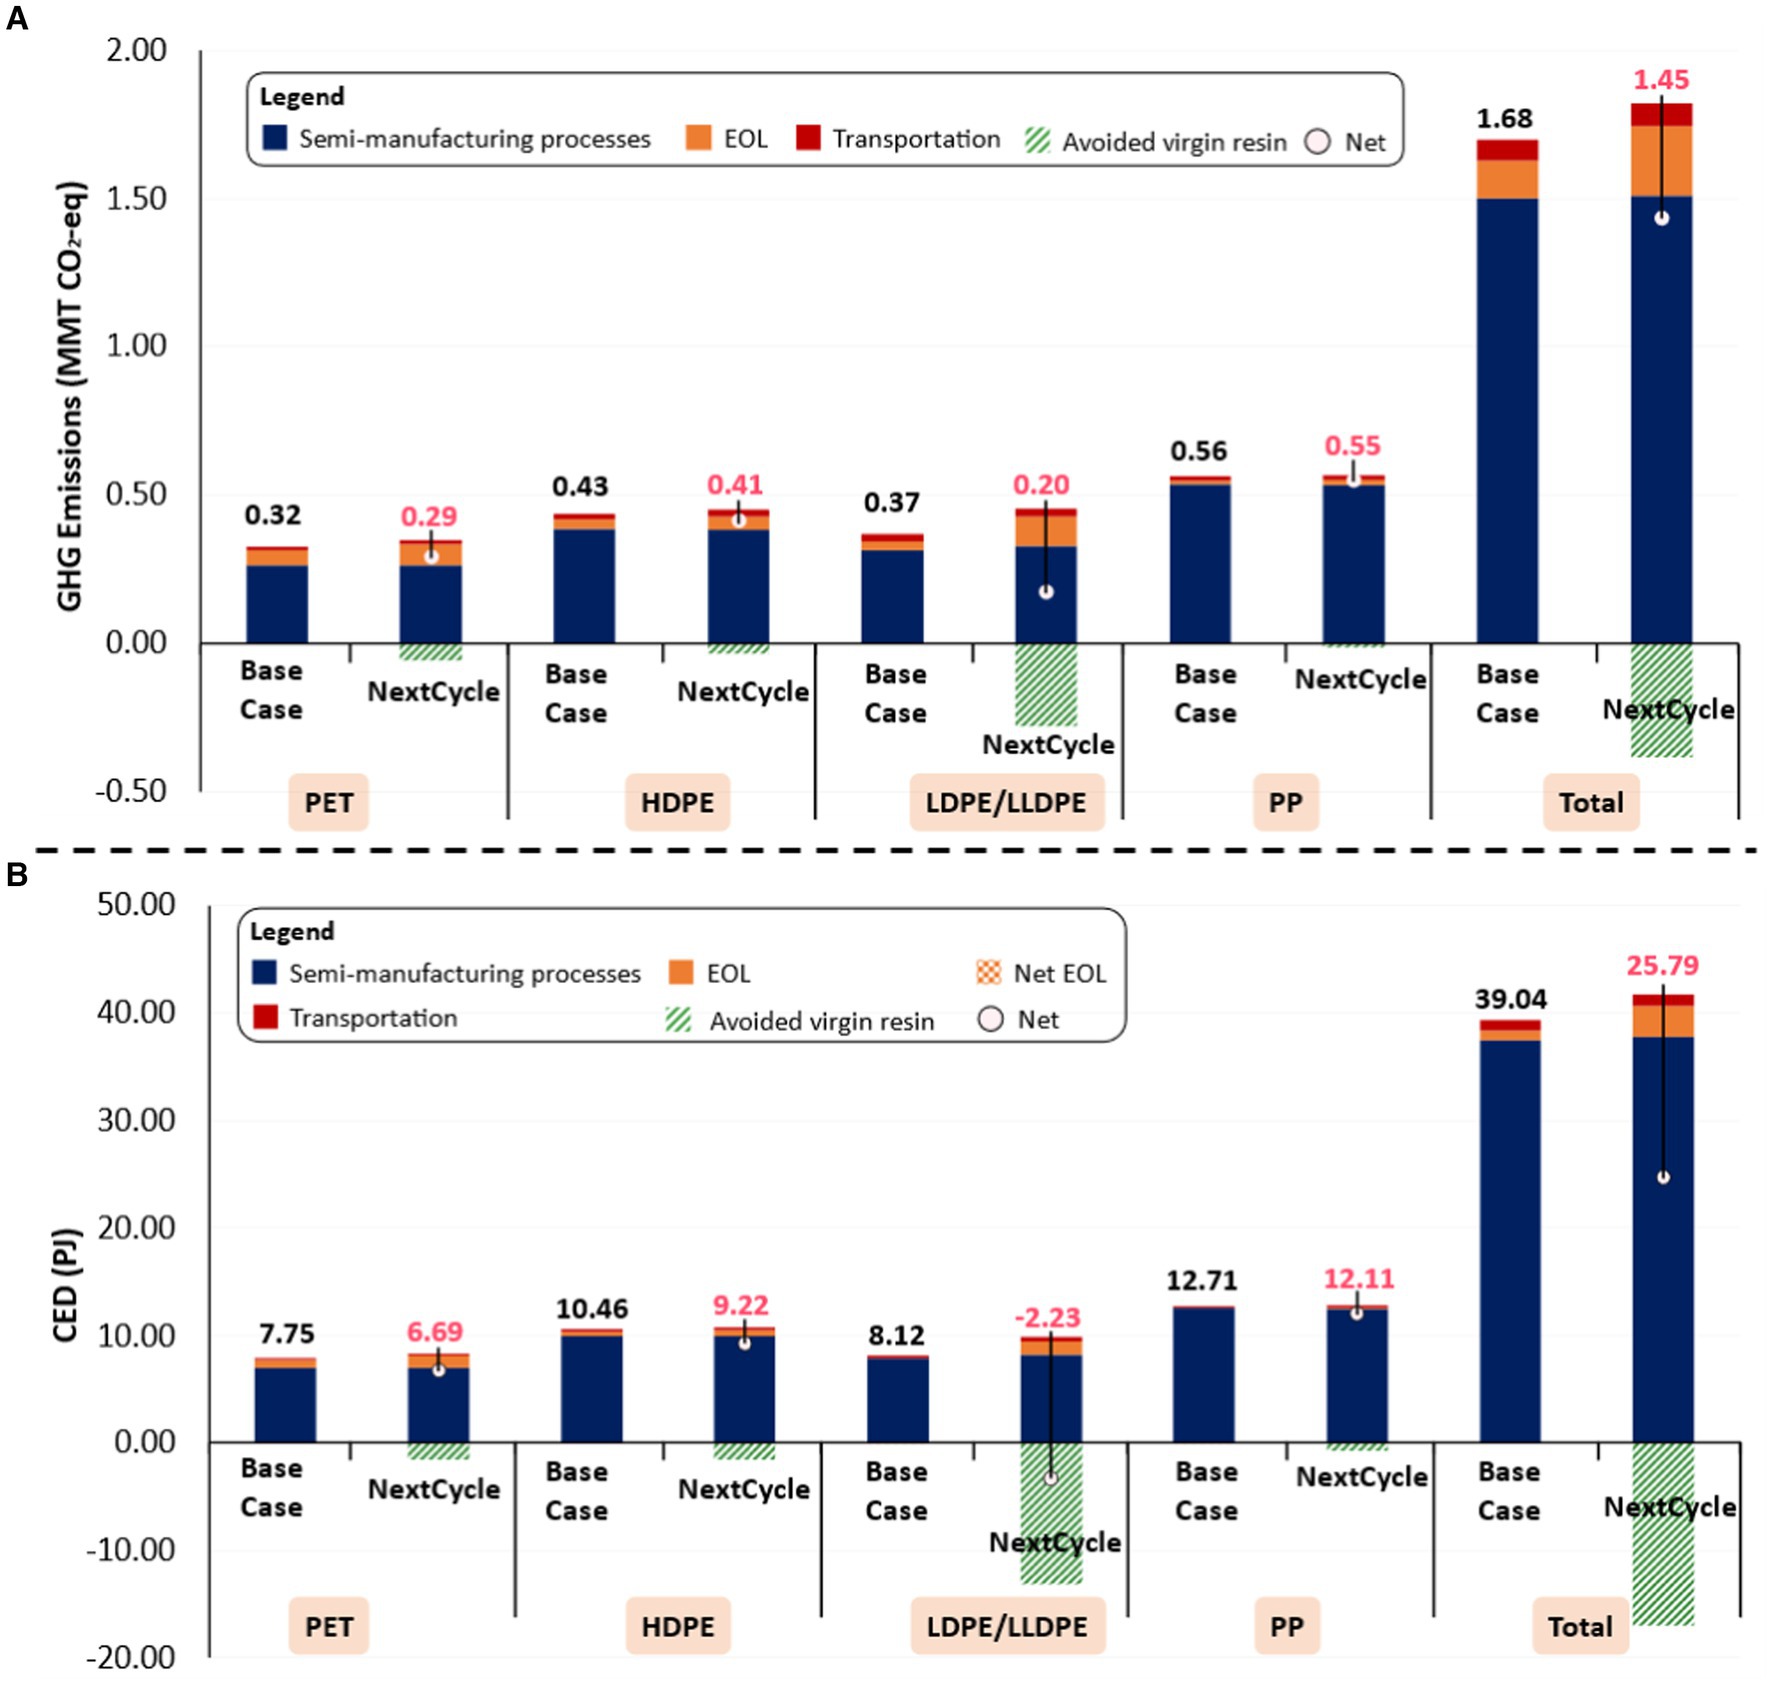
Figure 7. Systems level GHG emissions (A) and CED impacts (B) of PET and PO plastics supply chains in Michigan. The total and net values on the graph are shown with black and dark pink colors, respectively.
The reduced NextCycle impacts would represent 0.75 and 0.81% of the total Michigan GHG emissions and energy consumption, respectively. Overall, increased recovery and recycling of plastics showed a shift from high emissions and energy intense processes to lower emission and energy intense processes, achieving overall savings of natural resources (Wiebe et al., 2023).
3.5 Socio-economic impacts
3.5.1 Supply chain wide socio-economic impacts
The socio-economic impacts across the entire supply chain processes in Michigan are shown in Figure 8 for both base case and NextCycle scenarios. The majority of these impacts were dominated by the semi-manufacturing processes. The net employment, revenue, and wages generation across the entire supply chain processes in the NextCycle scenario were found to be 23,622 employees/year, $5,843 million (MM)/year, and $1,094 MM/year, respectively. This represented a net gain of 2 and 0.3% for the employment and wages metrics in the NextCycle scenario (Figures 8A,C), when compared with the base case. However, it showed a net decrease of 6% in the revenue generation outside Michigan due to avoided use of virgin resin in Michigan (Figure 8B). This finding is consistent with (Cimpan et al., 2023) which showed a net decrease in the economic value addition to the supply chains with increased circularity, mainly due to the losses associated with upstream processes in virgin resin production. Figure 8 accounts for the “consequential effects” due to avoided use of virgin resins and avoided disposal compared with the base case supply chain processes. The effects of increased recovery and recycling of plastics at the EOL in the NextCycle scenario without accounting for the consequential effects are shown in Supplementary Figures S2–S4, which showed increased socio-economic performance at the EOL processes due to increased recycling.
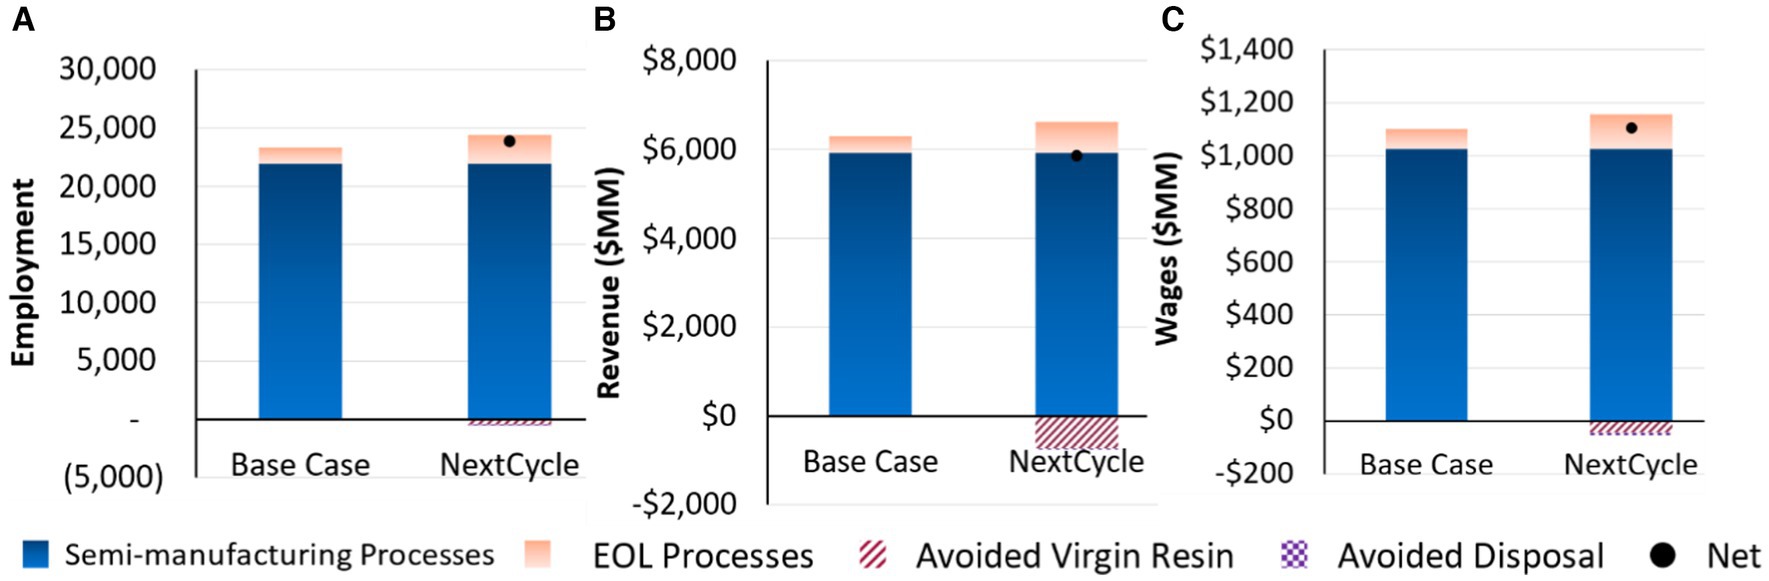
Figure 8. Socio-economic impacts across the entire PET and PO plastics supply chains in Michigan.
3.5.2 End-of-life process-specific socio-economic impacts
The base case and NextCycle socio-economic performance across the EOL processes is shown in Figure 9 (employment Figure 9A; revenues Figure 9B; wages Figure 9C). Overall, the NextCycle scenario showed increased socio-economic performance in Michigan due to increased recycling and processing activities in Michigan, compared to the base case. Moreover, it showed a net gain in the EOL employment and wage generation in Michigan even after accounting for the impacts due to avoided use of virgin resin and displaced disposal-related processing activities in Michigan. However, it resulted in a net loss of EOL revenue generation due to avoided use of virgin resins showing a potential trade-off of increased recycling rates.
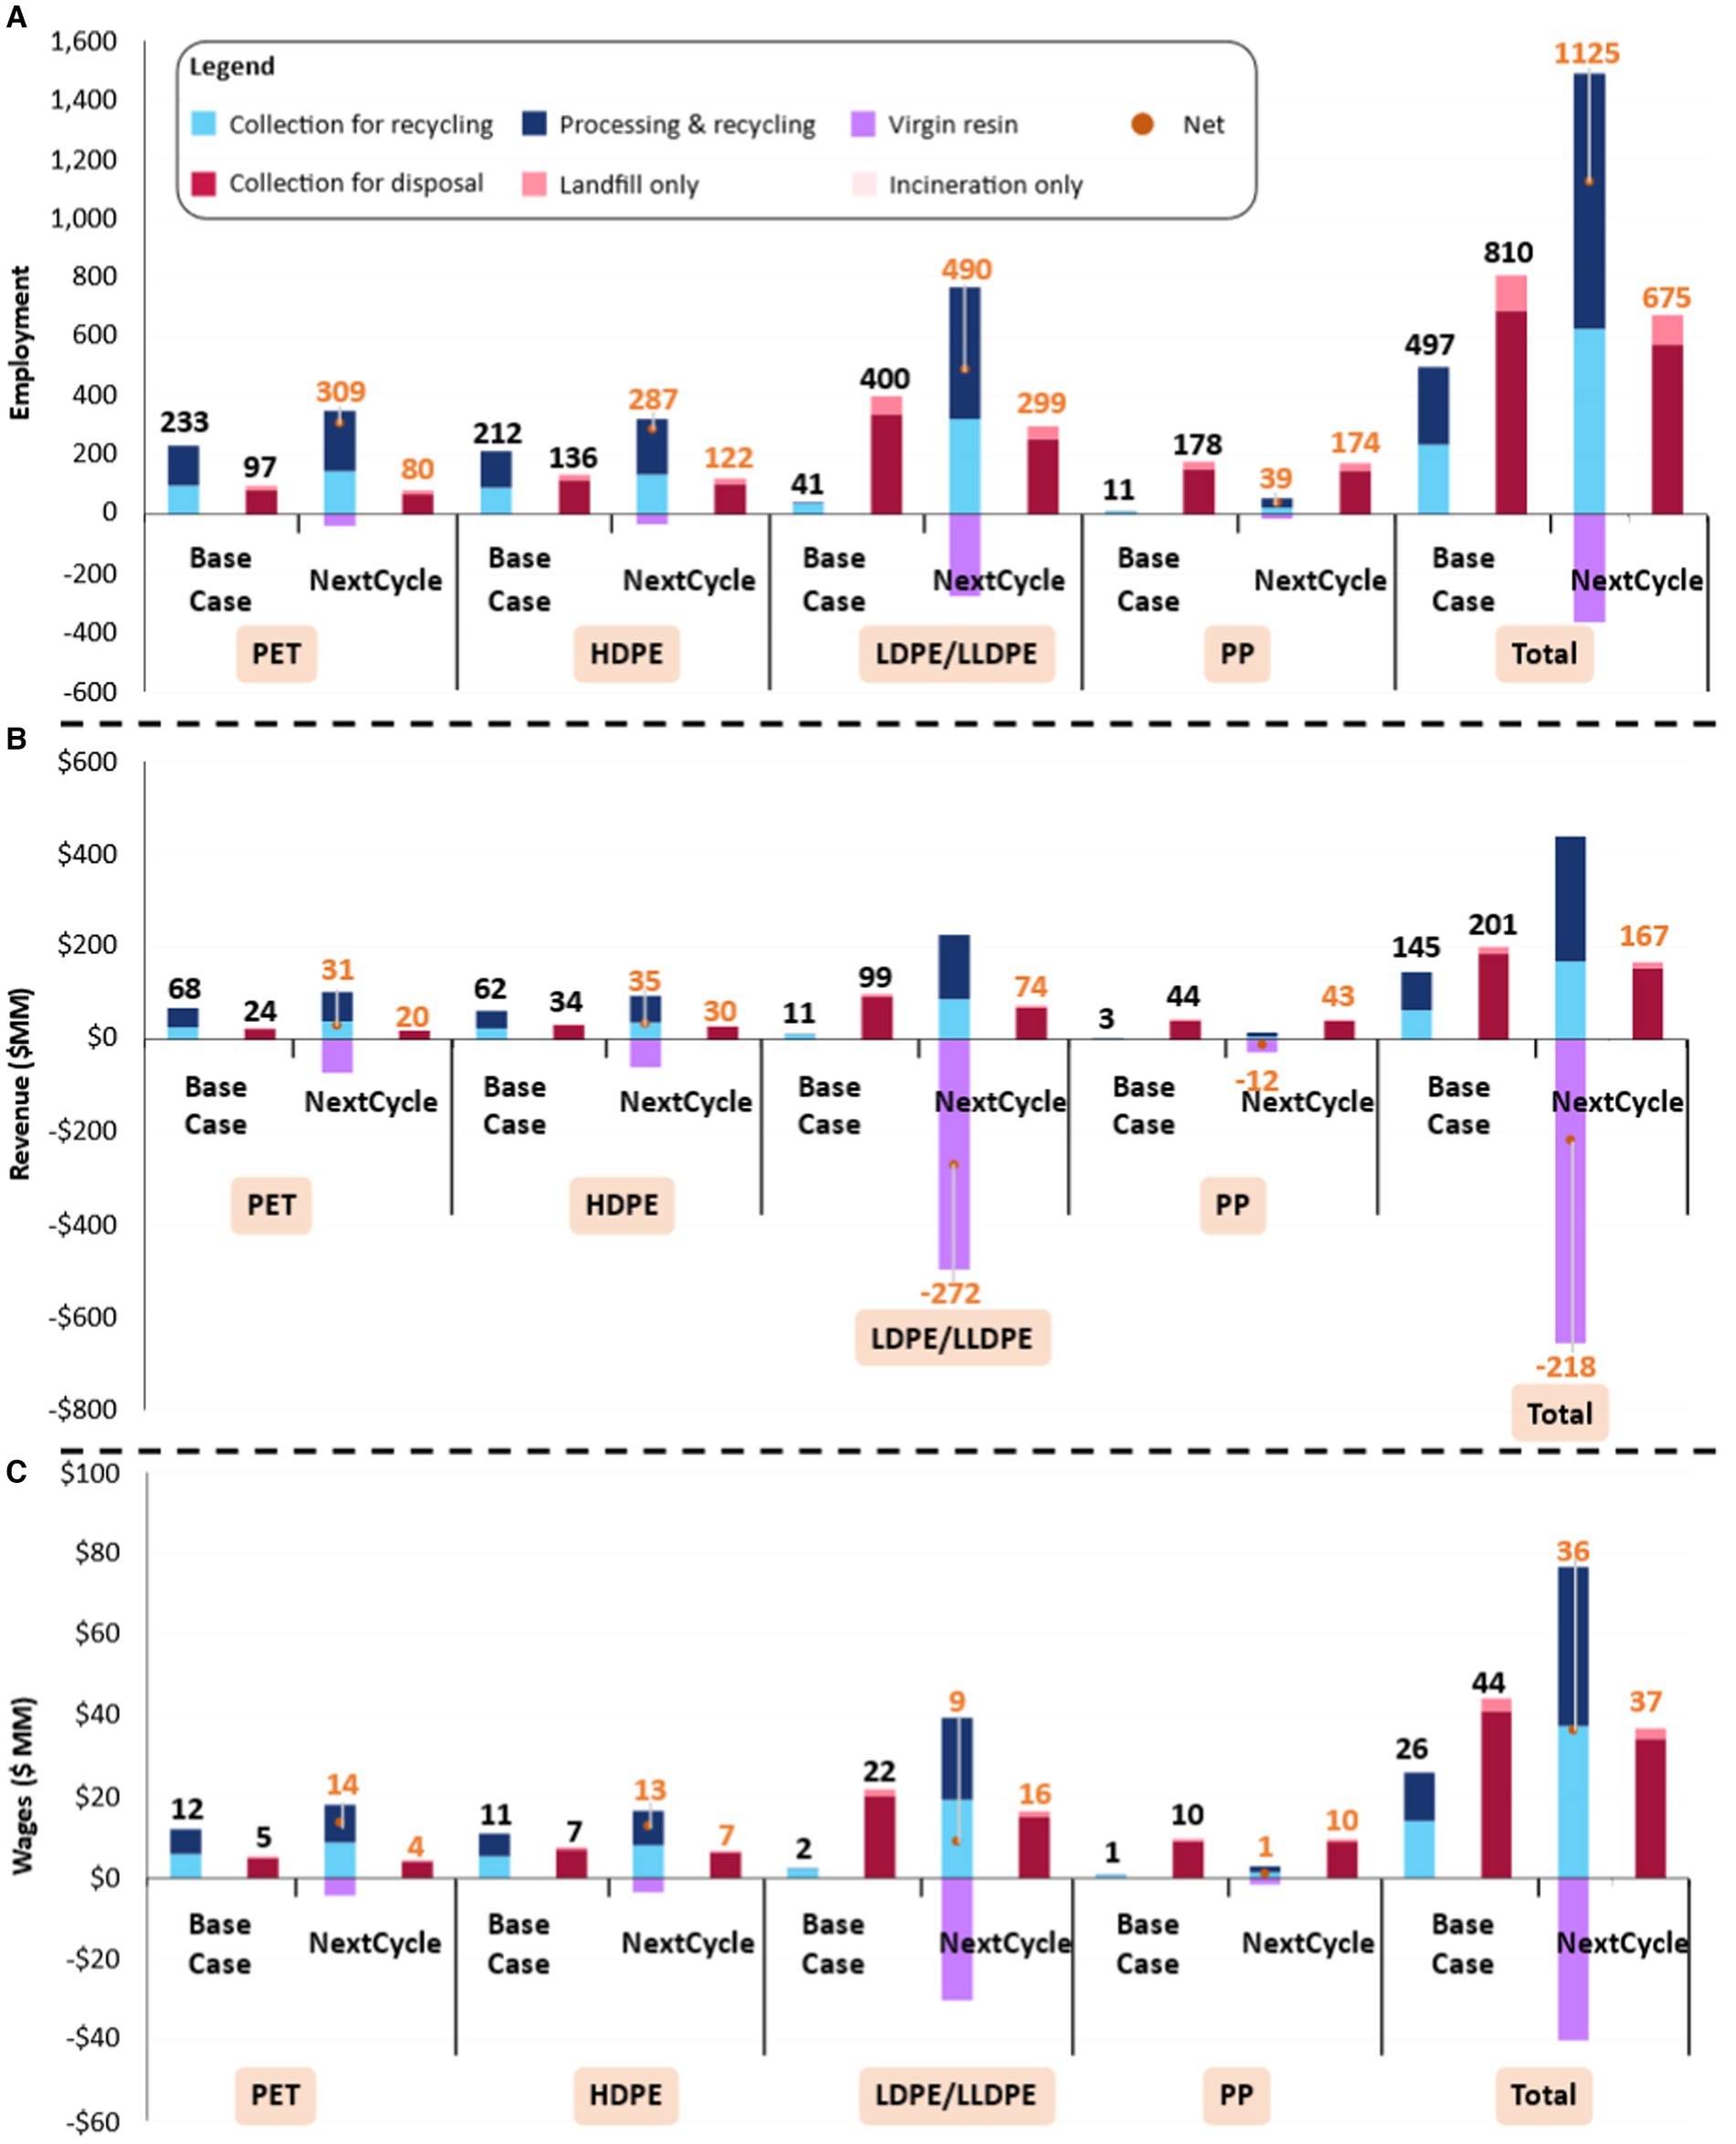
Figure 9. Socio-economic impacts comparison of EOL PET and PO plastics supply chains in the state of Michigan (2019). The values shown in orange color represents the net value.
In the base case, the total socio-economic impacts were dominated by the disposal-related processes due to higher overall disposal rates, except for PET and HDPE supply chains. The socio-economic impacts of PET and HDPE supply chains were mainly due to recycling-related activities due to higher recycling rates. In the NextCycle scenario, these impacts were due to recycling-related processes in Michigan due to an increased recovery and recycling of these plastics in Michigan.
The total EOL employment for PET and PO plastics (Figure 9A) in the base case was 1,307 employees in Michigan. About 62% of the total employment was associated with disposal-related processes and the remaining 38% with recycling-related processes, which is mainly due to high disposal rates than recycling rates in the base case. For the employment related to disposal processes, most of this employment was generated in the collection of plastics rather than actual landfilling or incineration processes themselves. This is because the equipment used at landfill and incineration facilities can handle large tonnages with few employees (Goldstein and Electris, 2011). For the employment related to recycling processes, about 53% of the jobs are created in the sorting, baling, and reclaimer processes, and the remaining 47% in the collection of these plastics. Moreover, increased recovery of plastics in the NextCycle scenario displaced a total of 135 employees from the disposal processes. The employment generated due to increased recovery and recycling outweighed the employment lost outside of Michigan due to avoided use of virgin resin. The net EOL employment generated in the NextCycle scenario was 1,800 employees/year (Figure 9A) representing a net gain of employment of 38% compared to the base case.
The total EOL revenue generated (Figure 9B) in the Michigan base case was $346 MM/year with 58% of the total associated with disposal-related processes and the remaining 42% with recycling-related processes. Increased state-wide recovery and recycling of these plastics in Michigan for the NextCycle scenario led to increased EOL revenues of $605 MM/year in Michigan with 72% of these associated with recycling-related processes and the remainder 28% with disposal-related processes. However, the revenues generated due to increased recovery and recycling did not outweigh the revenues lost outside of Michigan due to avoided use of virgin resin in Michigan. This resulted in a net loss of -$51 MM/year of EOL revenue in the NextCycle scenario than the base case. Most of the EOL revenue generated in the NextCycle scenario originated from the disposal related processes in Michigan.
The total EOL wages of $70 MM/year were generated (Figure 9C) in the base case with 63% of the total associated with disposal-related processes and the remaining 37% with recycling-related processes. In the NextCycle scenario, a total of $113 MM/year of wages were generated in Michigan. However, about a total of $43 MM/year of wages were lost outside of Michigan due to avoided use of virgin resin in Michigan and displaced disposal-related activities. It still showed a net gain of $73 MM/year (4%) than the base case.
It is important to note that disposal of plastics does not generate any socio-economic benefits further in the supply chain processes, whereas recycling of plastics results in socio-economic benefits due to further processing and manufacturing of plastic products. Moving toward circular economy of plastics due to increased recovery and recycling of plastics showed a shift of employment from a high-capital and low-labor intense processes (e.g., raw material extraction, manufacturing of virgin reins, landfilling/incineration) to low-capital and high-labor intense processes (e.g., collection and recycling; Wiebe et al., 2019; Cimpan et al., 2023; Wiebe et al., 2023). It also reflects the sharing and distribution of the economic benefits among a greater number of people, i.e., more people are experiencing the economic benefits generated due to a circular economy.
The assessment of required changes in the skillset and occupational safety is out of our scope for this study, however, this transition is also believed to affect the required skill sets of the employees losing their jobs and that job-training would be required to support and ease this transition toward a circular economy (Lee et al., 2017; Wiebe et al., 2019, 2023). For example, employees working in the landfill or incineration facilities would require further training and upgrading of their skills. Additionally, there could be a shift from a few numbers of high paying jobs (e.g., fossil based resin production) to a higher number of medium paying jobs in the collection and recycling processes during this transition (Lee et al., 2017; see SI-1 Excel file, ‘NAICS Codes Data_2019’ tab). However, this would further need to be evaluated in future work by including a scenario for advanced/chemical recycling technologies for plastics, which are envisioned to substitute for fossil based plastic resins. While the results presented in our study are limited only to the direct impacts of recovery and mechanical recycling of waste plastics, future work could expand the scope to include indirect and induced impacts along with chemical recycling technologies as well as reuse/remanufacturing of plastic materials.
4 Challenges and data gaps
Considering the large number of published national-level MFA studies, conducting such studies at state level can be challenging due to lack of availability of similar studies and identifying reliable data sources (Hinterberger et al., 2003). There is a lack of data sources for major supply chain processes (e.g., virgin resin production, semi-manufacturing processes) at the state level. Moreover, the EOL material flow data for plastics at the state level is reported either only for a certain plastic product or is aggregated without any distinction at plastic resin code level, unlike at a national level where this data is available. The state-level trade flow data with international countries is available at a granular level of detail e.g., up to 6-digit HTS codes or 4-digit NAICS codes (United States Census Bureau, 2023), however, trade data with other domestic states within the United States are not available at such level of granularity e.g., only up to 2-digit Standard Classification of Transported Goods (SCTG) codes (Oak Ridge National Laboratory, 2023). A more standardized, timely updated, detailed and compiled source of plastics supply chain wide datasets is recommended to conduct such system-wide MFA, and most importantly to track progress toward meeting circular economy goals (Wang et al., 2021).
In terms of the LCA datasets, some of the GHG emission and CED factors used in this study represent the nationwide average LCA impacts due to the data source (e.g., for MRFs, mechanical recycling processes, incineration with energy recovery). However, the electricity grid used for the semi-manufacturing processes, which is the major contributor to total impacts, was updated to reflect the electricity grid mix for Michigan. In terms of the socio-economic indicators, our study only accounted for the direct or process related impacts while neglecting the indirect and induced impacts, which are further linked to the upstream suppliers of the modeled processes and spending of the wages from the employers in the industries. Future work could also explore these indirect and induced effects associated with these processes. It should also be noted that, different studies have different socio-economic factors, which vary depending on the scope and definition of the system boundary, method used (e.g., survey or input–output models), geographic area under consideration, and year of the data. Lastly, the presented analysis could also be conducted at a national level with appropriate LCA and socio-economic factors to evaluate the sustainability of the circular economy in a broader context.
5 Conclusion
The purpose of this study was to understand and evaluate the environmental, economic, and social dimensions of increasing recycling rates of PET and PO plastics in Michigan to meet the overall recycling goal of 45% in Michigan. Our study conducted a state-level systems analysis for PET and PO plastics in Michigan, which integrated LCA and socio-economic indicators with MFA. The study evaluated two LCA indicators, namely, GHG emissions and CED, and three socio-economic indicators, namely, employment, revenues, and wages, for the mentioned plastics supply chain processes. Our study found that recycling of these plastics would need to be more than twice the current recycling rate to achieve the state’s recycling goal.
Overall, increasing recycling rates of these plastics in Michigan led to increased environmental impacts and improved socio-economic benefits due to increased processing of end-of-life plastic materials in Michigan. Reduced consumption of virgin PET and PO plastics led to net savings of GHG emissions and CED impacts due to avoiding the import of virgin resins into Michigan as a result of increased recycling. Moreover, it also led to a net increase in the employment and wages in Michigan, however resulted in a net loss of revenue generation due to avoided use of virgin resin in Michigan. The results from this study could be beneficial for stakeholders including, but not limited to, government, policy makers, and businessmen/investors for investments in recycling infrastructure.
This study has some limitations that can be addressed in future analyses with better-quality and transparent datasets updated in a timely manner to monitor progress toward a circular economy of plastics. Accessible data on domestic or state level import/export trade flows are essential, as are socio-economic (e.g., employment, wages, revenues) data at state and regional levels. These improvements would further guide future state-level plastics systems analyses, and support policy makers and businesses to better understand the regional supply and demand of plastic materials and enable better decision-making on investments in recycling technologies.
Data availability statement
The original contributions presented in the study are included in the article/Supplementary material, further inquiries can be directed to the corresponding author/s.
Author contributions
UC: Conceptualization, Formal analysis, Investigation, Methodology, Validation, Visualization, Writing – original draft, Writing – review & editing. KS: Investigation, Writing – review & editing. BR: Supervision, Writing – review & editing. KM: Supervision, Validation, Writing – review & editing. AJ: Supervision, Validation, Writing – review & editing. DW: Supervision, Writing – review & editing. RH: Supervision, Writing – review & editing. TH: Supervision, Writing – review & editing. DH: Supervision, Writing – review & editing. VT: Supervision, Writing – review & editing. AP: Writing – review & editing. JP: Writing – review & editing. DS: Conceptualization, Funding acquisition, Methodology, Project administration, Resources, Supervision, Validation, Writing – review & editing.
Funding
The author(s) declare that financial support was received for the research, authorship, and/or publication of this article. This material is based upon work supported by the United States Department of Energy’s Office of Energy Efficiency and Renewable Energy (EERE) under the Advanced Manufacturing Office Award Number DE-EE0007897. Additional funding from the Michigan Department of Environment, Great Lakes, and Energy (EGLE) project #MD-R2-04, Grant #22*3113 supported this analysis.
Conflict of interest
AP was employed by Chemstations Inc.
The remaining authors declare that the research was conducted in the absence of any commercial or financial relationships that could be construed as a potential conflict of interest.
Publisher’s note
All claims expressed in this article are solely those of the authors and do not necessarily represent those of their affiliated organizations, or those of the publisher, the editors and the reviewers. Any product that may be evaluated in this article, or claim that may be made by its manufacturer, is not guaranteed or endorsed by the publisher.
Author disclaimer
The views and opinions of authors expressed herein do not necessarily state or reflect those of the United States Government or any agency thereof.
Supplementary material
The Supplementary material for this article can be found online at: https://www.frontiersin.org/articles/10.3389/frsus.2024.1405427/full#supplementary-material
References
Aguilar-Hernandez, G. A., Rodrigues, J. F. D., and Tukker, A. (2021). Macroeconomic, social and environmental impacts of a circular economy up to 2050: a meta-analysis of prospective studies. J. Clean. Prod. 278:123421. doi: 10.1016/j.jclepro.2020.123421
Andreasi Bassi, S., Tonini, D., Saveyn, H., and Astrup, T. F. (2021). Environmental and socioeconomic impacts of poly (ethylene terephthalate) (pet) packaging management strategies in the Eu. Environ. Sci. Technol. 56, 501–511. doi: 10.1021/acs.est.1c00761
Andreoni, V., Saveyn, H. G., and Eder, P. (2015). Polyethylene recycling: waste policy scenario analysis for the Eu-27. J. Environ. Manag. 158, 103–110. doi: 10.1016/j.jenvman.2015.04.036
Anshassi, M., and Townsend, T. G. (2024). Residential recycling in Florida: a case study on costs, environmental impacts, and improvement strategies. Resour. Conserv. Recycl. 206:107627. doi: 10.1016/j.resconrec.2024.107627
Barkhausen, R., Rostek, L., Miao, Z. C., and Zeller, V. (2023). Combinations of material flow analysis and life cycle assessment and their applicability to assess circular economy requirements in Eu product regulations. A systematic literature review. J. Clean. Prod. 407:137017. doi: 10.1016/j.jclepro.2023.137017
Bourtsalas, A. T., Yepes, I. M., and Tian, Y. (2023). Us plastic waste exports: a state-by-state analysis pre-and post-China import ban. J. Environ. Manag. 344:118604. doi: 10.1016/j.jenvman.2023.118604
Brunner, P. H., and Rechberger, H. (2016). Handbook of material flow analysis: For environmental, resource, and waste engineers. Boca Raton, FL: CRC Press.
Canada Plastics Pact. (2021). Canada Plastics Pact Roadmap. Available at: https://roadmap.plasticspact.ca/ (Accessed September 22, 2023).
Chaudhari, U. S., Johnson, A. T., Reck, B. K., Handler, R. M., Thompson, V. S., Hartley, D. S., et al. (2022). Material flow analysis and life cycle assessment of polyethylene terephthalate and polyolefin plastics supply chains in the United States. ACS Sustain. Chem. Eng. 10, 13145–13155. doi: 10.1021/acssuschemeng.2c04004
Chaudhari, U. S., Lin, Y., Thompson, V. S., Handler, R. M., Pearce, J. M., Caneba, G., et al. (2021). Systems analysis approach to polyethylene terephthalate and olefin plastics supply chains in the circular economy: a review of data sets and models. ACS Sustain. Chem. Eng. 9, 7403–7421. doi: 10.1021/acssuschemeng.0c08622
Cimpan, C., Bjelle, E. L., Budzinski, M., Wood, R., and Strømman, A. H. (2023). Effects of circularity interventions in the European plastic packaging sector. Environ. Sci. Technol. 57, 9984–9995. doi: 10.1021/acs.est.2c08202
Closed Loop Partners. (2022). A Data Visualization Tool Identifying Opportunities to Recapture Plastic in the US and Canada. Available at: https://www.closedlooppartners.com/research/us-and-canada-recycling-infrastructure-and-plastic-waste-map/ (Accessed April 24, 2022).
De Sousa, F. D. B. (2021). The role of plastic concerning the sustainable development goals: the literature point of view. Cleaner Responsible Consum. 3:100020. doi: 10.1016/j.clrc.2021.100020
Di, J., Reck, B. K., Miatto, A., and Graedel, T. E. (2021). United States plastics: large flows, short lifetimes, and negligible recycling. Resour. Conserv. Recycl. 167:105440. doi: 10.1016/j.resconrec.2021.105440
Duke University. (2023). Plastics Policy Inventory Search. Available at: https://nicholasinstitute.duke.edu/plastics-policy-inventory/search?policysearch=%22circular%20economy%22&sort_by=field_policy_year&sort_order=Desc&facets_query (Accessed September 22, 2023).
Ecoinvent. (2023). Ecoinvent database. Available at: https://ecoinvent.org/the-ecoinvent-database/.
EGLE RRS. (2019). Michigan Recycling Economic Impact and Recycled Commodities Market Assessment. Available at: https://www.michigan.gov/egle/-/media/Project/Websites/egle/Documents/Programs/Mmd/Recycling/Michigan-Market-Development-Report.pdf (Accessed July 23, 2023).
Ellen MacArthur Foundation (2021). Universal circular economy policy goals: Enabling the transition to scale. Wight, UK: Ellen MacArthur Foundation.
Ellen MacAurthur Foundarion. (2022). The Global Commitment 2022 Progress Report. Available at: https://ellenmacarthurfoundation.org/global-commitment-2022/overview (Accessed September, 21 2023).
Eriksen, M. K., Pivnenko, K., Faraca, G., Boldrin, A., and Astrup, T. F. (2020). Dynamic material flow analysis of pet, Pe, and pp flows in Europe: evaluation of the potential for circular economy. Environ. Sci. Technol. 54, 16166–16175. doi: 10.1021/acs.est.0c03435
European Commission. (2018). Communication from the Commission to the European Parliament, the Council, the European Economic and Social Committee and the Committee of the Regions: A European Strategy for Plastics in a Circular Economy (Com/2018/028 final). Available at: https://eur-lex.europa.eu/legal-content/En/Txt/?qid=1516265440535&uri=Com:2018:28:Fin (Accessed September 22, 2023).
European Environment Agency. (2024) Eea Glossary: Cradle to grave. Available at: https://www.eea.europa.eu/help/glossary/eea-glossary/cradle-to-grave (Accessed April 18 2024).
Ferrão, P., Ribeiro, P., Rodrigues, J., Marques, A., Preto, M., Amaral, M., et al. (2014). Environmental, economic and social costs and benefits of a packaging waste management system: a Portuguese case study. Resour. Conserv. Recycl. 85, 67–78. doi: 10.1016/j.resconrec.2013.10.020
Franklin Associates. (2018). Life cycle impacts for postconsumer recycled resins: Pet, Hdpe, and Pp. Available at: https://plasticsrecycling.org/images/apr/2018-Apr-Recycled-Resin-Report.pdf (Accessed April 23, 2022).
Franklin Associates. (2020a). Cradle-To-Gate Life Cycle Analysis Of High-Density Polyethylene (Hdpe) Resin. Available at: https://www.americanchemistry.com/better-policy-regulation/plastics/resources/cradle-to-gate-life-cycle-analysis-of-high-density-polyethylene-hdpe-resin (Accessed April 23, 2022).
Franklin Associates. (2020b). Cradle-To-Gate Life Cycle Analysis Of Linear Low-Density Polyethylene (Lldpe) Resin. Available: https://www.americanchemistry.com/better-policy-regulation/plastics/resources/cradle-to-gate-life-cycle-analysis-of-linear-low-density-polyethylene-lldpe-resin (Accessed April 23, 2022).
Franklin Associates. (2020c). Cradle-To-Gate Life Cycle Analysis Of Low-Density Polyethylene (Ldpe) Resin. Available at: https://www.americanchemistry.com/better-policy-regulation/plastics/resources/cradle-to-gate-life-cycle-analysis-of-low-density-polyethylene-ldpe-resin (Accessed April 23, 2022).
Franklin Associates. (2021). Cradle-To-Gate Life Cycle Analysis Of Polypropylene (Pp) Resin. Available at: https://www.americanchemistry.com/better-policy-regulation/plastics/resources/cradle-to-gate-life-cycle-analysis-of-polypropylene-pp-resin (Accessed April 23, 2022).
Franklin Associates NAPCOR. (2020). Cradle-To-Resin Life Cycle Analysis of Polyethylene Terephthalate Resin Final Revised Report. Available at: https://napcor.com/wp-content/uploads/2020/05/Final-Revised-Virgin-Pet-Resin-Lca.pdf (Accessed September 29, 2023).
Gavrilescu, D., Seto, B.-C., and Teodosiu, C. (2023). Sustainability analysis of packaging waste management systems: a case study in the Romanian context. J. Clean. Prod. 422:138578. doi: 10.1016/j.jclepro.2023.138578
Geyer, R., Jambeck, J. R., and Law, K. L. (2017). Production, use, and fate of all plastics ever made. Sci. Adv. 3:e1700782. doi: 10.1126/sciadv.1700782
Goldstein, J., and Electris, C. (2011). More Jobs, Less Pollution: Growing the Recycling Economy in the U.S. Available at: https://www.tellus.org/tellus/publication/more-jobs-less-pollution-growing-the-recycling-economy-in-the-u-s (Accessed September 14, 2023).
Gusheva, E., Gjorgievski, V., Grncarovska, T. O., and Markovska, N. (2022). How do waste climate policies contribute to sustainable development? A case study of North Macedonia. J. Clean. Prod. 354:131572. doi: 10.1016/j.jclepro.2022.131572
Harris, S., Martin, M., and Diener, D. (2021). Circularity for circularity’s sake? Scoping review of assessment methods for environmental performance in the circular economy. Sustain. Consum. 26, 172–186. doi: 10.1016/j.spc.2020.09.018
Hinterberger, F., Giljum, S., and Hammer, M. (2003). Material flow accounting and analysis (Mfa): A valuable tool for analyses of society-nature interrelationships. Sustainable Europe Research Institute (Seri), Background Paper, 2.
IBIS World. (2023). US Industry Reports (Naics). Available at: https://my.ibisworld.com/us/en/industry/home (Accessed July 23, 2023).
International Organization for Standardization. (2006a). 14040:2006 Environmental management–Life cycle assessment–Principles and framework. International Organization for Standardization.
International Organization for Standardization. (2006b). 14044:2006 Environmental management–Life cycle assessment–Requirements and guidelines.
Islam, M. T., and Huda, N. (2019). Material flow analysis (Mfa) as a strategic tool in E-waste management: applications, trends and future directions. J. Environ. Manag. 244, 344–361. doi: 10.1016/j.jenvman.2019.05.062
Islam, M. S., Lee, Z., Shaleh, A., and Soo, H. S. (2023). The United Nations environment assembly resolution to end plastic pollution: challenges to effective policy interventions. Environ. Dev. Sustain. 26, 10927–10944. doi: 10.1007/s10668-023-03639-6
Kamczyc, A. (2021). Michigan Egle announces NextCycle recycling initiative. Recycling Today. Available at: https://www.recyclingtoday.com/news/michigan-recycle-initiative/ (Accessed September, 25 2023).
Kan, M., Wang, C., Zhu, B., Chen, W. Q., Liu, Y., Ren, Y., et al. (2023). Seven decades of plastic flows and stocks in the United States and pathways toward zero plastic pollution by 2050. J. Ind. Ecol. 27, 1538–1552. doi: 10.1111/jiec.13427
Karasik, R., Vegh, T., Utz, R., Dominguez, A., Skarjune, M., Merlo, J., et al. (2023). 2023 annual trends in plastics policy: a brief. Nicholas institute for energy, Environment and Sustainability: Duke University.
Krausmann, F., Schandl, H., Eisenmenger, N., Giljum, S., and Jackson, T. (2017). Material flow accounting: measuring global material use for sustainable development. Annu. Rev. Environ. Resour. 42, 647–675. doi: 10.1146/annurev-environ-102016-060726
Lee, P., Sims, E., Bertham, O., Symington, H., Bell, N., Pfaltzgraff, L., et al. (2017). Towards a circular economy: Waste management in the Eu, European Parliament Research Service, European Parliament.
March, A., Roberts, K. P., and Fletcher, S. (2022). A new treaty process offers hope to end plastic pollution. Nat. Rev. Earth Environ. 3, 726–727. doi: 10.1038/s43017-022-00361-1
Michigan Department of Environmental Quality. (2016). Economic impact potential and characterization of municipal solid waste in michigan 2016. Available at: https://www.michigan.gov/-/media/Project/Websites/egle/Documents/Programs/draft/480236-14-Wmsbf-waste-characterization-report.Pdf?rev=ae29ca79e78e4b93861ecc9efc34cd08 (Accessed September 24, 2023).
Milios, L., Esmailzadeh Davani, A., and Yu, Y. (2018). Sustainability impact assessment of increased plastic recycling and future pathways of plastic waste management in Sweden. Recycling 3:33. doi: 10.3390/recycling3030033
NextCycle Michigan. (2021). Gap Analysis 2021 Update. Available at: https://static1.squarespace.com/static/623ba5dc2405f749aa2dc3b1/t/62475e7c7e5efb6fbf15d5b7/1648844418638/2021-Gap-Analysis-Update-Final.pdf (Accessed July 23, 2023).
Nguyen, L., Hsuan, G. Y., and Spatari, S. (2017). Life cycle economic and environmental implications of pristine high density polyethylene and alternative materials in drainage pipe applications. J. Polym. Environ. 25, 925–947. doi: 10.1007/s10924-016-0843-y
Nordic Council of Ministers. (2023). Towards Ending Plastic Pollution by 2040. Available at: https://pub.norden.org/temanord2023-539 (Accessed September 21, 2023).
Oak Ridge National Laboratory. (2023). Freight analysis framework. Oak Ridge National Laboratory (Ornl). Available at: https://faf.ornl.gov/faf5/Default.aspx (Accessed September 25, 2023).
Plastics Europe. (2022). Plastics–the Facts 2022. Available at: https://plasticseurope.org/knowledge-hub/plastics-the-facts-2022-2/ (Accessed September, 21 2023).
PRÉ Sustainability. (2023) SimaPro Version 9.4.0.2. Available at: http://www.pre-sustainability.com/simapro (Accessed July, 23 2023).
RRS Inc. (2023). Clf-Ppp-Prelim: Pet Supply Chain Map. Available at: https://rrsinc.maps.arcgis.com/apps/webappviewer/index.html?id=d0ea03d056934f94949700c63e0302a5 (Accessed September 27, 2023).
RRS NextCycle Michigan. (2021). Reclaimers and Mills: End Market Facility Details Map. Available at: https://nextcyclemichigan.com/end-markets-base-map (Accessed July 23, 2023).
Shonnard, D., Tipaldo, E., Thompson, V., Pearce, J., Caneba, G., and Handler, R. (2019). Systems analysis for pet and olefin polymers in a circular economy. Proc. Cirp 80, 602–606. doi: 10.1016/j.procir.2019.01.072
Stillitano, T., Spada, E., Iofrida, N., Falcone, G., and De Luca, A. I. (2021). Sustainable Agri-food processes and circular economy pathways in a life cycle perspective: state of the art of applicative research. Sustain. For. 13:2472. doi: 10.3390/su13052472
Subal, L., Braunschweig, A., and Hellweg, S. (2024). The relevance of life cycle assessment to decision-making in companies and public authorities. J. Clean. Prod. 435:140520. doi: 10.1016/j.jclepro.2023.140520
The Recycling Partnership. (2024). State of Recycling the Present and Future of Residential Recycling in the U.S. Available at: https://recyclingpartnership.org/residential-recycling-report/ (Accessed January 18, 2024).
United States Bureau of Economic Analysis. (2019a). Sagdp1 State annual gross domestic product (Gdp) summary. Available at: https://apps.bea.gov/iTable/?reqid=99&step=1&acrdn=1#eyJhchbpzci6otksInN0zxbzIjpbmswyoswynswyNiwyNyw0mf0sImRhdgeiOltbIlRhYmxlswqilci1MzEixsxbIk1ham9yqxjlyutlesisIjAixsxbIkxpbmUilcixIl0sWyjtdgf0zsisIjAixsxbIlVuaxrfb2Zftwvhc3VyzsisIkxldmVscyJdlfsitwfwQ29sb3IilcjcruftdgfuzgfyzcjdlfsiblJhbmdlIiwinsjdlfsiwwvhciIsIjIwmtkixsxbIlllyxjczwdpbiIsIi0xIl0sWyjzzwfyrw5kIiwilteixv19 (Accessed September 24, 2023).
United States Bureau of Economic Analysis. (2019b). Sagdp2N Gross domestic product (Gdp) by state 1. Available at: https://apps.bea.gov/iTable/?reqid=99&step=1&acrdn=1#eyJhchbpzci6otksInN0zxbzIjpbmswyoswynswyNiwyNyw0mf0sImRhdgeiOltbIlRhYmxlswqilci1mduixsxbIk1ham9yqxjlyutlesisIjAixsxbIkxpbmUilcizMyJdlfsiU3RhdguilciwIl0sWyjvbml0X29mX01lyxn1cmUilcjmzxzlbhmixsxbIk1hcenvbG9yIiwiQkvbu3RhbmRhcmQixsxbIm5syw5nzsisIjUixsxbIlllyxiilciymde5Il0sWyjzzwfyQmVnaW4ilcitmsjdlfsiwwvhckVuzcisIi0xIl1dfQ (Accessed September 24, 2023).
United States Bureau of Economic Analysis. (2019c). Sagdp2N Gross domestic product (Gdp) by state 1/. Available at: https://apps.bea.gov/iTable/?reqid=99&step=1&acrdn=1#eyJhchbpzci6otksInN0zxbzIjpbmswyncwyoswynswyNiwyNyw0mf0sImRhdgeiOltbIlRhYmxlswqilci1mduixsxbIkNsyxnzawzpY2F0aW9uIiwiTkfjq1MixsxbIlJlywxfvgfibgvfswqilci1mduixsxbIk1ham9yqxjlyutlesisIjAixsxbIkxpbmUilcizMyJdlfsiU3RhdguilciwIl0sWyjvbml0X29mX01lyxn1cmUilcjmzxzlbhmixsxbIk1hcenvbG9yIiwiQkvbu3RhbmRhcmQixsxbIm5syw5nzsisIjUixsxbIlllyxiilciymde5Il0sWyjzzwfyQmVnaW4ilcitmsjdlfsiwwvhckVuzcisIi0xIl1dfQ (Accessed July 23 2023).
United States Census Bureau. (2017). Geographic Area Series: Shipment Characteristics by Naics by Mode by Commodity for the United States: 2017. Available at: https://data.census.gov/table?q=cf1700a24&g=040xx00us26&n=326&tid=Cfsarea2017.Cf1700A24 (Accessed July 23, 2023).
United States Census Bureau. (2020). Quick Facts: Michigan and United States. Available at: https://www.census.gov/quickfacts/fact/table/Mi,Us/Pst045222 (Accessed July 23, 2023).
United States Census Bureau. (2022). 2019 Susb Annual Data Tables by Establishment Industry (Economic Survey, Table Id: Cb1900cbp). Available at: https://www.census.gov/data/tables/2019/econ/susb/2019-susb-annual.html (Accessed July 23, 2023).
United States Census Bureau. (2023). USA Trade. Available at: https://usatrade.census.gov/ (Accessed July 23, 2023).
United States Department of State. (2022). U.S. Actions to Address Plastic Pollution: Fact Sheet, Office of the Spokesperson. Available at: https://www.state.gov/u-s-actions-to-address-plastic-pollution/ (Accessed September 22, 2023).
United States Dot Bureau of Transportation Statistics. (2021). National Transportation Statistics 2021: 50th Anniversary Edition. Available at: https://www.bts.gov/topics/national-transportation-statistics.
United States EIA. (2020). Net generation for electric power, Annual. Available at: https://www.eia.gov/electricity/data/browser/#/topic/0?agg=2,0,1&fuel=vvt9&geo=00004&sec=008&freq=A&start=2001&end=2022&ctype=linechart<ype=pin&rtype=s&maptype=0&rse=0&pin= (Accessed July 23, 2023).
United States EIA. (2023). State Energy Consumption Estimates 1960 Through 2021. Available at: https://www.eia.gov/state/seds/sep_use/notes/use_print.pdf (Accessed September 13, 2023).
United States EPA. (2019a). Documentation for Greenhouse Gas Emission and Energy Factors Used in the Waste Reduction Model (Warm): Management Practices Chapters. Available at: https://www.epa.gov/warm/documentation-chapters-greenhouse-gas-emission-energy-and-economic-factors-used-waste (Accessed April 23, 2022).
United States EPA. (2019b). Greenhouse Gas Inventory Data Explorer: Michigan State. Available at: https://cfpub.epa.gov/ghgdata/inventoryexplorer/#allsectors/allsectors/allgas/gas/all (Accessed July 23, 2023).
United States EPA. (2020a). Advancing Sustainable Materials Management: 2018 Tables and Figures Report. Available at: https://www.epa.gov/facts-and-figures-about-materials-waste-and-recycling/advancing-sustainable-materials-management (Accessed April 23, 2022).
United States EPA. (2020b). Containers, Packaging, and Non-Durable Good Materials Chapters: Documentation Chapters for Greenhouse Gas Emission, Energy and Economic Factors Used in the Waste Reduction Model (Warm). Available at: https://www.epa.gov/warm/documentation-chapters-greenhouse-gas-emission-energy-and-economic-factors-used-waste (Accessed April 24, 2022).
United States EPA (2021). National Recycling Strategy: Part one of a series on building a circular economy for all U.S. Epa Office of Resource Conservation and Recovery.
United States EPA. (2023). Example Local Government Climate Action Plans that Address Materials Management and Waste. Available at: https://www.epa.gov/smm/example-local-government-climate-action-plans-address-materials-management-and-waste (Accessed September 22, 2023).
United States Plastics Pact. (2023). The U.S. Plastics Pact Roadmap to 2025. Available at: https://usplasticspact.org/roadmap/ (Accessed September 22, 2023).
United Nations Environment Programme. (2022). Unea Resolution 5/14 entitled “End plastic pollution: Towards an international legally binding instrument”. Available at: https://wedocs.unep.org/bitstream/handle/20.500.11822/39812/Oewg_Pp_1_Inf_1_Unea%20resolution.pdf (Accessed September 21, 2023).
Wagner, L. A. (2002). Materials in the economy; material flows, scarcity, and the environment. US Geological Survey.
Walker, T. R., Mcguinty, E., Charlebois, S., and Music, J. (2021). Single-use plastic packaging in the Canadian food industry: consumer behavior and perceptions. Humanit. Soc. Sci. Commun. 8, 1–11. doi: 10.1057/s41599-021-00747-4
Wang, C., Liu, Y., Chen, W. Q., Zhu, B., Qu, S., and Xu, M. (2021). Critical review of global plastics stock and flow data. J. Ind. Ecol. 25, 1300–1317. doi: 10.1111/jiec.13125
Wiebe, K. S., Harsdorff, M., Montt, G., Simas, M. S., and Wood, R. (2019). Global circular economy scenario in a multiregional input–output framework. Environ. Sci. Technol. 53, 6362–6373. doi: 10.1021/acs.est.9b01208
Wiebe, K. S., Norstebø, V. S., Aponte, F. R., Simas, M. S., Andersen, T., and Perez-Valdes, G. A. (2023). Circular economy and the triple bottom line in Norway. Circ. Econ. Sustain. 3, 1–33. doi: 10.1007/s43615-021-00138-6
Wilbur, A. (2023). U.S. state and local governments collaborate to reduce plastic pollution, strengthen local economies, and minimize the local burden of recycling plastics. International Council for Local Environmental Initiatives (Iclei). Available at: https://icleiusa.org/u-s-state-and-local-governments-collaborate-to-reduce-plastic-pollution-strengthen-local-economies-and-minimize-the-local-burden-of-recycling-plastics/ (Accessed September 22, 2023).
Zaghdaoui, H., Jaegler, A., Gondran, N., and Montoya-Torres, J. Material flow analysis to evaluate sustainability in supply chains. The 20th world congress of the International Federation of Automatic Control, France. (2017).
Zanghelini, G. M., Cherubini, E., and Soares, S. R. (2018). How multi-criteria decision analysis (Mcda) is aiding life cycle assessment (Lca) in results interpretation. J. Clean. Prod. 172, 609–622. doi: 10.1016/j.jclepro.2017.10.230
Keywords: material flow analysis, state-level, Michigan, plastics, environmental impacts, socio-economic impacts, systems analysis, sustainability
Citation: Chaudhari US, Sedaghatnia K, Reck BK, Maguire K, Johnson AT, Watkins DW, Handler RM, Hossain T, Hartley DS, Thompson VS, Peralta A, Apriesnig JL and Shonnard DR (2024) PET and polyolefin plastics supply chains in Michigan: present and future systems analysis of environmental and socio-economic impacts. Front. Sustain. 5:1405427. doi: 10.3389/frsus.2024.1405427
Edited by:
Elena Cristina Rada, University of Insubria, ItalyReviewed by:
Ramona Giurea, Lucian Blaga University of Sibiu, RomaniaMarco Carnevale Miino, University of Insubria, Italy
Copyright © 2024 Chaudhari, Sedaghatnia, Reck, Maguire, Johnson, Watkins, Handler, Hossain, Hartley, Thompson, Peralta, Apriesnig and Shonnard. This is an open-access article distributed under the terms of the Creative Commons Attribution License (CC BY). The use, distribution or reproduction in other forums is permitted, provided the original author(s) and the copyright owner(s) are credited and that the original publication in this journal is cited, in accordance with accepted academic practice. No use, distribution or reproduction is permitted which does not comply with these terms.
*Correspondence: Utkarsh S. Chaudhari, uschaudh@mtu.edu