Integrated techno-economic and life cycle assessment of hydroformylation in microemulsion systems
 Johannes Wunderlich
  Reinhard Schomäcker
- Institute of Chemistry, Technische Universität Berlin, Berlin, Germany
This paper presents the first integrated techno-economic and life cycle assessment of microemulsion systems being applied for rhodium-catalyzed hydroformylation of long-chain alkenes at industrial scale. The case study describes a projected 150 kt/a production of tridecanal (US gulf coast, 2019). The industrial success of the hydroformylation of short-chain alkenes lies in the continuous recycling of the rhodium-containing water phase. Microemulsion systems can be applied to transfer this concept to long-chain alkenes by overcoming the miscibility gap between the aqueous catalyst phase and the unipolar alkene phase and, moreover, by generating a temperature-induced multi-phase system enabling the immobilization of the catalyst and its continuous recycling, as demonstrated in miniplant operations with dodecene and rhodium/SulfoXantPhos. Customizable simulation models have been developed for scale-up and assessment of the miniplant data. Surprisingly, a profitability-driven sensitivity study indicates a base case optimum at low residence time with low alkene conversion leading to large throughput streams and high raw material purge rates. The comparison to the industrial cobalt-based benchmark system shows an economic advantage regarding net present value (Rh: 68 M$; Co: 62 M$), while about half of the environmental indicators are in favor or equivalent. In a best-case scenario considering zero leaching of expensive rhodium the net present value increases by almost 40% accompanied by a shift to overall lower environmental impacts than the benchmark. In conclusion, the investigated miniplant data suggest microemulsion systems to be competitive when applied in continuous processes at a large scale.
1 Introduction
The global demand for aliphatic alcohols with carbon chain lengths of 11–15 has been increasing for the last decades, with a majority being applied in the detergent industry (MarketsandMarkets, 2024). Industrial production via the so-called oxo-route consists of hydroformylation with subsequent hydrogenation of fossil-based long-chain alkenes. Conventionally, the hydroformylation applies cobalt carbonyl hydride catalysts in a continuous process running under severe conditions and requiring an oxidation step for catalyst separation and recycling (Franke et al., 2012). In contrast, short-chain alkenes allow for a more efficient process concept known as the Ruhrchemie/Rhône-Poulenc process (Franke et al., 2012). In this process, the hydroformylation of propene to butyraldehyde is performed in a two-phase water/oil reaction system which allows for a quantitative separation of the product from the catalyst. Moreover, the immobilization of the highly selective water-soluble rhodium carbonyl hydride/TPPTS catalyst complex in the water phase enables continuous recycling of the active catalyst species. This way, the advantages of both homogenous and heterogenous catalysis are combined.
Recently, this concept has been transferred to the hydroformylation of long-chain alkenes by exploiting the pronounced temperature-dependent phase behavior of microemulsion systems as reaction medium (Schomäcker et al., 2011; Schwarze et al., 2015). Microemulsion systems are ternary systems of water, oil, and a non-ionic surfactant, the phase behavior of which have been extensively described in the literature (Kahlweit et al., 1983; Kahlweit and Strey, 1985; Kahlweit, 1988). Depending on the type of oil and non-ionic surfactant, the relative share of oil in the binary system of water and oil (α), as well as the surfactant concentration γ in the ternary system water, oil, and surfactant (see ESI), the phase behavior can be described using a diagram commonly referred to as “Kahlweit's fish” (Schomäcker et al., 2011). At a given surfactant concentration, an oil-in-water (o/w) microemulsion with a pure oil excess phase, a water-in-oil (w/o) microemulsion with a pure water excess phase, or a surfactant-rich middle phase alongside two pure excess phases of water and oil establish depending on the temperature. The innovative process concept aims at circumventing the transport limitation caused by the miscibility gap between long-chain alkene and water by facilitating micellar-enhanced mass transport between the educt phase and the catalyst-bearing water phase in a reaction step, while subsequently exploiting the temperature-dependent phase behavior of the microemulsion system to withdraw a pure oil phase from a quantitatively recyclable catalyst-bearing mixed- and water phase through simple and cost-effective decantation.
Miniplant development and -operations successfully demonstrated a stable continuous hydroformylation process involving a dodecene-water mixture, synthesis gas, and catalyst complex rhodium/SulfoXantPhos under mild reaction conditions (Illner et al., 2016). Moreover, it was demonstrated that the process can be operated at high yields, high chemo-selectivity toward the aldehyde, high regio-selectivity toward the linear aldehyde, and minimal catalyst leaching (Pogrzeba et al., 2019). The latter is of utmost importance, given that rhodium price is about four magnitudes higher than the cobalt price (roughly 104 $/t of cobalt vs. 108 $/t of rhodium as of March 2023) (Mining.com, 2023). The question remains to what extent catalyst leaching impacts the performance of the novel process concept both economically, and from an ecological point of view.
Generally, solvents are decisive for the reaction performance (Dyson and Jessop, 2016) and the process waste (Roschangar et al., 2017; Sheldon, 2017). Therefore, the selection of suitable solvents regarding harmfulness and sustainability metrics is of utmost importance (Byrne et al., 2016). Water can be considered as naturally benign solvent. Conventional organic chemistry becomes possible in water by applying surfactants that form micelles functioning as nano-reactors (Lipshutz et al., 2016). The application of microemulsions for homogenous catalysis is reported to be beneficial (Fabris et al., 2023) according to the following green chemistry (Anastas and Warner, 2000): benign solvents (water), catalysis, waste prevention (catalyst recycling), and energy efficiency (mild conditions). However, despite the inherent safety and low environmental impacts, the use of water often entails drawbacks caused by the subsequent treatment and workup of hazardous waste water (Blackmond et al., 2007). The wide variety of catalytic reactions performed in water using surfactants as reported in recent literature (La Sorella et al., 2015; Sar et al., 2019; Lippincott et al., 2020; Shen et al., 2021; Ansari et al., 2024) leads to the question, whether microemulsion systems are economically and environmentally viable compared to existing benchmarks.
Looking toward quantitative results to support decision-making, integrated techno-economic assessment (TEA) and life cycle assessment (LCA) (Wunderlich et al., 2021) can be applied already at early stages of technology development. Examples of TEA and LCA in chemical production comprise investigations of super-critical CO2-based reaction systems used for hydroformylation of decene (Xie and Subramaniam, 2014) or of Buchwald-type catalyst complexes as valuable process inputs in fine chemical production (Yaseneva et al., 2016). In the larger context of circular economy, TEA and LCA have been combined to screen various technologies for urban mining of valuable metals from secondary sources (Agrawal et al., 2023), thus highlighting the need for reducing virgin metal consumption. The first integrated TEA and LCA of microemulsion systems applied in small-scale batch production of fine chemicals on the example of Boscalid reveals overall economic and environmental competitiveness (Wunderlich et al., 2024). A complementary study investigating the potential for continuous production of base chemicals at a large scale is missing.
This work focusses on the industrial-scale hydroformylation of dodecene as an example of long-chain alkenes. A first comparative TEA and LCA of a rhodium-based microemulsion system (Rh-MES) to its industrial cobalt-based benchmark system (Co-BMS) is presented. Process simulation is applied using customized scale-up models of validated miniplant data as well as patents which are integrated with cost- and profitability models. Key drivers of economic and environmental hotspots in both alternatives are compared. Additionally, in a Rh-MES best-case scenario the effect of the catalyst leaching rate on process design and overall impacts will be investigated.
2 Methodology
2.1 Process modeling
2.1.1 Process description
The design of Rh-MES reflects validated data of miniplant operations (Müller et al., 2013, 2014, 2015; Rost et al., 2013; Pogrzeba et al., 2015; Illner et al., 2016), see Figure 1A. The miniplant features a continuous stirred tank reactor (CSTR)/decanter section, where the hydroformylation reaction of dodecene under synthesis gas (syngas) takes place in a stirred, quasi-homogenous microemulsion of oil (alkene/product; α = 0.5), water, and surfactant (technical-grade ethoxylated alcohol Marlipal 24/70, Sasol Chemicals; γ = 0.08). This allows for the application of a water-soluble rhodium/SulfoXantPhos catalyst complex with high selectivity toward n-aldehyde under mild reaction conditions (95°C, 15 bar). The catalyst system was established via extensive screenings of catalyst- and ligand concentrations, surfactant candidates, as well as operating conditions, allowing for stable performance at high yield and n/iso-selectivitiy and stable phase separation. Before entering the decanter, the temperature is adjusted so that a three-phase microemulsion system establishes, where fast phase separation is generally observed (tsep, max = 5 min). During separation, the polar catalyst complex accumulates in the surfactant-rich middle phase, and an almost pure oil phase establishes (Müller, 2015; Pogrzeba et al., 2015). Downstream processing has not been part of miniplant operations but will be considered in this work through a flash stage (1 bar) after the decanter to remove dissolved synthesis gas, and a rectification column (0.01 bar) to separate the product (column bottoms) from the remainder of the oil phase (column overhead). Educt, as well as synthesis gas are partly purged at different points in the process, the remainder is re-pressurized and recycled back to the reactor/decanter section.

Figure 1. Simplified flow diagrams of (A) rhodium-based microemulsion system Rh-MES (based on miniplant operation, applying catalyst ligand SulfoXantPhos; SX) and (B) cobalt-based benchmark system Co-BMS (based on BASF patents).
The Co-BMS process information follows a potential version of the hydroformylation process as applied by BASF SE according to scientific literature (Cornils et al., 1980; Bohnen and Cornils, 2002; Frohning et al., 2002; Arpe, 2007) and patents (Appl et al., 1966, 1974; Hohenschutz et al., 1971, 1972; Kniese et al., 1971; Grenacher and Stepp, 1999; Zeller et al., 2001; Lüken et al., 2004), see Figure 1B. The hydroformylation reaction of dodecene with syngas takes place in a continuous reactor setup at comparably harsh conditions (160°C, 280 bar). The active catalyst species is a cobalt carbonyl hydride complex HCo(CO)4 with lower selectivity yielding mixed aldehydes, alcohols, and other side products. The catalyst recycling is achieved via oxidation and reactivation in multiple steps. First, the reactor outlet stream is mixed with an aqueous formic acid solution at pH = 3.5 and air to oxidize the catalyst complex and shift it to the aqueous phase for separation. Then a new cycle of catalyst conditioning is started via chemical reduction which is achieved by stripping the aqueous solution with syngas, achieving a metal carbonylation ratio of 70%. The formed carbonylated HCo(CO)4 is subsequently extracted (up to 80%) into the alkene stream. The remaining organic product phase is distilled (0.04 bar) to yield the aldehyde mixed with valuable alcohol.
2.1.2 Process simulation
Scope of the steady-state flowsheet model development for both Rh-MES and Co-BMS is the hydroformylation of a pure n-dodecene feed stream under syngas to an n-aldehyde product stream. Both processes are modeled and simulated using Aspen Plus V12.1 (AP; Aspen Technology Inc.). The complete flowsheets, as well as the applied component systems with process-specific side products are presented in the electronic supporting information (ESI). In both cases, syngas is supplied at 1.3 times the molar stoichiometric requirement.
For Co-BMS, standard AP modules are used. Reaction stoichiometry and cobalt leaching are implemented according to patents. To prevent the accumulation of side products, purges are applied to recycle streams from the decanter, from the rectification column overhead, and from syngas outlet. Flows of cobalt metal and formic acid (or formate ions) are excluded from AP and separately calculated based on the flowsheet result for subsequent analysis. Cobalt metal losses are estimated as 5 ppm (by weight) leaching into organic decanter outlet (Toetsch et al., 2003) as well as losses contained in the purge fraction of the aqueous decanter outlet (1 wt%), leading to cobalt makeup rates comparable to literature case studies (Xie and Subramaniam, 2014). Side product yields are based on average literature estimates (Hohenschutz et al., 1971; Nienburg et al., 1974; Frohning et al., 2002). The following model compounds are implemented in AP to enable stoichiometric and thermodynamic calculations of side products: n-hexane for light side products (Frohning et al., 2002); C26H52O2 as product from aldol addition (Arpe, 2007) and tridecyl formate as product from esterification for mixed heavy side products (Cornils et al., 1980; Arpe, 2007). Generally, the Peng-Robinson property method is applied for the Co-BMS model, except for the reactor (RStoich reactor model with PC-SAFT property method) and the catalyst extraction column (Soave-Redlich-Kwong method).
For Rh-MES, available model equations from miniplant operations are utilized and implemented in Aspen Custom Modeler (ACM; Aspen Technology Inc.). The applied Rh-MES reactor model features Arrhenius-type reaction kinetics based on a reduced reaction network, as well as required transport properties, as previously published (see ESI; Markert et al., 2013; Kiedorf et al., 2014; Müller, 2015; Hohl, 2019; Pogrzeba et al., 2019; Illner, 2020). Syngas solubility in the reaction mixture is estimated with correlations x = f(p, T, α, X, γ) (Schomäcker et al., 2011; Bardas, 2015; Müller, 2015; Illner, 2020; Kraume et al., 2022). Syngas solubility in the rectification column is modeled using Peng-Robinson property method and elsewhere using the Henry model with coefficients fitted to data from the literature (Vogelpohl et al., 2013, 2014). The decanter model includes previously published correlations T = f(α, X, γ) to estimate the temperature range where the 3-phase state of the microemulsion establishes (Müller, 2015). Water content of the oil phase is modeled based on a UNIFAC model for the binary system water/oil; surfactant concentration in the binary system is calculated using weighted temperature-dependent correlations for the critical micelles concentration (CMC) of the respective pure systems (Illner, 2020). During miniplant operations, rhodium concentrations of up to 0.1 ppm (by weight) were observed in the oil phase during continuous operation. In most samples, however, rhodium was below the detectability limit (Illner et al., 2016). Therefore, rhodium decanter leaching is implemented as a hard-coded design specification, with the base assumption that rhodium pure metal concentration in the organic phase represents just the maximum of 0.1 ppm, so that the mass fraction of the rhodium precursor molecule with respect to the total reaction mass is specified as in the model. This will allow for a sensitivity study regarding the impact of this important value on process performance. Ligand leaching is calculated from that using the specified initial molar ligand-to-precursor ratio (4:1), and oil concentrations with relative shares equal to the respective shares at the decanter inlet. The initial feed concentration used to initialize the flowsheet is provided in the ESI according to data from Pogrzeba et al. (2019). The reactor-decanter section is implemented using the effective residence time τeff, as opposed to the reactor residence time τR (Illner, 2020). A detailed account of the implementation is provided in the ESI. AP simulation results of the n-tridecanal yield in the reactor-decanter section shows good agreement to the results from miniplant operations (Figure 2; no recycling from the rectification column considered).
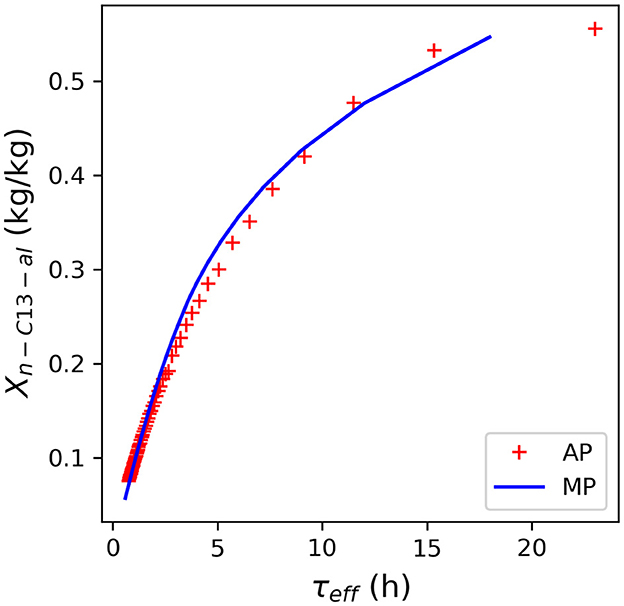
Figure 2. Comparison of the mass-based yield of n-tridecanal as a function of the effective residence time (τeff) as calculated with the implemented Rh-MES Aspen Plus (AP) model. No alkene recycling from the column is considered in this case. The AP model results show good agreement with experimental miniplant data (Illner, 2020).
In both flowsheets, vacuum rectification is modeled using RadFrac blocks (Peng-Robinson property method). Sensitivity studies are carried out to establish suitable column specifications (see ESI). Feed conditions are adjusted to feed stage conditions. No further stage efficiencies are considered.
Pressure-change equipment for explicit pressure change operations is modeled using AP Pump and multistage-compressor (MCompr) blocks. Multistage compression is carried out with a maximum of three stages, using equal pressure ratio and cooling to either 35°C or ~5 K above the dew point if condensation would otherwise occur. For the high-pressure section of the Co-BMS process, the positive-displacement type is applied for both the pump- and the compressor models (90% efficiency). All other items are assumed to be of the centrifugal type (75% efficiency). Apart from the rectification columns, all equipment- and line pressure drops are neglected.
Heat exchangers are implemented in AP as Heater-, or HeatX blocks, the latter if partial condensation must be considered. Based on the simulation results, minimum energy requirement (MER) targeting is carried out (ΔTmin = 10 K) using Aspen Energy Analyzer (Aspen Technology Inc.). Heat transfer tasks with are neglected in both cases to reduce complexity. MER heat exchanger networks (HEN) are built based on the results and subsequently relaxed, if required, to a point where no loops remain in the network. No further optimization with respect to ΔTmin or the total number of units is carried out.
2.1.3 Equipment sizing and costing
Bare module cost functions are taken from engineering literature (Seider, 2010; Couper, 2012). Equipment delivery (10% of inflation-adjusted equipment cost) and installation is considered with costing multiples (Towler and Sinnott, 2013).
Pressure vessels are generally approximated as hollow cylinders with flat hats. It is generally assumed H/D = 3 (H: Overall vessel height; D: Overall vessel diameter). Wall thickness is calculated using the ASME Boiler and Pressure Vessel Code (BPVC) for a design pressure including a safety allowance of 2 mm for all vessels (American Society of Mechanical Engineers, 2019). Reactors are modeled as CSTR operated at 70% level, where the reaction phase includes the liquid phase and a gaseous hold-up calculated from a correlation (Pangarkar, 2015). The maximum total vessel volume is fixed at 100 m3. As material of construction for the reactors, high-strength vanadium-reinforced low-alloy steel SA-542 D-4a is selected for both processes. Maximum allowable stress values (S) are taken from BPVC Section II, Part D, Table 5A (Co-BMS) and Table 1A (Rh-MES), the underlying assumption here being that the Co-BMS reaction vessels are engineered according to Section VIII Div. 2 of the code (special provisions for very high pressures), whereas the vessels for the Rh-MES process are engineered according to Section VIII Div. 1. This allows for higher S values for the Co-BMS reactors and, consequently, lower required wall thicknesses. The likely increase in engineering costs for Co-BMS resulting from this will not be quantified at this point. In Co-BMS, the columns for the pre-carbonylation and catalyst extraction are filled with activated carbon and metal rings, respectively. Reactor sizing (gassed, stirred pressure vessels with internal cooling coils for heat transfer) is carried out according to literature approaches (Kraume, 2003; VDI Heat Atlas, 2010). A simplified approach based on a rule of thumb (Couper, 2012) was however taken to calculate power input at this point (0.3 kW/m3 for a homogenous reaction with heat transfer). For Rh-MES, decanter residence time is fixed at τD = 0.25 h (i.e., 3tsep, max).
Both processes feature a packed vacuum rectification column. Rh-MES uses a vacuum steam jet ejector and a decanter drum, given that only long-chain alkene and alkane are present in the column overhead. Co-BMS uses a 2-stage compressor to create the vacuum and to compress the stream containing light side products. Both columns are designed with structured packing as internals, with packing properties (HETP = 0.25, F = 4Pa0.5) taken from a packing data sheet, where HETP is the packing height per theoretical plate as specified in the RadFrac model, and F is the fluid factor used to calculate the required column diameter for a given vapor flow rate at a given flowsheet solution (Sulzer Chemtech Ltd, 2023). No column sections are considered, constant column diameters are calculated with the largest occurring vapor volume flow from RadFrac simulation results. In both cases, the total column height includes all usual allowances.
As for heat transfer equipment, counter-current shell-and-tube heat exchangers are considered, except for the reboilers, where a kettle reboiler is considered and a different equipment cost function is applied. Of the sets of heat exchangers resulting from the HEN designs, those with a calculated heat exchange area A < 11.6m2 (125 ft2) are neglected, given that the applied cost function cannot be meaningfully extrapolated to smaller values. Streams with a higher pressure and/or with a higher tendency to fouling are allocated to the tube-side of the heat exchangers, and a pressure correction factor is considered in the cost function when p > 6.9bar (100 psi) on the heat exchanger shell side (Seider, 2010). No rigorous heat exchanger design is carried out at this point, but overall heat transfer coefficients U are taken from the literature and linearly adapted, if need be, based on the aggregate mass fractions of water and oily components in the heat transfer media at hand (Towler and Sinnott, 2013). Heat removal from the reactors is realized with internal cooling coils in both processes, the cost of which is assumed to be reflected in the applied installation factors. All heat exchangers are assumed to be made of stainless steel.
For feed-pumps to the high-pressure section of Co-BMS, cost functions for reciprocating plunger pumps are considered, all other pumps are costed with a cost function for centrifugal pumps. Except for the water circulation pumps in the catalyst section of Co-BMS, explosion-proof enclosures are considered, and the number of required pumps for a specific task is doubled for redundancy. Pumps with calculated break power PB < 1 kW are neglected.
2.1.4 Integration of Aspen Custom Models
All ACM are initially created with the web-based modeling tool MOSAIC using a workflow that allows for exporting a set of model equations to the ACM environment (Merchan et al., 2014, 2016; Penteado, 2015), and subsequently manually adapted.
Figure 3 schematically shows the connection of the cost- and profitability ACM with the AP flowsheet model of Rh-MES that allows for performing economic sensitivity studies. The cost- and profitability ACM accommodates all equipment cost functions, intermediate cost indicators (total capital investment TCI; total product cost TPC), as well as final profitability indicators, i.e., net present value (NPV) and self-cost (SC). All information required to assess the model for a given steady-state flowsheet solution is imported from AP flowsheet variables (blocks or streams) through calculator blocks. All customized unit operation models are connected to the flowsheet through usual AP material streams.
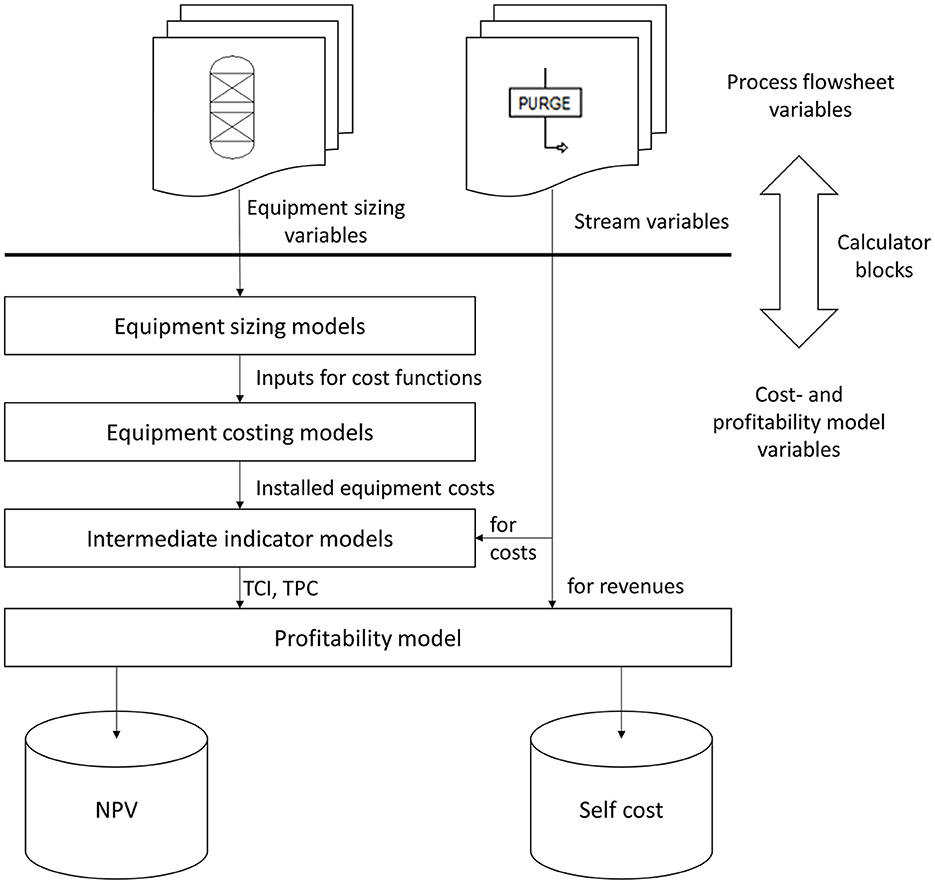
Figure 3. Concept for connecting Aspen Plus flow sheet variables with Aspen Custom models for equipment sizing, cost, and profitability calculations.
2.1.5 Base case identification for Rh-MES
As the applied ACM allows for evaluating the influence of process parameters on economic indicators, a sensitivity study is carried out to identify the base case of the Rh-MES process model. Multiple simulations are run with variations of effective residence time and purge fraction (τeff, PF) to find an optimal configuration of stream and equipment parameters resulting in a maximum NPV. The effective residence time is the ratio of reactor volume plus decanter volume to volume flow of the feed mixture.
2.2 Integrated assessment
2.2.1 Goal and scope
For the integrated TEA and LCA, a research and development perspective (Zimmermann et al., 2020a) is followed. The target audience is practitioners from academia and industry investigating alternative solvent systems. The overall data availability indicates mid-technology readiness levels (TRL) (Buchner et al., 2019; Zimmermann et al., 2020b). The focus lies on supporting further process development of Rh-MES by identifying potential economic and environmental key factors linked to the process design and comparing findings to the industrial benchmark Co-BMS.
Both TEA and LCA are limited to the same cradle-to-gate system boundaries. Cost- and profitability analysis follows standard engineering approaches. Life cycle assessment is generally in line with the ISO 14,044 method. The selected life cycle impact assessment (LCIA) method is Recipe 2016 v11 (midpoint level, hierarchist perspective).
The basic economic and environmental assumptions are identical for both process concepts. The assumed plant is erected at the US Gulf Cost connected to a chemical production infrastructure with access to feedstocks and the US market. Plant lifetime is scheduled to be 15 years with annual plant availability of 95% (8,322 h/a). The base year is 2019 and the currency is US$. The production capacity of tridecanal as an isomeric mixture is 150 kt/a contained in a product stream with a minimum purity of 94 wt%, meaning the actual plant capacity is larger than 150 kt/a. NPV is based on plant capacity whereas the functional unit for self-cost and LCIA indicators is 1 kg tridecanal.
The process alternatives vary in the generated amounts of valuable side-products, i.e., long chain alcohol tridecanol is assumed to be only produced in Co-BMS. Downstream separation of alcohol as well as further conversion of aldehyde is excluded from the system boundaries. Therefore, economic allocation based on revenue is applied in Co-BMS to split the burdens between tridecanal and tridecanol.
Valuable purge fractions of the column overhead are treated as diesel substitutes outside the system boundaries and are therefore assigned negative costs or negative environmental impacts (credits, according to the avoided burden approach). Treatment of the purged gaseous column overhead from Co-BMS (i.e., hexane with water) is excluded from the system boundaries for simplification, assuming no net avoided burden due to similar credits from the substitute process (i.e., thermal energy from natural gas) compared to the internal incineration with heat recovery.
2.2.2 Inventory
Material and energy flows are calculated within the process simulations based on reaction stoichiometry and kinetic models. Initial fillings of materials are estimated based on the defined stream concentrations and the volumes of reactors and vessels. The material output flows are product streams, gaseous and liquid purges as well as aqueous waste streams.
Prices for the calculation of cost and revenue streams are derived from market analysis or standard engineering literature and adapted to 2019 via index-based cost transformation (CEPCI) evaluation (Seider, 2010; Lozowski, 2021). A list of assumed prices for key raw materials and utilities as well as sales prices for products is presented in Table 1. Cost streams are constituted of all capital and operational expenditures. Revenue streams result from sales of main and side products, valuable purge streams, and recovered catalyst metal.
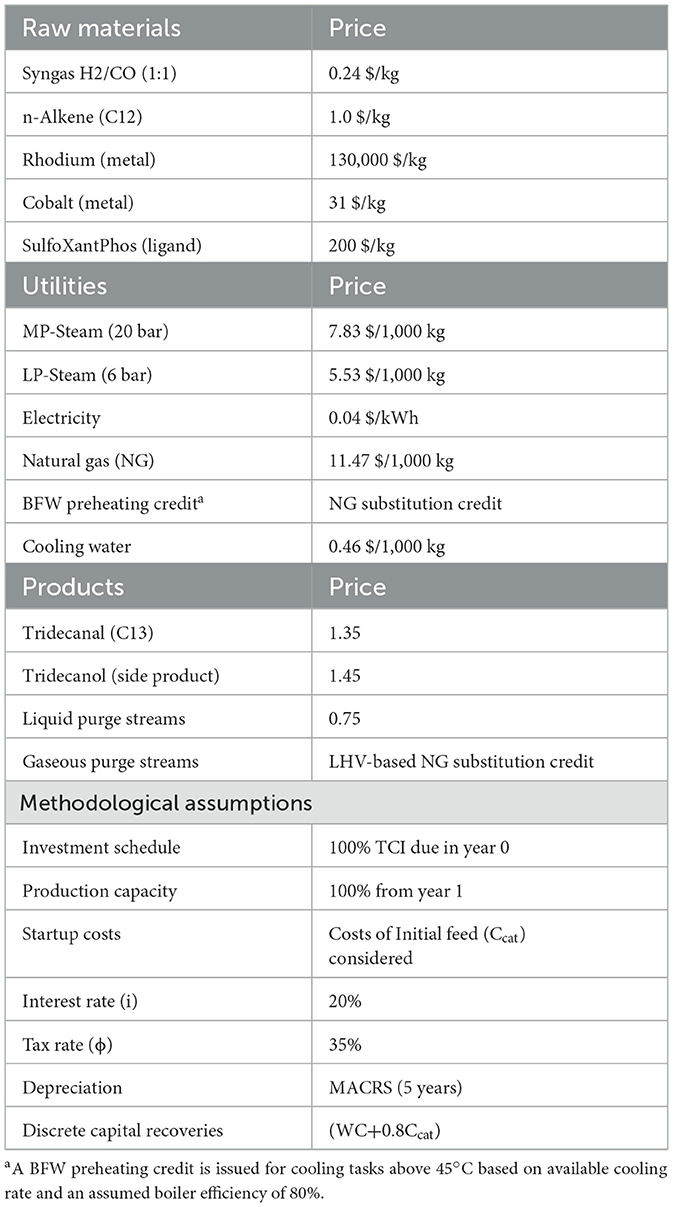
Table 1. TEA assumptions and prices (2019).
Applied utilities comprise mid- and low-pressure steam (MP/LP steam) for heating, and boiler feedwater (BFW) and cooling water (CW) for cooling, respectively. BFW preheating credit is only issued for cooling tasks above 45°C. Steam prices are calculated in a combined heat and power model based on natural gas price (Towler and Sinnott, 2013); the electricity price is calculated so that the marginal cost of a complete boiler feedwater cycle is zero (see ESI for additional information).
Regionalized life cycle inventory datasets on a cradle-to-gate basis for material, utility, and waste treatment flows are drawn from the LCA databases GaBi Professional 2019 and Ecoinvent v3.6. Aqueous output flows are considered as aqueous waste for incineration. Due to the lack of specific datasets for the salts of the catalyst precursors, the average dataset for the contained metal is used as approximation. Furthermore, the production of equipment is excluded from the LCA system boundaries only, due to contributions below the threshold of 1% of impact. 2% of cooling water consumption is considered as make-up for evaporation losses. Credits for remaining catalyst metal after plant life are not considered in the LCA due to a lack of recycling process datasets.
2.2.3 Indicators
To highlight the difference between Co-BMS and Rh-MES from a technical perspective, turnover Frequency (TOF; Eq. 1.1) and the annual catalyst makeup ratio (CMR; Eq. 1.2) are used as technical indicators. Moreover, educt conversion, aldehyde yield and n:iso selectivity with respect to the aldehydes are considered. TOF describes the amount of product generated in the reaction volume with respect to the amount of catalyst NRh(acac)(CO)2present in the reaction volume VR per unit of time (Hagen, 2015):
The catalyst makeup ratio is calculated from the annual catalyst makeup ṄRh(acac)(CO)2 with respect to the catalyst inventory of the process NRh(acac)(CO)2:
For economic evaluation, the net present value (NPV) is considered a key profitability indicator that accounts for the time value of money (Eq. 1.3). From an exclusively economic point of view, an investment alternative with a higher NPV is preferred over a project with a lower NPV. In Eq. 1.3, CFnet, j is the net operational cash flow in year j of the project lifetime N, and TCI is the total capital investment. TCI is estimated according to literature methods (Towler and Sinnott, 2013). It includes FCI (i.e., inside battery limit-, design and engineering-, and offsite plant costs), and the costs for the catalyst inventory that is assumed depreciable (Ccat). Ccat is displayed explicitly here to highlight the different impact on total invested capital for both process alternatives that results from the expected large difference in catalyst costs. RECj is the capital recovery from the project in year j. Working capital (WC) is estimated as 5-week cash equivalent of total OPEX. PWFj is the discount factor that applies for year j, calculated as .
The annual net cash flow CFnet, j is estimated using the MACRS depreciation schedule and taxes with parameters given in Table 1 (Peters et al., 2004). Besides the NPV, the approximate product self-cost (SC) is calculated as a TEA indicator using the annualized capital charge method (ACC; Eq. 1.4) (Towler and Sinnott, 2013). SC is a rough measure of the minimum unit selling price that must be achieved to earn the sum of annualized CAPEX (including an appropriate investment return) and total product cost. In Eq. 1.4, ACCR is the annualized capital charge ratio. As for capital expenses that are partly recovered at the end of the project lifetime, only the difference in the present value of associated financial transactions in the years j = 0 and j = N, respectively, is annualized.
For LCA, environmental impacts are analyzed using 17 LCIA indicators following ReCiPe 2016 method as implemented in GaBi Software. The LCIA indicator GWP including biogenic CO2 emissions is selected to enable a meaningful comparison to alternative routes using biobased feedstocks.
3 Results and discussion
3.1 Technical results
Simulation-based mass flows are depicted in Table 2 for Rh-MES and in Table 3 for Co-BMS. Two mass balances are presented for Co-BMS to account for the systems before and after allocation. The allocated balance will be referred to in the following comparisons.
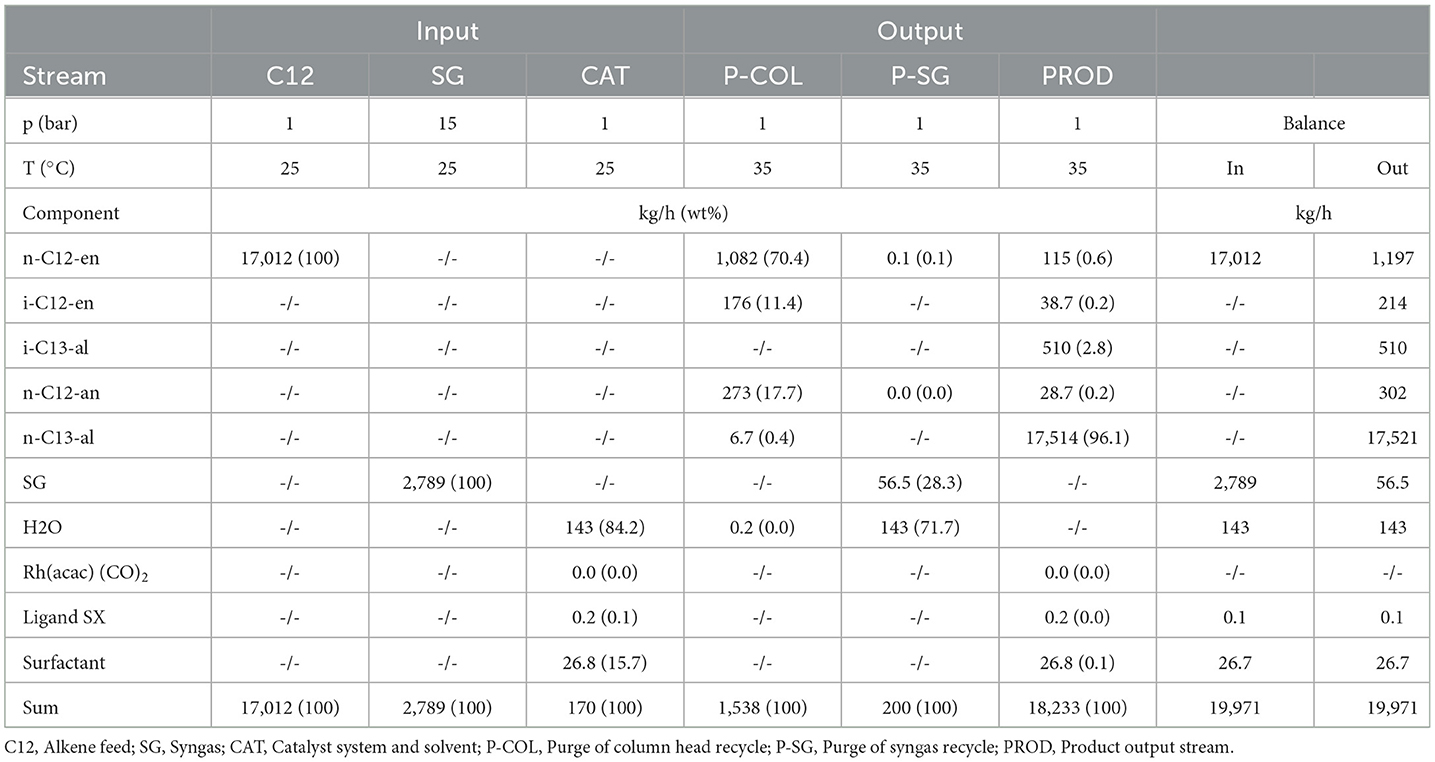
Table 2. Component mass balances for Rh-MES.
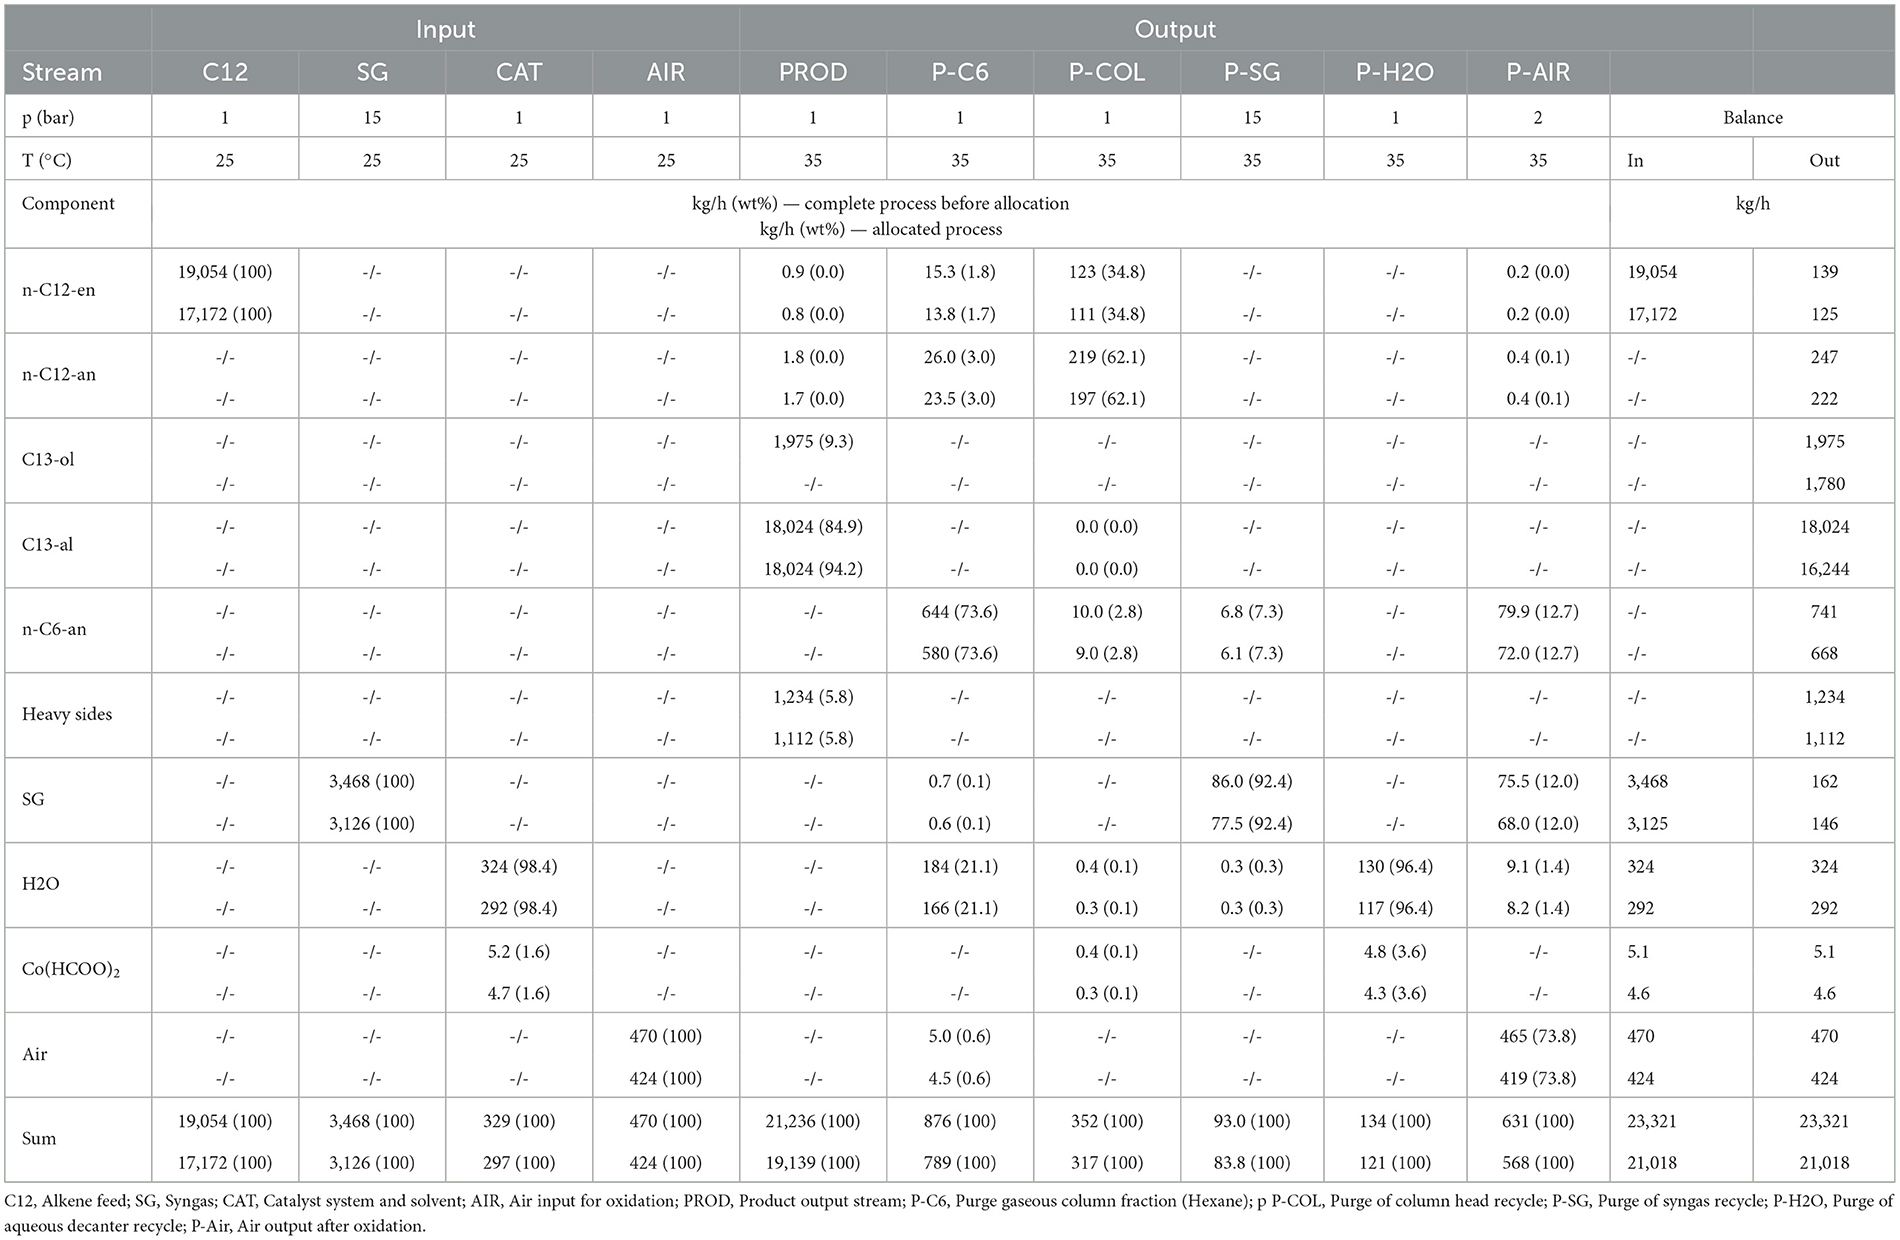
Table 3. Component mass balances for Co-BMS.
Mass flows of fresh alkene input and aldehyde in the product stream are nearly identical in both processes. Co-BMS shows an alkene conversion in the reactor of 88%, an aldehyde yield of 72%, and a residence time of 5 h. In contrast, Rh-MES operates at an effective residence time τeff = 7.5 h (reactor residence time τR= 4.5 h) with alkene conversion of 27% and high aldehyde selectivity (97%; n:iso = 34:1). Reasons for additional alkene make-up are conversion to side products and losses in purge fractions. Here, the processes show opposite trends. The product output stream in Rh-MES contains only 1 wt% side products, whereas in Co-BMS it contains nearly 6% heavy side products. In contrast, Rh-MES shows five times higher organic purge flows, containing about 80% alkene and 20% alkane.
Overall, the applied molar ratio of catalyst to alkene is five magnitudes higher for Co-BMS (1.43 · 101 mol/mol) than for Rh-MES (6.44 · 10−4 mol/mol), indicating much lower catalytic efficiencies in the benchmark process, which is also reflected by a lower TOF of roughly 10/h for Co-BMS vs. about 80/h for Rh-MES. The value for Rh-MES deviates from previously reported laboratory results (about 400/h) (Pogrzeba et al., 2019), assumingly due to by-product accumulation that leads to decreased reaction rates in the scale-up scenario. In terms of annual catalyst makeup, the processes vary by three orders of magnitude in favor of Rh-MES. Co-BMS catalyst losses after the reactor due to leaching and purge are about 2 wt% of catalyst input to the reactor, which is in line with estimations in literature (Xie and Subramaniam, 2014). This equals a CMR of around 20 replacements of the initial catalyst inventory per year. In Rh-MES the applied catalyst is much more efficient with a loss rate of 0.03% with respect to the catalyst feed to the reactor (CMR = 0.4/a).
The applied microemulsion technology leads to clearly different demands in terms of equipment and utilities compared to the benchmark (see ESI for details). While reaction conditions appear more efficient and comparatively mild in Rh-MES, drawbacks are introduced due to large recycle streams of unreacted raw material, and the aqueous catalyst phase. 17 reactors (V = 100 m3; wall thickness t = 27 mm) are required for Rh-MES, whereas Co-BMS is assumed to deploy four thick-walled high-pressure reactors (V = 100 m3; t = 260 mm). Similar differences become evident comparing the rectification column results (Rh-MES: 10 stages, V = 109 m3; Co-BMS: 20 stages, V = 22 m3). Although decanter dimensions are a magnitude smaller in Co-BMS (V = 9 m3) compared to Rh-MES (V = 98 m3), additional, partly high-pressure, vessels for catalyst preparation, extraction and oxidation are needed in Co-BMS.
The high pressure required for Co-BMS is reflected by four multistage compressors (pel = 1,018 kW) and two large pumps (pel = 417 kW), whereas Rh-MES benefits from operations at lower pressure needing one multistage compressor (pel = 162 kW) and four pumps (pel = 43 kW).
As for heat transfer equipment, Figure 4 shows the results of the pinch point analysis (ΔTmin = 10 K). Heat transfer tasks with are neglected for HEN targeting. Minimum energy requirements (MER) targets differ considerably, putting Rh-MES at a disadvantage due to the much higher rectification column throughput that results from lower alkene conversion. To satisfy minimum hot utility requirements (HUmin) in the MER case, Co-BMS requires 1.8 MW of MP steam at 190°C, whereas Rh-MES requires a total of 6.4 MW of LP steam at 156°C and around 105°C. The right column in Figure 4 also shows the hot and cold composite curves, where the overlapping areas indicate that 4.7 MW can be recovered internally in the Co-BMS case, covering around 72% of the total required heating (Rh-MES: 4.4 MW or 40%). The minimum cold utility requirement (CUmin) is 7.9 MW for Co-BMS, of which around 1.4 MW is CW required for the rectification column condenser (Rh-MES: CUmin = 10.2 MW; ). Neglecting residual CW required for cooling below 45°C, the approximate remainder of the required minimum cold utility (Co-BMS: 6.5 MW; Rh-MES: 4.3 MW) is available for BFW preheating at T > 45°C. HEN design yields a MER network comprising 23 units for the Co-BMS case, of which 7 units are neglected (A < 125 ft2). In the Rh-MES case, it is ∑CPh < ∑CPc at the pinch point, given that splitting of the available heat flow from the reactor is ruled out for operability reasons. Consequently, no MER design can be obtained. The final Rh-MES HEN design comprises 17 units (of which 6 are neglected). It requires 7.5 MW of hot utility (117% of the target) and 11.3 MW of cold utility (111% of the target).
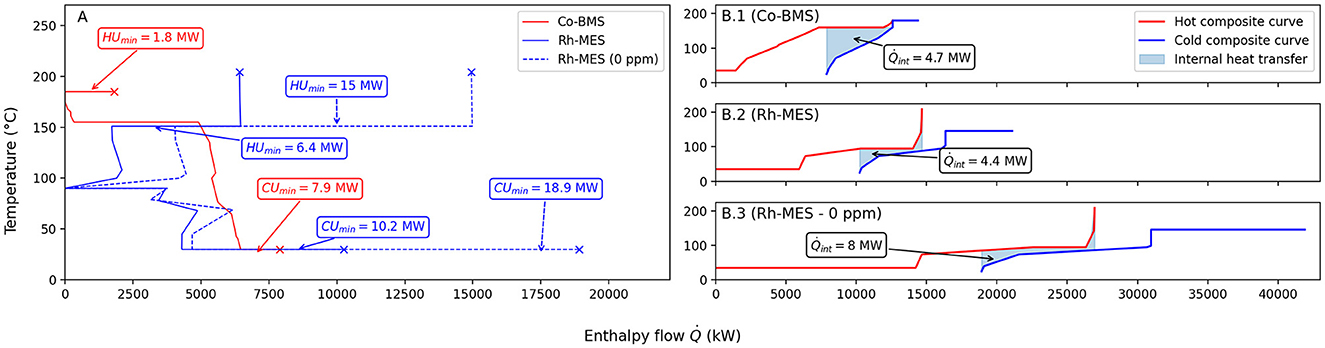
Figure 4. Results of MER-targeting (ΔTmin = 10 K). The grand composite curves (A), as well as the hot- and cold composite curves of both process alternatives (B1–B3), exhibit large differences in minimum hot utility (HU) and cold utility (CU) requirements that result primarily from higher flows to the rectification column due to lower conversion in the Rh-MES case. In the Co-BMS MER case, 4.7 MW or 72% of the total required heating in the process can be provided through internal heat transfer (Rh-MES: 4.4 MW or 40%).
3.2 Integrated assessment
3.2.1 Techno-economic assessment
NPV is selected as the leading economic indicator. Cost and profitability contributions will be analyzed regarding CAPEX (i.e., TCI), OPEX (i.e., TPC), and net annual cashflow.
Inside battery limit (ISBL) cost of equipment for Rh-MES (21.2 M$) is roughly two-thirds of the ISBL cost of Co-BMS (30.5 M$), as depicted in Figure 5, top. In both cases, reactor costs are almost similar and dominating within ISBL. While for Rh-MES these are due to the high number of reactors, for Co-BMS these are due to the larger steel mass of fewer high-pressure reactors. High-pressure operations in Co-BMS cause large costs of pumps and compressors, whereas in Rh-MES their costs are negligible. Additional pressure vessels for catalyst conditioning are exclusive for Co-BMS and cause significant costs. In contrast, the rectification column causes comparably high costs in Rh-MES only, which is due to an increased vessel size needed for separating much larger oil flows. Heat exchangers contribute similarly to ISBL of both processes.
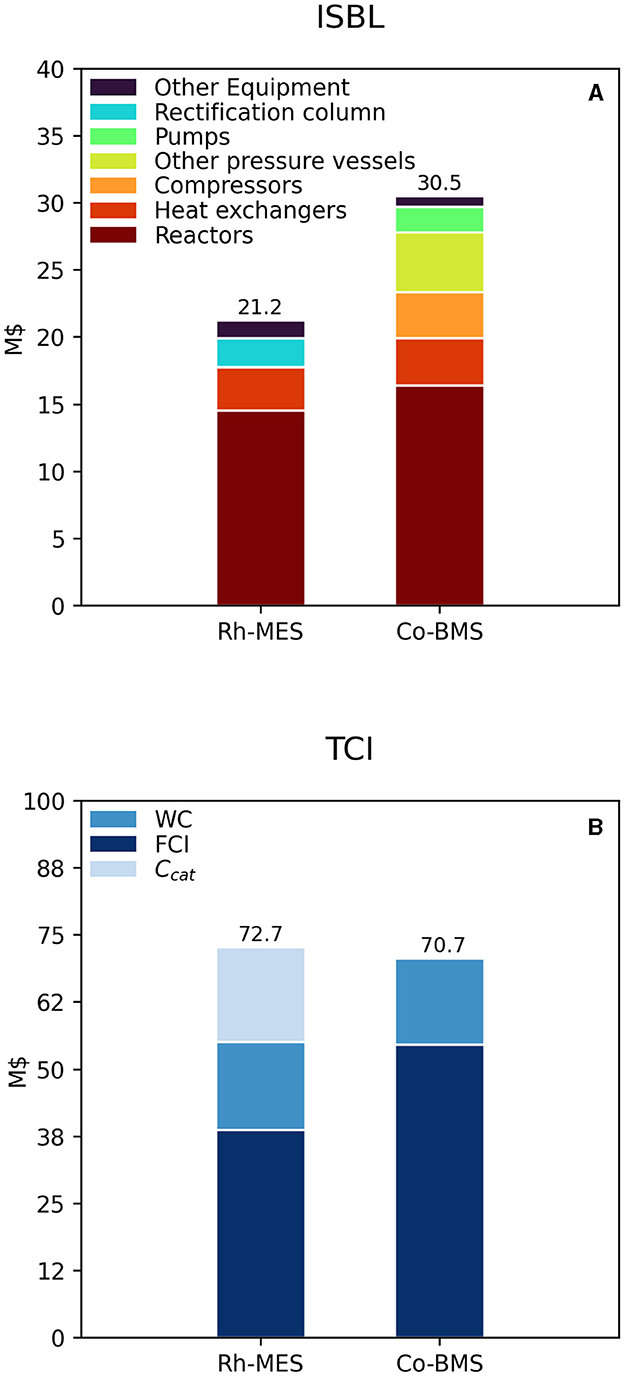
Figure 5. Estimated total ISBL cost (A) and TCI requirement (B) for both process alternatives. Installed rectification column costs do not include installed reboiler and condenser costs, those are included with the line item “Heat exchangers”.
After adding WC (working capital) and Ccat (initial catalyst inventory costs) to FCI both processes show similar TCI with Rh-MES resulting in a slightly higher value (Figure 5, bottom). This is caused by the large difference in Ccat of three orders of magnitude in Rh-MES, thereby reflecting substantially higher rhodium prices. Hence, in terms of CAPEX, no alternative is significantly advantageous.
TPC is 6% higher in Rh-MES with direct OPEX being the dominant contribution in both processes, see Figure 6. Direct OPEX is driven by alkene as a raw material input. While Rh-MES displays 1% lower alkene costs and 11% lower syngas cost, the rhodium catalyst make-up costs are decisively higher, meaning, cobalt causes only a fraction (7%) of the rhodium catalyst cost. Net utility costs are effectively the same in both processes with overall contributions of < 1% to TPC (0.2 M$). As observed for CAPEX, pressure change equipment dominates utility costs in the Co-BMS, whereas Rh-MES utility costs are dominated by rectification column operations (sum of reboiler and condenser OPEX in Figure 6). Net OPEX from heat exchangers excluding reboiler and condenser is negative, which is due to the large BFW preheating credit issued for the heat of reaction released by the reactors at elevated temperature levels. The observed disadvantage of Rh-MES with regards to TPC is partly due to the high rhodium catalyst costs which is in alignment with the CAPEX analysis above.

Figure 6. Direct and indirect OPEX contributions (A: Utility costs; B: Raw material costs; C: Total Product Cost TPC) for both process alternatives. (A) Boiler feedwater preheating credits are depicted as negative expenditure (revenue), the dotted line represents total net utility related direct OPEX. Symbols: A, Reactors; B, Reboiler/condenser; C, Pumps; D, Compressors; E, Net other heat exchangers; I, Cooling water; II, LP steam; III, MP steam; IV, Electricity; V, Boiler feedwater preheating credit. Middle: Other raw materials include all annual makeup costs for the respective catalyst systems.
NPV is roughly 10% higher in Rh-MES (68 M$) compared to Co-BMS (62 M$), even though product self-costs (SC) are higher for Rh-MES (1.24 $/kg aldehyde) than for Co-BMS (1.21 $/kg aldehyde). Hence, Rh-MES is economically favorable due to higher profitability considering discounted cash flows over the lifetime of 15 years, as depicted in Figure 7. The break-even point is reached after 2 years of operation in both cases. Despite revealing disadvantages on the cost side in terms of higher TCI and TPC, Rh-MES benefits from higher revenue streams. Revenues of the product stream are identical in both processes considering 150 kt aldehyde. However, as side products mainly leave the Rh-MES system boundary via purge streams instead of the product stream, generated revenue streams from purge are 3.5 times higher than in Co-BMS which accounts for a substantial amount of heavy side products in the product stream, not yielding any revenue. Although rhodium recovery after plant life results in higher absolute revenues than cobalt recovery, the difference in discounted cash flows is not significantly influencing NPV.
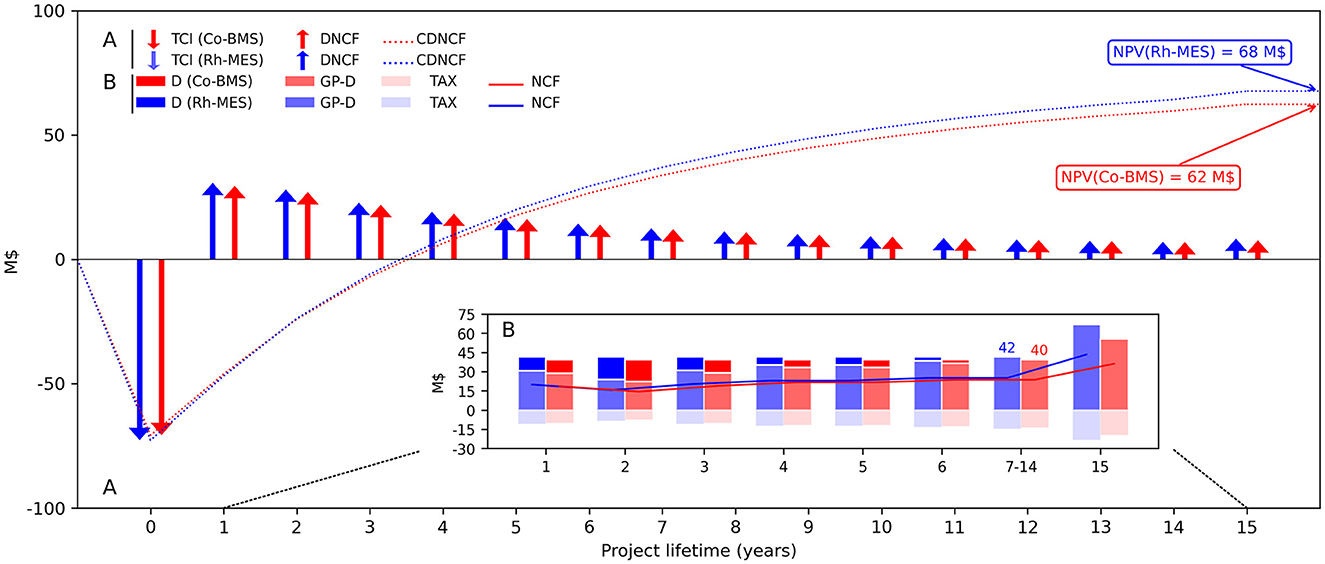
Figure 7. (A) Total capital investments (TCI) and cumulated discounted net cash flows (CDNCF) during the project lifetime and resulting NPV for both project alternatives and (B) a detailed account of occurring undiscounted annual financial transactions. In both cases, the terminal year (year 15) includes additional revenue from catalyst metal recoveries. NCF, Net cash flow; DNCF, Discounted NCF; D, Depreciation; GP, Gross profit; TAX, tax.
To better understand the complexity of how costs and revenues in Rh-MES are influenced by certain process parameters, a sensitivity study was carried out. The two variables τeff (effective residence time) and PF (purge fraction) are varied to identify an optimal setting regarding NPV. Further operation conditions like pressure (15 bar), temperature (95°C), catalyst concentration, and metal-to-ligand ratio were taken as the optimal parameters for the investigated system from literature (Pogrzeba et al., 2019). Figure 8 shows heat maps of the main economic indicators as a grid of (τeff, PF). FCI exhibits higher values at higher τeff and lower PF. Higher τeff leads to larger required reaction volumes which in turn increases total reactor costs as well as an increase in expensive rhodium catalyst inventory (Ccat). Lower PF leads to increasing accumulation levels of the undesired by-product n-alkane, diminishing the concentration of the primary product. Here, reactor dimensions are inflated the most. WC is calculated from the total OPEX. Total OPEX, which is resembled by the heatmap pattern of WC for orientation, shows an opposite trend to FCI exhibiting the highest values at the highest PF and lowest τeff. This trend has two underlying reasons: First, at lower τeff alkene conversion and respective product concentrations in the oil phase are low. Consequently, the overall oil flow increases to deliver sufficient product. High oil flows lead to increasing rhodium makeup costs due to the assumed constant catalyst concentration in the organic phase leaving the decanter (0.1 ppm rhodium leaching). Second, the higher the alkene concentration of recycle flows from the rectification column at low τeff, the more alkene is purged in absolute terms with increasing purge fractions, which again leads to rising make-up costs. Total OPEX is also increased in the lower right quadrant of the heatmap (see WC)—although to a lesser extent—due to indirect OPEX contributions that are calculated based on FCI multiples. Considering all investment cost items in conjunction, TCI exhibits the lowest values at the lowest τeff and at intermediate to elevated PF. TPC, in contrast, exhibits a minimum at rather low PF and intermediate τeff, essentially following the pattern of total OPEX. Total revenues only vary with absolute purge flow rates of valuable liquid because primary product revenues are constant. As the organic recycle stream is larger at a lower τeff due to higher non-reacted alkene fractions, high PF leads to higher total process revenues. The resulting values for gross profit (GP = TR-TPC) form a ridge from the bottom left to the top right quadrant, exhibiting a maximum value at elevated τeff and elevated PF, where product concentrations are the highest. NPV calculated from TCI and GP (after depreciation and taxation) exhibits a maximum value of 67.8 M$ in the top left quadrant at (τeff, PF) = (7.5 h, 3.7 %).
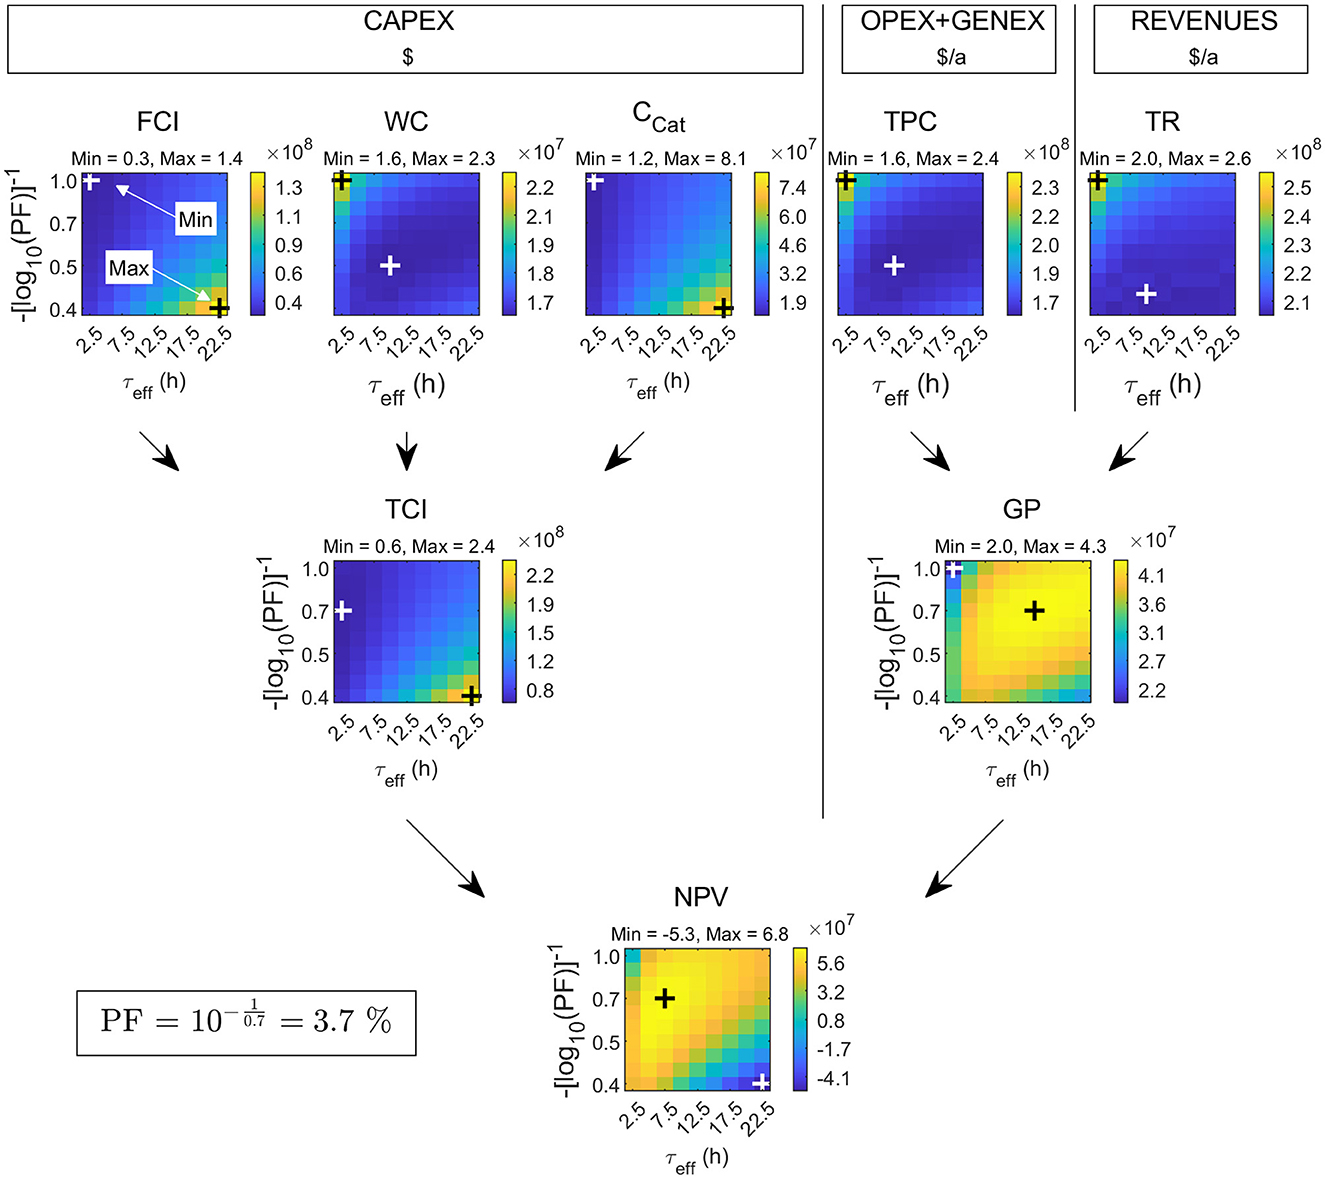
Figure 8. Result of a sensitivity study with the Rh-MES process model on a grid of (τeff, p) values. Maximum NPV is 67.8 M$ (τeff, PF) = (7.5 h, 3.7%). The resulting flowsheet is taken as a base case for Rh-MES. Additional abbreviations: TR, Total annual revenue; PF, Purge fraction (i.e., mass fraction of liquid rectification column overhead purged from the process).
3.2.2 Life cycle assessment
The overall comparison of 17 LCIA categories is lacking a clear trend, as illustrated in Figure 9. LCIA results of Rh-MES compared to Co-BMS can be classified with a ratio of 3:7:7 into following three groups: better (delta < −5%), equivalent (delta −5% to 5%), worse (delta > 5%). Metal depletion potential (MetDepl) indicates the largest advantage of −38% compared to Co-BMS. The most prominent impact category global warming potential (GWP) is rather equivalent (-2%), which can be considered as insignificant difference with regards to underlying uncertainty. The highest disadvantage (+19%) is shown for freshwater ecotoxicity (FWEcoT).
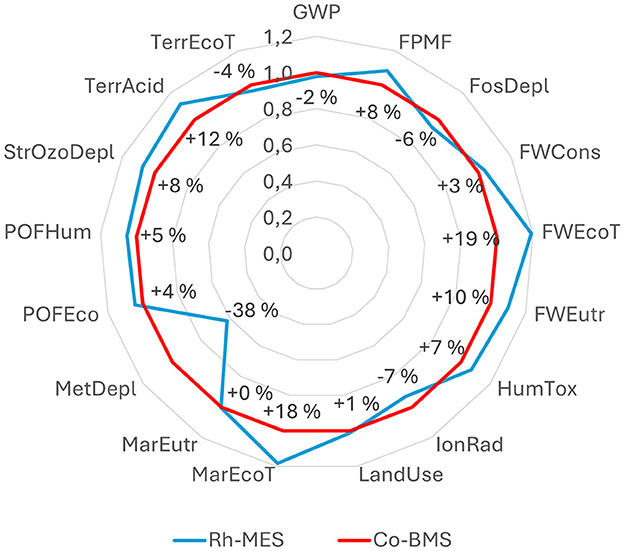
Figure 9. Relative comparison of total LCIA indicator results (ReCiPe 2016, midpoint H) of Rh-MES and Co-BMS, normalized to Co-BMS results.
As the comparison of LCIA indicators at the highest level remains inconclusive regarding impact hotspots, a more granular analysis of contribution groups is presented as depicted in Figure 10. Besides impacts from raw materials, catalyst systems, and utilities, also credits from valuable waste streams are considered (i.e., avoided burden from the assumed sale of the C12 purge fraction as fuel substitute). It can be observed that the main raw material (alkene) is the dominating contributor within all but one LCIA indicators, which is typical for large-scale continuous chemical production processes. Higher alkene (+1%) and syngas (+12%) consumption rates in Co-BMS are reflected by higher impact values compared to Rh-MES. In contrast, the catalyst system group adds significantly higher contributions to Rh-MES than to Co-BMS. In fact, disadvantageous total indicator results of Rh-MES correlate with large catalyst contributions which marks the rhodium catalyst as a hotspot to be screened for optimization potential. The only opposite case is true for MetDepl, where Co-BMS shows higher absolute catalyst impacts. Utilities consisting of electricity, steam, and cooling water add low to insignificant contributions within all LCIA indicators, with a maximum share of 5% shown for freshwater consumption (FWCons) in Rh-MES. In comparison, utility consumptions in Rh-MES cause significantly higher impacts than in Co-BMS which is dominated by higher demands for steam (+300%) and cooling water (+445%) in Rh-MES. Total credits for Rh-MES are between two and five times higher across all LCIA indicators. Within the credits group, heat recovery (i.e., using reaction heat for preheating boiler feed water) is in slightly higher values for Co-BMS. Electricity credits resulting from high-pressure steam letdown after internal consumption are larger in Rh-MES. Credits assumed for valuable alkene recycle purge are five times higher for Rh-MES which is in accordance with higher absolute purge streams.
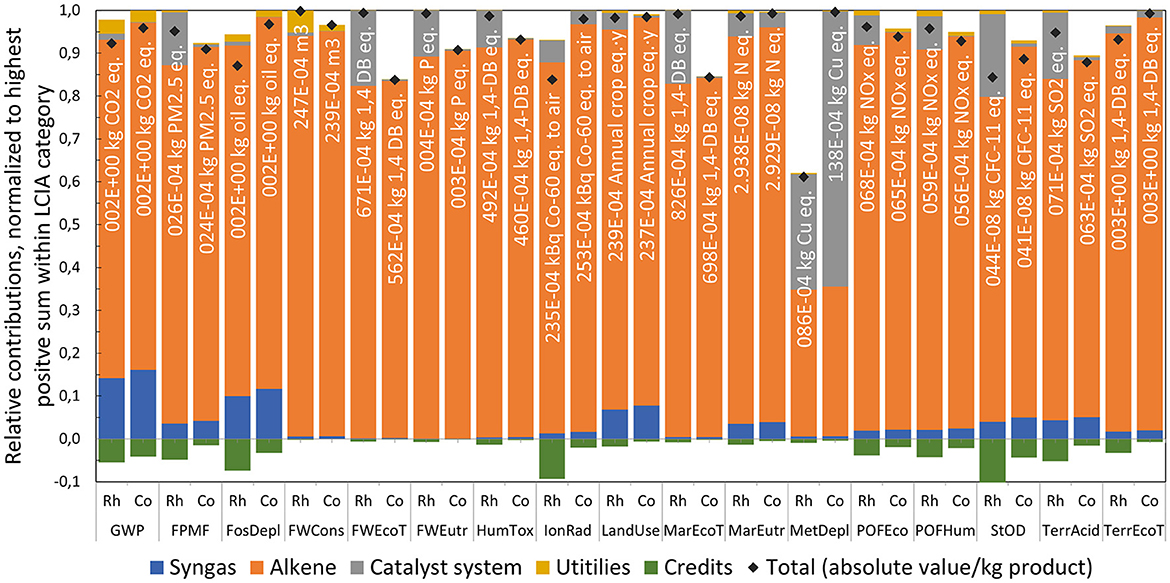
Figure 10. Comparison of main contribution groups within single LCIA indicators of Rh-MES and Co-BMS, bar charts normalized to the alternative with the highest positive sum within each LCIA indicator, total values include credits and impacts with reference to 1 kg of product.
As the catalyst system adds significantly to several LCIA indicators, underlying contributors are compared, as illustrated in Figure 11. Overall, the catalyst system in Co-BMS appears to cause only a fraction of the impacts compared to Rh-MES. Catalyst metal contained in the precursor is by far the dominating contributor within all indicators. Although the average annual rhodium consumption is three orders of magnitude lower than the cobalt consumption (mRh/mProduct [kg/kg] = 3.33 · 10−7; mCo/mProduct [kg/kg] = 1.03 · 10−4), the rhodium impacts are higher. Hence, beneficial catalyst recycling leading to lower rhodium make-up streams is outweighed by the severe environmental burdens of mining the metal entailing much higher impact factors (e.g., GWP1kgRh/GWP1kgCo [kg CO2e/kg CO2e] = 2.11 · 103). The assumption of 0.1 ppm rhodium leaching into the organic phase proves to be highly influential regarding catalyst contribution to overall indicator results. Furthermore, potential credits from selling metal-containing outputs or initial feed recovery are neglected for reasons of simplifying the LCA system boundaries and lack of LCA models for recovery processes. Auxiliaries only show significant contributions in Rh-MES (ligand and surfactant) and only for five LCIA indicators (shares up to 16% in fossil depletion, FosDepl). Water as a solvent influences only FWCons with shares of about 5% in both processes.
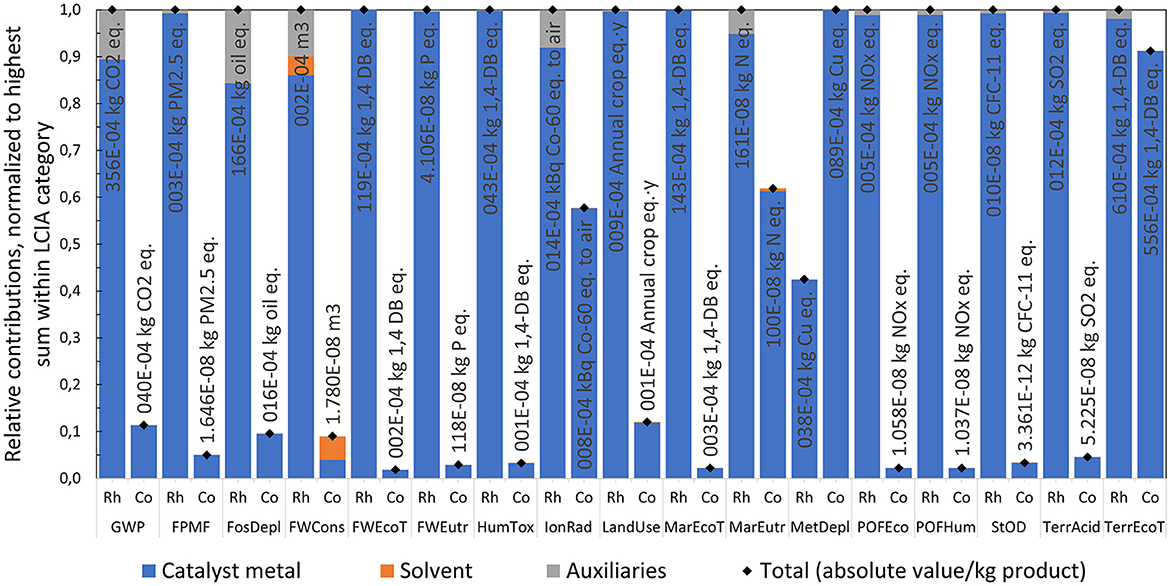
Figure 11. Comparison of contributors to catalyst system group; bar charts normalized to alternative with the highest total within each LCIA category, total values with reference to 1 kg of product.
3.2.3 Scenario analysis
Enabling highly efficient catalyst recycling is considered a key advantage of microemulsion systems. One of the main assumptions in the Rh-MES base case is the low leaching of rhodium catalyst into the organic product phase. Although during miniplant operations no metal leaching could be detected, the theoretical detection limit of 0.1 ppm was selected as a conservative value for modeling. Both TEA and LCA reveal the catalyst system to be a hotspot that significantly influences results. To uncover maximum optimization potential a scenario will be presented assuming zero leaching (“Rh-MES 0 ppm”), meaning a theoretical 100% rhodium recycling rate (see results in Figure 12). The leaching observed in the Ruhr-Chemie-Rhone-Poulenc process shows the possible potential for the optimization of this process step (< 10−9 g rhodium per kg n-butyraldehyde) (Kohlpaintner et al., 2001). As the scenario implies a change of process parameters, a second sensitivity study is conducted. Compared to the base case, a new optimum is identified at even lower τeff (2.5 h vs. 7.5 h in the base case), lower PF (0.97% vs. 3.68%) and lower yield (15% vs. 30%). The mass fraction of alkane in the reactor is now 6.9 wt% compared to 5.8 wt% in the base case. Essentially, the new optimum causes significantly higher organic recycle streams.
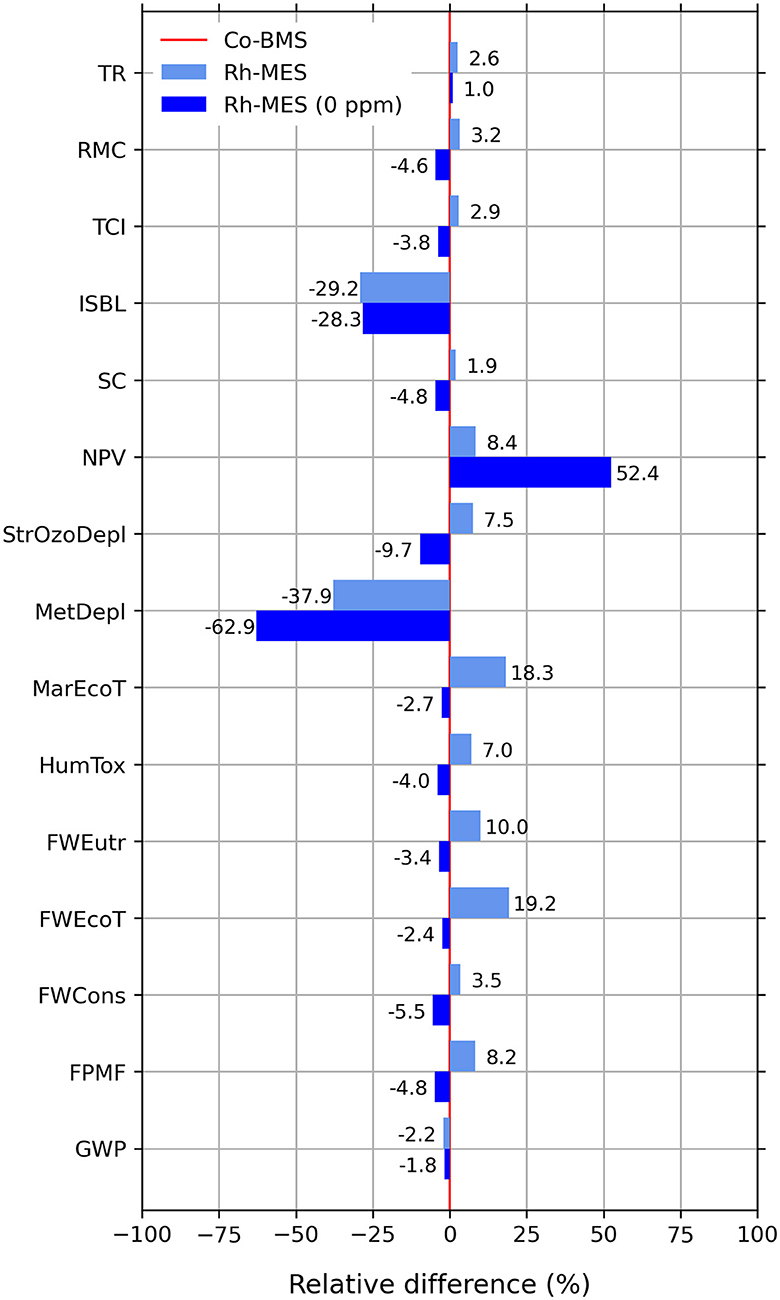
Figure 12. Relative differences of selected TEA and LCIA indicators for Rh-MES “0 ppm” scenario and Rh-MES base case compared to Co-BMS (Co-BMS to be considered as 0% benchmark line).
Economically, the Rh-MES 0 ppm scenario is much more profitable with a nearly 40% increase of NPV to 95 M$ and lower self-cost than Co-BMS now reaching 1.16 $/kg. CAPEX stays nearly the same. Interestingly, at lower τeff and lower PF fewer reactors and less initial catalyst inventory are needed, whereas larger rectification columns need to be deployed due to lower product concentrations and increased organic recycling streams. OPEX decreases generally because of less alkene purge and zero catalyst make-up. However, the gained cost efficiency is nearly neutralized by a considerable increase of utility costs (470%) mainly driven by larger steam demand at the rectification column. Revenues slightly decrease due to smaller valuable purge streams.
Environmentally, the scenario leads to considerable improvements in almost all LCIA indicators leading to overall lower values than Co-BMS. Unexpectedly, GWP and FosDepl minimally increase by 0.4% compared to the base case, which again shows the tradeoff between decreasing alkene make-up and increasing natural gas-based steam demand.
Hence, the scenario of zero metal leaching would be clearly advantageous over the benchmark. Furthermore, it becomes evident that the process parameters τeff and PF of the microemulsion system are strongly dependent on levels of expensive rhodium metal throughput. Although lower catalyst leaching ratios than 0.1 ppm are likely to be found even in the miniplant operation, additional measures to decrease catalyst leaching such as membrane systems for nano-filtration are worth testing.
3.2.4 Joint interpretation
While Rh-MES base case appears economically advantageous in terms of higher NPV, less than a third of the analyzed environmental indicators are in favor of Rh-MES. The identified hotspots contributing to each TEA and LCA indicator vary to some extent which makes it necessary to individually identify optimization potentials. It becomes evident that alkene make-up is the dominating influence throughout all TEA and LCA indicators, except for MetDepl in the case of Co-BMS. The catalyst influence is also of equal significance in both TEA and LCA. Especially the large difference in higher impacts caused by rhodium compared to cobalt can be observed in all indicators, again except for MetDepl which shows the opposite ratio. Although Rh-MES and Co-BMS each differ largely in the individual consumptions of different utility types, the combined contributions of utilities to the various indicators is of low to negligible significance (< 5%) in both assessments. Equipment-related impacts in TEA and LCA cannot be compared numerically, as CAPEX are typically included in economic assessments, but excluded from LCA due to estimated contributions below cutoff criteria.
The base case identification in Rh-MES is purely TEA driven, meaning values of the variables τeff and PF are selected to yield the highest NPV, thereby ignoring environmental criteria at this stage of process modeling and design. This TEA priority is also reflected in the scenario assuming zero rhodium leaching. It has not been investigated whether the optimization of single LCIA indicators would lead to different process parameter values in Rh-MES.
The scenario study reveals great potential for improvement in both TEA and LCA compared to the benchmark. The individual indicators are to be interpreted separately as no linear relationships between the individual results can be observed which is demonstrated by a shift to minimally higher GWP in the scenario in contrast to lower results in all other indicators. Preference-based integration (Wunderlich et al., 2021) of TEA and LCA via weighting and aggregating of individual indicators as applied in multi-criteria decision-making is beyond the scope of this study.
3.2.5 Uncertainty analysis
The presented TEA and LCA results are based on assessments of mid-TRL process data. The level of underlying uncertainty can be considered as high. A qualitative uncertainty analysis will be presented. Quantitative methods such as Monte Carlo analysis are out of scope at this stage.
Generally, modeling uncertainty regarding TEA and LCA is decreased by applying the same equations and methodological approaches to each process. Similarly, the uncertainty of equipment sizing is decreased due to the implementation of identical engineering principles in both process models. Overall, the data availability is higher in Rh-MES than in Co-BMS. While stoichiometry and kinetics from Rh-MES miniplant operation are thoroughly described in the literature, Co-BMS data is derived from examples provided across various patents and scientific reports, increasing uncertainty substantially. In the case of available data ranges, data was selected with a conservative approach in favor of higher competitiveness of Co-BMS. As such, low residence time and high conversion values were selected for Co-BMS. Nevertheless, as the amount of generated side products is decisive for lower profitability compared to Rh-MES, the underlying uncertainty of the selected type and value of side products is critical and needs to be carefully considered when interpreting the presented results.
The uncertainty underlying rhodium leaching rates should be decreased by measurements to properly support process design and decision-making. Although the assumed cobalt losses in Co-BMS are in line with values reported in patents and in similar case studies (Xie and Subramaniam, 2014) uncertainty remains which, however, is far less influencing final results.
Uncertainty concerning equipment costs is assumed to be highest for the reactors, given their huge contribution to total ISBL costs. First, no explicit kinetic expressions are available for the Co-BMS case, the residence time is thus conservatively estimated based on a range provided in the literature. A second significant source of uncertainty concerning overall TEA result comes from the fact that there are different ways of realizing industrial high-pressure reactors [for instance, monobloc vs. multi-layer construction (Moss and Basic, 2012), different H/D ratios that affect the required minimum wall size, maximum mass per vessel, acceptable freeboard zone]. The actual realization would depend on economic optimization that is beyond the scope of this study. As for heat exchangers, uncertainty results from the fact that no optimization was carried out for optimal minimum temperature difference and that no further attempts were made to optimize the HEN for the total number of units. Within the applied assessment framework, the effect of neglected heat exchangers on NPV is estimated at < 1%. Uncertainty with respect to rectification column CAPEX is primarily introduced through the assumption of constant diameters, given that column sectioning would result in significantly reduced stripping section diameters in the Rh-MES case due to comparably low conversions. The uncertainty with respect to other equipment items is assumed to be comparatively low.
Quantitative uncertainty is introduced by the selection of prices and LCA datasets. The reference year for prices is set to 2019 to reflect a period of higher stability and fewer fluctuations compared to the following years. However, as the prices for rhodium and purge streams are decisive for Rh-MES process design underlying uncertainty should be decreased by additional scenario analysis. The uncertainty introduced by LCA datasets is mainly due to the nature of average data entailing low technological and geographical representativeness. Additional uncertainty is introduced by using datasets from multiple LCA databases to fill data gaps. Nevertheless, for the sake of comparison, both processes use the same datasets where applicable. The ligand SulfoXantPhos was not available as a specific LCA dataset and needed to be estimated via a dataset for generic organophosphorous compounds. Even if in this case the respective LCIA results are likely to be underestimated, overall ligand contribution is not expected to become significant.
The ESI contains detailed descriptions of modeling principles and used data, aiming at providing additional transparency to adequately address sources of uncertainty of the presented assessments.
4 Conclusion and outlook
This contribution presents the first case study of long-chain alkene hydroformylation in a rhodium-based microemulsion system (Rh-MES) based on actual miniplant results. Furthermore, the in-depth methodological approach including process modeling, simulation, and integrated TEA and LCA is showcased. A comparison with the conventional cobalt-based benchmark system (Co-BMS) reveals that the modeled Rh-MES is economically competitive while being better or equivalent in more than half of the environmental indicators.
The simulated base case of Rh-MES can be summarized as a process operating at mild conditions, reaching high catalyst recycling rates but unexpectedly low alkene conversion which leads to large equipment dimensions and high utility consumption for product separation. In contrast, Co-BMS can be summarized as a process operating at high temperature and pressure which requires thick-walled reaction vessels as well as large pumps and compressors. High conversion rates in Co-BMS entail higher side product generation which is paired with less efficient catalyst metal recycling. Despite significantly lower equipment-based costs in Rh-MES, total capital invested is higher compared to Co-BMS which is mainly due to large initial investments of rhodium inventory. Similarly, the rhodium make-up costs are decisive for Rh-MES resulting in higher OPEX despite less side product generation. The slightly higher revenues from valuable purge streams are decisive for the final economic competitiveness of Rh-MES. Despite high-quality data from Rh-MES miniplant operations, the choices along the scale-up process introduce high uncertainty which needs to be accounted for when drawing conclusions about performance and competitiveness.
A major outcome of the study is that rhodium costs are crucial for the overall performance of Rh-MES, especially compared to the insignificant contribution cobalt in the benchmark process. In Rh-MES, especially the optimal process parameter selection regarding the highest NPV depends on the conservatively selected rhodium leaching value, which in fact is the lower detectability limit from miniplant operation and therefore most likely too high. Its influence on TEA and LCA becomes evident in a conducted scenario analysis assuming zero rhodium leaching. Interestingly the new optimum is set at an even lower efficient residence time and lower purge fraction which leads to very large organic recycle streams. Economically, NPV significantly increases with lower overall costs despite considerably increasing utility costs. Environmentally, all indicators turn out to be in favor of Rh-MES compared to Co-BMS. However, the fact that GWP minimally increases in the scenario shows that the process optimization is not multi-criteria based, but instead, it is driven by a single TEA indicator. In the future, it should also be investigated how the process design changes when optimizing it along environmental indicators instead of NPV alone. Nevertheless, the scenario gives a proper indication that a decreased rhodium consumption entails higher profitability and lower environmental impacts.
The question remains, why in the case of industrial hydroformylation of propene (Rhône-Poulenc process) the rhodium catalyzed route greatly outperforms the cobalt-based route, whereas in the presented case study the indicator results are rather close in comparison. Essentially, economic aspects motivated companies to replace the earlier installed cobalt-catalyzed hydroformylation processes in the past, as the rhodium catalyst led to higher selectivity at high conversion of the alkene to the desired aldehyde. This is combined with lower equipment costs for the simpler process design utilizing medium-pressure devices. Both aspects greatly compensate for the higher costs of the rhodium catalyst which is quantitatively recycled within an aqueous phase. Although MES enable the application of rhodium catalysts for long-chain alkenes, the discussed process design can only be considered as proof of concept for a stable continuous operation of the hydroformylation with highly efficient catalyst recycling. Nevertheless, there are further optimization requirements. Essentially a lower recycling rate of the raw material will reduce equipment size and cost, as well as operation cost. This will be achievable by a higher alkene conversion of the reaction. Considering the TEA and LCA indicators this should not be based on a higher catalyst concentration but on a higher reaction temperature or the choice of a ligand causing a higher catalyst activity, which are available in literature (Hamerla et al., 2013). Furthermore, it is crucial to strongly increase the space-time yield (e.g., testing a multistage CSTR setup to achieve tubular characteristics, operation with decreased solvent demand, intensified heat recovery, or catalyst filtration). However, despite the promising performance of MES at this stage, for a fair comparison it should be taken into account that also the cobalt-process holds potential for further optimization toward mild operating conditions (Zhang et al., 2022).
Although TEA and LCA results of Rh-MES reveal advantages and disadvantages at the same time, the findings suggest that homogenous catalysis in microemulsion systems holds great potential which should be continuously proven by applying TEA and LCA to further promising examples.
Data availability statement
The original contributions presented in the study are included in the article/Supplementary material, further inquiries can be directed to the corresponding author.
Author contributions
JW: Writing—review & editing, Conceptualization, Data curation, Formal analysis, Investigation, Methodology, Project administration, Validation, Visualization, Writing—original draft. PK: Data curation, Formal analysis, Investigation, Methodology, Validation, Visualization, Writing—original draft, Software. RS: Supervision, Writing—review & editing.
Funding
The author(s) declare that financial support was received for the research, authorship, and/or publication of this article. Funding by the Deutsche Bundesstiftung Umwelt (DBU) and funding by the Deutsche Forschungsgemeinschaft (DFG, German Research Foundation) -TRR 63 “Integrated Chemical Processes in Liquid Multiphase Systems” 56091768 is gratefully acknowledged. Furthermore, we acknowledge support by the Open Access Publication Fund of TU Berlin.
Acknowledgments
The authors would like to thank Markus Illner (TU Berlin) for the support in the transfer of miniplant data into process design, and Ferdinand Kuss (TU Berlin) for the support in the data basis for the benchmark process.
Conflict of interest
The authors declare that the research was conducted in the absence of any commercial or financial relationships that could be construed as a potential conflict of interest.
Publisher's note
All claims expressed in this article are solely those of the authors and do not necessarily represent those of their affiliated organizations, or those of the publisher, the editors and the reviewers. Any product that may be evaluated in this article, or claim that may be made by its manufacturer, is not guaranteed or endorsed by the publisher.
Supplementary material
The Supplementary Material for this article can be found online at: https://www.frontiersin.org/articles/10.3389/frsus.2024.1405471/full#supplementary-material
References
Agrawal, R., Bhagia, S., Satlewal, A., and Ragauskas, A. J. (2023). Urban mining from biomass, brine, sewage sludge, phosphogypsum and e-waste for reducing the environmental pollution: Current status of availability, potential, and technologies with a focus on LCA and TEA. Environm. Res. 224:115523. doi: 10.1016/j.envres.2023.115523
American Society of Mechanical Engineers (2019). 2019 ASME Boiler and Pressure Vessel Code: An International Code. New York, NY: American Society of Mechanical Engineers.
Anastas, P. T., and Warner, J. C. (2000). Green Chemistry: Theory and Practice. Oxford: Oxford University Press.
Ansari, T. N., Xu, G., Preston, A., and Gao, P. (2024). Recent Highlights in Micellar Catalysis: An Industrial Outlook. Org. Process Res. Dev. 28, 816–830. doi: 10.1021/acs.oprd.3c00453
Appl, M., Eckert, E., Hohenschutz, H., Kerber, H., Moell, H., Strohmeyer, M., et al. (1974). Process to Prevent Emulsion Formation in the Processing of Reaction Mixtures Containing Butyaldehyde and Cobalt. Patent No. DE2404855A1. BASF SE.
Appl, M., Eckert, E., Hohenschutz, H., Kerber, H., Moell, H., and Walz, H. (1966). Process for the Preparation of Oxo Reaction Mixtures. Patent No. DE1272911B. BASF SE.
Arpe, H.-J. (2007). Industrielle Organische Chemie: Bedeutende Vor- und Zwischenprodukte. John Wiley and Sons.
Bardas, U. (2015). Messung von Gaslöslichkeiten in mizellaren Reaktionssystemen (Master's Thesis). Dortmund: Technische Universität Dortmund.
Blackmond, D. G., Armstrong, A., Coombe, V., and Wells, A. (2007). Water in organocatalytic processes: debunking the myths. Angewandte Chemie – Int. Ed. 46, 3798–3800. doi: 10.1002/anie.200604952
Bohnen, H.-W., and Cornils, B. (2002). Hydroformylation of alkenes: an industrial view of the status and importance. Adv. Catalys. 47, 1–64. doi: 10.1016/S0360-0564(02)47005-8
Buchner, G. A., Stepputat, K. J., Zimmermann, A. W., and Schomäcker, R. (2019). Specifying technology readiness levels for the chemical industry. Ind. Eng. Chem. Res. 58, 6957–6969. doi: 10.1021/acs.iecr.8b05693
Byrne, F. P., Jin, S., Paggiola, G., Petchey, T. H. M., Clark, J. H., Farmer, T. J., et al. (2016). Tools and techniques for solvent selection: green solvent selection guides. Sustain. Chem. Proc. 4, 7. doi: 10.1186/s40508-016-0051-z
Cornils, B., Falbe, J., and Bahrmann, H. (1980). New Synthesis with carbon monoxide. Cham: Springer.
Couper, J. R. (2012). Chemical Process Equipment: Selection and Design. Amsterdam, Boston: Elsevier/Butterworth-Heinemann.
Dyson, P. J., and Jessop, P. G. (2016). Solvent effects in catalysis: rational improvements of catalysts via manipulation of solvent interactions. Catal. Sci. Technol. 6, 3302–3316. doi: 10.1039/C5CY02197A
Fabris, F., Illner, M., Repke, J.-U., Scarso, A., and Schwarze, M. (2023). Is micellar catalysis green chemistry? Molecules 28, 4809. doi: 10.3390/molecules28124809
Franke, R., Selent, D., and Börner, A. (2012). Applied hydroformylation. Chem. Rev. 112, 5675–5732. doi: 10.1021/cr3001803
Frohning, C. D., Kohlpaintner, C. W., and Bohnen, H.-W. (2002). “Carbon monoxide and synthesis gas chemistry,” in Applied Homogeneous Catalysis with Organometallic Compounds (Weinheim: Wiley-VCH), 29–194.
Grenacher, A. V., and Stepp, H. (1999). Continuous Process for Hydroformylating Olefins with 6 to 20 Carbon Atoms. Patent No. WO2001014297A1. BASF SE.
Hamerla, T., Rost, A., Kasaka, Y., and Schomäcker, R. (2013). Hydroformylation of 1-dodecene with water-soluble rhodium catalysts with bidentate ligands in multiphase systems. Chem. Cat. Chem. 5, 1854–1862. doi: 10.1002/cctc.201200744
Hohenschutz, H., Kummer, R., Nienburg, H.-J., Strohmeyer, M., and Tavs, P. (1971). Unbranched Aldehydes - by Hydroformylation of Alkylenically Unsaturated Compounds. Patent No. DE2139630A1. BASF SE.
Hohenschutz, H., Kummer, R., Nienburg, H.-J., Strohmeyer, M., and Tavs, P. (1972). Additional Document to Unbranched Aldehydes - by Hydroformylation of Alkylenically Unsaturated Compounds. Patent No. DE2206252B2. BASF SE.
Hohl, L. (2019). Dispersion and Phase Separation in Liquid Multiphase Systems: Influence of Three Phase Conditions on Drop Size Distributions (Dissertation). Berlin: Technische Universität Berlin.
Illner, M. (2020). Rigorous Analysis of Reactive Microemulsion Systems for Process Design and Operation (Dissertation). Berlin: Technische Universität Berlin.
Illner, M., Müller, D., Esche, E., Pogrzeba, T., Schmidt, M., Schomäcker, R., et al. (2016). Hydroformylation in microemulsions: proof of concept in a miniplant. Ind. Eng. Chem. Res. 55, 8616–8626. doi: 10.1021/acs.iecr.6b00547
Kahlweit, M., Leßner, E., and Strey, R. (1983). Über das Phasenverhalten ternärer Systeme des Typs H2O-Öl-Nichtionisches Tensid. Colloid Polymer Sci. 261, 954–964. doi: 10.1007/BF01451675
Kahlweit, M., and Strey, R. (1985). Phase behavior of ternary systems of the type H2O—Oil—nonionic amphiphile (microemulsions). Angew. Chem. Int. Ed. Engl. 24, 654–668. doi: 10.1002/anie.198506541
Kiedorf, G., Hoang, D. M., Müller, A., Jörke, A., Markert, J., Arellano-Garcia, H., et al. (2014). Kinetics of 1-dodecene hydroformylation in a thermomorphic solvent system using a rhodium-biphephos catalyst. Chem. Eng. Sci. 115, 31–48. doi: 10.1016/j.ces.2013.06.027
Kniese, W., Plückhan, J., Kummer, R., Nienburg, H. J., and Tavs, P. (1971). Process for the Continuous Production of Metal Carbonyls. Patent No. DE2103454A1. BASF SE.
Kohlpaintner, C. W., Fischer, R. W., and Cornils, B. (2001). Aqueous biphasic catalysis: Ruhrchemie/Rhône-Poulenc oxo process. Appl. Cataly. A: Gen. 221, 219–225. doi: 10.1016/S0926-860X(01)00791-8
Kraume, M., Enders, S., Drews, A., Schomäcker, R., Engell, S., and Sundmacher, K. (2022). Integrated Chemical Processes in Liquid Multiphase Systems: From Chemical Reaction to Process Design and Operation. Berlin/Boston: De Gruyter.
Lüken, H., Kaizik, A., Drees, S., Büschken, W., and Droste, W. (2004). Process for the Hydroformylation of Olefins. Patent No. DE102004059293A1. Marl: Oxeno Olefinchemie GmbH.
La Sorella, G., Strukul, G., and Scarso, A. (2015). Recent advances in catalysis in micellar media. Optoelect. Adv. Mater. Rapid Commun. 17, 644–683. doi: 10.1039/C4GC01368A
Lippincott, D. J., Landstrom, E., Cortes-Clerget, M., Lipshutz, B. H., Buescher, K., Schreiber, R., et al. (2020). Surfactant technology: with new rules, designing new sequences is required! Org. Process Res. Dev. 24, 841–849. doi: 10.1021/acs.oprd.9b00454
Lipshutz, B. H., Gallou, F., and Handa, S. (2016). Evolution of solvents in organic chemistry. ACS Sustain. Chem. Eng. 4, 5838–5849. doi: 10.1021/acssuschemeng.6b01810
Markert, J., Brunsch, Y., Munkelt, T., Kiedorf, G., Behr, A., Hamel, C., et al. (2013). Analysis of the reaction network for the Rh-catalyzed hydroformylation of 1-dodecene in a thermomorphic multicomponent solvent system. Appl. Cataly. A: Gen. 462–463, 287–295. doi: 10.1016/j.apcata.2013.04.005
MarketsandMarkets (2024). Fatty Alcohols Market - Global Forecast to 2025. Available online at: https://www.marketsandmarkets.com/Market-Reports/fatty-alcohol-market-245021082.html (accessed February 28, 2024).
Merchan, V. A., Esche, E., Fillinger, S., Tolksdorf, G., and Wozny, G. (2016). Computer-aided process and plant development. A review of common software tools and methods and comparison against an integrated collaborative approach. Chemie Ingenieur Technik 88, 50–69. doi: 10.1002/cite.201500099
Merchan, V. A., Tolksdorf, G., Kraus, R., and Wozny, G. (2014). Extending documentation-based models towards an efficient integration into commercial process simulators. Chemie Ingenieur Technik 86, 1117–1129. doi: 10.1002/cite.201400014
Mining.com (2023). Cobalt Price. Available online at: https://www.mining.com/markets/commodity/cobalt/ (accessed March 01, 2023).
Müller, D. (2015). Development of Operation Trajectories Under Uncertainty for a Hydroformylation Mini Plant (Dissertation). Berlin: Technische Universität Berlin.
Müller, D., Esche, E., Pogrzeba, T., Illner, M., Leube, F., Schomäcker, R., et al. (2015). Systematic phase separation analysis of surfactant-containing systems for multiphase settler design. Ind. Eng. Chem. Res. 54, 3205–3217. doi: 10.1021/ie5049059
Müller, D., Minh, D. H., Merchan, V. A., Arellano-Garcia, H., Kasaka, Y., Müller, M., et al. (2014). Towards a novel process concept for the hydroformylation of higher alkenes: mini-plant operation strategies via model development and optimal experimental design. Chem. Eng. Sci. 115, 127–138. doi: 10.1016/j.ces.2013.05.022
Müller, M., Kasaka, Y., Müller, D., Schomäcker, R., and Wozny, G. (2013). Process design for the separation of three liquid phases for a continuous hydroformylation process in a miniplant scale. Ind. Eng. Chem. Res. 52, 7259–7264. doi: 10.1021/ie302487m
Nienburg, H. J., Hohenschutz, H., and Strohmeyer, M. (1974). “New hydroformylation technology with cobalt carbonyls,” in Homogeneous Catalysis—II, eds. D. Forster, and J. F. Roth (ACS Publications), 19–26.
Penteado, A. (2015). Implementing MOSAIC Models in Aspen. Available online at: https://mosaic-modeling.de/wp-content/uploads/2015/07/Exporting-Models-from-MOSAIC-to-Aspen.pdf (accessed March 17, 2024).
Peters, M. S., Timmerhaus, K. D., and West, R. E. (2004). Plant Design and Economics for Chemical Engineers. Boston: McGraw-Hill.
Pogrzeba, T., Illner, M., Schmidt, M., Milojevic, N., Esche, E., Repke, J.-U., et al. (2019). Kinetics of hydroformylation of 1-dodecene in microemulsion systems using a rhodium sulfoxantphos catalyst. Ind. Eng. Chem. Res. 58, 4443–4453. doi: 10.1021/acs.iecr.8b06157
Pogrzeba, T., Müller, D., Hamerla, T., Esche, E., Paul, N., Wozny, G., et al. (2015). Rhodium-catalyzed hydroformylation of long-chain olefins in aqueous multiphase systems in a continuously operated miniplant. Ind. Eng. Chem. Res. 54, 11953–11960. doi: 10.1021/acs.iecr.5b01596
Roschangar, F., Colberg, J., Dunn, P. J., Gallou, F., Hayler, J. D., Koenig, S. G., et al. (2017). A deeper shade of green: inspiring sustainable drug manufacturing. Energy Environm. Sci. 19, 281–285. doi: 10.1039/C6GC02901A
Rost, A., Müller, M., Hamerla, T., Kasaka, Y., Wozny, G., and Schomäcker, R. (2013). Development of a continuous process for the hydroformylation of long-chain olefins in aqueous multiphase systems. Chem. Eng. Proces.: Proc. Intensificat. 67, 130–135. doi: 10.1016/j.cep.2012.10.001
Sar, P., Ghosh, A., Scarso, A., and Saha, B. (2019). Surfactant for better tomorrow: applied aspect of surfactant aggregates from laboratory to industry. Res Chem. Intermed. 45, 6021–6041. doi: 10.1007/s11164-019-04017-6
Schomäcker, R., Schwarze, M., Nowothnick, H., Rost, A., and Hamerla, T. (2011). Mizellare Lösungen und Mikroemulsionen als Reaktionsmedien für katalytische Reaktionen. Chemie Ingenieur Technik 83, 1343–1355. doi: 10.1002/cite.201100042
Schwarze, M., Pogrzeba, T., Volovych, I., and Schomäcker, R. (2015). Microemulsion systems for catalytic reactions and processes. Catal. Sci. Technol. 5, 24–33. doi: 10.1039/C4CY01121J
Seider, W. D. (2010). Product and Process Design Principles: Synthesis, Analysis, and Evaluation. Hoboken, NJ: Wiley.
Sheldon, R. A. (2017). The E factor 25 years on: the rise of green chemistry and sustainability. Green Chem 9, 903–906. doi: 10.1039/C6GC02157C
Shen, T., Zhou, S., Ruan, J., Chen, X., Liu, X., Ge, X., et al. (2021). Recent advances on micellar catalysis in water. Adv. Colloid Interf. Sci. 287, 102299. doi: 10.1016/j.cis.2020.102299
Sulzer Chemtech Ltd (2023). Structured Packings: Energy-Efficient, Innovative and Profitable. Available online at: https://www.sulzer.com/-/media/files/products/separation-technology/distillation-and-absorption/brochures/structured_packings.ashx (accessed March 17, 2024).
Toetsch, W., Arnoldi, D., Kaizik, A., and Trocha, M. (2003). Verfahren zur Hydroformylierung von Olefinen. Patent No. DE10227995A1. Marl: Oxeno Olefinchemie GmbH.
Towler, G. P., and Sinnott, R. K. (2013). Chemical Engineering Design: Principles, Practice and Economics of Plant and Process Design. Amsterdam, London: Butterworth-Heinemann.
Vogelpohl, C., Brandenbusch, C., and Sadowski, G. (2013). High-pressure gas solubility in multicomponent solvent systems for hydroformylation. Part I: Carbon monoxide solubility. J. Supercrit. Fluids 81, 23–32. doi: 10.1016/j.supflu.2013.04.006
Vogelpohl, C., Brandenbusch, C., and Sadowski, G. (2014). High-pressure gas solubility in multicomponent solvent systems for hydroformylation. Part II: Syngas solubility. J. Supercriti. Fluids 88, 74–84. doi: 10.1016/j.supflu.2014.01.017
Wunderlich, J., Armstrong, K., Buchner, G. A., Styring, P., and Schomäcker, R. (2021). Integration of techno-economic and life cycle assessment: defining and applying integration types for chemical technology development. J. Cleaner Product. 287, 125021. doi: 10.1016/j.jclepro.2020.125021
Wunderlich, J., Buchner, G. A., Schwarze, M., and Schomäcker, R. (2024). Integrated life cycle and techno-economic assessment of micellar solvent systems in bulk fine chemical production. Ind. Eng. Chem. Res. 63, 410–422. doi: 10.1021/acs.iecr.3c03630
Xie, Z., and Subramaniam, B. (2014). Development of a greener hydroformylation process guided by quantitative sustainability assessments. ACS Sustain. Chem. Eng. 2, 2748–2757. doi: 10.1021/sc500483f
Yaseneva, P., Hodgson, P., Zakrzewski, J., Falß, S., Meadows, R. E., and Lapkin, A. A. (2016). Continuous flow Buchwald–Hartwig amination of a pharmaceutical intermediate. React. Chem. Eng. 1, 229–238. doi: 10.1039/C5RE00048C
Zeller, E., Walter, M., Richter, W., Diehl, K., Roeper, M., and Tropsch, J. (2001). C13 Alcohol Mixture and Functionalized C13 Alcohol Mixture. Patent No. DE19955593A1. BASF SE.
Zhang, B., Kubis, C., and Franke, R. (2022). Hydroformylation catalyzed by unmodified cobalt carbonyl under mild conditions. Science 377, 1223–1227. doi: 10.1126/science.abm4465
Zimmermann, A. W., Müller, L., Wang, Y., Langhorst, T., Wunderlich, J., Marxen, A., et al. (2020a). Techno-Economic Assessment and Life Cycle Assessment Guidelines for CO2 Utilization (Version 1.1). Ann Arbor, MI: University of Michigan Library.
Zimmermann, A. W., Wunderlich, J., Müller, L., Buchner, G. A., Marxen, A., Michailos, S., et al. (2020b). Techno-economic assessment guidelines for CO2 utilization. Front. Energy Res. 8:5. doi: 10.3389/fenrg.2020.00005
Glossary
ACC, Annualized capital charge; ACCR, Annualized capital charge ratio; ACM, Aspen custom model; AP, Aspen Plus; ASME, American Society of Mechanical Engineers; BFW, Boiler feed water; BMS, Benchmark system; BPVC, Boiler and Pressure Vessel Code; CAPEX, Capital expenditure; CEPCI, Chemical Engineering Plant Cost Index; Cfnet, Net operational cash flow; CMC, Critical micelle concentration; Co, Cobalt; Co-BMS, Cobalt-based benchmark system; CP, Heat capacity flow rate; CSTR, Continously stirred tank reactor; CW, Cooling water; D, Depreciation; DNCF, Discounted net cash flow; E&U, Energy and utilities; ESI, Electronic supporting information; FCI, Fixed capital investments; FosDepl, Fossil depletion [kg oil eq.]; FPMF, Fine Particulate Matter Formation [kg PM2.5 eq.]; FWCons, Freshwater Consumption [m3]; FWEcoT, Freshwater ecotoxicity [kg 1,4 DB eq.]; FWEutr, Freshwater eutrophication [kg P eq.]; GENEX, General expenditure; GHG, Greenhouse gas; GP, Gross profit; GWP, Climate change, incl biogenic carbon [kg CO2 eq.]; HEN, Heat exchanger networks; HETP, Height equivalent to a theoretical plate; HumTox, Human toxicity, cancer [kg 1,4-DB eq.]; IonRad, Ionizing Radiation [kBq Co-60 eq. to air]; ISBL, Inside battery limits; LandUse, Land use [Annual crop eq.·y]; LCA, Life cycle assessment; LCI, Life cycle inventory; LCIA, Life cycle impact asessment; LP, Low pressure; MACRS, Modified Accelerated Cost Recovery System; MarEcoT, Marine ecotoxicity [kg 1,4-DB eq.]; MarEutr, Marine Eutrophication [kg N eq.]; MER, Minimum energy requirement; MES, Microemulsion system; MetDepl, Metal depletion [kg Cu eq.]; MP, Medium pressure; NCF, Net cash flow; NPV, Net present value; OPEX, Operational expenditure; PF, Purge fraction; POFEco, Photochemical Ozone Formation, Ecosystems [kg NOx eq.]; POFHum, Photochemical Ozone Formation, Human Health [kg NOx eq.]; PWF, Present worth factor; Rh, Rhodium; Rh-MES, Rhodium-based microemulsion system; SC, Self-cost; StrOzoDepl, Stratospheric Ozone Depletion [kg CFC-11 eq.]; SX, SulfoXantPhos ligand; TAX, Taxes (absolute cash flow); TCI, Total capital investments; TEA, Techno-economic assessment; TerrAcid, Terrestrial Acidification [kg SO2 eq.]; TerrEcoT, Terrestrial ecotoxicity [kg 1,4-DB eq.]; TPC, Total production cost; TPPTS, 3,3′,3″-Phosphanetriyltris(benzenesulfonic acid) trisodium salt; TR, Total revenue; TRL, Technology readiness level; WC, Working capital. α, Mass fraction of the oil phase from the total mass; γ, Mass fraction of the surfactant from the total mass; N, Project life time in years; RECj, Capital recovery from the project in year j; j, year; tsep, max, Maximum observed phase separation time; X, Mass of the aldehyde with respect to the total oil mass; T, Temperature; τD, Decanter residence time; H, Overall vessel height; D, Overall vessel diameter; S, Maximum allowable stress values; F, Fluid factor; A, Area; p, Pressure; PB, Break power; PF, Purge Fraction; τeff, Effective residence time; Ccat, Cost for catalyst inventory; t, Wall thickness; ΔTmin, Minimal temperature difference; HUmin, Minimum hot utility requirement; CUmin, Minimum cold utility requirement.
Keywords: techno-economic assessment, life cycle assessment, process simulation, homogenous catalysis, green chemistry, microemulsion, hydroformylation, micellar catalysis
Citation: Wunderlich J, Kretzschmar P and Schomäcker R (2024) Integrated techno-economic and life cycle assessment of hydroformylation in microemulsion systems. Front. Sustain. 5:1405471. doi: 10.3389/frsus.2024.1405471
Received: 22 March 2024; Accepted: 30 April 2024;
Published: 17 May 2024.
Edited by:
Ruchi Agrawal, TERI Gram, IndiaReviewed by:
Songsong Liu, Harbin Institute of Technology, ChinaRui Manuel Filipe, Lisbon Higher Institute of Engineering (ISEL), Portugal
Copyright © 2024 Wunderlich, Kretzschmar and Schomäcker. This is an open-access article distributed under the terms of the Creative Commons Attribution License (CC BY). The use, distribution or reproduction in other forums is permitted, provided the original author(s) and the copyright owner(s) are credited and that the original publication in this journal is cited, in accordance with accepted academic practice. No use, distribution or reproduction is permitted which does not comply with these terms.
*Correspondence: Reinhard Schomäcker, schomaecker@tu-berlin.de