Real-time affect detection in virtual reality: a technique based on a three-dimensional model of affect and EEG signals
 Andres Pinilla
 Jan-Niklas Voigt-Antons
 Jaime Garcia
 William Raffe
 Sebastian Möller1,3†
- 1Quality and Usability Lab, Institute for Software Technology and Theoretical Computer Science, Faculty of Electrical Engineering and Computer Science, Technische Universitat Berlin, Berlin, Germany
- 2UTS Games Studio, Faculty of Engineering and IT, University of Technology Sydney UTS, Sydney, NSW, Australia
- 3German Research Center for Artificial Intelligence (DFKI), Berlin, Germany
- 4Hamm-Lippstadt University of Applied Sciences, Hamm, Germany
This manuscript explores the development of a technique for detecting the affective states of Virtual Reality (VR) users in real-time. The technique was tested with data from an experiment where 18 participants observed 16 videos with emotional content inside a VR home theater, while their electroencephalography (EEG) signals were recorded. Participants evaluated their affective response toward the videos in terms of a three-dimensional model of affect. Two variants of the technique were analyzed. The difference between both variants was the method used for feature selection. In the first variant, features extracted from the EEG signals were selected using Linear Mixed-Effects (LME) models. In the second variant, features were selected using Recursive Feature Elimination with Cross Validation (RFECV). Random forest was used in both variants to build the classification models. Accuracy, precision, recall and F1 scores were obtained by cross-validation. An ANOVA was conducted to compare the accuracy of the models built in each variant. The results indicate that the feature selection method does not have a significant effect on the accuracy of the classification models. Therefore, both variations (LME and RFECV) seem equally reliable for detecting affective states of VR users. The mean accuracy of the classification models was between 87% and 93%.
1 Introduction
Affective states play a central role in some of the most common mental disorders. For example, negative affective states are prevalent in patients suffering from anxiety and depression (Barlow et al., 1991). Likewise, impaired emotional empathy is one of the symptoms of psychopathy (Brook and Kosson, 2013). At the same time, previous studies suggest that video games can be used for the assessment and treatment of mental disorders (Shiban et al., 2015; Blandon et al., 2016; Tavares Vasconcelos Oliveira et al., 2021). Those games can be developed using Virtual Reality (VR) technologies (Bermudez i Badia et al., 2019; Baghaei et al., 2021), leading to immersive (Perkis et al., 2020) and emotionally engaging experiences (Visch et al., 2010). Therefore, the development of games for mental healthcare could be fostered by developing Virtual Reality (VR) systems that automatically decode users’ affective states.
There are at least two requirements that should be fulfilled by a technique for affect detection in VR. Firstly, affective states should be analyzed automatically and in real-time. Secondly, the technique should not interrupt the interaction of the user with the virtual environment. Previous studies suggest that both requirements can be satisfied using electrophysiological signals (Picard et al., 2001; Antons et al., 2014).
Consequently, this manuscript explores the development of a technique for inferring users’ affective states from their electrophysiological responses. The technique was tested with data collected during an experiment in Virtual Reality (VR). In this experiment, participants evaluated their affective responses towards 16 videos in terms of the three dimensions of the Evaluative Space Model (ESM) (Cacioppo et al., 1997) (negativity, positivity, and net predisposition), while their brain activity was recorded using electroencephalography (EEG).
The ESM (Cacioppo et al., 1997) is a theoretical model that allows representing affective responses that contain simultaneous positive and negative activation. This is not possible in theoretical models where positive and negative activation are mapped to a single valence dimension, such as the Circumplex Model of Affect (Russell, 1980). If negative and positive activation are represented in a single dimension, an increase in positive activation necessarily implies a decrease in negative activation, and vice versa. There is evidence suggesting that positive and negative activation might operate independently (Mattek, 2011). Yet, it is not clear how to infer users’ affective states in terms of a theoretical model that does not assume the existence of a bipolar pleasure-displeasure continuum.
Additional studies indicate that it is possible to infer some characteristics of users’ affective states by analyzing their electroencephalography (EEG) signals (Ray and Cole, 1985; Davidson, 1992; Pfurtscheller and Lopes da Silva, 1999; Huster et al., 2009; Antons, 2015; Hofmann et al., 2018). The features extracted from EEG signals can be used to build Machine Learning models for affect detection. Those models can be implemented into a Brain-Computer Interface (BCI), interpreting users’ affective states as computer commands (Zander and Kothe, 2011).
There are at least two types of BCI models: user-dependent and user-independent models. The former are trained with data recorded from the user, while the latter are trained with prerecorded data from multiple users. The technique proposed in this paper aims to build user-dependent models. Thus, the models are tailored to the individual characteristics of each user (Brouwer et al., 2015).
Deep learning methods have been used previously for inferring affective states from EEG activity (Khosrowabadi et al., 2014; Zheng and Lu, 2015; Tripathi et al., 2017; Song et al., 2018). For example, Long Short-Term Memory (LSTM) recurrent neural networks (RNN) can be used to decode affective states from EEG signals (Hofmann et al., 2018; Hofmann et al., 2021). Yet, this approach has been used for decoding emotional arousal. It is still unclear whether it can be used to decode valence, or any of the three affective dimensions of the ESM (Cacioppo et al., 1997).
At the same time, neural networks tend to require more computing power than some traditional machine learning algorithms, such as Random Forest. Partly, because neural networks usually require larger datasets during the training phase to achieve similar accuracy. Additionally, real-time analysis of EEG signals is particularly demanding in terms of computing power because the data must be processed at the same speed that it is recorded.
Computing power is not a limitation when a High-Performance Computing (HPC) system is available. However, most users do not have access to an HPC center. It is possible to overcome this challenge by training a neural network at an HPC center and deploying the trained model (e.g., Singh and Tao, 2020). However, this approach is not optimal for building userdependent models in real-time, because it would require 1) capturing enough data from each user to train user-dependent neural networks, 2) transferring the data from each user to an HPC center, 3) training at least one neural network per user, 4) transferring the trained models back to the device of each user, and 5) completing the entire process at a speed that does not disrupt the experience of the user.
In contrast, a Random Forest classification model usually can be trained using consumer-grade hardware. Therefore, this algorithm could be used to train affect detection models on the user’s device. This approach is consistent with edge computing (Cao et al., 2020), an emerging paradigm that supports the benefits of processing the data on the user’s device. Some of those benefits are 1)minimizing the amount of data that is transferred over the network, reducing bandwidth consumption and avoiding potential pitfalls caused by network disruptions, 2) strengthening security and privacy, because most of the user’s data remain on their device, and 3) reducing the operational costs. Thus, Random Forest might be more suitable than neural networks for building user-dependent affect detection models in real-time.
One of the key steps when building a Random Forest classification model is identifying the most relevant features for the construct of interest. This process is known as feature selection. A common method for feature selection is Recursive Feature Elimination (RFE), which has been used previously in the field of affect detection (Val-Calvo et al., 2019). This method requires defining a fixed number of features to select. The classification model is fit multiple times, and in each iteration, the less relevant features are removed until reaching the number of features that have been previously defined.
Given that the proposed technique aims to build user-dependent models, feature selection is conducted with the data of each user. Hence the optimal number of features to choose might change according to the individual characteristics of each user. Therefore, RFE might not be suitable for building user-dependent models. This challenge can be solved using Recursive Feature Elimination with Cross Validation (RFECV) (Yin et al., 2017; Akbar et al., 2021; Zanetti et al., 2022), a method similar to RFE that automatically detects the optimal number of features that are required for training a model.
Previous studies point out that cross-validation schemes for supervised learning problems, such as RFECV, are not suitable for analyzing EEG signals (Val-Calvo et al., 2019). This is because those schemes assume independence between samples (Val-Calvo et al., 2019). Therefore, they cannot capture the sequential nature of time series that is inherent to EEG signals.
A possible solution for this challenge might be found in Linear Mixed-Effects (LME) models, a non-parametric statistical method that is particularly useful for analyzing EEG signals (Riha et al., 2020). The flexible structure of LME allows capturing variations across time and subject-specific brain activity patterns. Yet, it is not common to use LME in the context of supervised learning for selecting features extracted from EEG signals.
Therefore, two variants of the affect detection technique proposed in the manuscript are tested. The difference between both variants is the method used for feature selection. Those methods are LME and RFECV. Given that RFECV is a well-established feature selection method, it is useful as a benchmark to evaluate the performance of the LME approach proposed in this manuscript. At the same time, given that LME models are able to capture variations across time, they can be used as a benchmark to evaluate the performance of RFECV when applied to time series analysis.
2 Methods
2.1 Participants
Twenty-three students from the Technische Universität Berlin participated in the study. One participant was excluded because the file containing the electrophysiological data was corrupted. Two participants were excluded because a flat line was detected in more than 90% of their EEG recordings. Outliers were detected in two participants, whose data was removed from further analysis. Therefore, the analysis was conducted with the data of 18 participants. Their age was between 19 and 58 years old (M = 30.28; SD = 10.31). Eight were women, and ten were men. All participants provided written informed consent before participating in the experiment. They received €10 as compensation.
2.2 Virtual environment
The experiment was programmed using the software Psychopy 3.0 (Peirce et al., 2019). The computer screen was streamed into a Head-Mounted Display (HMD) using the software Virtual Desktop. The virtual environment was a home theatre (see Figure 1). Participants remained seated in a chair during the experiment and watched the stimuli on the virtual home-theater screen.
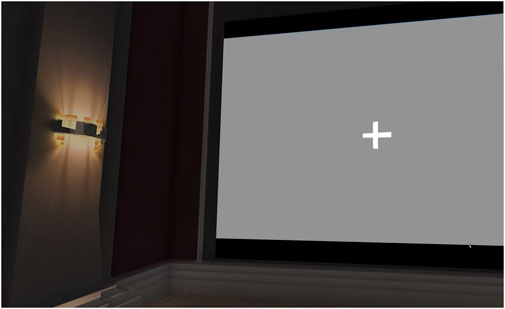
FIGURE 1. Screenshot of the virtual environment used during the experiment. Participants were inside a virtual home theater. The videos were projected on the screen of this home theater using the software Virtual Desktop (Guy, 2016).
2.3 Stimuli
The stimuli were music videos taken from the DEAP dataset (Koelstra et al., 2012). This dataset contains 40 music videos. A subset of 16 videos selected during a previous study (Kruger et al., 2020) were used in the experiment. Two additional videos were used for training trials. Thus, 18 videos were used in total. The duration of each video was 60 s.
2.4 Apparatus
The virtual environment was shown using an HTC Vive. A Brain Products amplifier was used for the ECG signals and a g.Tec amplifier was used for the EMG and EEG signals. Recordings from both systems were synchronized using Lab Streaming Layer (LSL). An ECG electrode was placed in each wrist and another in the left ankle. EMG electrodes were placed in the Zygomaticus Major and Corrugator Supercilii muscles, similar to Dimberg et al. (2000). EEG electrodes were placed at F3, F4, P3, P4, T7, T8, and Cz, according to the 10–20 system. The EEG electrode locations were selected based on a previous study conducted by Huster et al. (2009) (see Figure 2). The reference electrode for EEG was placed in the left mastoid. The ground electrode for EMG and EEG was placed in the right mastoid. The sampling frequency was 5,000 Hz for ECG, and 256 Hz for EMG and EEG. Impedance for the EEG signals was below 10 kΩ.
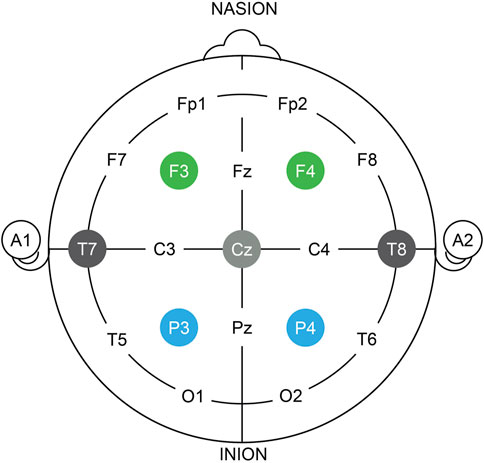
FIGURE 2. Diagram of electrode montage used during the experiment. Seven electrodes were placed, according to the 10–20 international system. Electrode sites were F3, F4, P3, P4, T7, T8 and Cz, similar to Huster et al. (2009). Reference and ground electrodes were placed in the left and right mastoids, respectively.
2.5 Procedure
Participants signed informed consent and completed a demographics questionnaire. Then the electrodes, HMD, and headphones were placed. Electrophysiological signals were visually inspected before starting the experimental task. Two practice trials were presented to help participants gain familiarity with the virtual environment and the rating system, followed by a 2-min grey screen with a cross in the center, similar to Koelstra et al. (2012). After the 2-min grey screen, 16 trials were presented. Each trial consisted of a 5-s grey screen with a cross in the center, followed by a video. The order of presentation of the videos was randomized. After each video, five questions were presented. All questions were answered using a slider. Participants used an optical mouse to select their answers in the sliders.
The slider for all questions ranged from 1 to 10. In each question, one word was shown in each extreme of the slider, similar to Lombard et al. (2000).
The first three questions corresponded to the three dimensions of the ESM (Cacioppo et al., 1997): negativity, positivity, and net predisposition. The questions were taken from a previous study (Pinilla et al., 2020). The statement of the first three questions was, “how did this video make you feel.” In the first question (negativity), the words at the sides of the slider were “1—Not bad at all” and “10—Very bad”; In the second (positivity), the words were “1—not good at all” and “10—very good”; In the third (net predisposition) the words were “1—Very relaxed” and “10—Very restless”.
Two additional questions were used to assess liking and familiarity. These questions were taken from Koelstra et al. (Koelstra et al., 2012). The statements of the fourth and fifth questions were “how much do you like this video?” and “how well do you know the video ?“, respectively. In the fourth question (familiarity), the words placed at the sides of the slider were “1 - Never saw it before the experiment” and “10 - Knew it very well”. In the fifth question (liking), the words were “1 - Not at all” and “10—Very much”. Results obtained with the liking and familiarity questions were analyzed but not included in this manuscript. The data is available in the public repository of the research project.
2.6 Video labels
Threve labels were assigned to each video based on participants’ evaluations. Given that the evaluation of each participant towards each video was different, the label assigned to a video could vary across participants. Each label corresponds to one of the three dimensions of the ESM (Cacioppo et al., 1997): negativity, positivity, and net predisposition. For each of these three labels, two categories were defined: high and low. Given that the maximum value of the rating scales was 10, evaluations below 5 were labeled as “low,” and evaluations above 5 were labeled as “high.” Consequently, the labels for the negativity dimension were “high negativity” or “low negativity”; for the positivity dimension, “high positivity” or “low positivity”; and for the net predisposition dimension “high net predisposition” or “low net predisposition.”
2.7 Ethics
Ethical review and approval were not required for the study following local legislation and institutional requirements. The participants provided their written informed consent to participate in the study.
3 Signal processing
The signal processing steps consisted of four main steps: (1) preprocessing, (2) feature extraction, (3) feature selection, and (4) training and testing the classification models. Steps (3) and (4) were conducted 10 times for each participant. In each iteration, data were split into two sets: (a) feature selection set and (b) training and testing set. The trials allocated to each set were randomly selected in each iteration. Out of the 16 trials available for each participant, four were used for conducting feature selection. The remaining 12 trials were used for training and testing the classification models. This was intended to avoid double-dipping (i.e., training the classification models with the same data used for feature selection) (Ball et al., 2020). A flowchart describing the process is presented in Figure 3.
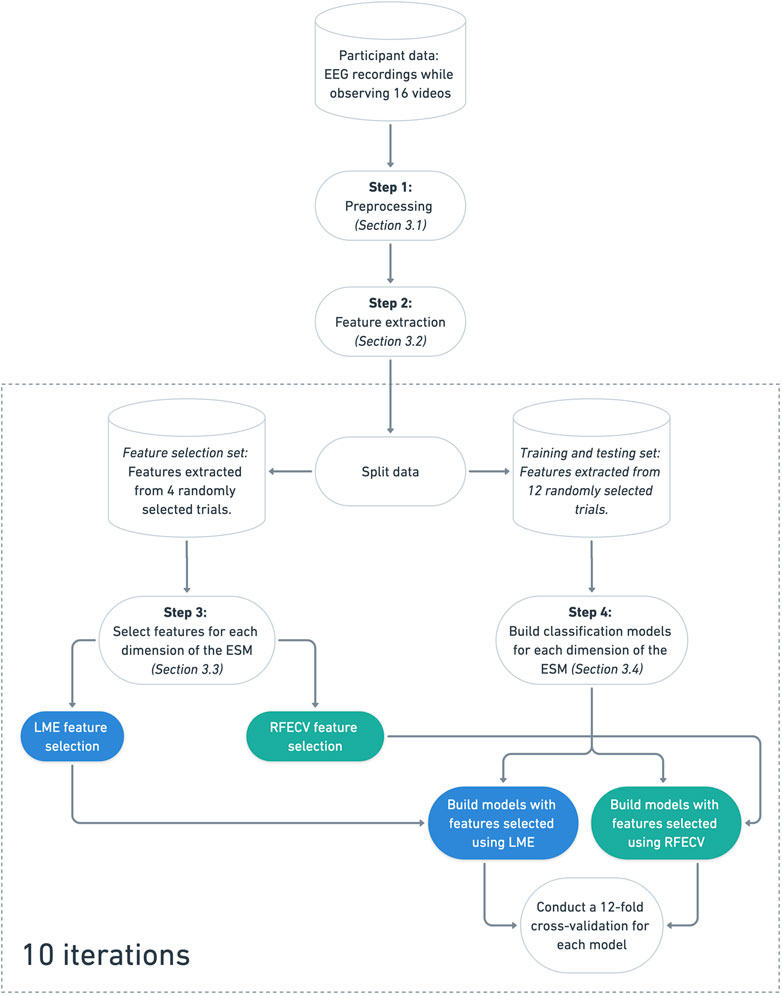
FIGURE 3. Flowchart describing the signal processing steps. Steps 3 and 4 were repeated 10 times for each participant. In each iteration, 4 trials were randomly selected and used for conducting feature selection with LME and RFECV. The remaining 12 trials were used for training and testing the classification models. A subset of features was selected for each affective dimension of the ESM (Cacioppo et al., 1997) (negativity, positivity, and net predisposition). The features selected with LME were used to build one classification model for each affective dimension. Likewise, the features selected with RFECV were used to build another three classification models (one per affective dimension). The models were trained using a Random Forest Classifier and evaluated with a 12-fold cross-validation.
Anomalies were found in the ECG and EMG data. Therefore, these signals were excluded from further analysis. The EMG data recorded at the Corrugator Supercilii muscle contained noise in all participants, possibly caused by the pressure of the HMD on the electrodes. In the ECG data, the LF/HF ratio (Thayer et al., 2009) was zero for all participants. The ECG and EMG data are available in the public repository of the research project.
3.1 Preprocessing
The following preprocessing steps were conducted on the EEG signals using EEGLAB 2021.1 (Delorme and Makeig, 2004):
1) Notch filter: Remove powerline noise using a notch filter at 50 Hz.
2) Remove bad channels: Remove channels where a flatline longer than 5 s is detected, or whose correlation with nearby channels is lower than 80%.
3) Remove artifacts: Remove artifacts caused by eye movements, eye blinks, and other noise sources using Artifact Subspace Reconstruction (ASR), a method designed for real-time artifact removal (Mullen et al., 2015).
4) Re-referencing: Perform common-average referencing.
5) Band-pass filter: Apply band-pass filter to remove frequencies below 4 Hz and above 45 Hz.
6) Extract epochs: Each video (trial) is equivalent to one epoch. Thus, the length of each epoch is 60 s.
7) Baseline removal: Remove the baseline of the 3 s prior to the beginning of each epoch.
8) Down-sampling: Down-sample to 128 Hz to increase processing speed.
3.2 Feature extraction
The features extracted from the EEG signals were defined based on a literature review conducted by the authors of this manuscript (Pinilla et al., 2021) and an affect detection technique proposed by Val-Calvo et al. (2019). Consequently, the following features were extracted using Python 3.10.4, AntroPy 0.1.4 (Vallat, 2022) and NumPy 1.22.3 (Harris et al., 2020):
1) Relative Power Spectral Density (RPSD) (Antons et al., 2014)
2) Frontal asymmetry (Huster et al., 2009)
3) Spectral envelope (Kraljevic et al., 2017)
4) Number of zero-crossings (Patil et al., 2016)
5) Katz fractal dimension (Akar et al., 2015)
6) Hjorth parameters (Mehmood and Lee, 2015)
7) Petrosian fractal dimension (Balan et al., 2020)
Each feature was extracted at each electrode site available for each participant. Given that some electrodes were automatically removed during the preprocessing step (see bad channel removal in Section 3.1), not all electrodes were available for all participants. Hence the number of features extracted for each participant varied according to the number of electrodes that were removed after preprocessing the signals.
Power Spectral Density (PSD) was extracted at each electrode site at the delta, theta, alpha, beta, and gamma power bands, using Welch’s method. This method splits a signal into overlapping segments and returns an average of the power across those segments. The size of those overlapping segments is defined with a sliding window. In this experiment, an 8 s sliding Hann window was used. Welch’s method returns an average of the power across contiguous segments of a signal. Therefore, it returns a single value instead of a time series. To extract the PSD as a time series, Welch’s method was applied multiple times across contiguous segments of the signal, using a 32 s sliding Hann window. The result was a time series of the PSD at each power band, at each electrode site available for each participant.
The Relative Power Spectral Density (RPSD) was calculated by dividing the PSD of each power band by the total power, yielding a time series of the RPSD at each power band, at each electrode site. Frontal asymmetry was obtained by subtracting the RPSD at electrode site F3 from the RPSD at F4, yielding a time series of the Frontal Asymmetry at each power band, similar to Huster et al. (2009). The other features (spectral envelope, number of zero-crossings, Katz fractal dimension, Hjorth parameters, and Petrosian fractal dimension) were also extracted using an 32 s sliding Hann window, yielding a time series for each feature, at each electrode site available for each participant.
3.3 Feature selection
Two methods were used for feature selection: (1) Linear Mixed-Effects (LME) and (2) Recursive Feature Elimination with Cross Validation (RFECV). Both methods were conducted 10 times for each participant. In each iteration, a group of features was selected for each of the three dimensions of the ESM (Cacioppo et al., 1997) (negativity, positivity, and net predisposition). Therefore, 60 groups of features were obtained for each participant (2 feature selection methods * 10 iterations * 3 affective dimensions).
As mentioned in Section 2.5, the data of each participant contained 16 trials. The data used for feature selection contained four trials that were randomly chosen for each affective dimension. Out of those four trials, two were labeled by the participant as “high” and the other two as “low” in the corresponding affective dimension (see Section 2.6 for more information related to the video labels). This process was repeated 10 times per participant.
3.3.1 Linear Mixed-Effects
Linear mixed-effects models were conducted to analyze the relationship between the features extracted from the EEG signals and the participant’s evaluation of the videos. The analysis was conducted using R and the lme4 package (Bates et al., 2015). For each feature extracted from each participant, three LME models were built. That is one LME model per affective dimension (negativity, positivity, and net predisposition). The fixed effects in all the models were the participant’s rating towards the videos in the dimension of interest and time stamp. The random effects were the intercepts for trial, as well as by-trial random slopes for the feature of interest. Each model was compared against a reduced model that had the same parameters as the full model, but did not contain the feature of interest. P-values were obtained by likelihood ratio tests of the full model against the reduced model. In this analysis, a statistically significant effect indicates that the feature included in the full model contains relevant information about the affective dimension of interest. Therefore, the features that led to likelihood ratio tests with a significant statistical effect (p < 0.5) were selected.
3.3.2 Recursive Feature Elimination with Cross Validation
RFECV was conducted individually for each participant, in each affective dimension of the ESM (Cacioppo et al., 1997). The estimator was a Random Forest Classifier with 100 trees. The data were labeled based on the ratings of each participant (see Section 2.6). The process was conducted with a 4-fold cross-validation. All folds contained an equal amount of samples.
3.4 Classification models
A Random Forest Classifier with 100 trees was used to build the classification models, similar to previous studies in affect detection (Liu et al., 2016; Gupta et al., 2018). Given that the feature selection was conducted 10 times per participant, the models were built 10 times per participant as well. In each iteration, the data used for training and testing the classification models contained the 12 trials that were not used for conducting the feature selection.
As previously mentioned, there were 60 groups of features per participant (10 iterations * 2 feature selection methods * 3 affective dimensions). One classification model was built with each of those groups of features. Each classification model was evaluated using 12-fold cross-validation. All folds contained an equal amount of samples.
Accuracy, precision, recall, and F1-score were obtained for each fold. The values obtained for each of those metrics were averaged in two steps. First, means were calculated across the 12 folds. Then, values were averaged across trials, yielding the mean performance metrics for each participant. In the context of this study, accuracy is the portion of videos that were correctly classified; Precision is the portion of videos classified as “high negativity”, “high positivity” or “high net predisposition” that were correctly classified; Recall is the portion of videos previously labeled as “high negativity”, “high positivity” or “high net predisposition” that were correctly classified; And F1-score is the harmonic mean of precision and recall.
4 Results
A two-way repeated measures ANOVA was conducted to analyze whether the feature selection method (LME vs. RFE) had an effect on the accuracy of the classification models for each affective dimension (negativity, positivity, net predisposition). A Shapiro-Wilk test suggested that the assumption of normal distribution was met, W = 0.984, p > 0.05. The assumption of sphericity was met as well, as assessed by Mauchly’s test, X2 (2) = 0.533, p > 0.05. There was no significant two-way interaction, F(2, 34) = .09, p > 0.05, ηp 2 = .001.
The mean accuracy of the models trained with the features selected using LME was slightly higher than the accuracy of the models trained with the features selected using RFECV. The accuracy of the negativity classification models was 1.25% higher for LME (M = 92.03%, SD = 4.58) than for RFECV (M = 90.78%, SD = 5.07). Likewise, the accuracy of positivity classification models was 0.84% higher for LME (M = 92.86%, SD = 4.67) than for RFECV (M = 92.02%, SD = 4.18). In the net predisposition dimension, the accuracy of the LME models (M = 92.18%, SD = 2.87) was 1.18% higher than the RFECV models (M = 91%, SD = 4.08). Yet, no significant effect was found for the main effect of feature selection method, F (1,106) = 1.787. p > 0.05, ŋp2 = 0.017, indicating that the differences between LME and RFECV were not statistically significant.
Precision, recall, and F1-score performance metrics were obtained for each model. Those metrics were not analyzed in the ANOVA. Instead, they have been included in Table 1.
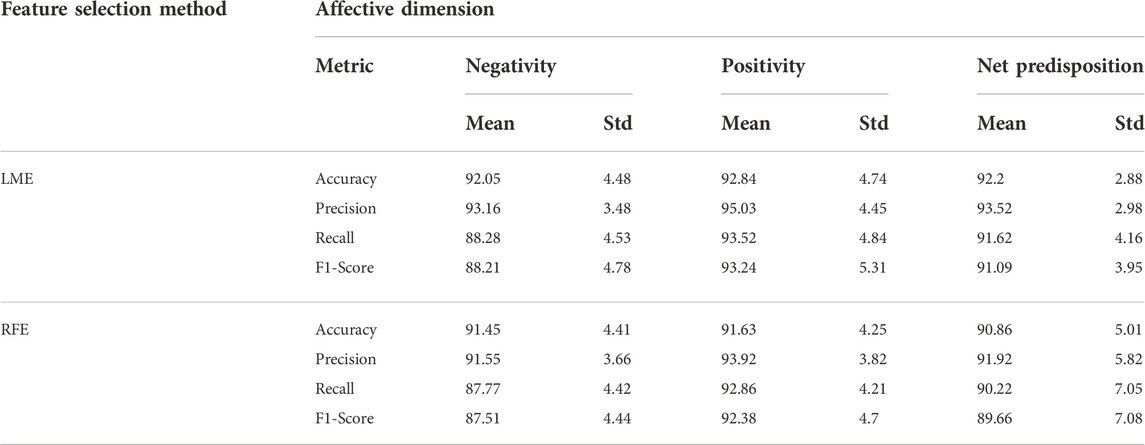
TABLE 1. Mean accuracy, precision, recall and F1-score obtained for each affective dimension of the ESM (Cacioppo et al., 1997). Values were obtained with a 12-fold cross-validation (see Section 3.4). Means were obtained in three steps. First, values were averaged across folds. Then, values were averaged across iterations (10 iterations per participant). Finally, means and standard deviation were calculated across participants.
5 Discussion
A technique for real-time affect detection is proposed in this manuscript. The technique was tested with data from an experiment conducted in VR, where participants’ affective responses were analyzed in terms of the three dimensions of the ESM (Cacioppo et al., 1997): negativity, positivity, and net predisposition.
The data was analyzed by emulating the steps that would be conducted in a real-time analysis. The process consists of four steps: (1) preprocess the EEG data to increase the signal-to-noise ratio (2) extract features using a sliding window; (3) for each affective dimension of the ESM (Cacioppo et al., 1997), select features using two methods: Linear Mixed-Effects (LME) and Recursive Feature Elimination with Cross Validation (RFECV); (4) build the classification models with the selected features.
A two-way repeated measures ANOVA was conducted to compare the mean accuracy of the classification models obtained with each feature selection method (LME vs. RFECV). No statistically significant differences were found. Yet, LME led to classification models slightly more accurate than their RFECV counterparts. The mean accuracy obtained with both feature selection methods was between 87% and 93%, suggesting that the proposed technique leads to reliable results, regardless of the feature selection method used (see Figure 4). These results are consistent with previous studies in affect recognition using EEG signals, where classification models with an accuracy of 90.77% (Xu and Plataniotis, 2012) and 90.4% (Song et al., 2018) were reported. However, those studies used neural networks, while the technique proposed in this manuscript used Random Forest.
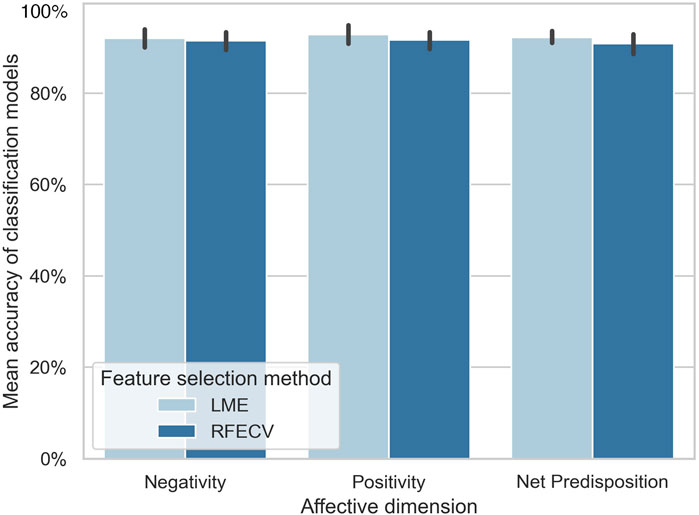
FIGURE 4. Mean accuracy of the classification models for each affective dimension of the ESM (Cacioppo et al., 1997). The accuracy of the classification models trained with features selected using LME was not statistically significantly different than the accuracy of the models trained with features selected using RFECV. The accuracy of the classification models was similar across affective dimensions. Error bars depict CI, 95%.
The high accuracy of the technique is attributed to at least three factors: (1) the models were trained with the data of each participant, reducing potential biases caused by individual differences between participants; (2) the classification models were built separately for each affective dimension, including in each model only the most relevant features for each affective dimension; and (3) the features were extracted from the EEG signals using a sliding window, capturing variations across time for each feature.
Previous studies point out that cross-validation schemes, such as RFECV, assume independence between samples. Therefore, they are not able to capture the sequential nature of time series (Val-Calvo et al., 2019). In contrast, LME models are able to capture variations across time (see Section 3.3.1). Given that all features extracted in this study were time series, it was expected that the classification models trained with features selected using LME would outperform the classification models trained with features selected using RFECV. Yet, no statistically significant difference was found between the feature selection methods. This finding suggests that cross-validation schemes are suitable for time series feature selection.
The correlation between the selected features was not analyzed in this manuscript. Usually, training a classification model with features that are highly correlated (i.e., presence of multicollinearity) does not increase or decrease its predictive power. However, it can compromise the performance of the technique, because including additional features implies consuming additional computational resources. It is likely that there was multicollinearity in the features selected with LME. It is less likely that this occurred in the features selected with RFECV because this method eliminates recursively the features that do not add predictive power to the classification model. In this regard, RFECV has a key advantage as compared to LME, because it might require fewer computational resources to achieve a similar result.
Similar to most statistical tests, LME models must meet a series of assumptions. One of the challenges in using LME for feature selection for real-time analysis lies in the difficulty of assessing those assumptions automatically. Usually, the assumption of normal distribution in LME models is assessed by visual inspection of Q-Q plots, while the assumptions of linearity and homoscedasticity are assessed by visual inspection of residual plots. However, it is not feasible to visually assess each of those plots in a real-time analysis. A possible solution for this challenge would require building an image recognition model for automatically analyzing Q-Q plots and residual plots, with the aim of estimating whether a given LME model fulfills the assumptions of normal distribution, linearity, and homoscedasticity.
Additional research is required to analyze whether the results reported in this study can be replicated with other datasets. At the same time, it might be useful to conduct additional studies to analyze whether the proposed technique can be extrapolated to other theoretical models. In this manuscript, affective states were analyzed in terms of the Evaluative Space Model (ESM) (Cacioppo et al., 1997). However, there are other theoretical models, such as the Circumplex Model of Affect (Russell, 1980), or Plutchnik’s structural model of emotions (Plutchik, 1982), which might be preferable depending on the intended use case.
In this manuscript, the data was processed emulating the steps that would be conducted in a real-time setting. The next step is to implement the proposed technique into a prototype of a Brain-Computer Interface that is integrated into a VR system. There is a software framework that could ease this process, called the Excite-O-Meter (Quintero et al., 2021). This framework provides the core software components required for recording, analyzing, and visualizing bodily signals in VR. Likewise, Semertzidis et al. (2020) built a BCI for affect communication between dyads in Augmented Reality (AR) systems, called Neo-Noumena. This system could be used as a framework for implementing the technique proposed in the manuscript into an AR system.
Yet, the proposed technique is not ready for use in VR/AR experiences that require motor movements from the user. The experiment presented in this manuscript was conducted in a virtual reality environment where participants were not moving. This was intended to reduce the presence of artifacts caused by body movements. Additional research is required to analyze the performance of the proposed technique in non-stationary settings (Gramann et al., 2011). This could be achieved using a spatial navigation task that involves emotional stimuli, similar to Palmiero and Piccardi (2017). The analysis of the mobile EEG data could be conducted using existing toolboxes for this purpose, such as MoBILAB (Ojeda et al., 2014) and BeMoBil (Klug et al., 2018). However, those toolboxes are not suitable for real-time analysis. Additional research is required to understand how to remove artifacts from EEG signals, in an online fashion, during non-stationary experiments.
6 Conclusion
This manuscript explores the development of a technique for inferring affective states from electroencephalography (EEG) signals. The technique was tested in an experiment conducted in Virtual Reality. The data was analyzed emulating the steps that would be conducted for real-time affect detection. The feature selection was conducted using two methods: Linear Mixed-Effects (LME) analysis and Recursive Feature Elimination with Cross Validation (RFECV). An ANOVA was conducted to analyze whether the accuracy of the classification models was influenced by the feature selection method. A statistically significant interaction was not found. Both feature selection methods lead to classification models with similar accuracy. The classification models were trained one at a time for each affective dimension of the ESM (Cacioppo et al., 1997): negativity, positivity, and net predisposition. The accuracy of the models was between 87% and 93% across these three affective dimensions. Further work is required to (1) analyze the performance of the proposed technique with a larger population, in non-stationary settings, and (2) implement the proposed technique into a Brain-Computer Interface (BCI) that is integrated into a VR/AR system.
Data availability statement
All the data recorded during this study and reports generatedduring the analysis can be found in the public repository of theresearch project : https://osf.io/7v9kt/.
The code used for analyzing the data is open source and available at https://github.com/aepinilla/affect_detection.
Ethics statement
Ethical review and approval was not required for the study on human participants in accordance with the local legislation and institutional requirements. The patients/participants provided their written informed consent to participate in this study.
Author contributions
JV and SM contributed to the study conception and signal processing. JG and WR proof-read the manuscript and contributed to the Machine Learning component of the study. AP conducted the experiment, data analysis, and wrote the first draft. All authors commented on previous versions of the manuscript.
Funding
This work was supported by the strategic partnership between the Technische Universität Berlin, Germany, and the University of Technology Sydney, Australia. Additional support was provided by the School of Computer Science from the Faculty of Engineering and IT, University of Technology Sydney.
Acknowledgments
We are thankful to Kerstin Pieper for sharing her knowledge on electrophysiology; to Robert Spang for his early feedback in the design of the experiment; to Tilo Himmelsbach for his help with the code; and to Michael Gaebler, whose questions were particularly useful to improve this manuscript. We acknowledge support from the German Research Foundation and the Open Access Publication Fund of TU Berlin.
Conflict of interest
The authors declare that the research was conducted in the absence of any commercial or financial relationships that could be construed as a potential conflict of interest.
Publisher’s note
All claims expressed in this article are solely those of the authors and do not necessarily represent those of their affiliated organizations, or those of the publisher, the editors and the reviewers. Any product that may be evaluated in this article, or claim that may be made by its manufacturer, is not guaranteed or endorsed by the publisher.
References
Akar, S. A., Kara, S., Agambayev, S., and Bilgic¸, V. (2015). “Nonlinear analysis of eeg in major depression with fractal dimensions,” in Proceeding of the 2015 37th Annual International Conference of the IEEE Engineering in Medicine and Biology Society (EMBC), Milan, Italy, August 2015 (IEEE), 7410–7413.
Akbar, S., Martinez-Enriquez, A., Aslam, M., and Saleem, R. (2021). “Feature analysis of eeg based brain computer interfaces to detect motor imagery,” in International conference on brain informatics (Springer), 509–518.
Antons, J.-N., Arndt, S., Schleicher, R., and Moller, S. (2014). “Brain activity correlates of quality of¨ experience,” in Quality of experience. Series title: T-labs series in telecommunication services. Editors S. Moller, and A. Raake (Cham: Springer International Publishing), 109–119. [Online]. Available: http://link.springer.com/10.1007/978-3-319-02681-78.
Antons, J.-N. (2015). Neural correlates of quality perception for complex speech signals, 1st ed., ser. T-labs series in telecommunication services. Cham: Springer International Publishing : Imprint: Springer.
Baghaei, N., Stemmet, L., Khaliq, I., Ahmadi, A., Halim, I., Liang, H.-N., et al. (2021). “Designing individualised virtual reality applications for supporting depression: A feasibility study,” in Companion of the 2021 ACM SIGCHI symposium on engineering interactive computing systems, ser. EICS ’21 (New York, NY, USA: Association for Computing Machinery), 6–11.
Balan, O., Moise, G., Petrescu, L., Moldoveanu, A., Leordeanu, M., and Moldoveanu, F. (2020). Emotion˘ classification based on biophysical signals and machine learning techniques. Symmetry 12, 21. doi:10.3390/sym12010021
Ball, T. M., Squeglia, L. M., Tapert, S. F., and Paulus, M. P. (2020). Double dipping in machine learning: Problems and solutions. Biol. Psychiatry Cognitive Neurosci. Neuroimaging 5 (3), 261–263. doi:10.1016/j.bpsc.2019.09.003
Barlow, D. (1991). “The nature of anxiety: Anxiety, depression and emotional disorders,” in Chronic anxiety: Generalized anxiety disorder and mixed anxiety-depression. Editors R. M. Rapee, and D. H. Barlow (New York, NY: Guilford Press), 1–28.
Bates, D., Machler, M., Bolker, B., and Walker, S. (2015). Fitting linear mixed-effects models using lme4. J. Stat. Softw. 67, 1–48. doi:10.18637/jss.v067.i01
Bermudez i Badia, S., Quintero, L. V., Cameirao, M. S., Chirico, A., Triberti, S., Cipresso, P., et al. (2019). Toward emotionally adaptive virtual reality for mental health applications. IEEE J. Biomed. Health Inf. 23 (5), 1877–1887. doi:10.1109/jbhi.2018.2878846
Blandon, D. Z., Mu´ noz, J. E., Lopez, D. S., and Gallo, O. H. (2016). “Influence of a BCI neurofeedback˜ videogame in children with ADHD. Quantifying the brain activity through an EEG signal processing dedicated toolbox,” in Proceeding of the 2016 IEEE 11th Colombian Computing Conference (CCC), Popayan, Colombia, September 2016 (IEEE), 1–8.
Brook, M., and Kosson, D. S. (2013). Impaired cognitive empathy in criminal psychopathy: Evidence from a laboratory measure of empathic accuracy. J. Abnorm. Psychol. 122 (1), 156–166. publisher: American Psychological Association. doi:10.1037/a0030261
Brouwer, A.-M., Zander, T. O., van Erp, J. B. F., Korteling, J. E., and Bronkhorst, A. W. (2015). Using neurophysiological signals that reflect cognitive or affective state: Six recommendations to avoid common pitfalls. Front. Neurosci. 9, 136. doi:10.3389/fnins.2015.00136
Cacioppo, J. T., Gardner, W. L., and Berntson, G. G. (1997). Beyond bipolar conceptualizations and measures: The case of attitudes and evaluative Space. Pers. Soc. Psychol. Rev. 1 (1), 3–25. doi:10.1207/s15327957pspr0101_2
Cao, K., Liu, Y., Meng, G., and Sun, Q. (2020). An overview on edge computing research. IEEE Access 8, 85714–85728. doi:10.1109/ACCESS.2020.2991734
Davidson, R. J. (1992). Emotion and affective style: Hemispheric substrates. Psychol. Sci. 3 (1), 39–43. doi:10.1111/j.1467-9280.1992.tb00254.x
Delorme, A., and Makeig, S. (2004). Eeglab: An open source toolbox for analysis of single-trial EEG dynamics including independent component analysis. J. Neurosci. Methods 134 (1), 9–21. doi:10.1016/j.jneumeth.2003.10.009
Dimberg, U., Thunberg, M., and Elmehed, K. (2000). Unconscious facial reactions to emotional facial expressions. Psychol. Sci. 11 (1), 86–89. doi:10.1111/1467-9280.00221
Gramann, K., Gwin, J. T., Ferris, D. P., Oie, K., Jung, T.-P., Lin, C.-T., et al. (2011). Cognition in action: Imaging brain/body dynamics in mobile humans. Rev. Neurosci. 22 (6), 593–608. doi:10.1515/RNS.2011.047
Gupta, V., Chopda, M. D., and Pachori, R. B. (2018). Cross-subject emotion recognition using flexible analytic wavelet transform from eeg signals. IEEE Sens. J. 19 (6), 2266–2274. doi:10.1109/jsen.2018.2883497
Guy, G. (2016). Virtual Desktop. Vancouver, British Columbia: Virtual Desktop, Inc. https://www.vrdesktop.net/.
Harris, C. R., Millman, K. J., van der Walt, S. J., Gommers, R., Virtanen, P., Cournapeau, D., et al. (2020). Array programming with NumPy. Nature 585, 357–362. doi:10.1038/s41586-020-2649-2
Hofmann, S. M., Klotzsche, F., Mariola, A., Nikulin, V. V., Villringer, A., and Gaebler, M. (2018). “Decoding subjective emotional arousal during a naturalistic VR experience from EEG using LSTMs,” in Proceedings of the 2018 IEEE International Conference on Artificial Intelligence and Virtual Reality (AIVR), Taichung, Taiwan, December 2018 (IEEE), 128–131.
Hofmann, S. M., Klotzsche, F., Mariola, A., Nikulin, V., Villringer, A., and Gaebler, M. (2021). Decoding subjective emotional arousal from eeg during an immersive virtual reality experience. eLife 10, e64812. doi:10.7554/eLife.64812
Huster, R. J., Stevens, S., Gerlach, A. L., and Rist, F. (2009). A spectralanalytic approach to emotional responses evoked through picture presentation. Int. J. Psychophysiol. 72 (2), 212–216. doi:10.1016/j.ijpsycho.2008.12.009
Khosrowabadi, R., Quek, C., Ang, K. K., and Wahab, A. (2014). Ernn: A biologically inspired feedforward neural network to discriminate emotion from EEG signal. IEEE Trans. Neural Netw. Learn. Syst. 25 (3), 609–620. doi:10.1109/tnnls.2013.2280271
Klug, M., Gehrke, L., Friederike U., H., and Gramann, K. (2018). The BeMoBIL pipeline - facilitating mobile brain/body imaging (MoBI) data analysis in MATLAB.
Koelstra, S., Muhl, C., Soleymani, M., Lee, J. S., Yazdani, A., Ebrahimi, T., et al. (2012). Deap: A database for emotion analysis ;using physiological signals. IEEE Trans. Affect. Comput. 3 (1), 18–31. doi:10.1109/t-affc.2011.15
Kraljevic, L., Russo, M., and Sikora, M. (2017). “Emotion classification using linear predictive features on´ wavelet-decomposed eeg data,” in Proceeding of the 2017 26th IEEE International Symposium on Robot and Human Interactive Communication (RO-MAN), Lisbon, Portugal, September 2017 (IEEE), 653–657.
Kruger, C., Kojic, T., Meier, L., Moller, S., and Voigt-Antons, J.-N. (2020). “Development and validation of pictographic scales for rapid assessment of affective states in virtual reality,” in Proceeding of the 2020 Twelfth International Conference on Quality of Multimedia Experience (QoMEX), Athlone, Ireland, May 2020 (IEEE), 1–6.
Liu, J., Meng, H., Nandi, A., and Li, M. (2016). “Emotion detection from eeg recordings,” in Proceeding of the 2016 12th international conference on natural computation, fuzzy systems and knowledge discovery (ICNCFSKD), Changsha, China, August 2016 (IEEE), 1722–1727.
Lombard, M., Reich, R., Grabe, M., Bracken, C., and Ditton, T. (2000). Presence and television: The role of screen size. Hum. Commun. Res. 26 (1), 75–98. doi:10.1093/hcr/26.1.75
Mattek, A. (2011). “Emotional communication in computer generated music: Experimenting with affective algorithms,” in Proceedings of the 26th Annual Conference of the Society for Electro-Acoustic Music in the United States, January 2011.
Mehmood, R. M., and Lee, H. J. (2015). Towards emotion recognition of eeg brain signals using hjorth parameters and svm. Adv. Sci. Technol. Lett. Biosci. Med. Res. 91, 24–27. doi:10.14257/ASTL.2015.91.05
Mullen, T. R., Kothe, C. A. E., Chi, Y. M., Ojeda, A., Kerth, T., Makeig, S., et al. (2015). Real-time neuroimaging and cognitive monitoring using wearable dry EEG. IEEE Trans. Biomed. Eng. 62 (11), 2553–2567. doi:10.1109/tbme.2015.2481482
Ojeda, A., Bigdely-Shamlo, N., and Makeig, S. (2014). Mobilab: An open source toolbox for analysis and visualization of mobile brain/body imaging data. Front. Hum. Neurosci. 8, 121. doi:10.3389/fnhum.2014.00121
Palmiero, M., and Piccardi, L. (2017). The role of emotional landmarks on topographical memory. Front. Psychol. 8, 763. doi:10.3389/fpsyg.2017.00763
Patil, A., Deshmukh, C., and Panat, A. (2016). “Feature extraction of eeg for emotion recognition using hjorth features and higher order crossings,” in Proceeding of the 2016 Conference on Advances in Signal Processing (CASP), Pune, India, June 2016 (IEEE), 429–434.
Peirce, J., Gray, J. R., Simpson, S., MacAskill, M., Hochenberger, R., Sogo, H., et al. (2019). PsychoPy2: Experiments in behavior made easy. Behav. Res. Methods 51 (1), 195–203. doi:10.3758/s13428-018-01193-y
Perkis, A., Timmerer, C., Barakovic, S., Husi´ c, J. B., Bech, S., Bosse, S., et al. (2020). Qualinet white paper on definitions of immersive media experience (imex), 05.
Pfurtscheller, G., and Lopes da Silva, F. (1999). Event-related EEG/MEG synchronization and desynchronization: Basic principles. Clin. Neurophysiol. 110 (11), 1842–1857. doi:10.1016/s1388-2457(99)00141-8
Picard, R., Vyzas, E., and Healey, J. (2001). Toward machine emotional intelligence: Analysis of affective physiological state. IEEE Trans. Pattern Anal. Mach. Intell. 23 (10), 1175–1191. doi:10.1109/34.954607
Pinilla, A., Tamayo, R. M., and Neira, J. (2020). How do induced affective states bias emotional contagion to faces? A three-dimensional model. Front. Psychol. 11, 97. doi:10.3389/fpsyg.2020.00097
Pinilla, A., Garcia, J., Raffe, W., Voigt-Antons, J.-N., Spang, R. P., and Moller, S. (2021). Affective Visualization¨ in virtual reality: An integrative review. Front. Virtual Real. 2, 630731. doi:10.3389/frvir.2021.630731
Plutchik, R. (1982). A psychoevolutionary theory of emotions. Soc. Sci. Inf. 21 (4-5), 529–553. doi:10.1177/053901882021004003
Quintero, L., Munoz, J. E., Mooij, J. d., and Gaebler, M. (2021). “Excite-o-meter: Software framework to˜ integrate heart activity in virtual reality,” in Proceeding of the 2021 IEEE International Symposium on Mixed and Augmented Reality (ISMAR), Bari, Italy, October 2021 (IEEE), 357–366.
Ray, W., and Cole, H. (1985). EEG alpha activity reflects attentional demands, and beta activity reflects emotional and cognitive processes. Science 228 (4700), 750–752. doi:10.1126/science.3992243
Riha, C., Guntensperger, D., Kleinjung, T., and Meyer, M. (2020). Accounting for heterogeneity: Mixed-Effects¨ models in resting-state EEG data in a sample of tinnitus sufferers. Brain Topogr. 33 (4), 413–424. doi:10.1007/s10548-020-00772-7
Russell, J. A. (1980). A circumplex model of affect. J. Personality Soc. Psychol. 39 (6), 1161–1178. doi:10.1037/h0077714
Semertzidis, N., Scary, M., Andres, J., Dwivedi, B., Kulwe, Y. C., Zambetta, F., et al. (2020). “Neo- noumena: Augmenting emotion communication,” in Proceedings of the 2020 CHI conference on human factors in computing systems (Honolulu HI USA: ACM), 1–13.
Shiban, Y., Reichenberger, J., Neumann, I. D., and Muhlberger, A. (2015). Social conditioning and extinction¨ paradigm: A translational study in virtual reality. Front. Psychol. 6, 400. doi:10.3389/fpsyg.2015.00400
Singh, A. K., and Tao, X. (2020). “BCINet: An optimized convolutional neural network for EEG-based brain-computer interface applications,” in 2020 IEEE Symposium Series on Computational Intelligence (SSCI), Canberra, ACT, Australia, 01-04 December 2020, 582–587. doi:10.1109/SSCI47803.2020.9308292
Song, T., Zheng, W., Song, P., and Cui, Z. (2018). Eeg emotion recognition using dynamical graph convolutional neural networks. IEEE Trans. Affect. Comput. 11 (3), 532–541. doi:10.1109/taffc.2018.2817622
Tavares Vasconcelos Oliveira, F., Gay, V., and Garcia Marin, J. (2021). “Games for the cognitive assessment of older adults,” in 6th international conference on gamification and serious games.
Thayer, J. F., Hansen, A. L., Saus-Rose, E., and Johnsen, B. H. (2009). Heart rate variability, prefrontal neural function, and cognitive performance: The neurovisceral integration perspective on self-regulation, adaptation, and health. Ann. Behav. Med. 37 (2), 141–153. doi:10.1007/s12160-009-9101-z
Tripathi, S., Acharya, S., Sharma, R. D., Mittal, S., and Bhattacharya, S. (2017). “Using deep and convolutional neural networks for accurate emotion classification on deap dataset,” in Twenty-ninth IAAI conference.
Val-Calvo, M., Alvarez S´ anchez, J. R., Ferr´ andez-Vicente, J. M., and Fern´ andez, E. (2019). Optimization of´ real-time EEG artifact removal and emotion estimation for human-robot interaction applications. Front. Comput. Neurosci. 13, 80. doi:10.3389/fncom.2019.00080
Vallat, R. (2022). AntroPy. [Online]. Available: https://github.com/raphaelvallat/antropy.
Visch, V. T., Tan, E. S., and Molenaar, D. (2010). The emotional and cognitive effect of immersion in film viewing. Cognition Emot. 24 (8), 1439–1445. doi:10.1080/02699930903498186
Xu, H., and Plataniotis, K. N. (2012). “Affect recognition using eeg signal,” in Proceeding of the 2012 IEEE 14th International Workshop on Multimedia Signal Processing (MMSP), Banff, AB, Canada, September 2012 (IEEE), 299–304.
Yin, Z., Wang, Y., Liu, L., Zhang, W., and Zhang, J. (2017). Cross-subject eeg feature selection for emotion recognition using transfer recursive feature elimination. Front. Neurorobot. 11, 19. doi:10.3389/fnbot.2017.00019
Zander, T. O., and Kothe, C. (2011). Towards passive brain–computer interfaces: Applying brain–computer interface technology to human–machine systems in general. J. Neural Eng. 8 (2), 025005. doi:10.1088/1741-2560/8/2/025005
Zanetti, R., Arza, A., Aminifar, A., and Atienza, D. (2022). Real-time eeg-based cognitive workload monitoring on wearable devices. IEEE Trans. Biomed. Eng. 69 (1), 265–277. doi:10.1109/tbme.2021.3092206
Keywords: affect detection, electroencephalography, virtual reality, emotion, affective computing, supervised learning, machine learning, feature selection
Citation: Pinilla A, Voigt-Antons J-N, Garcia J, Raffe W and Möller S (2023) Real-time affect detection in virtual reality: a technique based on a three-dimensional model of affect and EEG signals. Front. Virtual Real. 3:964754. doi: 10.3389/frvir.2022.964754
Received: 09 June 2022; Accepted: 23 November 2022;
Published: 05 January 2023.
Edited by:
J. Adam Jones, Mississippi State University, United StatesReviewed by:
Corey Bohil, University of Central Florida, United StatesGurjot Singh, Fairleigh Dickinson University, United States
Copyright © 2023 Pinilla, Voigt-Antons, Garcia, Raffe and Möller. This is an open-access article distributed under the terms of the Creative Commons Attribution License (CC BY). The use, distribution or reproduction in other forums is permitted, provided the original author(s) and the copyright owner(s) are credited and that the original publication in this journal is cited, in accordance with accepted academic practice. No use, distribution or reproduction is permitted which does not comply with these terms.
*Correspondence: Andres Pinilla, andres.pinilla@qu.tu-berlin.de
†ORCID: Andres Pinilla, orcid.org/0000-0002-0812-7896; Jan-Niklas Voigt-Antons, orcid.org/0000-0002-2786-9262; Jaime Garcia, orcid.org/0000-0001-5718-1605; William Raffe, orcid.org/0000-0001-5310-0943; Sebastian Möller, orcid.org/0000-0003-3057-0760