Does this virtual food make me hungry? effects of visual quality and food type in virtual reality
 Florian Ramousse1*
  Pierre Raimbaud1
  Patrick Baert1
  Clémentine Helfenstein-Didier2
  Aurélia Gay3
  Catherine Massoubre4
  Bogdan Galusca3,5
  Guillaume Lavoué1
- 1University Lyon, Centrale Lyon, Centre National de la Recherche Scientifique, INSA Lyon, Université Claude-Bernard-Lyon-1, Laboratoire d’InfoRmatique en Image et Systèmes d’information, UMR5205, Ecole Nationale d’Ingénieurs de Saint-Etienne, Écully, France
- 2University Lyon, Centrale Lyon, UMR Centre National de la Recherche Scientifique, Laboratoire de Tribologie et Dynamique des Systèmes, Écully, France
- 3Eating Disorders, Addictions and Extreme Bodyweight Research Group (TAPE), EA7423, University Department of Psychiatry, CHU Saint-Etienne, Jean Monnet University, Saint-Etienne, France
- 4University Department of Psychiatry, Eating Disorders, CHU Saint-Etienne, Jean Monnet University, Saint-Etienne, France
- 5Division of Endocrinology, Diabetes, Metabolism and Eating Disorders, CHU Saint-Étienne, Saint-Etienne, France
Introduction: Studies into food-related behaviors and emotions are increasingly being explored with Virtual Reality (VR). Applications of VR technologies for food science include eating disorder therapies, eating behavior studies and sensory analyzes. These applications involve 3D food stimuli intended to elicit cravings, stress, and/or emotions. However, the visual quality (i.e., the realism) of used food stimuli is heterogeneous, and this factor’s influence on the results has never been isolated and evaluated. In this context, this work aims to study how the visual quality of food stimuli, exposed in a virtual reality environment, influences the resulting desire to eat.
Methods: 28 subjects without eating disorders were included in this protocol, who evaluated the desire to eat induced by 10 3D food stimuli, each duplicated in 7 quality levels (for a total of 70 stimuli).
Results: Results show that visual quality influences the desire to eat, and this effect depends on the type of food and users’ eating habits. We found two significant thresholds for visual quality: the first provides the minimal quality necessary to elicit a significant desire to eat, while the second provides the ceiling value above which increasing the quality does not improve further the desire to eat.
Discussion: These results allow us to provide useful recommendations for the design of experiments involving food stimuli.
1 Introduction
Immersive virtual reality (VR) technologies are becoming more and more promising for cognitive behavioral therapy and food science. Their evolution as well as the graphic computing capacities of Personal Computers (PC) now allow complex and rich 3D environments to be displayed. Integration and evaluation of food contents in VR have increased in the last few years, as evidenced in literature by recent reviews in the sensory and consumer science field (Wang et al., 2021) and for eating disorders rehabilitation (So et al., 2022). Studies involving food contents in virtual environments have different goals linked to the desire to eat elicited by the food stimuli (product selection, food evaluation, eating disorder diagnosis and therapy); the 3D food models considered in these studies are heterogeneous: they come from different creation process (e.g., manual design, photogrammetry) and thus exhibit different degrees of visual quality. This visual quality may have a significant influence on the outcomes of these studies, but this influence has never been demonstrated or isolated.
Therefore, in this paper, we present a study designed to evaluate the influence of the graphical quality of 3D food models on the desire to eat they arouse, in a virtual environment.
For this purpose, we conducted a user experiment in virtual reality; participants (N = 28) were asked to report their eating desire for a large number of 3D food stimuli of different types and different visual qualities. Results allow us to draw relevant conclusions and recommendations for the design of VR environments and experiments involving food stimuli.
The remainder of this paper is organized as follows. Section 2 reviews the related work about the use of food stimuli in VR. Section 3 presents our objectives and hypotheses. Section 4 describes the creation of the stimuli and the design of the VR environment as well as the materials. Section 5 presents the conducted experiment. Results and discussion are provided in Section 6 and Section 7, respectively. Finally, in Section 8, we conclude and propose several perspectives.
2 State of the art
The study of food-related behaviors and feelings tends to develop more and more in VR immersive environments. Uses of food stimuli have been shown to be as effective as real ones, even stronger in some cases (van der Waal et al., 2021), and more effective than static images in generating emotional responses (Gorini et al., 2010). Multiple use cases of VR technologies for food science are identifiable and can be classified into different categories (Xu et al., 2021). Particularly, rehabilitation of eating disorders through the use of VR is considered as a promising strategy for assessments and treatments of these kinds of disorders (de Carvalho et al., 2017). So et al. (2022) published a survey that highlighted such rehabilitation studies in VR, despite their limited number. Virtual buffet in VR has also been used for evaluating non-conscious and uncontrollable aspects of food selection, or as a validated tool for studies on food preferences (Marcum et al., 2018; Persky et al., 2018; Ung et al., 2018; Cheah et al., 2020). Nutrition education also finds interest, especially for child feeding research (Persky et al., 2018). Finally, physiological measurements are also increasingly used in food-related VR experiments, especially gaze behavior (due to the increasing implementation of eye-trackers in VR head-mounted displays), e.g., for studying the effect of food presence on visual attention behavior (Hummel et al., 2018) or eye activity during a food choice experiment (Machín et al., 2019). Techniques used to create the 3D food stimuli used in these experiments are variable. Photogrammetry is frequently used to create and display realistic content in VR. Alba-Martínez et al. (2022) compared real cakes and 3D cakes made using a photogrammetric process for a visual characterization task. Chen et al. (2020) used scanned prepared foods with real-life proportions in a VR buffet to assess food selection processes. Gouton et al. (2021) captured real-life cookies by a photogrammetric process to reproduce conditions for validation of attribute characterization in VR. 360° video is also a method to reproduce a 3D environment in a realistic way. For example, Crofton et al. (2021) used 360° video to reproduce multiple contextual conditions for beef steaks and chocolate sensory analyzes. 3D food stimuli can also be created with 3D modeling software. Persky et al. (2018) used this modeling process to create a VR buffet for child feeding assessment. van der Waal et al. (2021) and Ammann et al. (2020) reproduced respectively chocolate, juices, and cakes using 3D modeling to study the color influence on flavor identification. This plurality of means used to create 3D food stimuli leads to disparate levels of realism and visual quality. Usually, food stimuli created using 3D modeling software are of lower visual quality and realism than those created by photogrammetry. The potential impact of this visual quality on the observed results has not been studied yet. Therefore, our study will focus on examining how the visual quality of food stimuli in virtual reality influences the elicited desire to eat.
The 3D environment (i.e., the visual context of the food stimuli) is also a factor that has been shown to influence the desire to eat. Specifically, the type of environment and the evoked context (i.e., conditions where the food is supposed to be consumed (Meiselman, 2006)) influence the appreciation scores of food contents in an immersive environment (Meiselman et al., 2000). An environment consistent with the product where it should be consumed generally makes the product more appealing (Picket and Dando, 2019) and situational appropriateness is more and more considered in recent research topics (Schöniger, 2022). Appreciation scores are lower under artificial eating conditions (e.g., laboratory) than from naturalistic eating conditions (Delarue and Boutrolle, 2010). Schöniger (2022) confirmed the aforementioned observation between immersive and laboratory environments. Since the aim of our study is to isolate and evaluate the effect of the visual quality of the food stimuli, we chose a neutral visual context (a sensory analysis booth) to avoid the effect of this context (which depends on the type of food), even if the induced response could be slightly reduced.
3 Objectives and hypotheses
The purpose of our study is to characterize the variation of desire to eat felt by VR users when facing virtual food stimuli. As a main objective, we want to study the effect of visual quality on this feeling. Indeed, since we propose here a user experience in a controlled virtual environment, we can easily modify food stimuli, and thus the perception that users have of them, sight being a crucial sense for food and appetite in humans (Rolls et al., 1976; Rolls et al., 1983). In addition, we expect that some individual factors might have an effect on users’ responses to virtual food stimuli, as well as food type (Asp, 1999; Chen and Antonelli, 2020).
Accordingly, we propose the following hypotheses.
• H1: the desire to eat felt by a VR user is correlated to food stimulus visual quality, and decreases when this one is degraded.
• H2: the desire to eat felt in VR depends on the type of food shown to the user.
• H3: the desire to eat felt in VR depends on the user’s tastes and food habits.
4 Materials
4.1 3D food stimuli
4.1.1 Overview
The creation of a dataset of 3D food assets with different quality levels was a crucial step in the design of our study. Our creation procedure first involved the accurate selection and validation of a list of reference 3D food models according to criteria related to the appeal of these foods, as well as their visual quality and realism. We then selected a method for creating impaired models, by simplifying the geometry and texture of these reference models. Finally, since the visual quality as perceived by a user is not proportionate to the quantitative parameters of the simplification of a 3D object, we used a proven and tested metric for accurately ranking these impaired models according to a predicted perceived quality score and selecting a final set of stimuli.
4.1.2 Selection of the reference food models
Our objective is to select 3D objects of very high graphic quality and likely to induce a desire to eat. To conduct this selection, we defined four constraints: i) the model must be created using a photogrammetric process which offers a much more realistic appearance than 3D modeling; ii) the model must contain a sufficient number of vertices and triangles (more than 10k faces) to accurately represent the real geometry of the food; iii) the model must contain only one color texture map, to insure consistent simplification operations among models; iv) the texture map must have a minimum size of 2048 pixels × 2048 pixels to accurately represent the real color of the food.
To select an initial set of food stimuli, we conducted a large search and pre-selected 3D models from the referenced Sketchfab online repository1. This research included words or combinations of words related to appealing foods. Examples of keywords were “food,” “junk,” “salted food,” “sweet food,” or “drink.” In parallel to this keyword search, we also referred to the Food Pics Extended image dataset (Blechert et al., 2019), a large dataset that includes macronutrient informations and normative ratings from an online survey. We used craving ranks from male and female omnivores, as mentioned in this study, as indicators that guided our choices. They revealed a predominance of cakes for the highest ratings of craving, which reinforced our choice for the use of food stimuli that belong to this type of food.
With the process described above, a total of 38 models were selected. Then, we conducted a preliminary study where we asked 6 participants to rate these food models by answering the following question: “Indicate how much each food model makes you want to eat,” on a discrete scale from 1 to 10, where 1 = “not at all,” 5 = “moderate” and 10 = “very.” 3D models were displayed using built in-house Sketchab 3D rendering engine, with default rendering settings for each model. Participants could move, rotate and rescale models with no time limits. Figure 1 illustrates the pre-selection of stimuli with mean rating results.
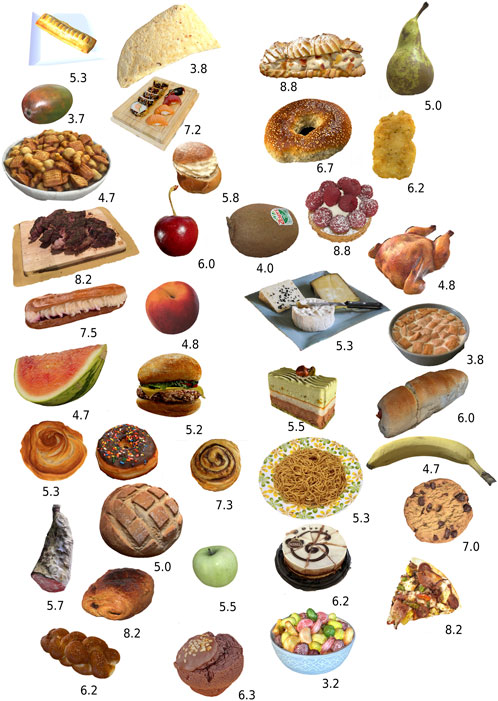
FIGURE 1. Pre-selection of 38 food models (Sketchfab engine with author rendering option choices) with respective mean rating scores obtained from the preliminary study (high means higher elicited desire to eat). Mango photogrammetry (reproduced from Nom via Sketchfab, licensed under CC BY 4.0). Corn tortilla chip (Reproduced from Andrewfrueh via Sketchfab, licensed under CC BY 4.0). 3d Scan snack (reproduced from Aysu via Sketchfab, licensed under CC BY 4.0). Chocolate muffin (Reproduced from Zoltanfood via Sketchfab, licensed under CC BY 4.0). Sliced cake (reproduced from Vorobevdesign via Sketchfab, licensed under CC BY 4.0). Sweet bread roll (reproduced from Moshe Caine via Sketchfab, licensed under CC BY 4.0). Roast Chicken (reproduced from Daidaioko via Sketchfab, licensed under CC BY 4.0). Cream filled eclaire (reproduced from Ronen via Sketchfab, licensed under CC BY 4.0). Banana 3d scan (reproduced from Grafi via Sketchfab, licensed under CC BY 4.0). Mac test (reproduced from Siavash Razavi via Sketchfab, licensed under CC BY 4.0). Hotdog lowpoly 7k tris 3d scan (reproduced from Xeverian via Sketchfab, licensed under CC BY 4.0). Slice corrected v4 (reproduced from Chris via Sketchfab, licensed under CC BY 4.0). Loaf of bread scan (reproduced from Max Funkner via Sketchfab, licensed under CC BY-NC 4.0). Tasty green apple (reproduced from DigitalSouls via Sketchfab, licensed under CC BY-NC 4.0). Swedish semla (reproduced from Swedish Semla via Sketchfab, licensed under CC BY-ND 4.0). Cinnamon pastry (reproduced from Qlone via Sketchfab, licensed under CC BY-ND 4.0). Pistachio dessert (reproduced from Qlone via Sketchfab, licensed under CC BY-ND 4.0). Challah bread (reproduced from Qlone via Sketchfab, licensed under CC BY-ND 4.0). Backyard burgers classic burger (reproduced from Ehsan Abbasi from Sketchfab, licensed under CC BY-SA 4.0). Sushi and nigiri making at home (bought from Zoltanfood via Sketchfab, under Sketchfab editorial license). Cote de buf (reprinted from Bart via Sketchfab, under Sketchfab editorial license). Burger King Chicken Nugget (reprinted from Omegadarling via Sketchfab, under Sketchfab editorial license.) Kiwi zespri fruit food (reprinted from Riccardogiorato via Sketchfab, under Sketchfab editorial license). Chocolate frosted donut sprinkles (reprinted from Guillermo Sainz via Sketchfab, under Sketchfab editorial license). Sausage roll on white plate (reprinted from Cgaxis via Sketchfab, under Sketchfab standard license). Bing cherry surface macro (reprinted from Inciprocal via Sketchfab, under Sketchfab standard license). Paris brest pastry (reprinted from 3DSCANFR (sdrn) via Sketchfab, under Sketchfab standard license). Pear conference photogrammetry lowpoly 4k (reprinted from Ximo Vilaplana via Sketchfab, under Sketchfab standard license). French cheese un peu de fromage (reprinted from Gerpho 3D via Sketchfab, under Sketchfab standard license). Mini watermelon slice (reprinted from Inciprocal via Sketchfab, under Sketchfab standard license). Kouign amann 3d scan French pastry (reprinted from Benoît Rogez via Sketchfab, under Sketchfab standard license). Dry sausage lowpoly (reprinted from Léonard_Doye/Leoskateman via Sketchfab, under Sketchfab standard license). Small raspberry tart tartelette (reprinted from Benoît Rogez via Sketchfab, under Sketchfab standard license). Chocolate chip cookie (reprinted from James West via Sketchfab, under Sketchfab standard license). Bowl full of hard candies photogrammetry (reprinted from Enlil Scan via Sketchfab, under Sketchfab standard license). Pain au chocolat (reprinted from 3DSCANFR (sdrn) via Sketchfab, under Sketchfab standard license).
To balance between the number of food models to evaluate and the immersion time, only 10 were finally kept (see Figure 2; Table 1). This final set of reference food models was selected according to their ratings and to the feedback of expert clinicians in nutrition and eating disorders. In particular, after discussion and consultation with those experts, we removed the following elements.
• Rib roast, because it looked too unrecognizable with our VR display conditions;
• Bagel and braided brioche, to avoid redundancy with pastries and dough products;
• Nugget, because the visualization of a single nugget in a dish would likely seem unusual to a consumer.
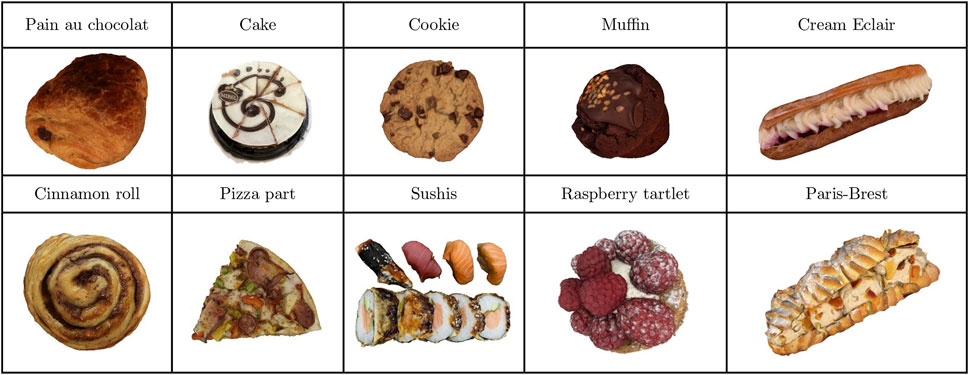
FIGURE 2. Visual illustrations of the final set of reference food models.
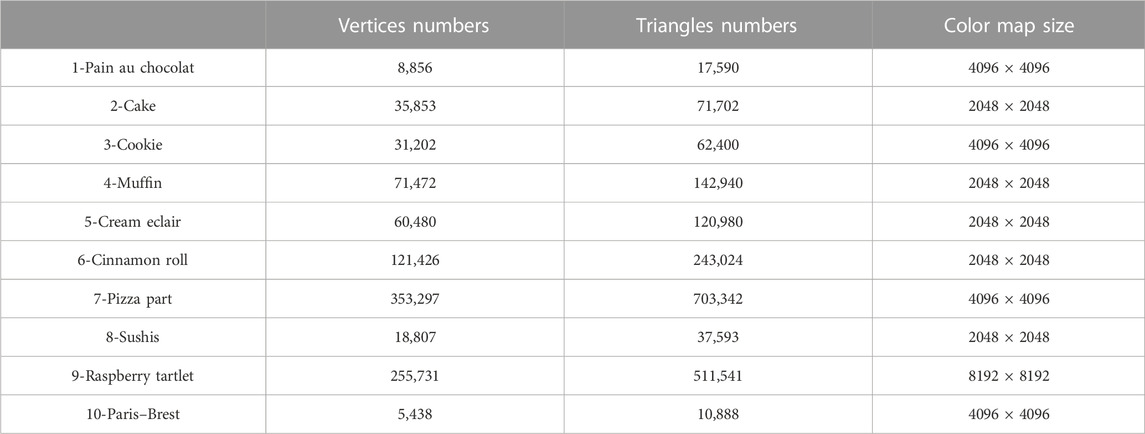
TABLE 1. Geometry and texture properties of the final set of reference food models.
4.1.3 Creation and selection of quality levels
We used two parameters to artificially vary the visual quality of each reference model, allowing us to obtain impaired models at several defined quality levels: i) the number of faces, and ii) the texture resolution. Every reference food model was thus repeatedly processed by a combination of mesh and texture reduction, leading to 7 final stimuli per reference food model, corresponding to 7 quality levels. Figure 3 summarizes the impaired model creation and stimuli selection processes.
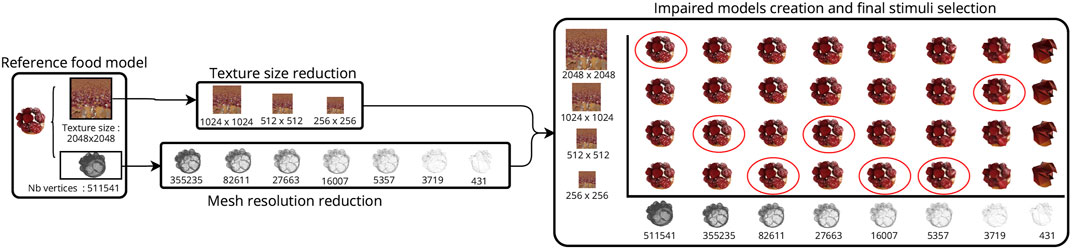
FIGURE 3. Creation of impaired models and selection of final stimuli for the raspberry tartlet reference model. Red circles correspond to the 7 stimuli selected, with increasing visual qualities. Note that for the readability of the figure, the number of mesh resolutions has been reduced. The real number is 41 (counting the original mesh), giving a total of 164 impaired models.
4.1.3.1 Reduction of mesh resolution
The quadric edge collapse decimation algorithm from Garland and Heckbert (1998), provided in the MeshLab software (Cignoni et al., 2008), was used to iteratively simplify each food model. We used default settings: quality threshold equal to 0.3, and importance of texture weight and boundary preserving weight set to equal. For each object, we divided the target triangle number for each iteration by 1.2 (reduction of 16.67%) until the coarsest possible version was obtained (when reaching the default quality threshold). We automatically executed all simplification operations using the Python library pymeshlab (Muntoni and Cignoni, 2021). Some models were subject to standard topological repairs (holes, duplicated vertices removed, etc.), also using Meshlab. Finally, we obtained a total of 410 decimated versions from the 10 reference models (between 33 and 50 simplified models for each reference). The coarsest meshes had between 4 and 862 triangles (see supplemental materials file, Section 1, for details).
4.1.3.2 Reduction of texture size
Each reference model is associated with a single raw texture image representing its color as captured by photogrammetry. For all models, we converted all color maps to PNG format of 2K resolution (normalized texture size: 2048 × 2048 pixels).
To reduce the texture resolution, we halved texture sizes keeping the original proportions, until reaching a resolution of 256 × 256 pixels. We thus obtained a set of 4 texture images from 2048 × 2048 to 256 × 256 pixels for each food model. These texture downsampling operations were computed using the open-source raster graphics editor Gimp with default interpolation parameters (The GIMP Development Team, 2019).
4.1.3.3 Quality level assessment
Mesh and texture reduction operations create a large number of impaired models for each reference food model (they are combinations of a simplified geometry and a simplified texture image, as illustrated in Figure 3). Our objective is then to select among this large number of impaired versions a final set that corresponds to increasing levels of visual quality. We also wanted these quality levels to be visually equivalent among the different reference food models. We thus need a metric able to predict the visual quality of an impaired 3D model as perceived by a human. For this task, we considered the very recent deep learning-based quality metric from (Nehmé et al., 2023). This metric was learned on a dataset of 3000 textured 3D models associated with subjective quality scores obtained from a large scale crowdsourcing study. This metric is able to compute a predicted quality score called “Pseudo Mean Opinion Score” (pseudo-MOS) given a pristine 3D model and a distorted version as inputs. The pseudo-MOS ranges from 1 to 5 and it reflects the perceived annoyance of the distortion with the following scale: 1—Very annoying; 2—Annoying; 3—Slightly annoying; 4—Perceptible but not annoying; 5—Imperceptible. We used this metric to rank and select our stimuli, as explained in Section 4.1.4.
4.1.4 Final selection
For each 3D reference food model, the number of generated impaired versions (e.g., number of geometry levels of details × number of texture sizes) is between 124 (Paris-Brest) and 204 (cake and cookie). We ran the quality metric described above on each of these impaired versions; we thus obtained, for each of them, a pseudo-MOS score between 1 and 5. We then used these scores to select, for each reference model, seven impaired versions corresponding to the following pseudo-MOS values: 2, 2.5, 3, 3.5, 4, 4.5 and 5 (see supplemental materials file, Section 1, for details about selected impaired versions). We limited to 7 the number of quality levels for the user experiment to remain reasonable in terms of VR exposure time.
4.2 Virtual environment
To abstract from the influence of the visual context on the elicited desire to eat, our virtual environment was designed as a sensory analysis room. We respected the specified characteristics listed in the (ISO 8589:2007, 2010) standard. This neutral environment allows us to isolate the effect of the appearance of the object itself on the desire to eat. The environment is made up of several identical stands aligned across the width of the room. Each stand is made up of three walls surrounding the user, a sliding hatch and a sink/soap cylinder set. Participants were placed facing the stand in the center of the room. Likely a real sensory analysis booth, 3D food models were presented alternately through the hatch. These conditions, devoid of any other element that may attract participants’attention, allow an evaluation centered on the object to be considered. Figures 4, 5 respectively show a third-person point of view of the virtual sensory analysis room and user VR headset points of view when facing virtual food and desire-to-eat questionnaire.
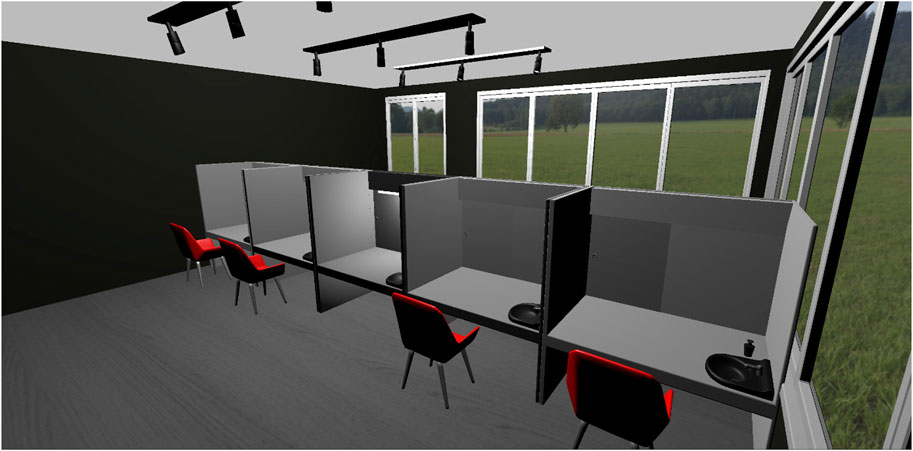
FIGURE 4. Third-person view of the virtual environment.
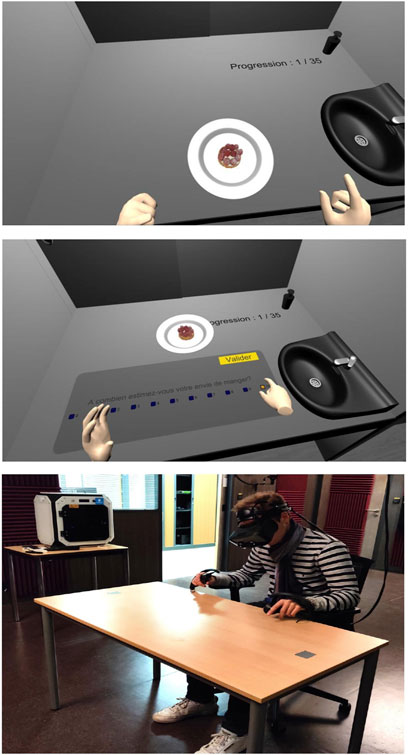
FIGURE 5. First-person views of the application (Top: Food visualization; Middle: Desire-to-eat questionnaire displayed after each food visualization) and external setup view (Bottom).
It should be highlighted that in order to not alter their visual appearance, 3D food models are not shaded; i.e., their color is directly what has been captured through the photogrammetry process.
The VR environment was developed with the Unity 5.1 game engine, with the Built-in Render pipeline.
4.3 Hardware and software
The hardware equipment consisted of a VR ready computer (CPU INTEL® Xeon® W-2245 3.9 GHz, 32.0 GB RAM, Operating System 64 bits, processor × 64, graphic card NVIDIA GeForce GTX 3090), with a Varjo XR3 mixed reality head-mounted display (HMD) (Focus area (27° × 27°) at 70 PPD uOLED, 1920 × 1920 pixels per eye, peripheral area at over 30 PPD LCD, 2,880 × 2,720 px per eye, 115° field of view and a 90 Hz refresh rate). This headset offers a high quality display, wearability and viewing comfort, hence its choice. We used SteamVRTM 2.0 tracking system, associated with the SteamVR platform to control rendering settings.
The Valve Index® controllers were used to represent animated virtual hands in the environment. They were chosen according to their design which offers open hand interactions.
5 Experiment
5.1 Physical setup
The set-up consisted of a table and a chair on which the whole experiment took place, as shown in Figure 5. To increase the immersion and the naturalness of user interactions, the size and the position of this table were identical to the one displayed in the virtual stand. We set up a seated-only play area after putting the headset and the VR character asset in a rigorously chosen position, allowing participants to feel a consistent haptic response face to the displayed foreground environment.
5.2 Participants
28 people (13 males, 15 females) were recruited. This sample size is above standards of most VR and human-computer interaction studies (Caine, 2016). They were divided into 3 age groups (13 were 18–35 years old, 6 were 35–45 years, and 9 were over 45 years old) (M = 37.00, σ = 13.89). Men and women were considered eligible to participate if they were at least 18 years of age, could read, understand and clearly speak French, do not have any eating disorder, intolerance, allergy, diet or dietary restriction, and did not eat during the 2 h before starting the experimentation. Recruitment was determined via face discussion or mail.
5.3 Data collection
5.3.1 Before immersion in VR
Before each session with food stimuli exposure in VR, participants were asked to fill a pre-exposure questionnaire. It contained general questions (age, education level, gender), an evaluation of their global desire to eat when filling this questionnaire (on a discrete scale ranging from 0 to 5), when the last time they took a meal was, if they smoke (and if so, when the last time they took nicotine was), whether they prefer sweet or salty foods, and an estimation of their experience with immersive technologies (between novice, intermediate and expert level).
5.3.2 During immersion in VR
To collect user desire-to-eat scores for each virtual food stimulus, the following question was asked in the virtual environment after each stimuli visualization: “How much do you estimate your desire to eat?” A discrete scale ranging from 0 to 10 was used and shown to participants with the 0-value translated as “not at all,” and 10 as “extremely” (see Figure 5).
Response time was unlimited, and after that, the user could go to the next food stimulus by pressing the “Validate” button.
This questionnaire was designed to be in-VR, since in-VR questionnaires have shown a reduction in study time, less disorientation, better consistency in the variance of the results collected (Schwind et al., 2019) and is preferred by users to out-VR questionnaires use (Alexandrovsky et al., 2020). For a more natural interaction, the desired answer is selected by touching it on the panel with the index finger. We used capacity sensors included in the controllers to precisely detect the finger positions and to trigger an animation of the virtual hand reproducing the same motion as the one performed.
5.3.3 After immersion in VR
After each VR session, participants fill out a post-exposure questionnaire related to their personal eating habits in relation to the food stimuli they previously visualized. The question is “How much do you like this food?,” followed by a 5-level Likert scale (labels: 1-not at all; 2-not really; 3- neutral; 4-a little; 5-very much). This question was asked for each of the 10 reference food models used during the experiment.
5.4 Experimental procedure
The experimental procedure had four main phases: the pre-exposure questionnaire phase, a briefing phase, the VR immersion, and the debriefing phase (short interview and post-exposure questionnaire).
In the first phase, participants consented to their participation in the experiment and data exploitation, after which they were asked to digitally complete the pre-exposure questionnaire. Then, participants were given explanations about the purpose of the experiment.
They were free to ask any question before starting the immersion. After that, we displayed the VR scene and asked participants to sit on the chair, set it at their desired height, and wear the VR headset and the controllers.
Then, a start button appeared at the center of the table, letting participants begin the evaluation.
During the second phase (briefing), we briefed participants on the VR environment, the assessments they had to perform, headset and controllers use. An oral description of the environment in which they were immersed was also made. We added any additional information at their request, as long as their requests could not influence their future assessments.
In the VR exposure phase, each evaluation was done as follows: the stand hatch opened and a food stimulus presented on a plate (or on a wooden board for sushis) to respect service customs, was coming in front of participants through an animation. The plate was rotating for 5 s in front of participants, before slightly moving away. Then, the desire-to-eat questionnaire was presented to participants on the stand table. Finally, the stimulus was coming back behind the hatch with an animation, before a new 3D food model arrived. The total number of stimuli to evaluate is 70 (10 reference food × 7 visual quality levels). The stimuli were presented in a pseudo-randomized order, different for each participant. Furthermore, to avoid biases on the desire-to-eat scores, two food stimuli of the same type could not be displayed consecutively. Evaluating all those stimuli in one single session would have exposed participants to a too-long exposure, which is not recommended and could increase the occurrence of cybersickness (Kim et al., 2021) with related symptoms and effects (Conner et al., 2022), tiredness, and fatigue (Bockelman and Lingum, 2017; Souchet et al., 2022). Moreover, Larson et al. (2013) found that the enjoyment score produced by food pictures decreased with the number of food pictures displayed, by comparing sessions of 20 stimuli with sessions of 60. Consequently, we divided the entire evaluation into two sessions of 35 stimuli, which brings each session to a duration of approximately 15 min. In addition, 8 out of 10 types of food stimuli were sweet, in line with Larson et al. (2013) recommendation (absence of the aforementioned effect with such food type.)
For each participant, the two sessions were done on the same day or a few days apart. Time slots were discussed and identified with clinical experts, between 10:00 a.m. and 12:30 p.m., and 4:00 p.m. and 6:00 p.m.
In the last phase, an oral debriefing was conducted with participants directly after taking off the VR headset. The interview focused specifically on participants’feelings regarding the food design, VR simulation, and comfort of interactions.
6 Results
The analysis of demographic data (gender, age, education level) did not reveal any particular effect on desire-to-eat scores, neither did the global desire to eat, the last time participants took a meal, their smoke habits, and their experience with immersive technologies.
Two of our twenty-eight participants were excluded from analyzes due to incongruous ratings. One was declared to be “unresponsive to VR environment” because of a desire-to-eat score of 0 for all stimuli during the first exposure session; therefore, we did not to conduct the second session. During the debriefing, the participant declared (I cannot project myself on the virtual environment; I cannot say “I can eat it.”) The other excluded participant presented outlier values in their score answers (values were considered as outliers when below the 1st quartile − 3 * interquartile range (IQR) or above the 3rd quartile + 3 * IQR, across all the participants’ results). We considered then twenty-six participants for the next statistical analyses.
Due to the sample size of participants used in our trial, and because the collected data are ordinal, we used non-parametric tests to perform analyzes. The level of significance was set to 5%.
6.1 Effect of visual quality and type of food on desire to eat
To evaluate the effect of visual quality level and food type (i.e., reference food model) while considering the effect of the interaction between these two factors, we conducted a two-way repeated measures Aligned Rank Transform (ART) ANOVA (Wobbrock et al., 2011). Results show a significant influence of both factors (quality level: F (6, 1725) = 39.356, p = 5.21 e-45,
We also performed Wilcoxon post hoc pairwise comparisons between quality levels and types of food. Results are detailed in the sections below.
6.2 Desire to eat and visual quality
First, it should be reminded that quality levels refer to pseudo-MOS values estimated for all visual stimuli (see Section 4.1.4). Level 1 corresponds to pseudo-MOS = 2 (worst quality) and level 7 to pseudo-MOS = 5 (best quality). Figure 6 displays boxplots of desire-to-eat scores given by participants across food stimuli quality levels. This figure illustrates the influence of visual quality levels on desire-to-eat scores.We conducted Wilcoxon pairwise test comparisons with Benjamini and Hochberg (BH) corrections (Benjamini and Hochberg, 1995) over visual quality levels. Table 2 provides detailed p-values. We found the following results: i) level 1 and level 2 have eating desire scores significantly lower than the other levels and are slightly different from each other; ii) levels 3, 4, and 5 form a superior group with significantly greater values than the previous group, but with significantly lower values than levels 6 and 7, which form the last group. It should be mentioned that level 3 is also moderately significantly lower than level 5 (see supplemental materials file, Section 2, for all comparison results). Figure 7 synthesizes our results in terms of significant differences between levels.
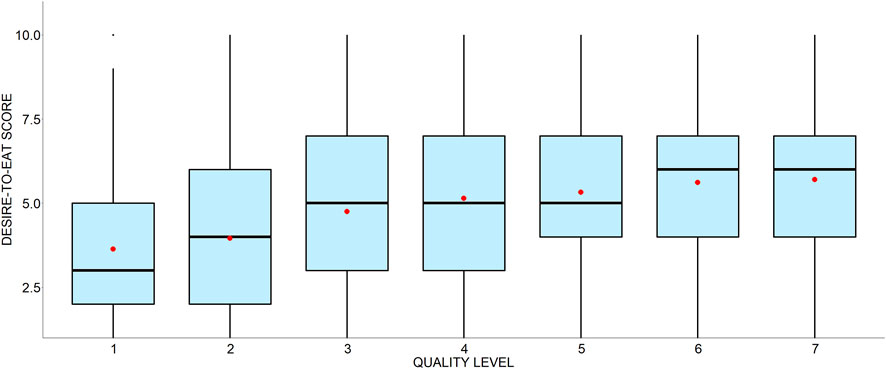
FIGURE 6. Distributions of desire-to-eat scores by visual quality level. Mean values are represented by red circles.
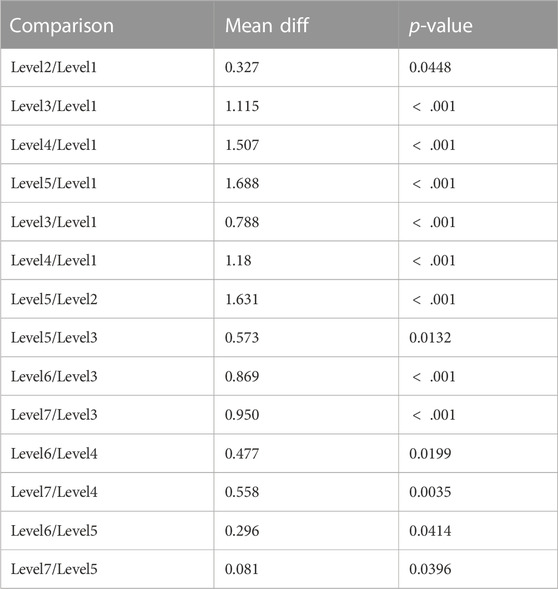
TABLE 2. Wilcoxon pairwise test comparison results, between quality levels, for which a significant difference of desire-to-eat score is found. p-values are displayed with BH correction.
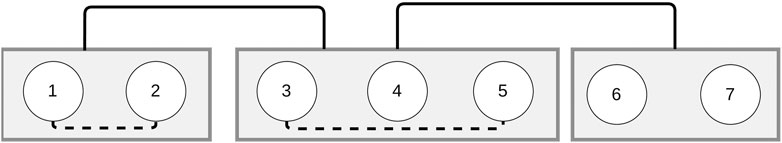
FIGURE 7. Visual quality levels split by significant differences of elicited desire-to-eat scores. Highly significant differences are represented by full lines, and slightly significant differences are represented by spaced lines.
6.3 Desire to eat and type of food
The elicited desire to eat is also affected by the type of food shown (i.e., the reference food model, whatever its quality level). Figure 8 illustrates the distributions of desire-to-eat scores according to the food reference models (ranked by mean score). The effect of the type of food is confirmed by the Wilcoxon pairwise test comparisons with BH corrections shown in Table 3 (see supplemental materials file, Section 3, for all comparison results).
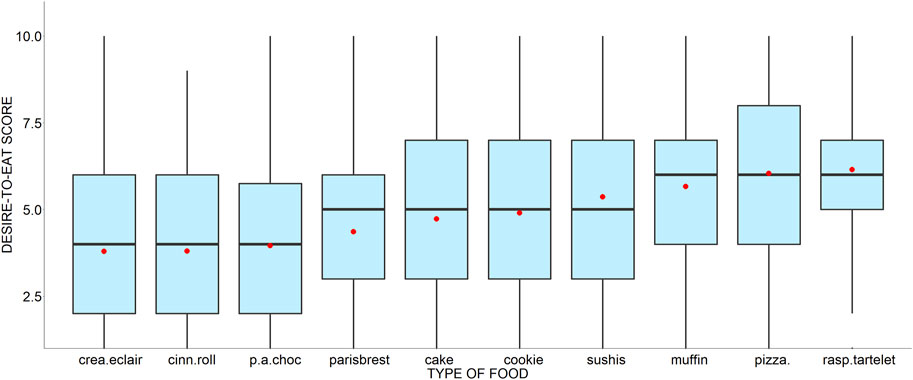
FIGURE 8. Distributions of desire-to-eat scores by food type (ranked according to their mean score). Mean values are represented by red circles.
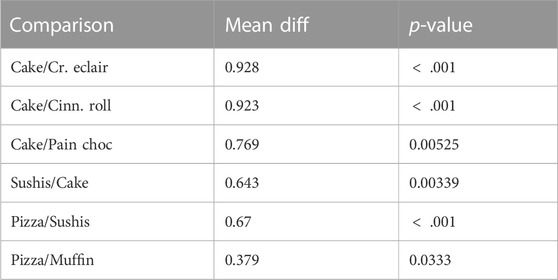
TABLE 3. Wilcoxon pairwise test comparison results, between food types, for which a significant difference of desire-to-eat score is found. p-values are displayed with BH correction.
These p-values show significant differences regarding eating desire scores between, e.g., Cake and Cream eclair (lower scores for the latter), and Cake and Sushis (higher scores for the latter).
6.4 Desire to eat and eating habits
Finally, desire-to-eat scores may also be influenced by users’ food habits. This effect is illustrated by Figure 9 which presents the distribution of desire-to-eat scores, according to the eating habits scores coming from the post-exposure questionnaire (see Section 5.3.3). Because samples are of different sizes, we conducted a Kruskal–Wallis test (χ2 = 260, p
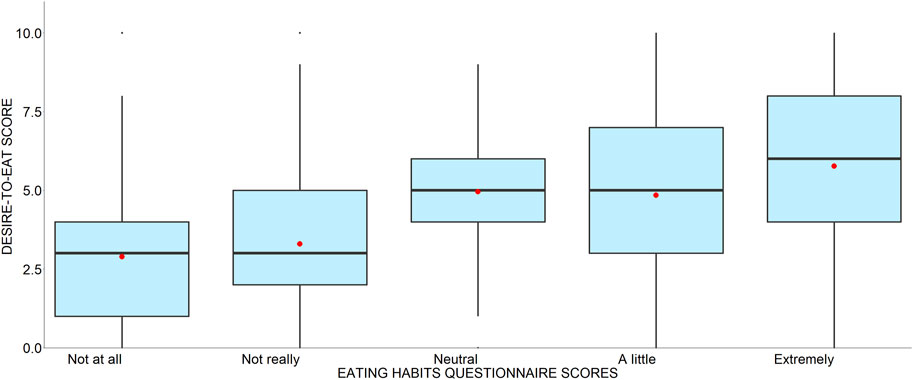
FIGURE 9. Distribution of desire-to-eat scores grouped by eating habits questionnaire results. Mean values are represented by red circles.
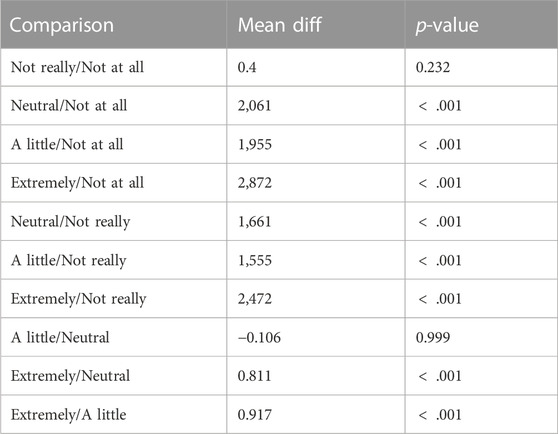
TABLE 4. DSCF pairwise comparison of desire-to-eat scores between eating habits.
Moreover, Figure 10 illustrates the evolution of the differences between desire-to-eat scores reported by participants for level 7 and level 1, respectively. Kruskal–Wallis test results (χ2 = 177, p
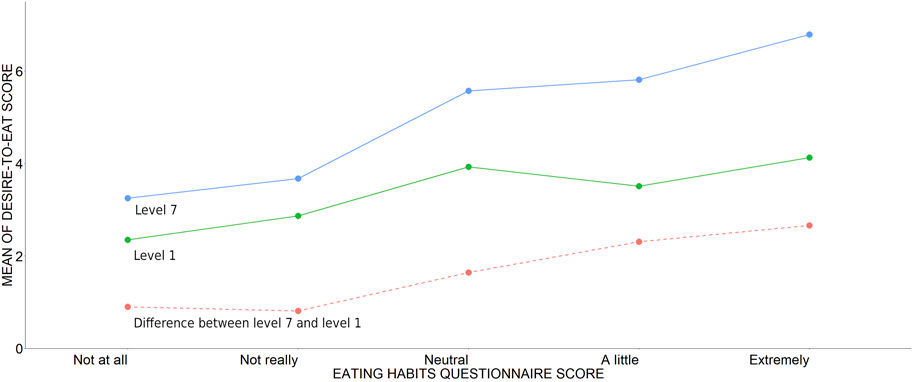
FIGURE 10. Evolution of mean of desire-to-eat score according to eating habits questionnaire results for level 7, level 1 and difference between level 7 and level 1.
7 Discussion
First, the results from our experiment do support our Hypothesis H1: the desire to eat increases when the visual quality of virtual food increases too. More precisely, desire-to-eat scores are significantly lower for levels 1 and 2, and starting from level 3, they increase, even forming a “top” group for levels 6 and 7, with more moderated significant differences.
This observation suggests that a quality level of 3 seems to reflect the minimum required quality to trigger a significant desire to eat, with levels 4 and 5 triggering a similar desire. Significantly better results are obtained starting from level 6 (no significant improvement is brought by level 7). In terms of pseudo-MOS values, it means that a pseudo-MOS of 3 (on a scale from 1 to 5) is a minimum value to start to trigger significant desire-to-eat for VR food studies; the best choice, if possible regarding computing capacity, is a pseudo-MOS of 4.5 (without improvement after this value). Given the fact that the tool for computing pseudo-MOS is publicly available (Nehmé et al., 2023), this result is of great interest for optimizing 3D food models in food-related virtual reality experiments (e.g., for consumer research, eating disorder therapy, and so on).
Our results also support our Hypothesis H2. Desire-to-eat scores did vary according to the type of food, since we found significant differences of scores depending on the type of food presented, considering all visual quality levels together. Some comments given by the participants can help to understand some of these differences. For example, in the answers to our post-experiment debriefing, we noticed that the words “pain” and “chocolat,” which represent the pastry of the same name in French, were the most spoken words. They were used in combination with words regarding its appearance, using expressions such as “crushed in a bag,” “burnt” or “too orange.” Therefore, it tends to reveal that this food stimulus has been perceived as not appetizing as could be expected.
Hypothesis H3 was verified in our experiment since the participants’ eating habits (i.e., their taste for the corresponding reference food models) did influence significantly their desire-to-eat scores. When a food stimulus was not very appreciated, it produces a lower desire to eat than the other food. Similarly, the most preferred food produced the highest desire to eat, for all visual quality levels.
We also conducted an extra analysis of the desire-to-eat scores in regard with participants’ habits and the visual quality of the stimuli. We found that the difference between the extreme levels (1 and 7) significantly varied, with lowest differences when the food stimulus was “not at all or not really” liked, compared to the most preferred food that elicited highest contrasts regarding the desire-to-eat across the visual quality levels (see supplementary material file Section 4).
Nonetheless, we found interesting facts for some specific stimuli, despite our global results about hypotheses H2 and H3, from the debriefing interviews of the participants. Figure 11 shows a word cloud containing the most frequent words told by participants. Color differences represent word frequencies. This includes the findings about the “pain au chocolat” described above. This result could explain the low desire-to-eat scores elicited by this virtual stimulus despite its high food habit values. This example can be representative of a larger effect: despite being created by a high-quality photogrammetry process, the appearance of food models can seem not realistic for the participants. This observation suggests that, despite the high-quality brought by photogrammetry, there is still a need for more accurate processes that would be able to capture the physical properties of the objects (e.g., the way it reflects the light). It is even more important in the field of food science in virtual environments since food desire is also influenced by color contrasts (Paakki et al., 2019).
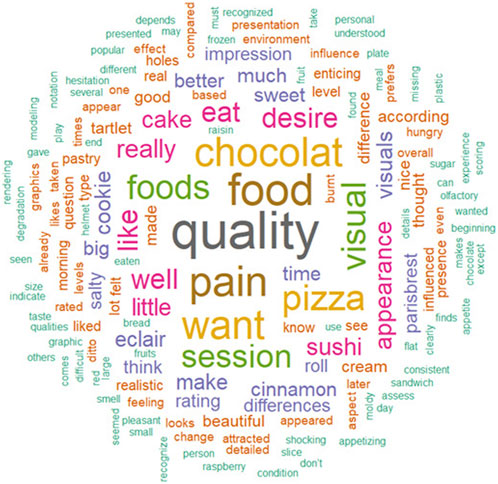
FIGURE 11. Word Cloud of participant debriefing interviews.
7.1 Limitations
While our data yielded important results, several limits remain in our study. First, the 3D food models chosen do not represent all kinds of diets present in the world, which differ in social, cultural, and religious habits. Second, as mentioned above, the photogrammetry process allows a high-quality reconstruction of geometry and color but does not integrate physical properties that would allow reproducing real light interactions such as reflections or absorption.
8 Conclusion and future work
The proposed study evaluated the influence of the visual quality of food stimuli on the elicited desire to eat in virtual reality. Results show that the visual quality of virtual food stimuli significantly influences the desire to eat felt in virtual reality, where the desire decreases along with the visual quality. Moreover, our results pave the way to the optimization of 3D food models since we showed significant differences between some levels, as well as the absence of perceived desire to eat between other levels, e.g., between two very high quality levels. The desire to eat is also influenced by the type of food and the eating habits of the participants. Those results allowed us to make useful recommendations for designing virtual reality experiments involving food stimuli. Several perspectives may be considered. Firstly, the stimulation of other senses, in particular smell, should highly contribute to the intensity of the elicited responses (emotions, desire to eat). Flavián et al. (2021) showed that scent can strengthen the link between affection and conation; Javerliat et al. (2022) proposed an open-source reproducible olfactory device compatible with autonomous HMDs, that would allow an easy integration of this sensory cue in further experiments. Secondly, the use of reference food models representing a larger coverage of different diets and evaluated by a panel with a greater diversity could allow to confirm our results in a more general setting. Finally, as stated above, a perspective is to achieve a more realistic object appearance able to reproduce light interactions and thus improve food realism. For example, recent deep-learning techniques allow to reconstruct the accurate geometry and Spatially-Varying Bidirectional Reflectance Distribution Function (SVBRDF) (Bi et al., 2020) from a set of sparse images of a 3D object.
Data availability statement
The original contributions presented in the study are included in the article/Supplementary Material, further inquiries can be directed to the corresponding author.
Ethics statement
The studies involving human participants were reviewed and approved by the Lyon University ethical committee (n°2022-03-17-004). The patients/participants provided their written informed consent to participate in this study.
Author contributions
FR, CH-D, GL, and PB contributed to conception and design of the study. FR developed the VR application and conducted the experiment. FR and PR performed the statistical analysis. FR wrote the first draft of the manuscript. All authors contributed to the article and approved the submitted version.
Funding
This work was funded by REHACOOR 42, Ecole Centrale of Lyon—ENISE, and the University Hospital Center (CHU) of Saint-Etienne.
Acknowledgments
The authors also thank all the participants and Eliott Zimmermann, Pierre-Philippe Elst, Sophie Villenave and Charles Javerliat for technical supports and assistance.
Conflict of interest
The authors declare that the research was conducted in the absence of any commercial or financial relationships that could be construed as a potential conflict of interest.
Publisher’s note
All claims expressed in this article are solely those of the authors and do not necessarily represent those of their affiliated organizations, or those of the publisher, the editors and the reviewers. Any product that may be evaluated in this article, or claim that may be made by its manufacturer, is not guaranteed or endorsed by the publisher.
Supplementary material
The Supplementary Material for this article can be found online at: https://www.frontiersin.org/articles/10.3389/frvir.2023.1221651/full#supplementary-material
Footnotes
1https://sketchfab.com/florianramousse/collections/first-selection-realism.
References
Alba-Martínez, J., Sousa, P. M., Alcañiz, M., Cunha, L. M., Martínez-Monzó, J., and García-Segovia, P. (2022). Impact of context in visual evaluation of design pastry: comparison of real and virtual. Food Qual. Prefer. 97, 104472. doi:10.1016/j.foodqual.2021.104472
Alexandrovsky, D., Putze, S., Bonfert, M., Höffner, S., Michelmann, P., Wenig, D., et al. (2020). “Examining design choices of questionnaires in VR user studies,” in Proceedings of the 2020 CHI Conference on Human Factors in Computing Systems (ACM). doi:10.1145/3313831.3376260
Ammann, J., Stucki, M., and Siegrist, M. (2020). True colours: advantages and challenges of virtual reality in a sensory science experiment on the influence of colour on flavour identification. Food Qual. Prefer. 86, 103998. doi:10.1016/j.foodqual.2020.103998
Asp, E. H. (1999). Factors affecting food decisions made by individual consumers. Food Policy 24 (2-3), 287–294. doi:10.1016/s0306-9192(99)00024-x
Benjamini, Y., and Hochberg, Y. (1995). Controlling the false discovery rate: a practical and powerful approach to multiple testing. J. R. Stat. Soc. Ser. B Methodol. 57 (1), 289–300. doi:10.1111/j.2517-6161.1995.tb02031.x
Bi, S., Xu, Z., Sunkavalli, K., Kriegman, D., and Ramamoorthi, R. (2020). “Deep 3d capture: geometry and reflectance from sparse multi-view images,” in 2020 IEEE/CVF Conference on Computer Vision and Pattern Recognition (CVPR) (IEEE). doi:10.1109/cvpr42600.2020.00600
Blechert, J., Lender, A., Polk, S., Busch, N. A., and Ohla, K. (2019). Food-pics_extended-an image database for experimental research on eating and appetite: additional images, normative ratings and an updated review. Front. Psychol. 10, 307. doi:10.3389/fpsyg.2019.00307
Bockelman, P., and Lingum, D. (2017). “Factors of cybersickness,” in Communications in computer and information science (Springer International Publishing), 3–8. doi:10.1007/978-3-319-58753-0_1
Caine, K. (2016). “Local standards for sample size at CHI,” in Proceedings of the 2016 CHI Conference on Human Factors in Computing Systems (ACM). doi:10.1145/2858036.2858498
Cheah, C. S., Barman, S., Vu, K. T., Jung, S. E., Mandalapu, V., Masterson, T. D., et al. (2020). Validation of a virtual reality buffet environment to assess food selection processes among emerging adults. Appetite 153, 104741. doi:10.1016/j.appet.2020.104741
Chen, P.-J., and Antonelli, M. (2020). Conceptual models of food choice: influential factors related to foods, individual differences, and society. Foods 9 (12), 1898. doi:10.3390/foods9121898
Chen, Y., Huang, A. X., Faber, I., Makransky, G., and Perez-Cueto, F. J. A. (2020). Assessing the influence of visual-taste congruency on perceived sweetness and product liking in immersive VR. Foods 9 (4), 465. doi:10.3390/foods9040465
Cignoni, P., Corsini, M., and Ranzuglia, G. (2008). Meshlab: an open-source 3d mesh processing system. ERCIM News 2008 (73). URL: http://dblp.uni-trier.de/db/journals/ercim/ercim2008.html#CignoniCR08. doi:10.2312/LocalChapterEvents/ItalChap/ItalianChapConf2008/129-136
Conner, N. O., Freeman, H. R., Jones, J. A., Luczak, T., Carruth, D., Knight, A. C., et al. (2022). Virtual reality induced symptoms and effects: concerns, causes, assessment & mitigation. Virtual Worlds 1 (2), 130–146. doi:10.3390/virtualworlds1020008
Crofton, E., Murray, N., and Botinestean, C. (2021). Exploring the effects of immersive virtual reality environments on sensory perception of beef steaks and chocolate. Foods 10 (6), 1154. doi:10.3390/foods10061154
de Carvalho, M., Dias, T., Duchesne, M., Nardi, A., and Appolinario, J. (2017). Virtual reality as a promising strategy in the assessment and treatment of bulimia nervosa and binge eating disorder: a systematic review. Behav. Sci. 7 (4), 43. doi:10.3390/bs7030043
Delarue, J., and Boutrolle, I. (2010). “The effects of context on liking: implications for hedonic measurements in new product development,” in Consumer-driven innovation in food and personal care products (Elsevier), 175–218. doi:10.1533/9781845699970.2.175
Flavián, C., Ibáñez-Sánchez, S., and Orús, C. (2021). The influence of scent on virtual reality experiences: the role of aroma-content congruence. J. Bus. Res. 123, 289–301. doi:10.1016/j.jbusres.2020.09.036
Garland, M., and Heckbert, P. (1998). “Simplifying surfaces with color and texture using quadric error metrics,” in Proceedings Visualization '98 (Cat. No.98CB36276) (IEEE). doi:10.1109/visual.1998.745312
Gorini, A., Griez, E., Petrova, A., and Riva, G. (2010). Assessment of the emotional responses produced by exposure to real food, virtual food and photographs of food in patients affected by eating disorders. Ann. general psychiatry 9 (1), 30. doi:10.1186/1744-859x-9-30
Gouton, M.-A., Dacremont, C., Trystram, G., and Blumenthal, D. (2021). Validation of food visual attribute perception in virtual reality. Food Qual. Prefer. 87, 104016. doi:10.1016/j.foodqual.2020.104016
Hummel, G., Ehret, J., Zerweck, I., Winter, S. S., and Stroebele-Benschop, N. (2018). How eating behavior, food stimuli and gender may affect visual attention – An eye tracking study. Eat. Behav. 31, 60–67. doi:10.1016/j.eatbeh.2018.08.002
Javerliat, C., Elst, P.-P., Saive, A.-L., Baert, P., and Lavoué, G. (2022). “Nebula: an affordable open-source and autonomous olfactory display for vr headsets,” in Proceedings of the 28th ACM Symposium on Virtual Reality Software and Technology (New York, NY, United States: Association for Computing Machinery), 1–8.
Kim, H., Kim, D. J., Chung, W. H., Park, K.-A., Kim, J. D. K., Kim, D., et al. (2021). Clinical predictors of cybersickness in virtual reality (VR) among highly stressed people. Sci. Rep. 11 (1), 12139. doi:10.1038/s41598-021-91573-w
Larson, J. S., Redden, J. P., and Elder, R. S. (2013). Satiation from sensory simulation: evaluating foods decreases enjoyment of similar foods. J. Consumer Psychol. 24 (2), 188–194. doi:10.1016/j.jcps.2013.09.001
Machín, L., Curutchet, M. R., Giménez, A., Aschemann-Witzel, J., and Ares, G. (2019). Do nutritional warnings do their work? Results from a choice experiment involving snack products. Food Qual. Prefer. 77, 159–165. doi:10.1016/j.foodqual.2019.05.012
Marcum, C. S., Goldring, M. R., McBride, C. M., and Persky, S. (2018). Modeling dynamic food choice processes to understand dietary intervention effects. Ann. Behav. Med. 52 (3), 252–261. doi:10.1093/abm/kax041
Meiselman, H., Johnson, J., Reeve, W., and Crouch, J. (2000). Demonstrations of the influence of the eating environment on food acceptance. Appetite 35 (3), 231–237. doi:10.1006/appe.2000.0360
Meiselman, H. L. (2006). “The role of context in food choice, food acceptance and food consumption,” in The psychology of food choice (CABI), 179–199. doi:10.1079/9780851990323.0179
Nehmé, Y., Delanoy, J., Dupont, F., Farrugia, J.-P., Le Callet, P., and Lavoué, G. (2023). Textured mesh quality assessment: large-scale dataset and deep learning-based quality metric. ACM Trans. Graph. 42, 1–20. Just Accepted. doi:10.1145/3592786
Paakki, M., Sandell, M., and Hopia, A. (2019). Visual attractiveness depends on colorfulness and color contrasts in mixed salads. Food Qual. Prefer. 76, 81–90. doi:10.1016/j.foodqual.2019.04.004
Persky, S., Goldring, M. R., Turner, S. A., Cohen, R. W., and Kistler, W. D. (2018). Validity of assessing child feeding with virtual reality. Appetite 123, 201–207. doi:10.1016/j.appet.2017.12.007
Picket, B., and Dando, R. (2019). Environmental immersion’s influence on hedonics, perceived appropriateness, and willingness to pay in alcoholic beverages. Foods 8 (2), 42. doi:10.3390/foods8020042
Rolls, E., Burton, M., and Mora, F. (1976). Hypothalamic neuronal responses associated with the sight of food. Brain Res. 111 (1), 53–66. doi:10.1016/0006-8993(76)91048-9
Rolls, E. T., Rolls, B. J., and Rowe, E. A. (1983). Sensory-specific and motivation-specific satiety for the sight and taste of food and water in man. Physiology Behav. 30 (2), 185–192. doi:10.1016/0031-9384(83)90003-3
Schöniger, M. K. (2022). The role of immersive environments in the assessment of consumer perceptions and product acceptance: a systematic literature review. Food Qual. Prefer. 99, 104490. doi:10.1016/j.foodqual.2021.104490
Schwind, V., Knierim, P., Haas, N., and Henze, N. (2019). “Using presence questionnaires in virtual reality,” in Proceedings of the 2019 CHI Conference on Human Factors in Computing Systems (ACM). doi:10.1145/3290605.3300590
So, B. P.-H., Lai, D. K.-H., Cheung, D. S.-K., Lam, W.-K., Cheung, J. C.-W., and Wong, D. W.-C. (2022). Virtual reality-based immersive rehabilitation for cognitive- and behavioral-impairment-related eating disorders: a VREHAB framework scoping review. Int. J. Environ. Res. Public Health 19 (10), 5821. doi:10.3390/ijerph19105821
Souchet, A. D., Lourdeaux, D., Pagani, A., and Rebenitsch, L. (2022). A narrative review of immersive virtual reality’s ergonomics and risks at the workplace: cybersickness, visual fatigue, muscular fatigue, acute stress, and mental overload. Virtual Real. 27 (1), 19–50. doi:10.1007/s10055-022-00672-0
The GIMP Development Team (2019). Gimp. URL: https://www.gimp.org.
Ung, C.-Y., Menozzi, M., Hartmann, C., and Siegrist, M. (2018). Innovations in consumer research: the virtual food buffet. Food Qual. Prefer. 63, 12–17. doi:10.1016/j.foodqual.2017.07.007
van der Waal, N. E., Janssen, L., Antheunis, M., Culleton, E., and van der Laan, L. N. (2021). The appeal of virtual chocolate: a systematic comparison of psychological and physiological food cue responses to virtual and real food. Food Qual. Prefer. 90, 104167. doi:10.1016/j.foodqual.2020.104167
Wang, Q. J., Escobar, F. B., Mota, P. A. D., and Velasco, C. (2021). Getting started with virtual reality for sensory and consumer science: current practices and future perspectives. Food Res. Int. 145, 110410. doi:10.1016/j.foodres.2021.110410
Wobbrock, J. O., Findlater, L., Gergle, D., and Higgins, J. J. (2011). “The aligned rank transform for nonparametric factorial analyses using only anova procedures,” in Proceedings of the ACM Conference on Human Factors in Computing Systems (CHI ’11) (New York: ACM Press), 143–146. URL: http://depts.washington.edu/aimgroup/proj/art/.
Keywords: 3D graphics, visual quality, sensory evaluation, virtual reality, eating desire
Citation: Ramousse F, Raimbaud P, Baert P, Helfenstein-Didier C, Gay A, Massoubre C, Galusca B and Lavoué G (2023) Does this virtual food make me hungry? effects of visual quality and food type in virtual reality. Front. Virtual Real. 4:1221651. doi: 10.3389/frvir.2023.1221651
Received: 12 May 2023; Accepted: 29 June 2023;
Published: 14 August 2023.
Edited by:
Maria Limniou, University of Liverpool, United KingdomReviewed by:
Alexander Toet, Netherlands Organisation for Applied Scientific Research, NetherlandsLoukia Tzavella, University of Liverpool, United Kingdom
Copyright © 2023 Ramousse, Raimbaud, Baert, Helfenstein-Didier, Gay, Massoubre, Galusca and Lavoué. This is an open-access article distributed under the terms of the Creative Commons Attribution License (CC BY). The use, distribution or reproduction in other forums is permitted, provided the original author(s) and the copyright owner(s) are credited and that the original publication in this journal is cited, in accordance with accepted academic practice. No use, distribution or reproduction is permitted which does not comply with these terms.
*Correspondence: Florian Ramousse, florian.ramousse1@ec-lyon.fr