Abstract
Yosemite, Kings Canyon, and Sequoia national parks protect over 1,200 mountain lakes. These lakes provide healthy homes for plants and animals and supply clean water to downstream communities. These clear blue lakes are high up in the mountains, where they receive very low amounts of nutrients from the watershed. Nutrients help living things grow and be healthy. However, human activities from communities upwind are adding nutrients into the air. These nutrients travel on air currents to remote watersheds via rain, snow, and dry particles. They increase lake algae growth, which disrupts the balance of plants and animals. We conducted experiments to determine the amount of nutrients it takes to increase algae growth. We compared these levels to current lake nutrient concentrations and found that over half of the lakes had concentrations that were below the determined early warning point and just under half were at levels of higher concern.
Why Are We Worried About too Many Nutrients in Mountain Lakes?
Why are we worried about nutrients—are they not a good thing? We eat vegetables and fruits and add fertilizer to our gardens so that our bodies and our plants get the nutrients they need to grow and stay healthy. But the lakes in the Sierra Nevada mountains occur in rocky basins with normally low amounts of nutrients. The plants and animals living in these lakes are used to living in water with low nutrient concentrations. Although these lakes are in national parks, the park boundaries do not protect them from air pollution. Nutrients produced by industries, agriculture, and cars and trucks drift into mountain watersheds on air currents and are deposited via rain, snow, and dry particles (Figure 1). These pollutants travel from communities in California’s Central Valley, the San Francisco Bay Area, and as far away as Asia [1, 2]!
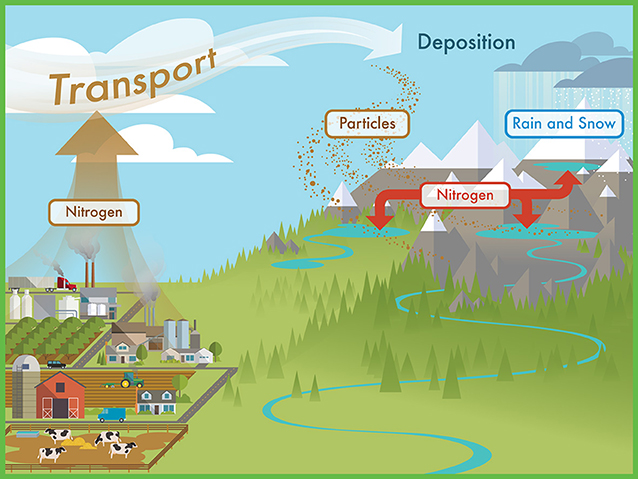
- Figure 1 - Sources of nitrogen include farms, vehicles, and industrial plants located in upwind communities.
- The nitrogen from these sources is transported on air currents up into the mountains. Here, it can fall into mountain watersheds as part of dry particles, rain, or snow.
Nitrogen is one of these pollutants. While nitrogen may be good for plants in our gardens, when too much nitrogen ends up in mountain lakes it can make the water less healthy and upset the balance of plants and animals that live there [3]. Nitrogen can increase the amount of algae in these lakes. When a large amount of algae dies and decays, this process can reduce the amount of oxygen dissolved in lake water. Animals like insects and frogs that live in the water need dissolved oxygen to breathe and survive. These insects and frogs are food sources for other animals such as birds, snakes, and shrews. Thus, changes in nutrients and algae can have cascading effects on the animals that live in the lakes and those that feed on them. Algae can also change the way lakes look—reducing their clarity and making them more green or murky [4]. We can keep track of changes in these lakes by monitoring them and doing research to answer specific questions about nutrients.
Taking the Pulse of Mountain Lakes
Scientists who work in the field of limnology are working hard to protect the mountain lakes in Yosemite, Sequoia, and Kings Canyon national parks. We and our crews of field scientists hike out to lakes every year to collect water samples and take scientific measurements. We monitor 76 lakes in the parks! Nitrogen concentrations are one measurement we collect. We can compare our nitrogen measurements each year to see if they are going up, going down, or staying the same. But we do not understand if these nitrogen amounts will cause too much algae to grow. We do not know how much nitrogen is too much. When a doctor measures your pulse, he or she can tell you if your heart rate is a healthy number, because doctors know how fast a healthy heart should beat. However, we do not know what that healthy number is for nutrients in mountain lakes.
How Can We Test “How Much Is too Much?”
We developed experiments to help us answer how much nitrogen is too much for mountain lakes. We put large containers out in the middle of lakes and filled these containers with lake water (Figure 2). Any algae naturally living in each lake would also be captured in the containers with the lake water. We then added nitrogen to each container. We put a very small amount of nitrogen in the first container, and a slightly higher amount in the second container. We continued adding nitrogen in higher amounts until we had 15 containers. We waited 7 days to give the algae time to take in the nitrogen and grow. We collected water samples before and after the 7 days and measured the amount of algae in each sample.
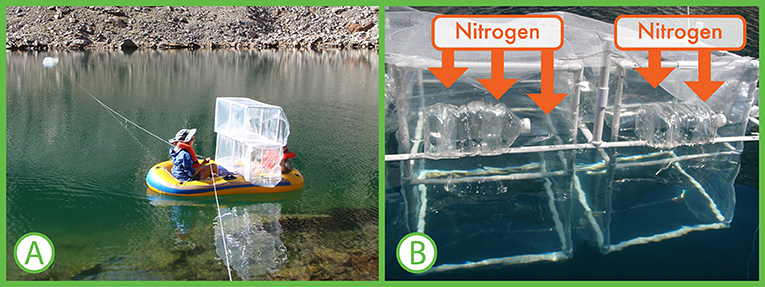
- Figure 2 - (A) We used small inflatable boats to carry and set up containers in the middle of the lake.
- Empty water bottles were used as flotation supports for the containers. (B) We filled the containers with lake water and added different amounts of nitrogen to each of them. This enabled us to develop numeric relationships between nitrogen and algae growth.
We found that as we added more nitrogen, more algae grew (Figure 3). We used a graph to compare the nitrogen concentrations to the amount of algae growth. The graph shows the amount of nitrogen present when algae first start to grow (Figure 3, point A). This is an early warning that we are starting to see too much nitrogen. The graph also shows when the algae start growing really fast (Figure 3, point B). There are too many nutrients at this point. Last, the graph shows when the algae growth is at its highest point and it starts to level out (Figure 3, point C). This means that there is more nitrogen than the algae can use—the algae cannot grow fast enough to keep up. At high nitrogen concentrations other nutrients like phosphorus can limit algae growth [5].
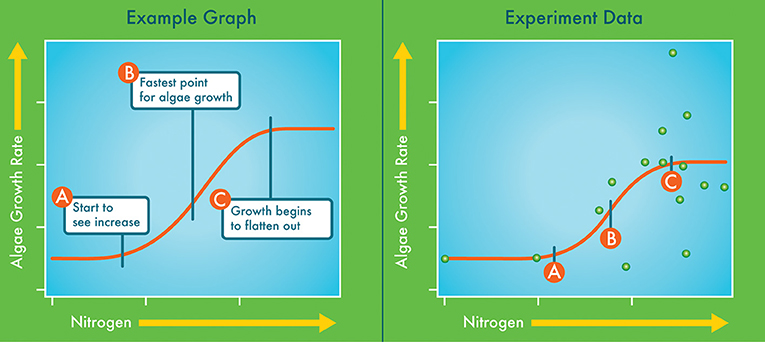
- Figure 3 - The graph on the left shows the general relationship between nitrogen and algae growth.
- The three levels of nitrogen that we examined are labeled A, B, and C along the curve. The graph on the right shows data from one of our experiments (green circles). The orange line shows the curve that fits our data. Our data allowed us to determine the nitrogen concentrations for points A, B, and C. For example, we observed increased algae growth when nitrogen reached 4–12 ppb.
We want to pay the most attention to when nitrogen concentrations reach that first early warning point (Figure 3, point A). We learned from our experiments that we reach this point when nitrogen concentrations are between 4 and 12 parts per billion (ppb). This is a very low amount of nitrogen—a ppb is like adding a half teaspoon of dye to an Olympic-size pool! It takes very little nitrogen to make algae grow faster than we want. But by knowing what this amount is and paying attention early, we will have time to act and protect our mountain lakes. If we wait too long, the changes in nutrients and algae will upset the balance of plants and animals that live in these lakes.
Location Matters
We looked more closely at which lakes have higher nitrogen concentrations and learned that their locations on the landscape were important. Lakes found at the highest places of the Sierra Nevada mountains, or in rocky, steep watersheds, may have more nitrogen because few plants grow there. Plants take up and store nitrogen and reduce the amount of nitrogen that reaches streams and lakes. Water, and the nutrients in it, also travels more quickly down steep slopes. This means more nitrogen reaches the lakes that are located in areas with steep slopes surrounding them. Location is not everything, but it does matter for some lakes!
There Is Still Time to Make a Difference
We compared the amounts of nitrogen we measured in the 76 lakes we monitor to the amounts we defined in our experiments and calculated the percentage of lakes that exceeded each level. We found that up to 13% of these lakes were below levels of concern (meaning they had healthy nitrogen levels), 37% had nitrogen concentrations that were at the early warning point (A), 29% were at the most rapid growth point (B), and 21% were at the high nitrogen point (C) where algae have more nitrogen than they can use. The good news is that over half of the lakes had nitrogen levels that were healthy or at the early warning point. So, while we are seeing too many nutrients in some lakes, many lakes are still healthy.
How can we use this information to reduce the amount of pollution reaching mountain lakes? As scientists, we can make sure that national park managers have the information they need to communicate about the health of these lakes to the public (that is you!) and to policymakers. The public and policymakers have the power to make decisions that will improve our air and water quality.
Is there anything you can do? Yes! The everyday choices that you make can help reduce pollution. For example, you can buy more food locally, such as from farmers’ markets and local small farms, so it does not have to be transported from faraway places. You can try to use cars less often and bicycles and public transportation more frequently. Also, you can find out if your community is taking actions to protect air and water quality. Get involved! If you are interested in this topic and want to help, you can make a difference!
Glossary
Nutrients: ↑ A substance used by organisms to survive, grow, and reproduce. Nitrogen is an important nutrient, as it is part of many proteins used by plants and animals.
Watersheds: ↑ Land area that channels rainfall and snowmelt to streams and rivers, and eventually to lakes, bays, and oceans. Watersheds are separated by higher land areas like ridges.
Algae: ↑ Aquatic plants ranging from single-celled phytoplankton to multicellular forms like kelp. Algae contain pigments that allow them to use sunlight to make their own food from water and carbon dioxide.
Limnology: ↑ The study of the chemistry, biology, and physics of inland waters. Similar to oceanography but performed in mainly freshwater environments.
Nitrogen Concentrations: ↑ The mass or weight of nitrogen in 1L of water. We report nitrogen concentration using the units of parts per billion (ppb).
Conflict of Interest
The authors declare that the research was conducted in the absence of any commercial or financial relationships that could be construed as a potential conflict of interest.
Acknowledgments
Michael Warner, Visual Information Specialist, National Park Service, created the figures for this article. Figure 1 was adapted and re-created by Warner from a graphic developed initially through the Air Resources Division of the National Park Service, by Jeff Lempke of Colorado State University.
Original Source Article
↑Heard, A. M. and Sickman, J. O. 2016. Nitrogen assessment points: development and application to high-elevation lakes in the Sierra Nevada, California. Ecosphere 7:1–20. doi: 10.1002/ecs2.1586
References
[1] ↑ Bytnerowicz, A., Tausz, M., Alanso, R., Jones, D., Johnson, R., and Grulke, N. 2002. Summer-time distribution of air pollutants in Sequoia National Park, California. Environ. Poll. 118:187–203. doi: 10.1016/S0269-7491(01)00312-8
[2] ↑ Vicars, W. C., and Sickman, J. O. 2011. Mineral dust transport to the Sierra Nevada, California: loading rates and potential source areas. J. Geophys. Res. Biogeosci. 116:G1. doi: 10.1029/2010jg001394
[3] ↑ Aczel, M. 2019. What is the nitrogen cycle and why is it key to life? Front. Young Minds 7:41. doi: 10.3389/frym.2019.00041
[4] ↑ Goldman, C. R. 1988. Primary productivity, nutrients, and transparency during the early onset of eutrophication in ultra-oligotrophic Lake Tahoe, California-Nevada. Limnol. Oceanogr. 33:1321–33. doi: 10.4319/lo.1988.33.6.1321
[5] ↑ Sterner, R. W. 2008. On the phosphorus limitation paradigm for lakes. Int. Rev. Hydrobiol. 93:433–45. doi: 10.1002/iroh.200811068