Season and No-Till Rice Crop Intensification Affect Soil Microbial Populations Involved in CH4 and N2O Emissions
 Ana Fernández-Scavino1
  Daniela Oreggioni1
  Andrea Martínez-Pereyra1
  Silvana Tarlera1 José A. Terra2
  Pilar Irisarri3*
- 1Área Microbiología, Departamento de Biociencias, Facultad de Química, Universidad de la República, Montevideo, Uruguay
- 2Instituto Nacional de Investigación Agropecuaria (INIA), Programa Producción de Arroz, Estación Experimental INIA Treinta y Tres, Treinta y Tres, Uruguay
- 3Laboratorio de Microbiología, Departmento de Biología Vegetal, Facultad de Agronomía, Universidad de la República, Montevideo, Uruguay
Rice is an important source of methane (CH4) and other crops may be sources of nitrous oxide (N2O), both of which are powerful greenhouse gases. In Uruguay, irrigated rice rotates with perennial pastures and allows high productivity and low environmental impact. A long-term experiment with contrasting rice rotation intensification alternatives, including rice–soybean and continuous rice, was recently carried out in an Argialboll located in a temperate region of South America. To know if rotation systems influence soil microbial activity involved in CH4 and N2O emissions, the abundance and potential rate for gas production or consumption of microbial populations were measured during the rice crop season. CH4 was only emitted when rice was flooded and N2O emission was not detected. All rotational soils showed the highest rate for methanogenesis at tillering (30 days after rice emergence), while for methanotrophy, the maximum rate was reached at flowering. The abundance of related genes also followed a seasonal pattern with highest densities of mcrA genes being observed at rice flowering whereas pmoA genes were more abundant in dry soils after rice harvest, regardless of the rotation system. Differences were found mainly at tillering when soils with two consecutive summers under rice showed higher amounts of mcrA and pmoA gene copies. The potential denitrification rate was highest at the tillering stage, but the abundance of nirK and nirS genes was highest in winter. Regarding ammonium oxidation, bacterial amoA abundance was higher in winter while the archaeal amoA gene was similar throughout the year. A strong influence of the rice growth stage was registered for most of the parameters measured in rice paddy soils in this no-till rice intensification experiment. However, differences among rotations begin to be observed mainly at tillering when the abundance of populations of the methane and nitrous oxide cycles seemed to respond to the rice intensification.
Introduction
Uruguay has one of the highest rice yield potentials in the world, with farmers averaging more than 8,000 kg ha−1 (1, 2). Recently, Pittellkow et al. (3) concluded that the increase in rice yield during 20 years in Uruguay was obtained with high resource-use eco-efficiencies and low environmental impact. This sustainable increase in productivity was related, among other factors, to the predominant production system where flooded rice rotates the use of soil with diverse pastures advocated for beef and wool production during 2–4 years.
In rice–pasture systems, the soil is exposed in different periods to both oxic and anoxic conditions. These changes in soil redox conditions can favor different microbiological processes.
Under anaerobic conditions, CH4 is the main greenhouse gas (GHG) emitted as the end product of the degradation of organic matter (4) and is also the principal contributor to global warming potential in rice systems (5). The CH4 emission from flooded rice soils results from the balance between CH4 production in the anoxic deep layers and its oxidation to CO2 by methanotrophic bacteria during upward diffusion through oxic soil/water layers (6). Another important GHG produced by agricultural activities is nitrous oxide (N2O) (7). In contrast to CH4 emissions, N2O emissions from paddy rice fields are a result of both aerobic and anaerobic conditions, which include nitrification–denitrification processes, respectively. In nitrification, N2O is a side product, and the process can also provide NO3− to denitrification, while in denitrification, N2O can be an intermediate or an end product.
Water management and previous land use under aerobic conditions are strategies proposed to mitigate CH4 emissions from rice cultivation (8, 9). In a previous 3-year study, we showed that an alternative system of controlled deficit irrigation allowing for wetting and drying (AWDI) delayed and decreased the seasonal emission of CH4 in comparison with the usual Uruguayan irrigation system of continuous flooding between V4 stage and physiological maturity (10). Different crop rotations of flooded rice with upland crops such as rice–maize (11), wheat–rice (12), and soybean–rice (13) are common agricultural practices across tropical and subtropical Asia where rice is the most important crop. In rice–soybean rotations, 1 year of summer soil submersion is followed by another year of summer drained conditions where soybean is cultivated. Even more extended periods of aerated soil conditions are present in the typical Uruguayan management of rice fields where 1–3 years of rice cultivation during summer is followed by 2–4 years of grazed pastures with cattle, giving rotation systems of several phases. Previous land management with short- or long-term aerobic conditions can strongly affect the relative importance of CH4 contribution to GHG in comparison to N2O as well as the onset of CH4 emissions in rice paddies. Several authors have studied the effect of water management on GHG emissions measuring gas fluxes in paddy fields (9, 10, 14). Less is known on the specific impact of previous land use on microbial communities present in the soil and the consequent C and N cycling processes and, in return, its effect on GHG fluxes.
A preferred approach for studying functional groups of microorganisms involved in CH4 and N2O emissions is the use of specific genes encoding enzymes involved in these processes. The final key step of methane production by methanogenic archaea is catalyzed by methyl-coenzyme M reductase whose α-subunit encoded by the highly conserved mcrA gene is commonly used for analysis of methanogenic communities in rice fields (15). On the other hand, the generated CH4 can be further oxidized by the methanotrophs present in soil. The pmoA gene has been used as the indicator for the methanotrophs in rice ecosystems (16).
Under anaerobic conditions, N2O is mainly produced by denitrification through a series of reduction steps catalyzed by specific enzymes of functional genes (17, 18), which can be further reduced to N2 via nitrous oxide reductase (nosZ). In this study, we focused on the abundance of genes encoded by nitrite reductase (nirS/nirK), which catalyzes the limiting step of denitrification reducing to NO, and on the abundance of the nosZ gene. Aerobically, can be oxidized to by ammonia-oxidizing archaea and bacteria (AOA and AOB, respectively), through ammonia monooxygenase encoded by amoA gene. The combined use of these genes can be useful as an indicator of the potential for one or both processes to occur. The quantification of ribosomal and functional genes as well as the microcosm assays to determine microbial potential activities are useful to assess microbial biogeochemical processes involved in GHG emissions in soils (15, 19, 20).
We measured CH4 and N2O emissions and soil microbial activity from three contrasting rice rotation systems (perennial pasture–rice; soybean–rice, and continuous rice) during the rice crop growing cycle to assess specific microbial community responses to the rice intensification. The systems were no-till, excluding soil tillage, and preventing crop or pasture residue from being incorporated into the soil. Rice was sown in the field full of residue from the previous crop. Additionally, measurements were performed in winter, under non-flooded conditions, to assess the effect of the previous summer crop on the microbial soil carbon and nitrogen transformations. Quantitative polymerase chain reaction (qPCR) targeting CH4 and N2O-related functional genes was used to assess the abundance of microbial populations potentially involved in GHG emissions. In addition, soil incubation experiments were performed to assay potential rates of CH4 production and consumption, denitrification, and nitrification. The work aimed to compare the effect of rice intensification in the microbial C and N transformations involved in CH4 and N2O emissions at different stages of the rice growing cycle in a long-term experiment that has been recently installed.
Materials and Methods
Site Description and Experimental Design
An 8-ha field-scale experiment was installed in 2012 in a 30-year rice–pasture rotation field located in Treinta y Tres-Uruguay (33° 16′ 23″ S; 54° 10′ 24″ O; 22 MASL) at the INIA (National Institute of Agricultural Research) “Paso de la Laguna” Research Unit. The dominant soil at the site is an Argialboll with a slope <0.5% (21). Soil physicochemical properties (0–15 cm) when the experiment was installed were as follows: TOC 14.2 g kg−1, TN 1.4 g kg−1, P Bray 7.0 μg g−1, and pH 5.7. Mean annual temperature at the site is 22.3°C in summer and 11.5°C in winter. Rainfall is evenly distributed throughout the year, with a total annual mean of 1,360 ± 315 mm; annual total potential evapotranspiration is 1,138 ± 177 mm.
The experiment consists of six rice rotation systems under no till with contrasting soil use intensity determined by the proportion of crops and pastures in the rotation (22). In this work, we analyzed three rotation treatments: continuous rice (Oryza sativa) (cR; rice every summer); rice–soybean (Glycine max), a 2-year rotation cycle with soybean alternating with rice in summer; and rice–ryegrass (Lolium multiflorum Lam.) in winter—rice, 3 years of perennial pasture of tall fescue (Festuca arundinacea), white clover (Trifolium repens), and birdsfoot trefoil (Lotus corniculatus), a 5-year rotation cycle with 2 consecutive years of rice followed by 3 years of pastures. Cover crops of annual ryegrass (Lolium multiflorum) or Trifolium alexandrinum L. were installed in fall–winter between cash crops in all rotations; pastures were rotationally grazed with lambs during the year. The experimental design consisted in a randomized complete block with three replications and all phases of rotations present simultaneously (23). Each plot measures 20 ×60 m and was isolated from other plots by levees to control rice flood. Rice was no-till drill seeded in the last week of October 2015, emerged on November 10, and was flooded ~4 weeks after emergence at rice V4–V5 stages.
The nitrogen was broadcasted as urea and fractionated 60% at V4 (dry soil) and 40% at R0 (flooded soil) growing stages. In soybean–rice and pasture–rice rotations, nitrogen dose (40 kg N ha−1 year−1) was based on soil nitrogen mineralization potential, while in continuous rice, it was based on crop demand (148 kg N ha−1 year−1) (22). Other relevant information for these no-till systems is the amount of dry matter left on the soil after crops and winter covers, which is highest for rice residues (9 Mg ha−1), followed by perennial pasture (7 Mg ha−1), soybean (3.8 Mg ha−1), and finally winter covers (between 2 and 3 Mg ha−1). Other crop management practices, including fertilization, pest and weeds control, and rice cultivars seeded, were chosen for each specific rotation treatment to optimize rice productivity. More details of the experiment are reported in Macedo et al. (22).
Sampling
Soil samples were taken from each plot in the three replicated blocks. Six phases of three rotation were sampled (Table 1): continuous rice (cR), the two phases of the rice–soybean rotation (rice phase Rs and soybean phase rS), and three phases of the rice–pasture rotation: first year of rice (Rrppp), second year of rice (rRppp), and third year of pasture (rrppP). Samples were taken between December 2015 and July 2016 and were labeled according to the rice crop cycle: 30 days after emergence (dae) corresponding to rice tillering (vegetative stage, end of seedling stage), 98 dae corresponding to rice flowering, 124 dae corresponding to rice ripening, and at the following winter after harvest (259 days after rice emergence). All samples taken in winter and samples from rS and rrppP corresponded to non-flooded, dry soil.
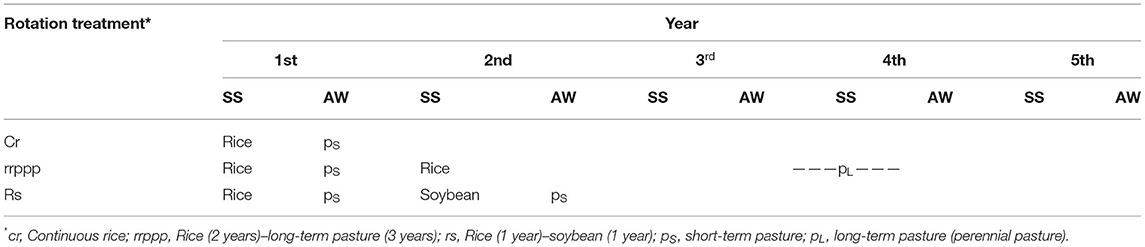
Table 1. Crop rotation system, annual and seasonal schedules (SS, spring–summer; AW, autumn–winter).
Greenhouse Gases (GHG) Measurement
Gas sampling for flooded rice was conducted using the closed-chamber technique (24, 25). The chambers consisted of an aluminum base measuring 60 ×60 ×20 cm (length × width × height) and an aluminum top of the same size. The bases were driven 5 cm deep into the soil before permanent flooding and remained in the soil during the entire growing season. Each base had an open bottom and sealable channels on the sides to allow irrigation water to flow freely, which were sealed during air sampling events. Each base covered three rice plant rows. Additional 20-cm aluminum extensors were stacked on the bases as the rice plants grew taller, and the chamber volume was considered for GHG emission calculations. Each chamber was equipped with (i) a gas sampling port, (ii) a stainless-steel thermometer, and (iii) three battery-operated fans to circulate and homogenize gases within the chamber. Headspace gas samples were obtained with airtight 20-ml propylene syringes and were immediately transferred to pre-evacuated 12-ml glass Exetainer® vials (Labco Ltd., Buckinghamshire, UK). Gas samples from dry soil were taken using smaller chambers with steel bases, 40 cm in diameter and 20 cm in height, that were left in place and inserted 10 cm into the soil. The lid was fitted with a sampling port with a three-way valve and placed on top of the box at the beginning of each gas sampling day when the effective height of each chamber was recorded.
Gas flux measurements were taken between 10:00 and 11:30 a.m., as recommended by Minamikawa et al. (24). Chamber temperature, floodwater depth, and headspace height were recorded and used to calculate gas flux rates from the soil surface to the chamber atmosphere assuming a linear increase in gas concentration over time as described previously (10). Methane and nitrous oxide were analyzed on a GC-FID-mECD 7890 Agilent gas chromatograph with a HayeSep Q 80/100 mesh 1/8 column.
Soil Sampling and Chemical Analysis
Ten random soil core samples from 0 to 10 cm soil layer were collected from each replicated plot, homogenized by hand, composited, and mixed thoroughly. Fresh soils were used for the following analysis: pH (1:1 soil/water extract), moisture content, and microbial activities (denitrifying, nitrifying, methanotrophic, and methanogenic). Air-dried and sieved (2 mm mesh) soils were used for , and soluble organic carbon analysis. Subsamples of fresh soils were stored at −80°C until DNA extraction for molecular analysis.
Soils were extracted in duplicate with 2 M KCl (soil:solution ratio of 1:10) and analyzed for using the standard indophenol blue method and for using the Cu-Cd reduction method followed by the colorimetric modified Griess-Ilosvay method (26).
Soil organic carbon was determined before rice sowing by the method of wet oxidation (27) followed by quantification by spectrophotometry at 600 nm (28). Soil moisture was determined by placing it in an oven at 105°C until constant weight.
Substrate Production or Consumption Rates in Soil Laboratory Incubations
All assays were performed with soil from the three replicated plots.
Potential Rate of Methane Production (MPP) and Oxidation (MOP)
The rate of CH4 production was measured by incubating three replicates of 5 g of fresh soil from the three replicated plots and autoclaved anoxic distilled water in 25-ml pressure vials under a headspace of N2 at 25°C for 2 months. At regular time intervals, the headspace was analyzed for CH4 accumulated by GC as described before.
To measure CH4 consumption, 5 g of fresh soil was incubated with 20 ml of sterile distilled water into 120-ml glass vials. The vials were capped with a cotton plug and incubated at 25°C in the dark for 3 days to deplete any soil organic substrates. At the end of this period, bottles were capped with butyl stoppers and aluminum seals and pure methane was added to obtain 7% CH4 (v/v). The slurries were incubated in the dark at 25°C on a gyratory shaker (120 r.p.m.). The methane concentration in the headspace was monitored by GC-FID analysis (GC-2014, Gas Chromatograph, Shimadzu). Maximum methane oxidation rates were calculated by linear regression analysis of the methane consumption over time.
Potential Denitrification (PDA) and Nitrification Activity Rate (PNA)
Denitrification rates were measured with the acetylene blockage technique (29). Five grams of fresh soil was added into a 60-ml glass vial followed by 10 ml of sterile distilled water. Vials were flushed with filtered O2-free N2 while the following amendments were aseptically added according to a complete reduction stoichiometry (final concentration): sodium succinate 0.86 mM, potassium acetate 1.5 mM, methanol 2 mM, and KNO3 4.5 mM. Vials were capped with butyl stoppers and aluminum seals and acetylene was added (10% of the headspace) to every vial, and vials were incubated in the dark at 25°C on a gyratory shaker (120 r.p.m.). Samples from the headspace of every vial were removed at several time points for N2O measurement by gas chromatography (GC-2014, Gas Chromatograph, Shimadzu); gas chromatography conditions and calculations of denitrification rates were done as described by Tarlera and Denner (30).
Nitrification rate was determined by measuring nitrite accumulation rate over time according to Kalender (31) with some modifications. Vials with 5 g of fresh soil with 15 ml of (NH4)2SO4 1.33 mM, 0.1 ml of sodium chlorate 1.5 mM (to inhibit nitrite oxidation), and 5 ml sterile distilled water were incubated at 28°C on an orbital shaker (180 r.p.m.) for 24 h. Replicate soil suspensions were kept at −20°C as controls. Nitrite concentration extracted with 2 M KCl was measured colorimetrically (Griess-Ilosvay reaction).
Soil DNA Extraction and Quantitative Real-Time PCR Analysis
All assays were performed with soil from the three replicated plots. DNA was extracted from the soil using PowerSoil® DNA Isolation Kit (MO BIO Laboratories, Carlsbad, CA, USA).
Abundance of Bacteria, Archaea, and certain groups of prokaryotes was performed using real-time PCR (qPCR). Specific primers were used to quantify gene copy numbers of Bacteria or Archaea (16S rRNA), methanogens (mcrA), methanotrophs (pmoA), denitrifiers (nirS and nirK), complete denitrifiers (nosZ), and nitrifiers of the domain Bacteria and Archaea (amoA) (Primer's information is detailed in Supplementary Table 1). Amplifications were performed on a Rotor-Gene® 6000, model 5-Plex (CORBETT Research Sydney) using SYBR Green I for detection. The samples were amplified in 10-μl reaction volumes containing 1 μl of concentrated or 10-fold diluted template DNA, 0.5 μM of each primer (except pmoA primer, 1 μM), and 5 μl of Rotor-Gene SYBR Green PCR Mastermix (QIAGEN®, Hilden, Germany). The thermal cycle consisted of an initial step at 95°C for 5 min for all genes followed by 40 cycles of 95°C for 5 s and 60°C for 10 s for mcrA and pmoA; 30 cycles of 95°C for 5 s and 55°C for 10 s for bacterial 16S rRNA; 35 cycles of 95°C for 5 s and 60°C for 10 s for nirS, nirK, and nosZ. Fluorescence was recorded in a single step at 80°C for 1 vs. for all genes except for pmoA, which was done at 82°C for 1 s. A melting curve was obtained after each amplification by increasing temperature from 60 to 94°C at a rate of 1°C s−1 in order to verify the specificity of amplification. Standard curves were obtained using gradient dilutions of standard plasmids containing archaeal 16S rRNA and mcrA genes and bacterial 16S rRNA, pmoA, nirS, nirK, and nosZ genes with known copy numbers.
Statistical Analysis
Each parameter was tested for normality of distribution and homogeneity of variances using Shapiro-Wilk's test and Levene's test, respectively. Gene abundance data were log-transformed and PDA data were ln-transformed to obtain normal distributions. Comparisons were conducted using ANOVA with a factorial model (phases of rotation treatments, sampling dates, and the interaction of both) followed by Tukey's HSD test.
The PNA and pH were analyzed using the non-parametric Kruskal–Wallis test followed by a Wilcoxon Rank Sum test to determine significant differences between phases of the rotation treatments.
All these statistical analyses were performed in R version 4.1.0 with R studio version 1.4.1717.
In addition, principal component analysis (PCA) was performed and Pearson correlation coefficients were determined to test relationships between the variables related to methane and nitrous oxide cycles, separately for each cycle, using the “prcomp” function in the “vegan” package in R software.
All statistical significance was considered at p < 0.05.
Results
Soil Properties and Rice Yield
Organic carbon (%) was similar for all soils sampled: cR (2.45 ± 0.28), Rrppp (2.41 ± 0.27), rRppp (2.38 ± 0.24), rrppP (1.94 ± 0.32), Rs (2.70 ± 0.44), and rS (2.21 ± 0.56).
Soil pH, ammonia, and nitrate were measured during the crop growing season in all treatments and redox potential was measured only in soils cultivated with rice (Table 2). Soil pH was not affected by the growing season or the rotation system. The soil redox potential decreased from rice tillering (30 dae) to flowering (98 dae) remaining reductive during ripening (124 dae), then soil became oxic in winter, after harvest draining. No significant redox potential differences between rice phases were observed along the sampling time. Ammonia and nitrate followed a seasonal pattern, with the mean of all soils showing the highest value for ammonia at 98 dae and the lowest at 124 dae, whereas nitrate was maximum at 30 dae and minimum at 98 dae.
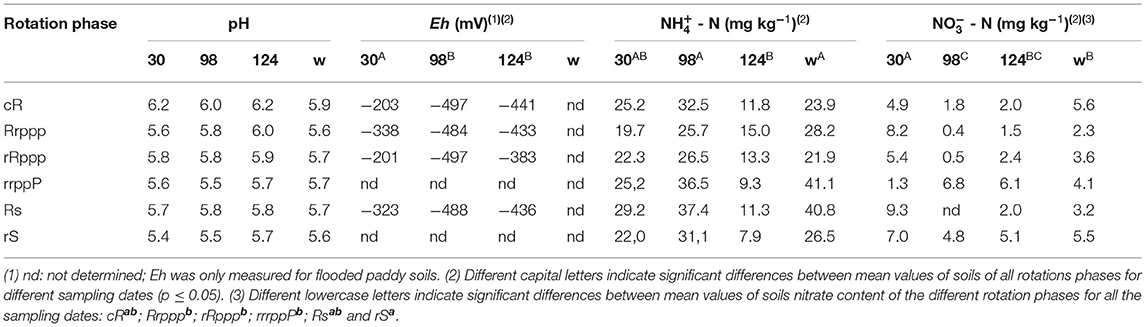
Table 2. Soil properties for each rotation phase at dates corresponding to 30, 98, and 124 dae (days after rice emergence) and in the winter post-harvest.
Rice productivity was high, between 8,766 and 10,286 kg ha−1, but no significant yield differences between rotations were found (Supplementary Table 2).
Dynamics of Bacteria and Archaea
The abundance and dynamics of the bacterial and archaeal populations were evaluated along the crop growing season in all rotations through the quantification of the 16Sr RNA gene. The abundance of Bacteria (Figure 1A) and Archaea (Figure 1B) was greatly affected by the season in all soils. Bacterial density was significantly higher in winter, when none of the soils were flooded, than in other seasons. Bacterial density was significantly higher in winter, when none of the soils were flooded, than in other seasons having a mean value for all treatments of 1.48 ×10⁹ copies g−1 dry soil, which was at least 0.52 logs higher than the mean density in soils at any previous sampling date (Figure 1A). The same trend was observed for archaeal abundance since the mean value for all treatments was 1.15 ×10⁷ copies g−1 dry soil in winter, a value that was significantly higher than the mean value at 30 dae, the beginning of the rice crop season, which was 4.57 ×10⁶ copies g−1 dry soil. The increase in archaeal populations toward winter was less pronounced than for bacteria since in-between sampling dates (95 and 124 dae), intermediate archaeal densities were observed (Figure 1B). These results indicate that microbial biomass, Bacteria, and Archaea, increased significantly for all soils from the beginning of the rice growing season to winter.
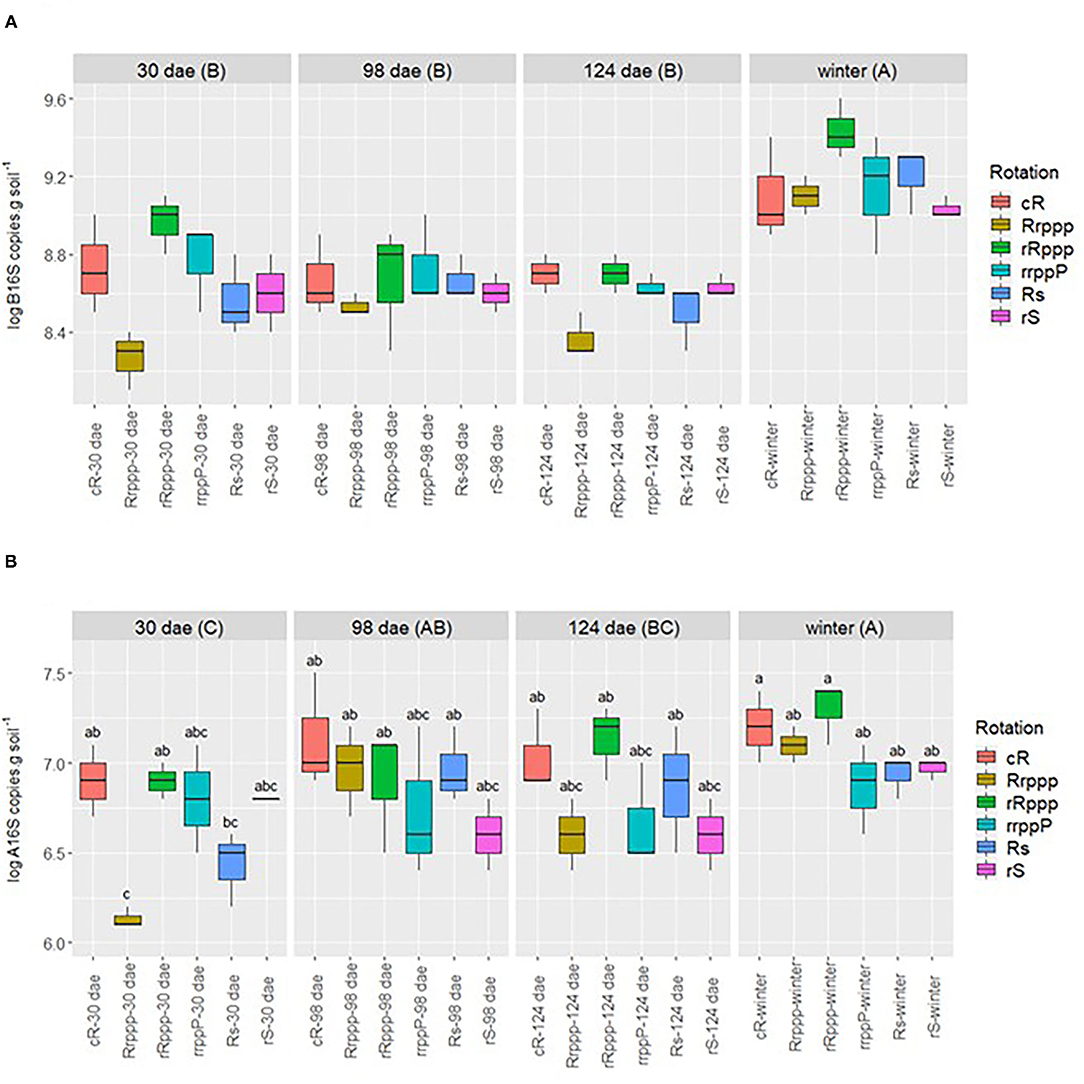
Figure 1. Dynamics of 16S rRNA gene copies of Bacteria (A) and Archaea (B) by g dry soil for all treatments. Sampling dates: days after rice emergence (dae) for all rotations' phases (with or without rice) and winter (259 days after rice emergence). Uppercase letters indicate significant differences between sampling dates for all phases. Lowercase letters next to each sample name indicate significant differences for rotation phases along the year. The differences (p < 0.05) between phases for log B 16S rRNA along all the sampling time were continuous rice rotation (cRab); rice–pasture rotation at the first (Rrpppc); and second (rRpppa) year of rice, or at the third year (rrppPab) of pasture; rice–soybean rotation having rice (Rsabc) or soybean (rSbc) at the crop season. The differences (p < 0.05) between phases for log A 16S rRNA along all the sampling time were as follows: cRa, Rrpppb, rRpppa, rrppPb. Rsab, or rSb. Significant differences of the interaction phases*date are presented in the figure with lowercase letters.
Soils from different rotations' phases also showed significant differences in the abundance of bacterial and archaeal populations during the growing season. Consistent differences were observed within phases of the rotation rice–pasture, where soils of the second year of rice (rRppp) exhibited significantly higher density of bacteria, and archaea, than soils in the first year of rice (Rrppp). The archaeal density seems to be more responsive to previous crop since soils with rice following rice (cR and rRppp) showed significantly higher abundance of archaea than soils that had no rice in the previous summer (rrppP and rS) or soils that had rice and were preceded by 3 years of pasture (Rrppp).
Influence of the Rotation System on Microbial Parameters of the Methane Cycle
To know the effect of the rotation over the potential for methane emission, the abundance and activity of the microbial populations directly involved in methane production and consumption and the methane flux were evaluated at four sampling dates.
Methane Flux
Field measurements of methane flux were performed for all treatments during the annual crop cycle, but methane emission was only detected in flooded rice. The methane production rate was maximum at flowering (98 dae) and ranged between 14,102 g CH4 ha−1 day−1 for Rrppp and 20,951 g CH4 ha−1 day−1 for Rs with no significant differences between treatments (Figure 2). Methane production rate decayed significantly at ripening (124 dae), showing similar flux values for all treatments. Significant differences between treatments were observed only at 30 dae, when soils with rice as previous crop showed higher methane flux (1,699 and 1,435 g CH4 ha−1 day−1 for cR and rRppp, respectively) than the soil with pastures in the previous summer (Rrppp).
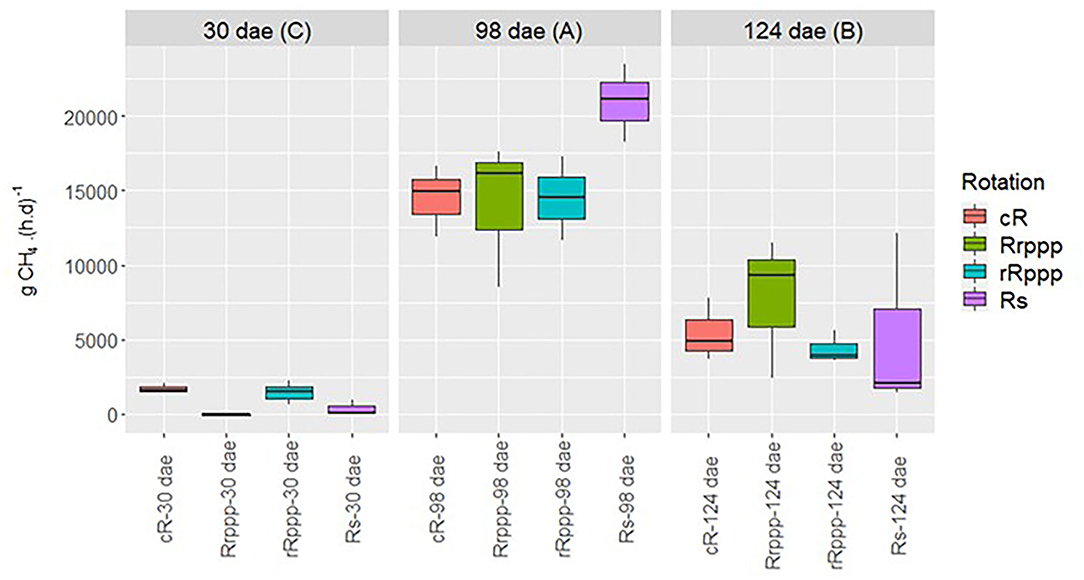
Figure 2. Dynamics of methane flux (g CH4 ha−1 day−1) for rotations' phases with flooded rice. Uppercase letters indicate significant differences between sampling dates for all rice phases. Sampling dates: days after rice emergence (dae) for all treatments. Rotation phases: continuous rice rotation (cR); rice–pasture rotation at the first (Rrppp) or second (rRppp) year of rice; rice–soybean rotation having rice (Rs) at the crop season.
Activity of Methane-Producing and Methane-Consuming Prokaryotes
Soil incubations in microcosm assays were set up to determine the methane production potential (MPP) and the methane oxidation potential (MOP) in the four phases of the rotations that had rice during the summer season. The MPP was strongly influenced by the season showing the highest mean value for all soils (35.3 nmol CH4 h−1 g−1 dry soil) at 30 dae at the beginning of the rice crop season (Figure 3A). Then, the MPP decayed significantly at flowering (19.5 nmol CH4 h−1 g−1 dry soil), ripening (21.8 nmol CH4 h−1 g−1 dry soil), and at the winter after the rice harvest (20.4 nmol CH4 h−1 g−1 dry soil).
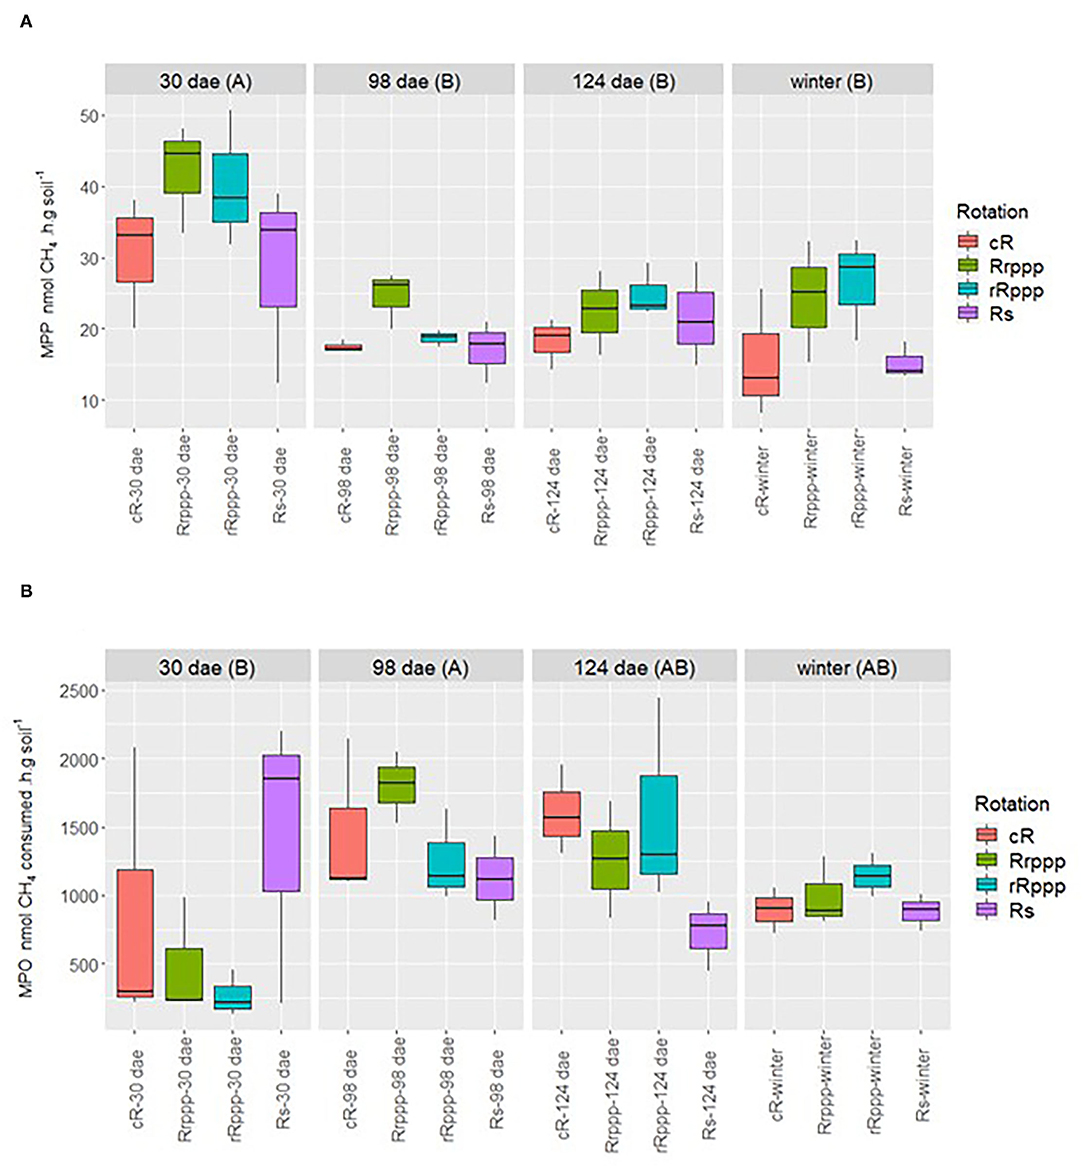
Figure 3. Dynamics of (A) methane production potential (MPP) and (B) methane oxidation potential (MOP) in soils that had rice in summer. Uppercase letters indicate significant differences between sampling dates for all rice phases. Sampling dates: days after rice emergence (dae) for all treatments. Lowercase letters next to each sample name indicate significant differences for these rotation's phases along the year. Rice phases of rotations: continuous rice rotation (cR); rice–pasture rotation at the first (Rrppp) or second (rRppp) year of rice; rice–soybean rotation having rice (Rs) at the crop season. For MPP: cRb; Rrpppa; rRpppab; and Rsab. There were no significant differences between rice phases for MOP.
On the other hand, some minor differences between rotations' rice phases were observed along the whole sampling time. Soil from the rice–pasture rotation having the first rice after pastures (Rrppp) showed significantly higher MPP than soil that had rice every summer (cR).
The methanotrophic activity also revealed a profile influenced by the season (Figure 3B), with consistently high MOP rates for the four soils at flowering that decayed toward winter. The highest rate was observed at 98 dae with a mean value from the four soils of 1,409 nmol CH4 consumed h−1 g−1 dry soil. At the beginning of the rice crop season (30 dae), soils in rotation with pastures exhibited very low methanotrophic activity, but other soils (cR and Rs) showed such dispersion among the values of replicated plots that made it doubtful to assess a behavior for all soils at this stage. No significant differences were observed between soils from different treatments along the season.
Abundance of Methanogenic and Methanotrophic Populations
The abundance of methanogens and methanotrophs was assessed through the quantification of the specific genes mcrA (methanogens) and pmoA (methanotrophs) in soils with rice during the season studied. Season influenced the abundance of methanogenic archaea, showing a consistent decrease in all soils from flowering to winter. The abundance of mcrA gene was significantly higher at flowering than at other sampling times. The mean value for the four soils was 1.55 × 10⁵ copies g−1 dry soil at 98 dae, whereas at ripening and winter, the mean values were 1.05 × 10⁵ copies g−1 dry soil (Figure 4A). The abundance of methanogens was quite heterogeneous among different soils at the beginning of the rice crop season (30 dae), but methanogens increased in all soils by flowering. At tillering, methanogens represented between 1.43 and 3.98% of total Archaea, with the lowest proportion for Rrppp soils and the highest proportion for cR. Soils from the continuous rice system (cR) showed the highest density of mcrA genes having a mean value of 2.09 × 10⁵ copies g−1 dry soil along the four sampling dates (p < 0.05).
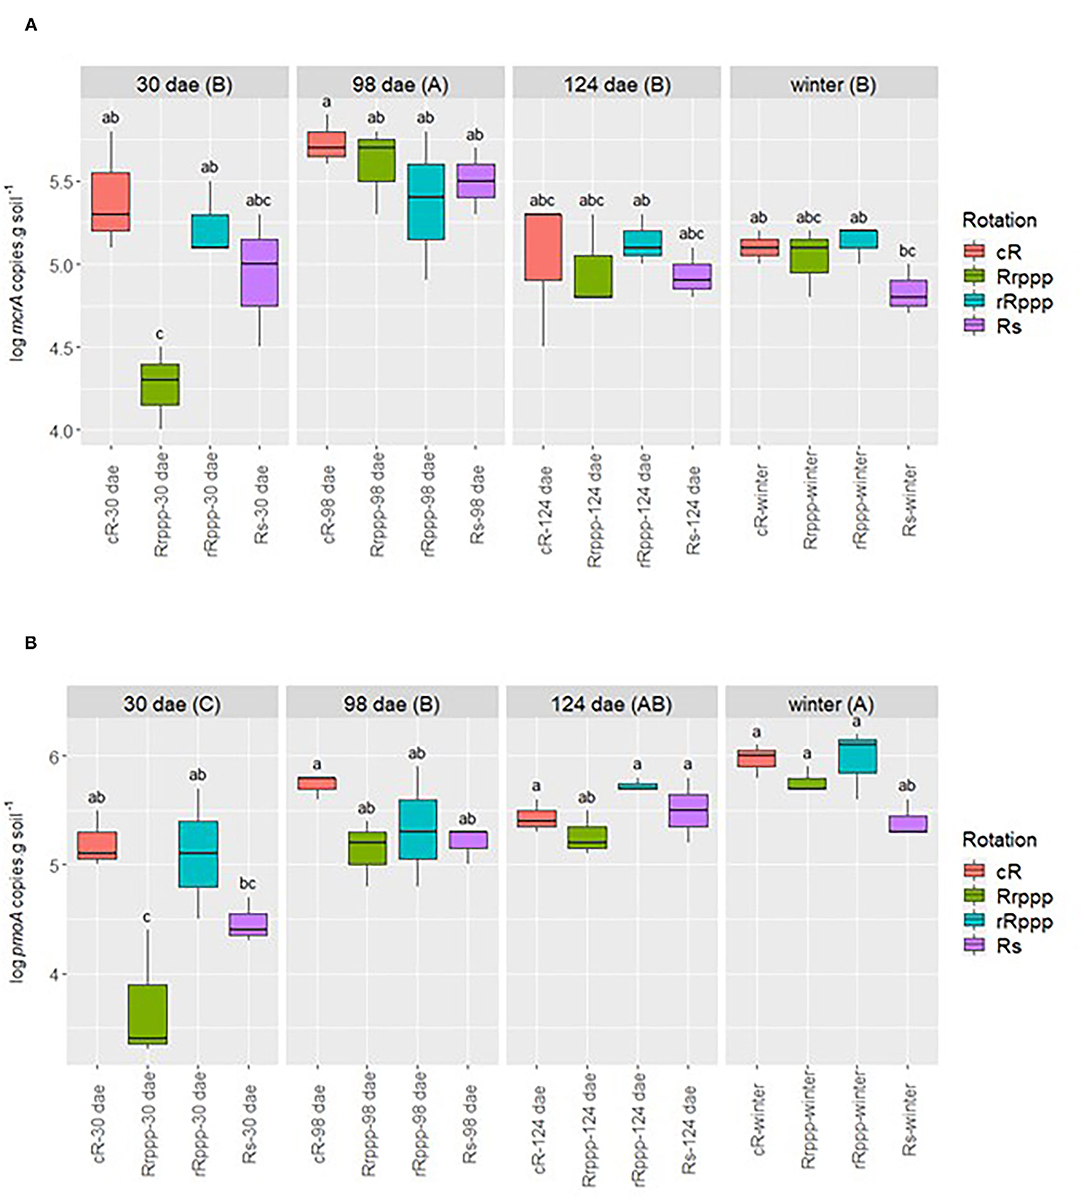
Figure 4. Dynamics of (A) mcrA and (B) pmoA genes in soils having rice in summer. Uppercase letters indicate significant differences between sampling dates for all treatments. Sampling dates: days after rice emergence (dae) for all treatments. Treatments: continuous rice rotation (cR); rice–pasture rotation at the first (Rrppp) or second (rRppp) year of rice; rice–soybean rotation having rice (Rs) at the crop season. The differences (p < 0.05) between phases for mcrA along all the sampling time were cRa, Rrpppb, rRpppab, and Rsab, and those for pmoA were cRa, Rrpppb, rRpppa, and Rsb. Significant differences of the interaction phase*date are presented in the figure with lowercase letters.
The abundance of the pmoA gene revealed a consistent increase of methanotrophic bacteria along the rice crop season for the four soils, reaching the highest density at winter (Figure 4B). The abundance of pmoA increased significantly from a mean value of 2.24 ×10⁵ copies g−1 dry soil at rice flowering (98 dae) to 6.02 × 10⁵ copies g−1 dry soil in winter. Similar to methanogens, methanotrophs showed at tillering different densities for different soils, but their abundance increased consistently at rice flowering in all soils. At tillering, methanotrophs represent between 0.004 and 0.029% of total Bacteria, with the lowest proportion for Rrppp soils and the highest proportion for cR. Contrastingly to methanogens, the abundance of methanotrophs continued to increase after flowering. An interesting trend was observed for soils from different rotations along the season. Soils with rice in the previous crop season (cR and rRppp) showed significantly higher density of pmoA genes than soils that had an upland crop (soybean in Rs) or perennial pasture (Rrppp) previously.
To evaluate the microbiological parameters of the C cycle contributing to soil variability in rice rotations, a PCA was plotted (Figure 5). PC1 and PC2 explained 71.1% of the overall variation for the four sampling dates, revealing that soil samples from different rotations showed higher dispersion at tillering (30 dae) tending to group together when the rice cropping cycle evolve until the winter post rice harvest. Whereas, no correlation was observed between activities and gene abundance, the abundance of mcrA and pmoA genes evidenced a weakly positive correlation (r2 = 0.445, p = 0.002). These results confirmed the strong influence of the phenology of rice crop in the microbial-specific populations of the methane cycle. To analyze the effect of the rotations, PCA was performed for physicochemical and microbiological soil parameters at two sampling dates separately. At tillering, PC1 and PC2 together explained 67.9% of the overall variation (Figure 6A). This biplot shows the separation mainly on the PC1 of rice-cropping systems having no rice in the previous summer (Rs and Rrppp) compared to systems that had two consecutive summers with rice (cR and rRppp), which displayed the highest value of mcrA and pmoA gene copies. The abundance of mcrA and pmoA genes were positively correlated (r2 = 0.729, p = 0.007). In winter, PC1 and PC2 together explained 65.8% of the overall variation (Figure 6B). This biplot shows high environmental heterogeneity among replicates and the separation mainly on the PC1 of Rs compared to other rotation systems. The abundance of mcrA and pmoA genes was also positively correlated (r2 = 0.668, p = 0.0176) and seems to explain the clustering of the other three soils.
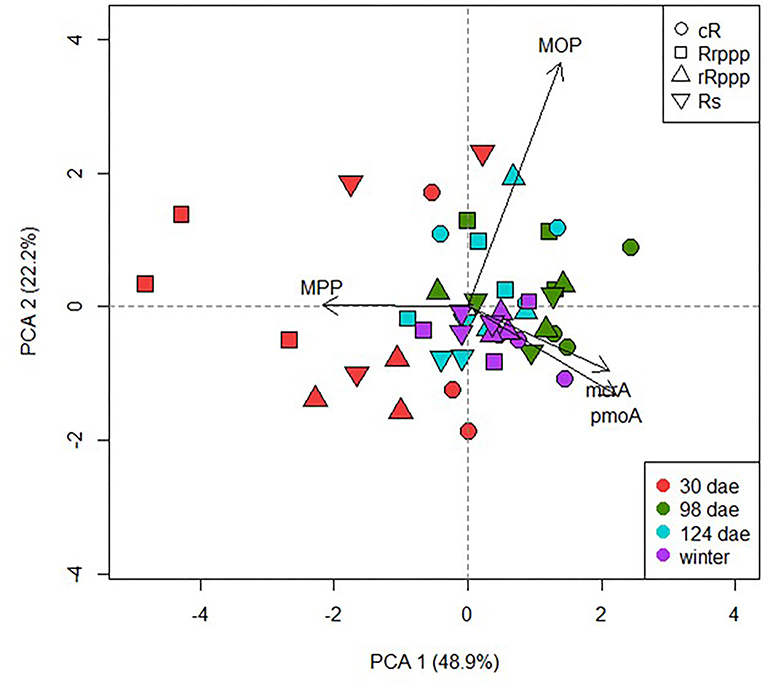
Figure 5. Scatter plot of the two first axis resulting from the principal component analysis displaying the variance explained along the sampling dates among the different rice phases of the rotations: continuous rice rotation (cR); rice–pasture rotation at the first (Rrppp) or second (rRppp) year of rice; rice–soybean rotation under rice (Rs). Based on microbiological parameters (MPP, methane production potential; MOP, methane oxidation potential; mcrA gene copies, and pmoA gene copies).
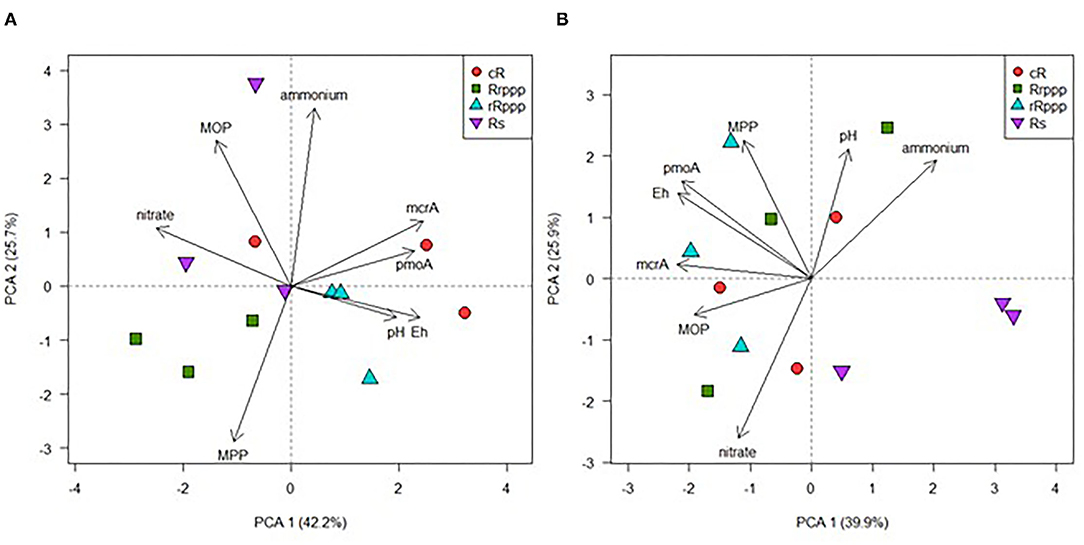
Figure 6. Scatter plot of the two first axis resulting from the principal component analysis displaying the variance explained at 30 dae or tillering (A) and at winter (B) among the different rice phases of the rotations: continuous rice rotation (cR); rice–pasture rotation at the first (Rrppp) or second (rRppp) year of rice; rice–soybean rotation under rice (Rs). Based on soil properties: physicochemical (nitrate and ammonium concentrations, redox potential, and pH) or microbiological parameters (MPP, methane production potential; MOP, methane oxidation potential; mcrA gene copies, and pmoA gene copies).
Influence of the Rotation System on Microbial Parameters of the Nitrous Oxide Cycle
Nitrous oxide emission fluxes were not detected for any of the crops or pasture in the dates studied.
Denitrification Related Genes and Potential Activity
Potential denitrification activity of all soils was significantly higher at rice tillering, 30 dae (average 120 μg N-N2O g soil−1 h−1) than at the other rice stages or in winter and decreased along the year (Figure 7). When considering only the four soils having rice, rRppp showed higher denitrification activity than Rs, 88 and 51 μg N-N2O g soil−1 h−1, respectively.
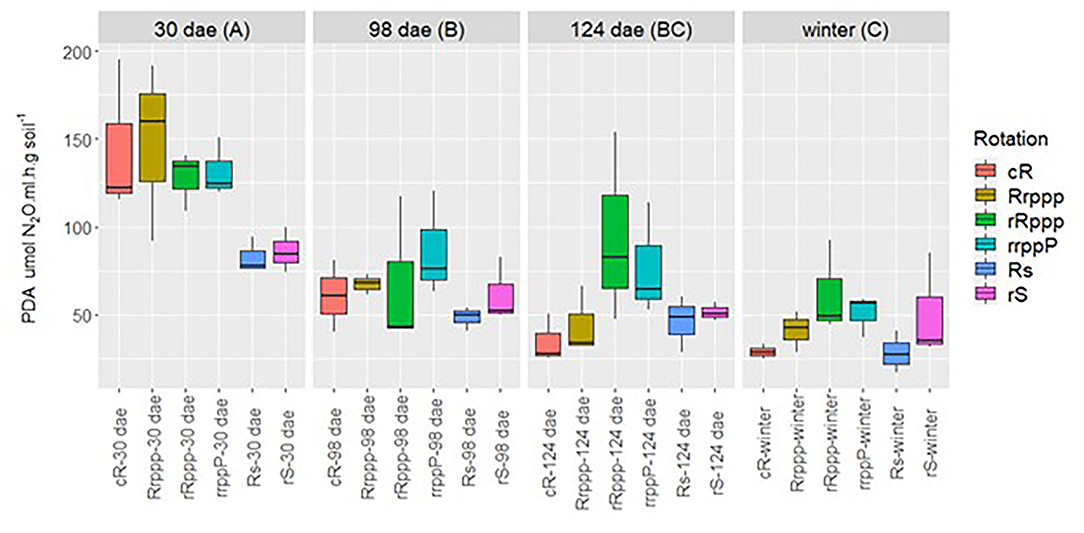
Figure 7. Dynamics of potential denitrification activity (PDA) by g dry soil along the sampling time for all soils. Sampling dates: days after rice emergence (dae) for all treatments (with or without rice) and winter (259 days after rice emergence). Uppercase letters indicate significant differences between sampling dates for all rotations' phases. Lowercase letters next to each sample name indicate significant differences for these phases along the year. Rotations' phases: continuous rice rotation (cRab); rice–pasture rotation at the first (Rrpppab) and second (rRpppa) year of rice, or at the third year (rrppPa) of pasture; rice–soybean rotation having rice (Rsb) or soybean (rSab) at the crop season sampled.
The behavior of some of the functional communities related to N2O emission by denitrification (nirK, nirS, and nosZ) differed for each gene. The nirK abundance was always greater than nirS, ~1 order of magnitude, and the copy number of both genes was highest in winter and lowest at the rice flowering stage (98 dae, Table 3). The nirK abundance was higher for both rRppp and rrppP than for Rs and Rrppp (between 2.5 and 1.3 × 10⁷ nirK copies g−1). In a different way, the abundance of nirS was greater for rRppp (2.2 × 10⁶) than for Rs, rrppP, and Rrppp, (1.5 × 10⁶). The highest abundance of nirS genes was also achieved in winter and the lowest was attained at 98 dae with significant differences among dates (Table 3).
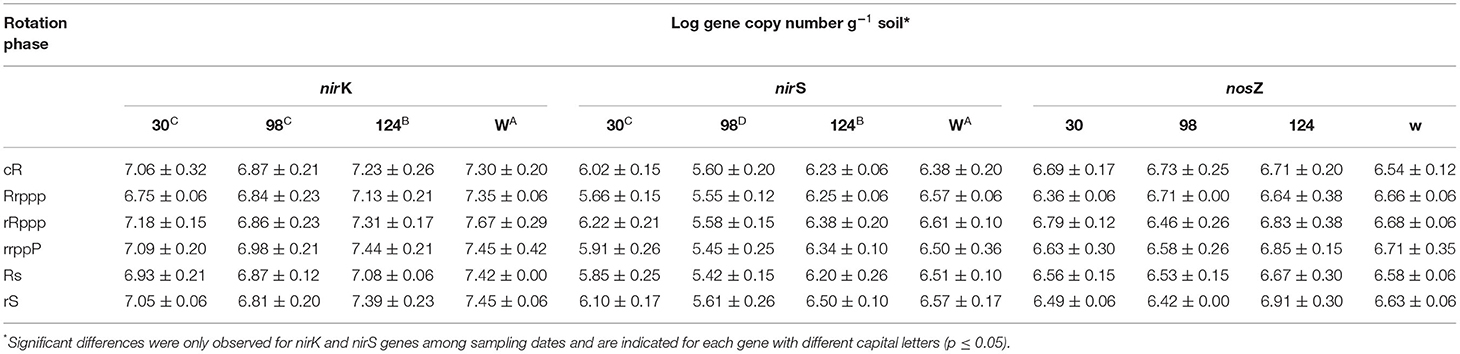
Table 3. Abundance of denitrification marker genes for the different crops and rotation systems at 30, 98, and 124 dae (days after rice emergence) and in winter (W).
The copy number of nosZ was not significantly different for all phases and rotations or sampling dates. However, when analyzing only the tillering stage (30 dae), the second rice after pasture (rRppp) had also higher nosZ abundance than the first rice after pasture (Rrppp), 2.3 vs. 1.9 × 10⁶. The highest PDA was preceded for highest denitrification gene abundance in the same phase of the rotation.
Ammonia Oxidation Potential Activity and amoA Genes Abundance
On the other hand, potential nitrification activity data were not normally distributed, and a non-parametric ANOVA showed that cR ranked lower than Rrppp, rS, and rrppP, these latter two had no rice during the year. At tillering rice stage, ammonia oxidation was lower for rRppp and cR (the two treatments that have had rice the previous season) than for rS and rrppP, average 2 and 23 mg g−1 h−1, respectively (Supplementary Figure 1).
Archaeal ammonia oxidizers were always higher than bacteria (log amoA copies g−1 soil 6.1 and 5.2 on average, respectively). Bacteria ammonia oxidizer number for rice soils was only different between dates, being higher for winter than for 98 or 124 dae (Figure 8A). However, the archaeal amoA copy number was only different among rotations' phases, where the second rice for the classical rotation (rRppp) presented higher values than the first rice of this rotation (Rrppp) along the year, 2.3 vs. 0.7 × 10⁶ (Figure 8B).
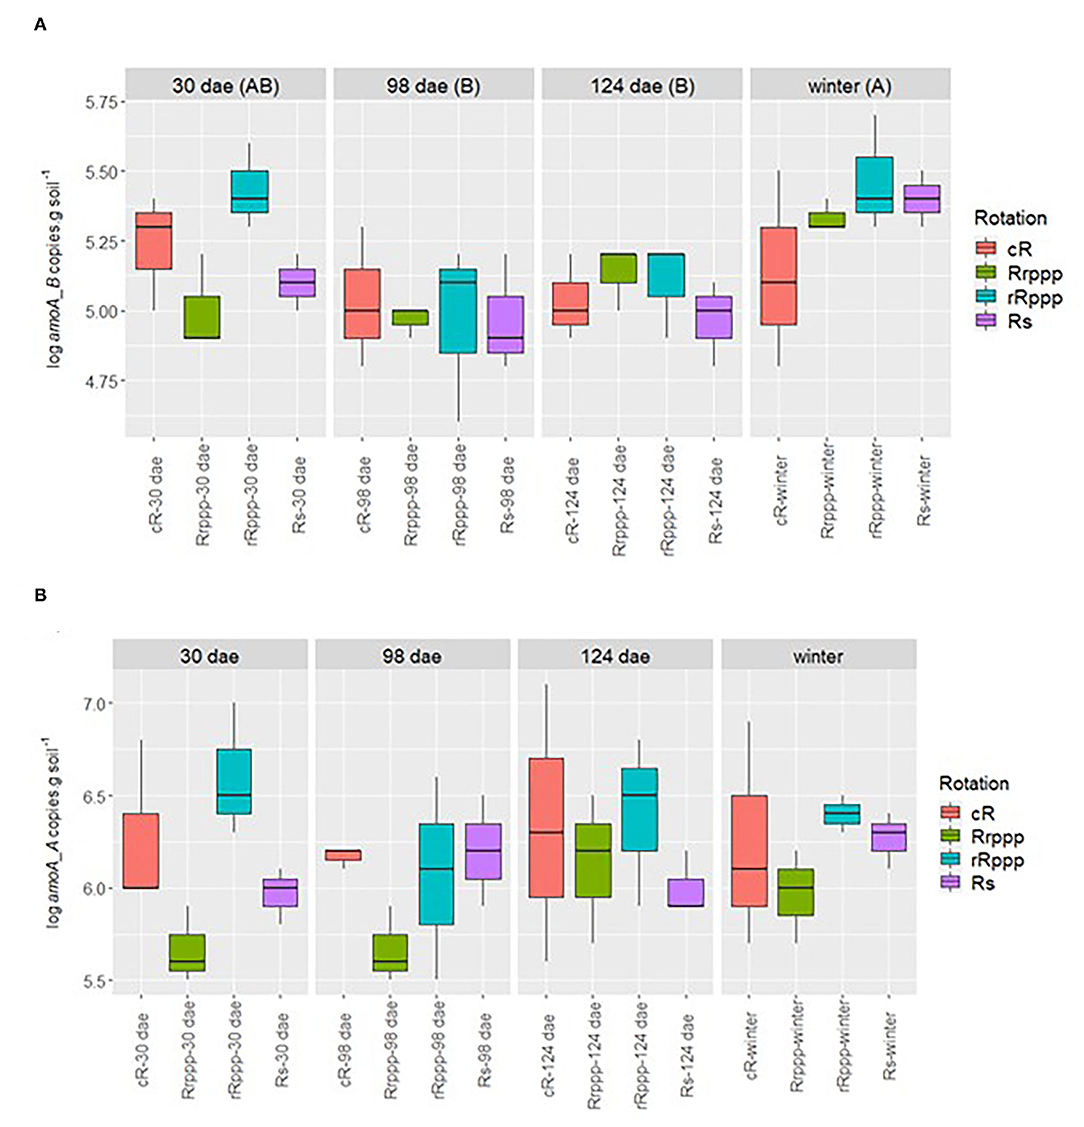
Figure 8. Dynamics of amoA gene copies of Bacteria (A) and Archaea (B) by g dry soil along the sampling time for the soils that had rice during the year. Sampling dates: days after rice emergence (dae) for all treatments (with or without rice) and winter (259 days after rice emergence). Treatments: continuous rice rotation (cR); rice–pasture rotation at the first (Rrppp) or second (rRppp) year of rice; rice–soybean rotation having rice (Rs). Bacteria amoA were only significantly different for sampling date. Archaea amoA were only significantly different for treatments: cRab; Rrpppb; rRpppa; and Rsab.
The PCA for microbiological parameters of the N cycle shows that 63.8% of the variability in rice soils was explained by the two main components (Figure 9). A trend in a seasonal grouping of the samples can be observed along the PC1 associated with the increase of all genes at 124 dae and winter. A high positive correlation between nirK and nirS genes (r2 = 0.796, p = 0.001) was observed, with lower positive correlation coefficients for the complete denitrification set of genes nirK and nosZ (r2 = 0.322, p = 0.026) or nirS and nosZ (r2 = 0.354, p = 0.014). The density of ammonia oxidation genes from bacteria and archaea was also positively correlated (r2 = 0.556, p = 0.001). To analyze the effect of the rotations on the N cycle, PCA was performed for physicochemical and microbiological soil parameters at two sampling dates separately. At the beginning of the rice crop season (30 dae; tillering rice stage) both principal components (PC1 and PC2) explained almost 70% of the overall variation of physicochemical and microbiological soil parameters of N cycle contributing the most to soil rotation variability (Figure 10A). This biplot shows the separation mainly on the PC1 of rice-cropping systems having no rice in the previous summer (Rs and Rrppp) compared to systems that had two consecutive summers with rice (cR and rRppp), which displayed the lowest value of soil nitrate content at this stage. The gene nirK abundance was correlated with the other denitrification genes, nirS and nosZ, and with the abundance of amoA genes, either bacterial or archaeal. The nosZ copy number correlated with redox potential (p = 0.034). Soil nitrate content correlated negatively with nirS and nosZ abundance and positively with PNA and amoA abundance. At winter sampling, PC1 and PC2 together explained only 60.6% of the overall variation (Figure 10B). This biplot shows high environmental heterogeneity among replicates and the separation mainly on the PC1 of cR, the most intensive rice system, compared to other rotation systems. PDA, PNA, and nirK copies were positively correlated at winter sampling.
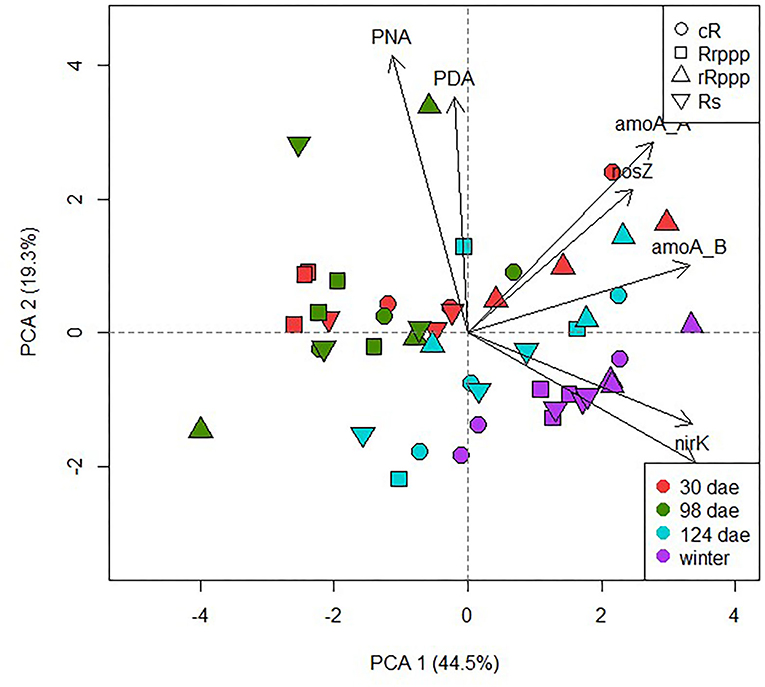
Figure 9. Scatter plot of the two first axis resulting from the principal component analysis displaying the variance explained along the sampling dates among the different rice rotations: continuous rice rotation (cR); rice–pasture rotation at the first (Rrppp) or second (rRppp) year of rice; rice–soybean rotation under rice (Rs). Based on microbiological parameters (PDA, potential denitrification activity; PNA, potential nitrification activity; nirK, nirS, and nosZ gene copies, and amoA of bacteria and archaea gene copies).
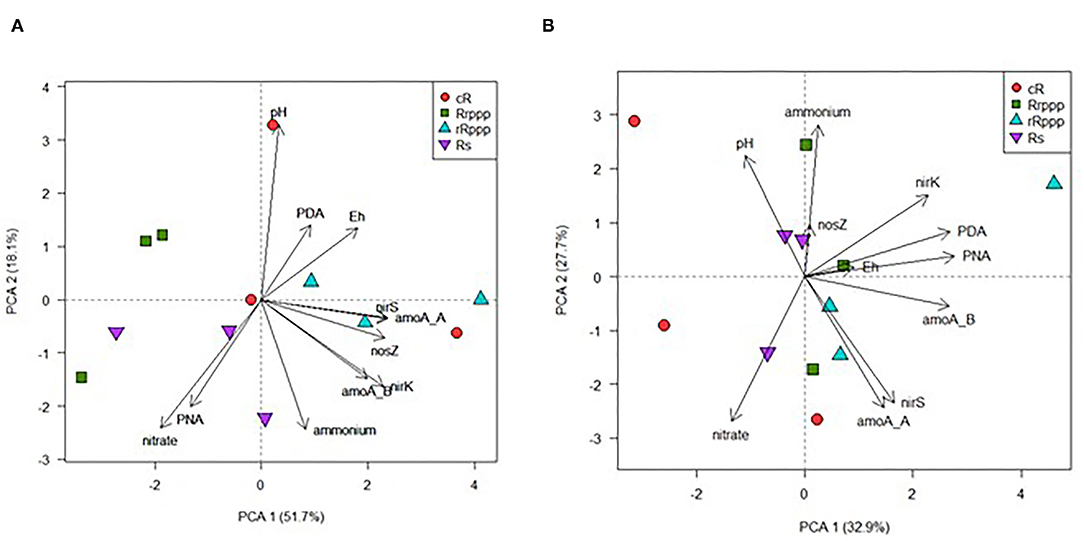
Figure 10. Scatter plot of the two first axis resulting from the principal component analysis displaying the variance explained at 30 dae or tillering (A) and at winter (B) among the different rice rotations: continuous rice rotation (cR); rice–pasture rotation at the first (Rrppp) or second (rRppp) year of rice; rice–soybean rotation under rice (Rs). Based on soil properties: physicochemical (nitrate and ammonium concentrations, redox potential, and pH) or microbiological (PDA, potential denitrification activity; PNA, potential nitrification activity; nirK, nirS, and nosZ gene copies, and amoA of bacteria and archaea gene copies).
Discussion
The rice production system commonly used in Uruguay consists in a cycle of 2–3 consecutive years of rice cropping followed by 2–4 years of perennial pastures of grasses and legumes seeded immediately after rice harvest and grazed by cattle and sheep. This system allows a sustainable increase in productivity, minimizing the use of agrochemicals and contributing to greater resource-use efficiencies (1, 32), although there are still opportunities for sustainable intensification (3). The implementation of more intensive rotation systems, either by increasing the proportion of rice or other crops like soybean and reducing the pasture phase, has become an alternative for farmers to increase productivity and economic options.
The transition from more intensive to less intensive rice rotation system influences microbial community structure (8, 33–35), but the information about the opposite conversion is scarce. In the present work, we studied the response of microbial communities to the intensification, in early steps of this conversion (4 years after intensification was implemented). We examined the abundance and activity of bacteria and archaea linked to GHG emission across three rice growth stages and at one time after rice harvest in soils from rice rotations with different levels of intensification.
The abundance of Bacteria and Archaea was greatly affected by the season in all soils from the three rotational systems studied. It has been observed that the stage of rice growth from seedling to rice maturing had a significant effect on soil abundance of bacterial 16S rRNA gene copies (12) but not in archaea (36). Breidenbach and Conrad (37) reported that bacterial and archaeal 16S rDNA copy numbers were highest during rice growth at reproductive stage. The practice of leaving the straw over the soil after crop harvest in Uruguayan no-till systems likely increases the organic matter available for microbial growth post crop harvest. It has been observed that bacteria, archaea, and methanogenic communities strongly responded to rice straw amendment in laboratory soil incubations by increasing their abundance over the straw degradation period (38). Therefore, our results indicate that the biomass of both archaea and bacteria reached similar densities in rice paddy soils after summer crop season than soils kept under pasture and may indicate that the degradation of vegetal residues is a sustainable agricultural strategy to maintain soil microbial biomass.
The intensification of rice cropping seems to influence the archaeal community since soils with at least two summers of rice showed significantly higher abundance of archaeal 16S rRNA genes than soils that had no rice in the former summer or soils that having rice in the previous summer were preceded by 3 years of pasture. A similar trend of increase was observed for mcrA gene copy numbers in soils having rice more frequently. Consecutive rice cropping has been reported as a main factor raising the archaeal community in soil, moreover due to the increase of methanogenic archaea (8).
Methane emission was only detected in the four soils having rice when soil was flooded, as it was expected since waterlogged soils sustain anaerobic conditions for C fermentation and methanogenesis (39, 40). The highest flux was measured at rice flowering, with rates that were not significantly different for the rotational treatments, then decayed by ripening (Figure 2). Methane flux was minimum at tillering, but significant differences were observed between rotations. Soils under rice in the previous summer showed higher methane flux than soils with pasture or soybean in the previous summer. A similar pattern for methane emission, maximum at flowering, medium at ripening, and minimum at tillering, was observed previously for a more frequent sampling study in Uruguayan systems (10) as well as for other regions where rice is cultivated (41, 42). The maximum CH4 flux measured was higher than the previous measurements (10) but consistent with fluxes reported for other temperate rice cultivated in the region with crop residues maintained on the soil surface (43) or with transplanted rice without organic matter amendments for two rice varieties cultivated in Japan (44). The differences observed in methane emission among soil rotations at tillering were not endorsed by the potential for methane production (MPP) or consumption (MOP), since rates measured for all soils were not significantly different at this stage of plant growth (Figure 3). The MPP was strongly influenced by the season showing the highest mean value at 30 dae for all soils. The organic matter of the stubble from winter cover pastures may result in an increase of fermentable substrates for methanogenesis after soils were flooded and could explain this high potential for methane production. Since methanogenic activity depends on the small range of products of secondary fermentation, it is feasible that at this step, the higher methanogenic activity would be due to the supply of more direct methanogenic substrates rather than to the abundance and activity of methanogenic archaea. The soil organic C determined previously to rice sowing was not different among different rotations, but crop residues from different winter cover pastures should be considered in these no-till systems as nutrient source for methanogenic archaea. Methane emissions are stimulated by improving C substrates either directly, by plant straw amendment (38, 45, 46) and N organic fertilization (47), or indirectly, by increasing the availability of labile forms of soil organic carbon in no-tillage systems (48). In addition, the priming effect that straw addition has on soil organic carbon degradation, by causing a release of dissolved organic carbon, also contributes to increase substrates for methane production (49, 50).
The main drivers for methane emission are the density and activity of methanogens and methanotrophs, as well as soil properties, rice cultivar, and agronomical practices that affect the C availability for anaerobic fermentation (39, 51). We observed that the highest MPP did not overlap with the highest methane emission measured at flowering. It is suitable to consider that the influence of the plant over microbial community increases with time, mainly by the photosynthesized compounds released to the rhizosphere. Root organic carbon is the main C source for methane emission and increases as the plant grows (49, 52). The exudation rates are lowest at seedling stage, increased until flowering, but decreased at maturity (53). Therefore, the high methane emission observed at flowering is likely due to the increased C released by the plant, whereas the microcosm assays made for the determination of MPP had only C substrates derived from the soil. Furthermore, the highest methane oxidation potential coincided with the higher methane emission (Figure 3B), namely, when more methane was available for methanotrophs, then the MOP decreased consistently from flowering to winter of all soils. Lee et al. (52) also reported that methane emission was positively and significantly correlated with activity of methanotrophs and methanogens measured through transcripts of pmoA and mcrA genes.
The abundance of methanogens was quite heterogeneous among different soils at the beginning of the rice crop season (30 dae), but methanogens increased by flowering and showed similar abundances at the two following sampling dates in all rice rotational soils. This influence of the rice growing season has been reported previously for the abundance of rhizospheric mcrA and pmoA genes with sequential highest values for mcrA genes preceding the highest values for pmoA genes (47). In wheat–rice rotational fields, a significant effect of the rice growth season has been observed for the abundance of mcrA and pmoA genes with higher abundance of these populations at rice maturity (36). The composition of methanogenic archaea instead, was less influenced by the rice growing stage in similar wheat–rice rotational fields (54).
It should be considered that oxygen is a determining factor for the spatial distribution of bacterial and archaeal communities in rice paddy soils, with aerobic methanotrophs being higher near the oxic–anoxic interface whereas methanogens predominate associated to the rhizosphere (55). Therefore, by sampling bulk soil, we might have underestimated the methanogenic population, mainly in young plants with small roots, since at the rice reproductive stage, most of the soil was covered with rice roots.
Contrastingly to methanogens, the growth of methanotrophs continued after flowering, reaching highest abundances in winter in all soils. A similar increase from tillering to maturity was reported for a different rice production system with annual double-rice paddy soil, where rice seedlings were transplanted into flooded soil (56). The increase in the methanotrophs observed after flowering is consistent with the availability of methane, the specific substrate for this population, which is produced under flooding mainly at flowering. Oxygen is a limiting substrate for methanotrophs under flooding conditions. It has been suggested that the incorporation of winter cover crops to flooded soil during rice transplanting decreases the oxygen availability by organic matter consumption, limiting the growth of methanotrophic bacteria (56). The high abundance of methanotrophs observed in winter may be due to higher substrate availability, because of the oxygen increase after rice harvest, combined with the methane that might be still trapped in soil and rice roots.
Although the rice growth stage had pronounced effects on abundance and activity of microbial populations linked to methane production and consumption, we observed slight differences that may be attributed to rice rotations mainly at rice tillering. Liu et al. (13) reported that in rotational fields, where rice alternated with soybean under two kinds of rotational intervals, the abundance of the methanogenic archaeal populations decreased to about one-tenth compared with consecutive paddy rice soil along several sampling seasons and rice growing stages. The authors assert that the upland conversion of flooded paddy soils for 1 year or longer than 1 year affected the methanogenic archaeal community. We only observed minor differences of methanogens related to the rice rotation at tillering, when rice followed by rice (cR and rRppp) had higher amounts of methanogens than rice soils preceded by soybean or pastures (Rs and Rrppp). These slight differences may be because the intensification of rice in our systems has been implemented quite recently. PCA showed that rotational soils with two consecutive summers under rice cropping separated from soils having pasture or soybean previously, with the abundance of pmoA and mcrA gene copies as main correlated factors explaining this grouping (Figure 6). These results suggest that, in our system, where less intensive rice–pasture cropping was recently converted to more intensive systems, the abundance of methane-specific populations was responsive to the increase in rice frequency. This response was observed at rice tillering, when microbial communities experimented the whole rotational previous management (crop in summer + cover pasture in winter), but not at winter after all soils had rice as summer crop. It is appropriate to highlight that rice residues are considerably higher than other plant residues, giving higher amounts of C for microbial decomposition in winter in our no-till systems. The higher amounts of C in soils at tillering that were preceded by rice in summer may improve the methanogenic substrates and therefore populations linked to methane production and consumption. Zhou et al. (57) reported that MPP and MOP as well as the abundances of mcrA and pmoA genes increased with the co-incorporation of green manure to the rice straw, suggesting that a rational utilization of leguminous green manure combined with rice straw applications may mitigate methane emissions by reducing the C/N ratio in the residue and consequently reduce the dissolved organic carbon from the residue that may serve as substrate for methanogenesis.
The episodic nature of N2O emissions (58) did not allow us to detect any N2O peak when sampling once for each rice growth stage or in winter. However, some peaks of N2O emission had been measured in the same rice field at other crop seasons in the period until 50 days after rice emergence (10).
Nitrification and denitrification, the main processes associated with N2O emission in agricultural soils, are influenced by several soil and plant variables, which may be modified through agricultural management practices (e.g., fertilization, crop rotation, tillage, or irrigation) (59). A main reason for N2O emissions from agricultural soils is the application of inorganic/organic fertilizers when the crops cannot uptake all the applied nitrogen (N) due to the requirements in each growth stage. The fertilization in this case, which adjusts N synthetic rates calculated considering the background soil mineral N and the expected available N from mineralization of cover crop residues, and the low use of N-fertilizer in Uruguayan rice systems (60) may accomplish a high N-use efficiency.
Denitrification seems to be more relevant as a N2O source than nitrification when studying different agroecosystems (61). PDA that was highest at 30 dae (rice tillering stage) may be influenced by the highest soil nitrate content at this stage and recent flooding, generating redox potential conditions for this process. In this work, PDA was lower in crop soils than in pastures as has been previously reported (62). However, PDA incubation conditions may not favor all denitrifiers that are physiologically very diverse (63). Furthermore, rhizosphere with its oxic/anoxic interphase offers a favorable habitat for coupled nitrification–denitrification (64), but in this work, bulk soil was sampled.
The nirK functional community was more abundant than nirS as has been previously reported for some paddies (65–67). The abundance of both genes was highest in winter, the only soil sampled without flooding, but also nutrient availability changes may influence both microbial communities (68). As denitrifying microorganisms are very diverse metabolically and denitrification is an alternative growth mechanism, denitrifiers can be active and grow by relying on other electron acceptors. In this respect, Hallin et al. (69) did not find any response from the denitrifier community to agricultural management. NosZ is responsible for N2O reduction to N2 and includes two distinct clades (70), though the most common of type I of denitrifiers was quantified here. Besides, not all denitrifiers possess the nosZ gene (71), and its proportion may change along the sampling dates. Considering only the rice crop, all these denitrification genes' copy number was higher for the second rice than for the first in the traditional rotation, the less intensive of the rotations considered. In the previous winter, rRppp had ryegrass, whose higher C:N ratio and greater biomass (22), which included the rest of the rice of the previous season, may explain this highest activity.
The potential nitrification activity ranked higher for the rotations' phases without rice and at rice tillering for the phases of the rotations without rice in the previous season, which were the soils with lower ammonia content. Although this activity differs from the actual in situ rate due to the broad physiological diversity of ammonia oxidizers (63), its increase in the aerobic phase of the rotations seems reasonable. Bacterial ammonia oxidizers for the soils with rice during the sampling period of this work were higher at winter, the only sampling date without flooding. Moreover, the bacterial ammonia oxidizers did not change with the different rotations while the abundance of amoA from archaea increased in rice after ryegrass. Recently, Rütting et al. (72), applying a combination of 15N tracers and selective inhibitors, confirmed that AOB activity increased with high ammonium addition and that of AOA was high for soils with low, continuous production like in our case. Spatial heterogeneity of these no-till cultivated soils with respect to ammonium and oxygen distribution may explain the differences among the first and second rice in the traditional rotation.
In general, our results confirmed the high resilience of N-microbe guilds to both flooding and drying stress, which also has been previously reported (73). Despite these considerations, the PCA for winter sampling (Figure 10B) allowed us to discriminate the cR soil, the most intensive of the rotations, from other soils having rice previously. This rotation has a higher dependence on external inputs, like a much higher application of N-fertilizer, suggesting that this less sustainable rotation system may be different with respect to the N cycle even at this initial implementation of intensification.
Altogether, our results show that the microbial populations involved in GHG were strongly affected by the season. All rotational soils were highly similar mainly when rice was under the reproductive stage and further. In summary, flooding with consequent oxygen deprivation and plant growth phases have a high impact over microbial populations involved in methane emission. The differences imposed by rice intensification systems, at least in these no-till systems where intensification was implemented quite recently, disappear as the rice plant grows and low redox potential is reached. However, a slight effect of the recently implemented intensification could be perceived at rice tillering and at winter postharvest when two consecutive rice summer seasons are separated with respect to the microbiological parameters studied. Consequently, different GHG emission rates would be expected for rotational rice systems after a longer period under different intensification regimes, highlighting that the design of agricultural systems is critical for matching productivity and environmental goals.
Data Availability Statement
The original contributions presented in the study are included in the article/Supplementary Materials, further inquiries can be directed to the corresponding author.
Author Contributions
AF-S, ST, JT, and PI conceived the research. JT planned and managed the long-term field experiment. DO, ST, and AM-P collected the samples and took measures. AM-P made the greater contribution to the statistical analysis of the data. AF-S, ST, and PI drafted the manuscript. All authors revised and made significant contributions to the write-up and agreed to the published version of the manuscript. All authors contributed to the article and approved the submitted version.
Funding
This work was supported by ANII-Innovagro project FSA_1_2013_1_12447 (Agencia Nacional de Investigación, ANII) and by CSIC-Udelar (Comisión Sectorial de Investigación Científica, Universidad de la República) groups funding project number 976 Microbial regulation of biogeochemical cycles involved in greenhouse gases emission by agricultural soils. The research was also supported by PEDECIBA with funding to AF-S and PI. ANII-Innovagro Program FSA_PP_2018_1_148336 and Project 148579 supported this article publication.
Conflict of Interest
The authors declare that the research was conducted in the absence of any commercial or financial relationships that could be construed as a potential conflict of interest.
Publisher's Note
All claims expressed in this article are solely those of the authors and do not necessarily represent those of their affiliated organizations, or those of the publisher, the editors and the reviewers. Any product that may be evaluated in this article, or claim that may be made by its manufacturer, is not guaranteed or endorsed by the publisher.
Acknowledgments
The authors thank workers of INIA Treinta y Tres Experimental Station that contributed to the management of the long-term field experiment, particularly to Ignacio Macedo and Alexander Bordagorri. We are especially grateful to Luciana Pereira, Cecilia Ghiazza, and Gabriela Illarze for their help with sampling and laboratory assays, and to Lucía Ferrando for her help and expertise on molecular techniques.
Supplementary Material
The Supplementary Material for this article can be found online at: https://www.frontiersin.org/articles/10.3389/fsoil.2022.832600/full#supplementary-material
References
2. Tseng M-C, Roel Á, Macedo I, Marella M, Terra J, Zorrilla G, et al. Field-level factors for closing yield gaps in high-yielding rice systems of Uruguay. Field Crops Res. (2021) 264:108097. doi: 10.1016/j.fcr.2021.108097
3. Pittelkow CM, Zorrilla G, Terra J, Riccetto S, Macedo I, Bonilla C, et al. Sustainability of rice intensification in Uruguay from 1993 to 2013. Glob Food Secur. (2016) 9:10–18. doi: 10.1016/j.gfs.2016.05.003
4. Carlson KM, Gerber JS, Muller ND, Herrero M, MacDonald GK, Braumen KA, et al. Greenhouse gas emissions intensity of global croplands. Nat Clim Change. (2017) 7:63. doi: 10.1038/nclimate3158
5. Linquist B, van Groenigen KJ, Adviento-Borbe MA, Pittelkow C, van Kessel C. An agronomic assessment of greenhouse gas emissions from major cereal crops. Global Change Biol. (2012) 18:194–209. doi: 10.1111/j.1365-2486.2011.02502.x
6. Ferrando L, Tarlera S. Activity and diversity of methanotrophs in the soil–water interface and rhizospheric soil from a flooded temperate rice field. J Appl Microbiol. (2009) 106:306–16. doi: 10.1111/j.1365-2672.2008.04004.x
7. Bouwman AF, Boumans LJM. Emissions of N2O and NO from fertilized fields: summary of available measurement data. Glob Biogeochem Cycle. (2002) 16:13. doi: 10.1029/2001GB001811
8. Breidenbach B, Blaser MB, Klose M, Conrad R. Crop rotation of flooded rice with upland maize impacts the resident and active methanogenic microbial community. Environ Microbiol. (2015) 18:2868–85. doi: 10.1111/1462-2920.13041
9. Lagomarsino A, Agnelli AE, Pastorelli R, Pallara G, Rasse DP, Silvennoinen H. Past water management affected GHG production and microbial community pattern in Italian rice paddy soils. Soil Biol Biochem. (2016) 93:17–27. doi: 10.1016/j.soilbio.2015.10.016
10. Tarlera S, Capurro MC, Irisarri P, Fernández Scavino A, Cantou G, Roel A. Yield-scaled global warming potential of two irrigation management systems in a highly productive rice system. Sci Agric. (2016) 73:43–50. doi: 10.1590/0103-9016-2015-0050
11. Weller S, Kraus D, Ayag KRP, Wassmann W, Alberto MCR, Butterbach-Bahl K, et al. Methane and nitrous oxide emissions from rice and maize production in diversified rice cropping systems. Nutr Cycl Agroecosyst. (2015) 101:37–53. doi: 10.1007/s10705-014-9658-1
12. Wang J, Xue C, Song Y, Wang L, Huang Q, Shen Q. Wheat and rice growth stages and fertilization regimes alter soil bacterial community structure, but not diversity. Front Microbiol. (2016) 7:1207. doi: 10.3389/fmicb.2016.01207
13. Liu D, Ishikawa H, Nishida M, Tsuchiya K, Takahashi T, Kimura M, et al. Effect of paddy-upland rotation on methanogenic archaeal community structure in paddy field soil. Microb. Ecol. (2015) 69:160–8. doi: 10.1007/s00248-014-0477-3
14. Bertora C, Cucu MA, Lerda C, Peyron M, Bardi L, Gorra R, et al. Dissolved organic carbon cycling, methane emissions and related microbial populations in temperate rice paddies with contrasting straw and water management. Agric Ecosyst Environ. (2018) 265:292–306. doi: 10.1016/j.agee.2018.06.004
15. Fernandez Scavino A, Ji Y, Pump J, Klose M, Claus P, Conrad R. Structure and function of the methanogenic microbial communities in Uruguayan soils shifted between pasture and irrigated fields. Environ Microbiol. (2013) 15:2588–602. doi: 10.1111/1462-2920.12161
16. Seo J, Gebauer I, Kang H. Abundance of methanogens, methanotrophic bacteria, and denitrifiers in rice paddy soils. Wetlands. (2014) 34:213–23. doi: 10.1007/s13157-013-0477-y
17. Ye RW, Averill BA, Tiedje JM. Denitrification: production and Consumption of nitric oxide. Appl Environ Microbiol. (1994) 60:1053–8. doi: 10.1128/aem.60.4.1053-1058.1994
18. Bateman EJ, Baggs EM. Contributions of nitrification and denitrification to N2O emissions from soils at different water-filled pore space. Biol Fertil Soils. (2005) 41:379e388. doi: 10.1007/s00374-005-0858-3
19. Morales SE, Cosart T, Holben WE. Bacterial gene abundances as indicators of greenhouse gas emission in soils. ISME J. (2010) 4:799–808. doi: 10.1038/ismej.2010.8
20. Li S, Song L, Gao X, Jin Y, Liu S, Shen Q, et al. Microbial abundances predict methane and nitrous oxide fluxes from a windrow composting system. Front Microbiol. (2017) 8:409. doi: 10.3389/fmicb.2017.00409
21. Duran A, Califra A, Molfino JH, Lynn W. Keys to soil taxonomy for Uruguay. Washington, DC; USD, Natural Resources Conservation Service (NRCS) (2006).
22. Macedo I, Pravia MV, Castillo J, Terra JA. Soil organic matter in physical fractions after intensification of irrigated rice-pasture rotation systems. Soil Tillage Res. (2021) 213:105160. doi: 10.1016/j.still.2021.105160
23. Patterson HD. Theory of cyclic experiments. J Roy Statis, Soc Ser B. (1964) 26:1–36. doi: 10.1111/j.2517-6161.1964.tb00535.x
24. Minamikawa K, Yagi K, Tokida T, Sander BO, Wassmann R. Appropriate frequency and time of day to measure methane emissions from an irrigated rice paddy in Japan using the manual closed chamber method. Greenhouse Gas Measur Manag. (2012) 2:118–28. doi: 10.1080/20430779.2012.729988
25. Rochette P, Eriksen-Hamel NS. Chamber measurements of soil nitrous oxide flux: are absolute values reliable? Soil Sci Soc Am J. (2008) 72:331–42. doi: 10.2136/sssaj2007.0215
27. Tiesen H, Moir JO. Soil Sampling and Methods of Analysis, 1st ed. Carter MR, editor. Boca Raton, FL: Canadian Society of Soil Science, Lewis Publishers (1993).
28. Heanes DL. Determination of total organic-C in soils by an improved chromic acid digestion and spectrophotometric procedure. Commun Soil Sci Plant Anal. (1984) 15:1191–213. doi: 10.1080/00103628409367551
29. Mahne I, Tiedje J, Criteria M. Methodology for identifying respiratory denitrifiers. Appl Environ Microbiol. (1995) 61:1110–5. doi: 10.1128/aem.61.3.1110-1115.1995
30. Tarlera S, Denner EBM. Sterolibacterium denitrificans gen. nov, sp nov, a novel cholesterol-oxidizing, denitrifying member of the β-Proteobacteria. Int J Syst Evolut Microbiol. (2003) 53:1085–91. doi: 10.1099/ijs.0.02039-0
31. Kandeler E. Potential nitrification. In: Schinner F, Öhlinger R, Kandeler E, Margesin R, editors. Methods in Soil Biology. Berlin:Springer-Verlag (1996). p. 146–9.21.
32. Deambrosi E. Rice production system in Uruguay and its sustainability. in : Proceedings of the III International Conference of Temperate Rice, Punta del Este: INIA (2003).
33. Xuan DT, Guong VT, Rosling A, Alström S, Chai B, Högberg N. Different crop rotation systems as drivers of change in soil bacterial community structure and yield of rice, Oryza sativa. Biol Fertil Soils. (2012) 48:217–25. doi: 10.1007/s00374-011-0618-5
34. Maarastawi SA, Frindte K, Linnartz M, Knief C. Crop rotation and straw application impact microbial communities in Italian and Philippine soils and the rhizosphere of Zea mays. Front Microbiol. (2018) 9:1295. doi: 10.3389/fmicb.2018.01295
35. Shen J, Tao Q, Dong Q, Luo Y, Luo J, He Y, et al. Long-term conversion from rice-wheat to rice-vegetable rotations drives variation in soil microbial communities and shifts in nitrogen-cycling through soil profiles. Geoderma. (2021) 404:115299. doi: 10.1016/j.geoderma.2021.115299
36. Ji Y, Conrad R, Xu H. Responses of archaeal, bacterial, and functional microbial communities to growth season and nitrogen fertilization in rice fields. Biol Fertil Soils. (2020) 56:81–95. doi: 10.1007/s00374-019-01404-4
37. Breidenbach B, Conrad R. Seasonal dynamics of bacterial and archaeal methanogenic communities in flooded rice fields and effect of drainage. Front Microbiol. (2014) 5:752. doi: 10.3389/fmicb.2014.00752
38. Ji Y, Liu P, Conrad R. Response of fermenting bacterial and methanogenic archaeal communities in paddy soil to progressing rice straw degradation. Soil Biol Biochem. (2018) 124:70–80. doi: 10.1016/j.soilbio.2018.05.029
39. Malyan SK, Bhatia A, Kumar A, Gupta DK, Singh R, Kumar SS, et al. Methane production, oxidation and mitigation: a mechanistic understanding and comprehensive evaluation of influencing factors. Sci Total Environ. (2016) 572:874–96. doi: 10.1016/j.scitotenv.2016.07.182
40. Conrad R. Methane production in soil environments-anaerobic biogeochemistry and microbial life between flooding and desiccation. Microorganisms. (2020) 8:881. doi: 10.3390/microorganisms8060881
41. Singh S, Kashyap AK, Singh JS. Methane flux in relation to growth and phenology of a high yielding rice variety as affected by fertilization. Plant Soil. (1998) 201:157–64.
42. Inubushi K, Cheng W, Aonuma S, Hoque M, Kobayashi K, Miura S, et al. Effects of free-air CO2 enrichment (FACE) on CH4 emission from a rice paddy field. Glob Chang Biol. (2003) 9:1458–64. doi: 10.1046/j.1365-2486.2003.00665.x
43. Zschornack T, Bayer C, Acordi ZJ, Costa BVF, Anghinoni I. Mitigation of methane and nitrous oxide emissions from flood-irrigated rice by no incorporation of winter crop residues into the soil. Rev Bras Ciênc Solo. (2011) 35:623–34. doi: 10.1590/S0100-06832011000200031
44. Win EP, Win KK, Bellingrath-Kimura SD, Oo AZ. Influence of rice varieties, organic manure and water management on greenhouse gas emissions from paddy rice soils. PLoS ONE. (2021) 16:e0253755. doi: 10.1371/journal.pone.0253755
45. Conrad R, Klose M. Dynamics of the methanogenic archaeal community in anoxic rice soil upon addition of straw. Eur J Soil Sci. (2006) 57:476–84. doi: 10.1111/j.1365-2389.2006.00791.x
46. Ma J, Ma E, Xu H, Yagi K, Cai Z. Wheat straw management affects CH4 and N2O emissions from rice fields. Soil Biol Biochem. (2009) 41:1022–8. doi: 10.1016/j.soilbio.2009.01.024
47. Kong D, Li S, Jin Y, Wu S, Chen J, Hu T, et al. Linking methane emissions to methanogenic and methanotrophic communities under different fertilization strategies in rice paddies. Geoderma. (2019) 347:233–43. doi: 10.1016/j.geoderma.2019.04.008
48. Kim SY, Gutierrez J, Kim PJ. Unexpected stimulation of CH4 emissions under continuous no-tillage system in mono-rice paddy soils during cultivation. Geoderma. (2016) 267:34–40. doi: 10.1016/j.geoderma.2015.12.021
49. Yuan Q, Pump J, Conrad R. Partitioning of CH4 and CO2 production originating from rice straw, soil and root organic carbon in rice microcosms. PLoS ONE. (2012) 7:e49073. doi: 10.1371/journal.pone.0049073
50. Ye R, Horwath WR. Influence of rice straw on priming of soil C for dissolved organic C and CH4 production. Plant Soil. (2017) 417:231–41. doi: 10.1007/s11104-017-3254-5
51. Alpana S, Vishwakarma P, Adhya TK, Inubushi K, Dubey SK. Molecular ecological perspective of methanogenic archaeal community in rice agroecosystem. Sci Total Environ. (2017) 596–7:136–46. doi: 10.1016/j.scitotenv.2017.04.011
52. Lee HJ, Jung H, Kim SY, Kim PJ, Madsen EL, Jeon CO. Methane emission and dynamics of methanotrophic and methanogenic communities in a flooded rice field ecosystem. FEMS Microbiol Ecol. (2014) 88:195–212. doi: 10.1111/1574-6941.12282
53. Aulakh M. S., Wassmann R, Bueno C, Rennenberg H. Impact of root exudates of different cultivars and plant development stages of rice (Oryza sativa L.) on methane production in a paddy soil. Plant Soil. (2001) 230:77–86. doi: 10.1023/A:1004817212321
54. Watanabe T, Kimura M, Asakawa S. Community structure of methanogenic archaea in paddy field soil under double cropping (rice–wheat). Soil Biol Biochem. (2006) 38:1264–74. doi: 10.1016/j.soilbio.2005.09.020
55. Lee HJ, Jeong SE, Kimm PL, Madsen EL, Jeon CO. High-resolution depth distribution of Bacteria, Archaea, methanotrophs, and methanogens in the bulk and rhizosphere soils of a flooded rice paddy. Front Microbiol. (2015) 6:639. doi: 10.3389/fmicb.2015.00639
56. Liu J-N, Zhu B, Yi L-X, Dai H-C, Xu H-S, Zhang K, et al. Winter cover crops alter methanotrophs community structure in a double-rice paddy soil. J Integr Agric. (2016) 15:553–65. doi: 10.1016/S2095-3119(15)61206-0
57. Zhou G, Gao S, Xu C, Dou F, Shimizu K-Y, Cao W. Rational utilization of leguminous green manure to mitigate methane emissions by influencing methanogenic and methanotrophic communities. Geoderma. (2020) 361:114071. doi: 10.1016/j.geoderma.2019.114071
58. Weitzman JN, Groffman PM, Adler PR, Dell CJ, Johnson II FE, et al. Drivers of hot spots and hot moments of denitrification in agricultural systems. J Geophys Res. (2021) 126:e2020JG006234. doi: 10.1029/2020JG006234
59. Hofstra N, Bouwman AF. Denitrification in agricultural soils: summarizing published data and estimating global annual rates. Nutr Cycl Agroecosystems. (2005) 72:267–78. doi: 10.1007/s10705-005-3109-y
60. Castillo J, Kirk GJD, Rivero MJ, Dobermann A, Haefele S. The nitrogen economy of rice-livestock systems in Uruguay. Global Food Security. (2021) 30:100566. doi: 10.1016/j.gfs.2021.100566
61. Liang D, Robertson GP. Nitrification is a minor source of nitrous oxide (N2O) in an agricultural landscape and declines with increasing management intensity. Glob Change Biol. (2021) 27:5599–613. doi: 10.1111/gcb.15833
62. Lensi R, Clays-Josserand A, Monrozier LJ. Denitrifiers and denitrifying activity in size fractions of a mollisol under permanent pasture and continuous cultivation. Soil Biol Biochem. (1995) 27:61–9. doi: 10.1016/0038-0717(94)00132-K
63. Hazard C, Prosser JI, Graeme WN. Use and abuse of potential rates in soil microbiology. Soil Biol Biochem. (2021) 157:108242. doi: 10.1016/j.soilbio.2021.108242
64. Wei X, Zhu Z, Wei L, Wu J, Ge T. Biogeochemical cycles of key elements in the paddy-rice rhizosphere: microbial mechanisms and coupling processes. Rhizosphere. (2019) 10:100145. doi: 10.1016/j.rhisph.2019.100145
65. Yoshida M, Ishii S, Otsuka S, Senoo K. Temporal shifts in diversity and quantity of nirS and nirK in a rice paddy field soil. Soil Biol Biochem. (2009) 41:2044–51. doi: 10.1016/j.soilbio.2009.07.012
66. Bannert A, Kleineidam K, Wissing L, Muller-Niggemann C, Vogelsang V, Welzl G, et al. Changes in diversity and functional gene abundances of microbial communities involved in nitrogen fixation, nitrification, and denitrification in a tidal wetland versus paddy soils cultivated for different time periods. Appl Environ Microbiol. (2011) 77:6109–16. doi: 10.1128/AEM.01751-10
67. Azziz G, Monza J, Etchebehere C, Irisarri P. nirS- and nirK-type denitrifier communities are differentially affected by soil type, rice cultivar and water management. Euro J Soil Biol. (2017) 78:20–28. doi: 10.1016/j.ejsobi.2016.11.003
68. Romdhane S, Spor A, Busset H, Falchetto L, Martin J, Bizouard F, et al. Cover crop management practices rather than composition of cover crop mixtur3es affect bacterial communities in no-till agroecosystems. Front Microbiol. 10:1618. doi: 10.3389/fmicb.2019.01618
69. Hallin S, Jones C, Schloter M. Relationship between N-cycling communities and ecosystem functioning in a 50-year-old fertilization experiment. ISME J. (2009) 3:597–605. doi: 10.1038/ismej.2008.128
70. Shan J, Sanford RA, Chee-Sanford J, Ooi SK, Löffler FE, Konstantinidis KT, et al. Beyond denitrification: the role of microbial diversity in controlling nitrous oxide reduction and soil nitrous oxide emissions. Glob Change Biol. (2021) 27:1–15. doi: 10.1111/gcb.15545
71. Hallin S, Philippot L, L?offler FE, Sanford RA, Jones CM. Genomics and ecology of novel N2O-reducing microorganisms. Trends Microbiol. (2018) 26:43–55. doi: 10.1016/j.tim.2017.07.003
72. Rütting T, Schleusner P, Hink L, Prosser JI. The contribution of ammonia-oxidizing archaea and bacteria to gross nitrification under different substrate availability. Soil Biol Biochem. (2021) 160:108353. doi: 10.1016/j.soilbio.2021.108353
Keywords: rice rotations systems, microbial abundance, methane, nitrous oxide, intensification
Citation: Fernández-Scavino A, Oreggioni D, Martínez-Pereyra A, Tarlera S, Terra JA and Irisarri P (2022) Season and No-Till Rice Crop Intensification Affect Soil Microbial Populations Involved in CH4 and N2O Emissions. Front. Soil Sci. 2:832600. doi: 10.3389/fsoil.2022.832600
Received: 10 December 2021; Accepted: 01 February 2022;
Published: 17 March 2022.
Edited by:
Nigel Victor Gale, University of Toronto, CanadaReviewed by:
Hyo Jung Lee, Kunsan National University, South KoreaMd Mozammel Haque, Bangladesh Rice Research Institute, Bangladesh
Copyright © 2022 Fernández-Scavino, Oreggioni, Martínez-Pereyra, Tarlera, Terra and Irisarri. This is an open-access article distributed under the terms of the Creative Commons Attribution License (CC BY). The use, distribution or reproduction in other forums is permitted, provided the original author(s) and the copyright owner(s) are credited and that the original publication in this journal is cited, in accordance with accepted academic practice. No use, distribution or reproduction is permitted which does not comply with these terms.
*Correspondence: Pilar Irisarri, irisarri@fagro.edu.uy