Efficacy of sewage sludge derived biochar on enhancing soil health and crop productivity in strongly acidic soil
- Department of Agriculture and Natural Resources, Delaware State University, Dover, DE, United States
Converting sewage sludge to biochar to serve as soil amendment and nutrient supplement to cropland may be an environmental benign and value-added approach to recycle the waste. Potting experiments were conducted to examine the efficacy of sludge biochar amendments on enhancing soil health and crop productivity. Strongly acidic soil (pH=5.0) was amended with sludge biochar at three different concentrations: 0 (control), 1% and 2% of its dry weight, and packed into plastic buckets (9.45-L) to a bulk density of 1.1 g cm-3, and each treatment had three replicates. Winter wheat (Triticum aestivum L.), spinach (Spinacia oleracea), and Mung bean (Vigna radiata) were sequentially grown for nine months under greenhouse and field conditions (each crop cycle lasted three months). The above-ground biomass was collected, and oven dried at 65°C for 72 hours to assess plant biomass yield. Soil health parameters such as aggregates stability, pH, electric conductivity (EC), soil respiration, and microbial biomass C were measured. Soils amended with 2% biochar demonstrated higher biomass yield in winter wheat and spinach crops compared to those amended with 1% biochar and unamended control, on the other hand, mung bean did not present significant difference in all treatments. Similarly, 2% biochar demonstrated high aggregates stability (19.85%) followed by control (9%) and 1% biochar (8.3%). Soil acidity was neutralized in soils amended with 2% biochar (pH: 6.5) compared to control (pH: 5.8) and 1% biochar (pH: 5.5). EC was in the ideal level (<2.7 dS m-1) for all treatments. Soil respiration was not significantly different in all treatments. Microbial biomass C was higher in control and 2% biochar with significant differences towards 1% biochar. These findings provide additional evidence that sludge biochar promote plant growth and improve certain soil health parameters. However, the effect of sludge biochar in soil biological properties was not observed. Therefore, long-term field experiments are needed to assess the amendment effect of sludge biochar on microbial biomass C and soil respiration to validate the persistent efficacy of sludge biochar amendments on facilitating crop production, crop productivity, and soil health.
1 Introduction
Sewage sludge is the solid residue generated from municipal wastewater treatment facility. The global generation of sewage sludge has increased significantly. For instance, in Europe, urban wastewater treatment facilities have produced more than 10 million dry tons of sewage sludge (1), and in the United States, annually 6.5 to 8.0 million dry tons of sewage sludge are generated (2). Therefore, disposal of this vast volume of sewage sludge has become a challenge, and efficient management approaches are needed to minimize the potential environmental contamination risks.
Typically, sewage sludge is disposed of through incineration or landfilling. However, given the organic matter (OM) and nutrient-rich properties of sewage sludge, land application may be a value-added, and environmentally benign method to reuse the organic waste. For instance, on its dry mass basis, sewage sludge contains organic carbon (OC) and plant nutrients at significant contents: N 30–60 g kg-1, P 18–36 g kg-1, K 3–6 g kg-1, and OC 320–370 g kg-1 (3). However, sewage sludge should not be directly applied to agricultural soils: the material is unstable, contains noticeable levels of volatile organic compounds (VOCs), it emits a strong offensive odor, carries various pathogens, and may contain significant concentrations of heavy metals (4). Therefore, different techniques have been developed to convert sewage sludge into other safe products prior to soil application, such techniques include anaerobic or aerobic digestion, chemical or thermal treatment, pyrolysis (slow or fast), and composting (5, 6). Such treatment techniques aim to enhance the handleability of sewage sludge and help sterilize and deodorize the material prior to soil application. Of the sludge treatments techniques, slow pyrolysis is to produce biochar by heating sewage sludge at 300–700°C for sufficient time in the absence of oxygen (7). So, conversion of sewage sludge to biochar provides an array of benefits: it destroys pathogens, minimizes odorants, stabilizes organic carbon, and reduces the mobility of heavy metals (8–10), rendering a porous, OC-enriched, environmentally recalcitrant product with high water and nutrient retention capacities (7, 11).
Biochar is a charcoal prepared through pyrolysis of biomass material and used as a soil amendment. It has drawn substantial attention from the global agriculture research community owing to its potential benefits as a soil amendment. The use of biochar in agriculture is a legacy of ancient inhabitants in central Amazon, who incorporated biomass-derived charcoal-like material into land to transform the strongly acidic, highly leached soils into relatively fertile and productive “Terra Preta” (in Portuguese meaning “dark earth”) (12, 13).
Biochar application generally improves soil quality and promotes plant growth; yet the effects depend on the feedstock source, manufacturing process, application rate of biochar, and even the treated soil. Biochar derived from manure demonstrated higher nutrient value than hood-derived biochar (12), as manure contains higher contents of nutrients originated from animal diet. For instance, Guo (12) reported that sewage sludge-based biochar produced through 300°C pyrolysis temperature contained 36 g kg-1 N, 79 g kg-1 P, and 7.7 g kg-1 K. Biochar products manufactured at higher pyrolysis temperature (e.g., >300°C) possesses typically a greater stable carbon fraction and high mineral ash content; yet a lower nitrogen (N) content (11). Nitrogen in the biochar feedstock is volatile and largely lost in pyrolysis vapors at high pyrolysis temperature. At a low pyrolysis temperature (e.g., 300°C) most of the feedstock N is conserved in the resulting biochar (11). Therefore, in this research sewage sludge is converted to biochar through slow pyrolysis at 300°C.
After applied to soil at appropriate rates, sludge-biochar in general reduces the acidity for acidic soils and elevates soil pH (14). It may also increase soil cation exchange capacity (CEC) due to the abundant surface functional groups inherent in its matrix (11), increases soil water holding capacity (WHC) result from biochar’s porous structure and high specific surface area (11), increases soil aggregates stability, which is the capacity of soil aggregates resistant to falling apart when hit or wetted by raindrops (15).
Sustainable agriculture warrants effective management practices to sustain and improve soil health and crop productivity. Soil health is the continued capacity of a soil to function as an ecosystem to support plant, animals, and humans (16). Soil health enhancement is the sustainable strategy for increasing crop production and improving crop productivity. Soil amendment with sewage sludge-based biochar may be an efficient technique to boost the health of agricultural soils by ameliorating their physical, chemical, and biological properties and guarantee desirable crop yields. Adding sludge-biochar amendment to soils may be a valuable and sustainable agriculture alternative to improve the long-term soil health and plant productivity of strongly acidic soils; yet this hypothesis has not been well studied so far. Therefore, the present research was aimed to understand amendment effects of sewage sludge-based biochar on soil health and plant growth.
2 Materials and methods
2.1 Preparation of sewage sludge
Sewage sludge was collected from Kent County Regional Wastewater Treatment Facility (Milford, DE). Municipal wastewater undergoes a series of treatment stages at the facility to dewater the sludge accordingly (17). The freshly dewatered sludge cake contained 20.33% dry matter and 79.67% water, as measured by heating at 65°C until constant weight was reached. The sludge cake was air-dried, passed through a 2-mm sieve, and stored in a Ziploc® bag prior to biochar conversion.
2.2 Pyrolytic conversion of sludge to biochar
The air-dry sludge was transferred into a metal canister (11 cm i. d. by 13 cm height). There was a 5-mm hole in the canister lid to release pyrolysis vapors during the thermochemical process. The canister was placed into an electric Isotemp muffle furnace (Thermo Fisher Scientific, Inc., Suwanee, GA) and heated at 300°C until no visible smoke was observed escaping from the furnace, indicating the completeness of the pyrolysis process (11). There was a 4-cm vent in the top of the furnace creating an ambient-pressure carbonization environment. The pyrolysis vapors (i.e., smokes) released from the pyrolysis reactor (canister) were discharged into atmosphere by a reinforced fan ventilation of the room. After the pyrolysis process was completed (approximately 11 hours), the canister was withdrawn from the muffle furnace and the lid hole sealed immediately with aluminum tape to prevent combustion. The biochar in the sealed canister was brought to the room temperature and transferred into a Ziploc® bag. The biochar yield was calculated as follows:
The sludge-derived biochar was then characterized for ash content, OM content, pH, electric conductivity (EC), C stability, cation exchange capacity (CEC), and water holding capacity (WHC) following the methods of Song and Guo (11) and Guo et al. (17).
2.3 Collection of research soil
The test soil was classified as downer sandy loam with a taxonomic name as coarse-loamy, siliceous, semiactive, mesic typic hapludults. The soil was collected from a restored forest parcel at Blackbird Creek Reserve (Townsend, DE). The 4-mm air-dried topsoil (0–20 cm) had a pH value of 5.0, which is classified as strongly acidic soil. Generally, such soils demonstrate lower mineral nutrient (K, Ca, Mg, and S) contents, lower base saturation (<30%), and are prone to aluminum (Al3+) toxicity (18), therefore, plant growth, crop development, and soil microbial processes are limited in strongly acidic soils (16).
2.4 Soil pot preparation and experimental design
Nine soil pots were prepared, representing two treatments and a control, and each treatment in triplicates: 1) 2% Sludge-biochar amendment—soil amended with sludge-biochar at 2% of its dry weight; 2) 1% Sludge-biochar amendment—soil amended with sludge-biochar at 1% of its dry weight; and 3) Control—soil without Sludge-biochar amendments. The 1 and 2% sludge biochar amendments rates represent approximately 20 and 40 Mg ha˗1 in field applications, respectively. Precisely, 9˗10 kg of the 4-mm Downer soil were transferred into a large (18.9 L) plastic bucket. Afterwards, biochar was thoroughly mixed with soil and tap water was further added to adjust the moisture content to 15%. The well-mixed and moisture-adjusted soils were then packed into HDPE buckets (21 cm bottom diameter, 24 cm top diameter, 23 cm height, and 9.45-L volume) to a 20 cm depth from the bottom, after compacting slightly by tapping the ground to a bulk density of 1.1 g cm-3. The soil pots were placed in a greenhouse in a completely randomize experiment design.
2.5 Plant growth trials
Three common Delaware crops: wheat (Triticum aestivum L.), spinach (Spinacia oleracea), and Mung bean (Vigna radiata) were sequentially grown in the pre-prepared soil pots over nine months under greenhouse and field conditions. Firstly, wheat seeds were manually sown in each soil pot. The growth of all three crops were monitored weekly and occasional weeding and irrigation were performed accordingly. The wheat trial lasted for three months, the above-ground biomass was harvested by cutting, and the dry weight was measured by oven drying the biomass at 65°C for 72 h. Afterwards, soil pots were moved outside the greenhouse exposing to direct sunlight for spinach and mung bean trial. Spinach growth trial lasted for three months, and the oven-dry biomass was measured. Lastly, mung bean growth trial lasted for three months, and the oven-dried biomass was determined. Collected data was statistically analyzed to disclose the effect of sludge-biochar amendments on plant growth of these three crops.
2.6 Soil health assessment
The soil health parameters were assessed at the end of the plant growth trials. Soil health was determined by evaluating the physical, chemical, and biological properties of the treated test soil. Soil physical properties was determined by analyzing aggregates stability; soil chemical properties were assessed by reading soil pH and EC; and soil biological properties was measured by assessing soil respiration rate and microbial biomass C. Basically, after plant growth trial, soil pots were settled, afterwards, soil samples were collected using a 1.9 cm diameter soil probe. The probe was pushed vertically to the soil pot bottom to collect soil cores from random surface location of each soil pot. The amount of moist soil collected from each soil pot was approximately 100 g. The samples were grouped per treatment, mixed thoroughly, and kept at room temperature for further analysis.
2.6.1 Soil physical properties
Aggregate stability measures the ability of a soil to resist falling apart when hit by rain drops. It was measured using a simulated rain equipment describing in the methods of Moebius-Clune et al. (16). Briefly, 30.0 g of air-dried soil (>0.25mm and <2.0 mm) was spread on a 0.25-mm sieve. Sieves were attached to a funnel containing filter paper to collect any slaked material during rain simulation. Afterwards, the set of sieve and funnel was placed in the tripod stand and together placed at 500 mm bellow the rainfall simulator. The test ran for 5 minutes and the soil material that did not fall apart while wetted by rain was collected, air dried, weighed, and the aggregate stability (AS) was calculated as follow:
Where Wstable is the mass of soil (g) that did not slaked, Wtotal is the mass of soil used for the test.
2.6.2 Soil chemical properties
Treated soil pH and EC were measured using the methods of Song and Guo (11) with slight modifications. Briefly, 10.0 g of air-dried soil (2-mm) was weight and soaked in deionized water at a 1:1 solid/water ratio and mixed thoroughly for five minutes. The slurry was then measured for pH using an Accumet AB 15/15+ pH meter (Fisher Scientific Instruments, Waltham, MA) and measured for electric conductivity (EC) using a CON510 conductivity/TDS meter (Oakton Instruments, Vernon Hills, Hills, IL).
2.6.3 Soil biological properties
2.6.3.1 Soil respiration rate
Soil Respiration is a measure that indicates the metabolic activity of the soil microbial community. Soil respiration is measured by capturing and quantifying carbon dioxide released from a re-wetted sample of air-dried soil held in an airtight jar for 4 days. Greater CO2 release is indicative of more active soil microbial community. The respiration rates of the soil pots were assessed in the end of the experiment analyzing the two treatments and control using the Comprehensive Assessment of Soil Health method (16). Samples were processed in triplicate, and a blank without soil was also included. Briefly, 20.00 g of air-dried soil (2-mm) was weighed and distributed evenly into an aluminum weighing boat, which was pre-perforated with 9 pin holes through the bottom. The weighing boat with soil was placed on top of two staggered filter papers in the bottom of a canning jar. A trap assembly (a 50-mL glass beaker secured to a plastic tripod ‘pizza stool’) was placed over the soil boat inside the canning jar. Precisely 9.0 mL of 0.5 M KOH was pipetted into the trap assembly beaker. A 7.5 mL of deionized water was pipetted along the canning jar sidewalls to its bottom to wet the filter paper and the water wetted the soil immediately. The canning jar was tightly closed with a lid and incubated at room temperature for 4 days. After the incubation time, the canning jar was opened, the beakers were removed and sealed with a piece of parafilm, the content was mixed thoroughly by up-and-down shaking and transferred into a 15 mL glass vial. The electric conductivity (EC) of the samples, the blank, and the 0.25 M K2CO3 were measured accordingly. The soil respiration rate was calculated as follow:
2.6.3.2 Soil microbial biomass carbon
The soil microbial biomass C is very important because carbon is an energy-producing factor for soil microbes. Microbial biomass C was measured using the fumigation and extraction methods (19). Briefly, 20 g of a moist soil sample was weighed into each of 4 100-mL beakers, two labeled as blank and the other two labeled as fumigated. Deionized water was added to bring the soil moisture to 15%. The beakers were placed into individual 950-mL canning jars that already contained 3 mL of deionized water at the bottom (the water is to maintain the 100% humidity inside the canning jar). The canning jar was closed tightly and incubated at 25°C for 7 days. After incubation, the two soil beakers with “fumigated” label were transferred into a 10-L vacuum glass desiccator that was lined with wet paper towels. A 150-mL conical flask containing 75 mL of ethanol-free chloroform and 5 boiling glass beads was also placed into the desiccator. Vacuum was applied to the desiccator to allow the chloroform to boil for 1 minute. Afterwards, the vacuum valve was closed, and the soil samples were incubated in chloroform vapor in the desiccator at room temperature in a fume hood for 24 h. After the fumigation, the desiccator vacuum switch was turned on gently, the desiccator was opened, and soil samples retrieved. The wet paper towels and the chloroform flask were removed, and the desiccator was vacuumed and air-vented to clear any residual chloroform for an hour. Then 10 oven dry g-equivalent blank and fumigated samples were weighed into separated 50-mL HDPE centrifuge tubes, followed by addition of 40 mL 0.5 M K2SO4 solution. The soil tubes were rotated and shake for 2 h at room temperature. Afterwards, soil tubes were centrifuged at 4000 rpm for 20 min. The supernatants were passed through a 0.2-μm filter membrane and 10 mL sample size was collected into 20 mL glass vial and analyzed for microbial biomass C using a Shimadzu TOC-Vwp analyzer. The microbial carbon is calculated as the different between blanks and fumigated samples.
2.7 Statistical data analysis and synthesis
The data for the characterization of test soil and sludge-biochar, plant growth and soil health parameters obtained during the trial were compiled and analyzed for analysis of variance (one-way ANOVA) with the use of R statistical software (Version R 3.6.2 GUI El Capitan build). The mean values of analyzed data were compared using Tukey’s comparison test range at P ≤ 0.05. Variations in the treatment was assessed by calculating the standard deviation (± SD).
3 Results and discussion
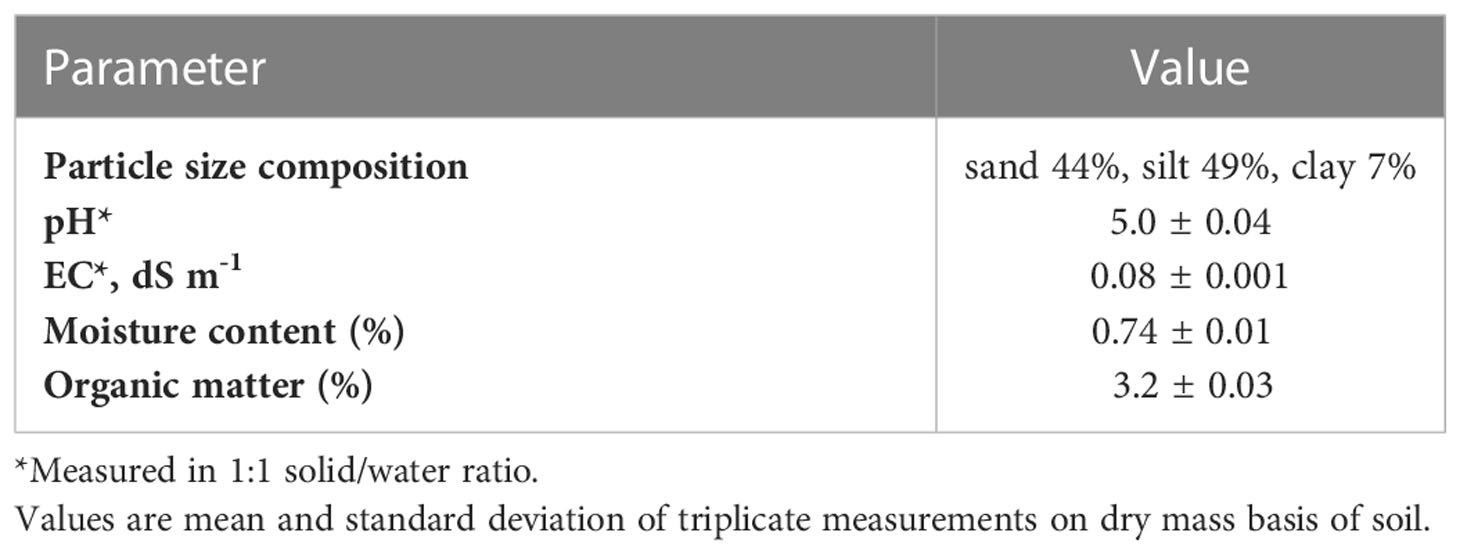
3.1 Fundamental properties of the test soil
The fundamental properties of the test soil are illustrated in Table 1. The test soil is classified as strongly acidic soil (pH<5.5), as Finkelnburg (18) and Moebius-Clune et al. (16) reported that strongly acidic soils restrict the availability of plant macro nutrients and hinder soil microbial activity due to low base saturation (<30%), and aluminum (Al3+) toxicity. Although the OM content (3.2%) is ideal, plant growth and microbial processes may be limited in such soils.
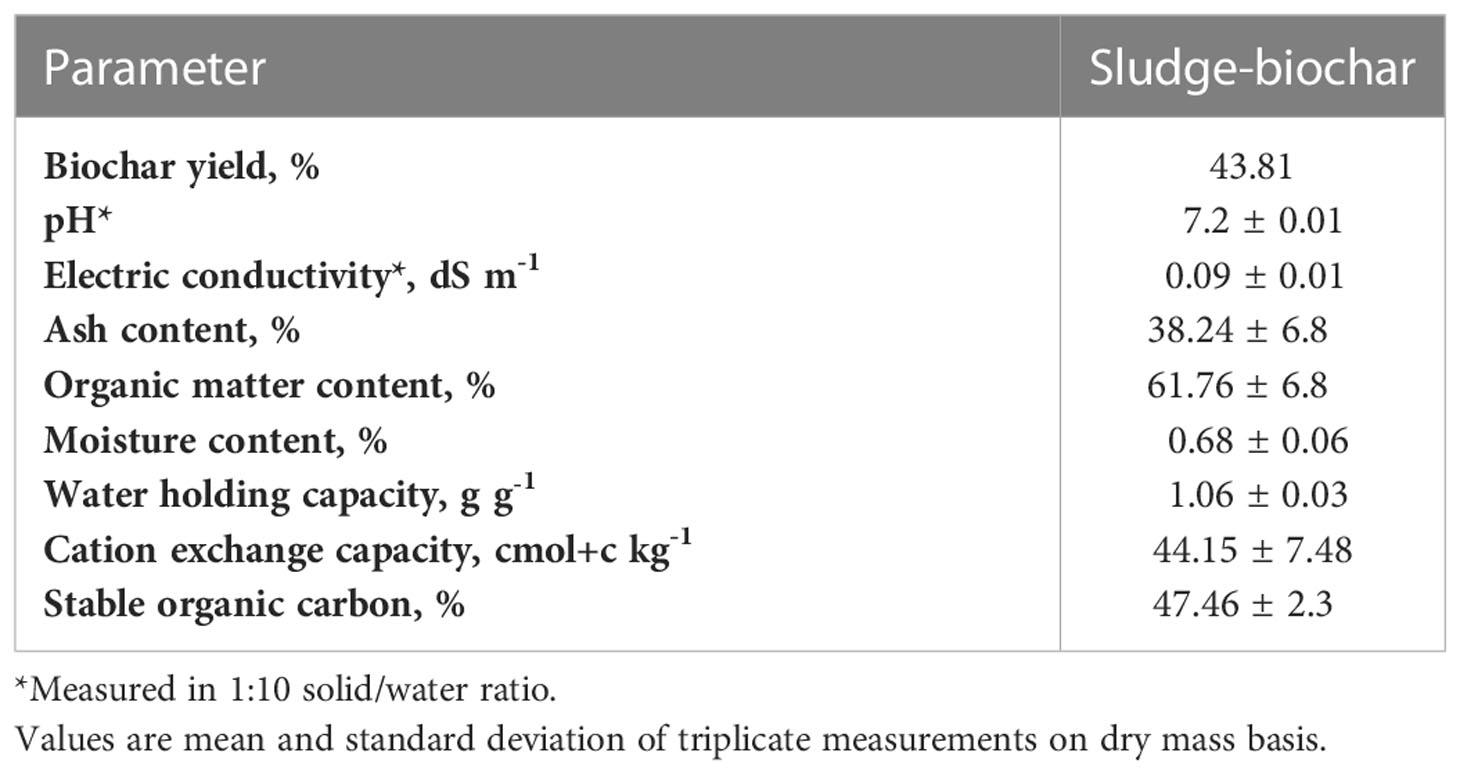
3.2 General characteristics of sludge-biochar
The general characteristics of sludge-biochar is illustrated in Table 2. Briefly, the yield of sludge biochar was 43.81%, such value is inferior to what was found by Roberts et al. (7) and Zhang et al. (20), where three sludge-biochar pyrolyzed at 300°C yielded 65.7, 64.28, and 70.1% of feed mass. Nevertheless, the yield of biochar is influenced by many factors including residential or retention time and feedstock OC content (11).
The pH of sludge-biochar was 7.2 and the EC 0.09 dS m -1 (Table 2). Zhang et al. (20) reported that 300°C sludge biochar demonstrated a pH value of 6.2. Typically, regardless of biochar source most 300°C biochar has a pH value above 6.8 (12).
The mineral ash content of sludge-biochar was 38.24% (Table 2). The ash minerals (Ca, K, Mg and Na) are recovered during the pyrolysis process (11) as soluble minerals in feedstock are transformed into least dissolved stable forms. The mineral ash content is in the range of reported values for 300°C sludge biochar (7, 20).
The organic matter content of sludge biochar was 61.76% OM (Table 2), such content of OM in sludge biochar is sufficient to enhance soil health (12, 21) as a tiny amount of biochar would significantly improve soil OM to ideal levels (3-5%).
As illustrated (Table 2), sludge biochar has a great ability to hold the water against gravity forces as demonstrated by its value of 106% of WHC, such value is in the range of reported values for biochar produced through slow pyrolysis (11). Typically, sandy loam, loam, and clay soils have a WHC ranging from 21 to 38%.
The CEC of sludge biochar was 44.15 cmol(+) kg-1 (Table 2). The functional groups in biochar determine its CEC value. Cation exchange capacity (CEC) is the ability of a material to retain exchangeable cations through sorption pathways (11, 22).
The stable C of sludge biochar (47.46%) is illustrated in Table 2. Stable C value is inferior to what Roberts et al. (7) reported: respectively, two sludge-biochar produced through 300°C pyrolysis temperature contained 63.2% and 54.2% of stable OC. Biochar with higher stable OC content (>50%) has a lower mineralization rate and may persist in soils for many years (11, 12).
3.3 Plant growth trials
The effect of sludge derived biochar amendments on crop productivity was determined by assessing oven dry biomass of research crops (Figure 1). For wheat dry biomass, 2% biochar demonstrated higher yield with significant differences compared to 1% biochar and unamended control treatment. Similarly, in spinach dry biomass, 2% biochar yielded more, followed by 1% biochar, and unamended control treatments. However, in mung bean crop there were no significant differences among the treatments. Recent studies presented similar findings, for instance, Silva et al. (23) reported that soils amended with sludge biochar demonstrated higher biomass yield of eucalyptus seedlings compared to unamended control treatments. Also, outstanding research demonstrated that biomass yield of Chinese cabbage, wheat, cereals, tubers, roots, fibers, and turf grass was higher in soils amended with sludge biochar compared to those of unamended control treatments (24–27).
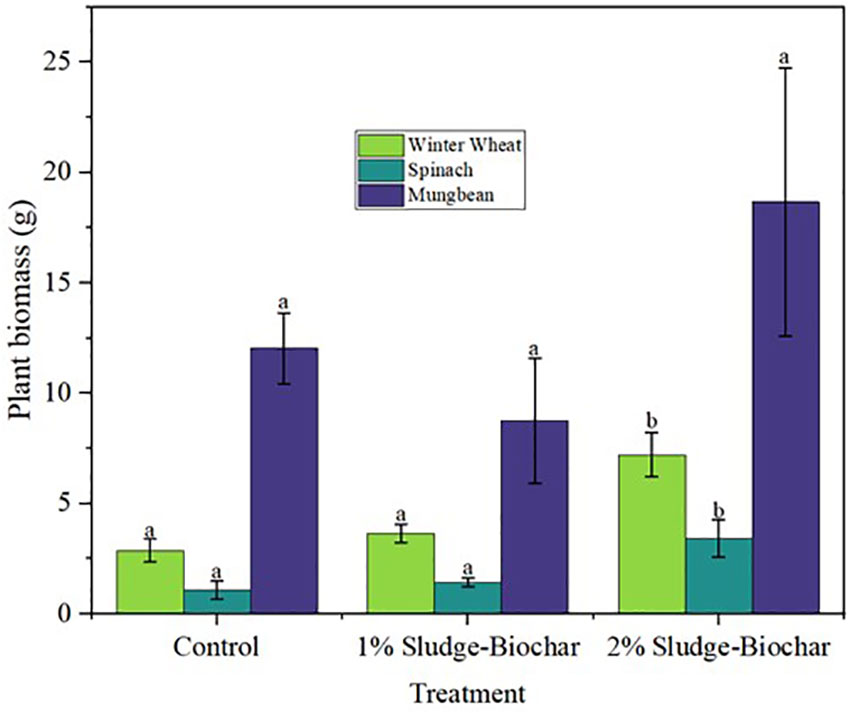
Figure 1 Effect of sludge biochar amendments on wheat, spinach, and mung bean oven-dry plant biomass. Means with common letters are not significantly different at p ≤ 0.05 according to Tukey’s multiple range test.
3.4 Effects of sludge biochar amendments on soil physical properties
Aggregates stability was higher on 2% biochar treatment with significant differences compared to control, and 1% biochar (Figure 2). Adding biochar to soils increases soil aggregates stability (28), as biochar provides favorable conditions to enhance microbial function and structure to hold soil particle when hit by rain drops (16, 29).
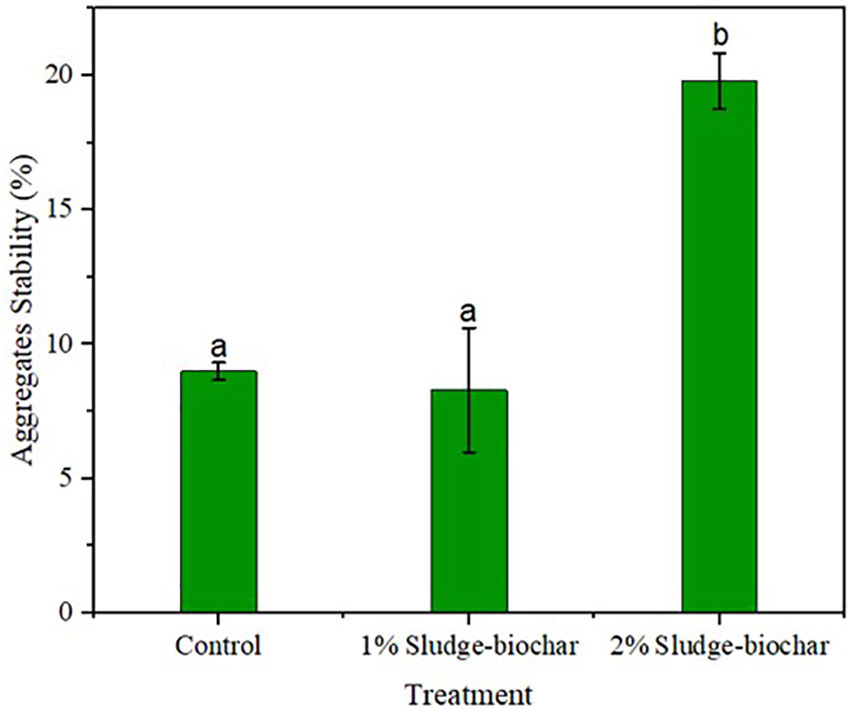
Figure 2 Effect of sludge biochar amendments on soil aggregates stability. Means with common letters are not significantly different at p ≤ 0.05 according to Tukey’s multiple range test.
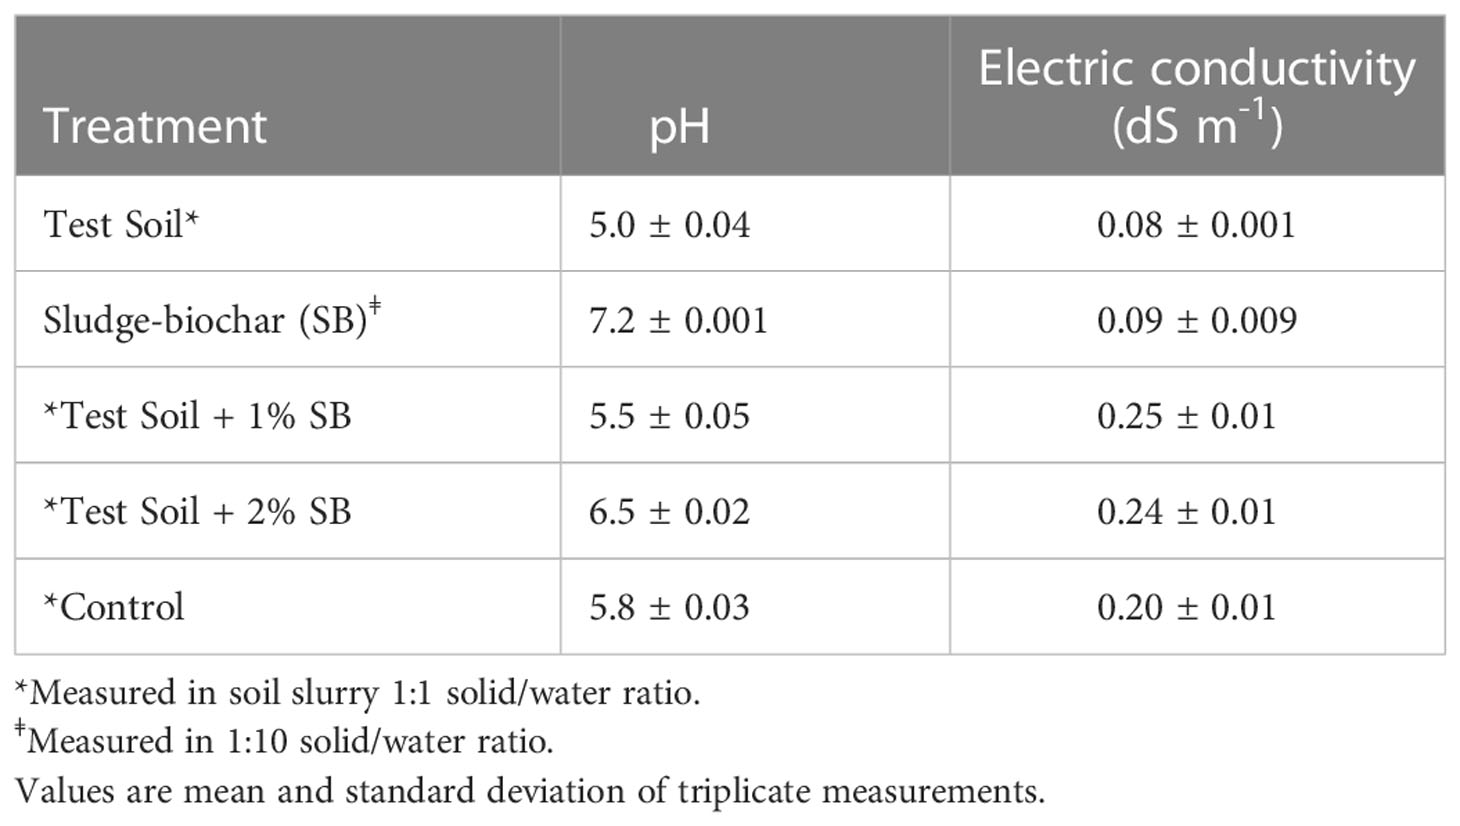
3.5 Effects of sludge biochar amendments on soil chemical properties
The effect of sludge derived biochar on soil chemical properties is illustrated in Table 3. The initial pH of the test soil and sludge biochar was 5.0 and 7.2, respectively. As observed, soils amended with 2% biochar demonstrated higher pH value (6.5) compared to control (5.8) and 1% biochar (5.5). The addition of biochar to soils elevated soil pH as expected and significantly reduced soil acidity. The ideal soil pH to support plant growth range from 6.0–7.0 (12, 16, 18). Sludge biochar at 2% amendment rate reduced soil acidity and increased soil pH.
Electric conductivity (EC) reading was below 0.26 dS m-1 in all treatments (Table 3). Typically, plant growth is not limited in soils with an EC value below 2.7 dS m-1 measured in 1:1 solid/water ratio (12).
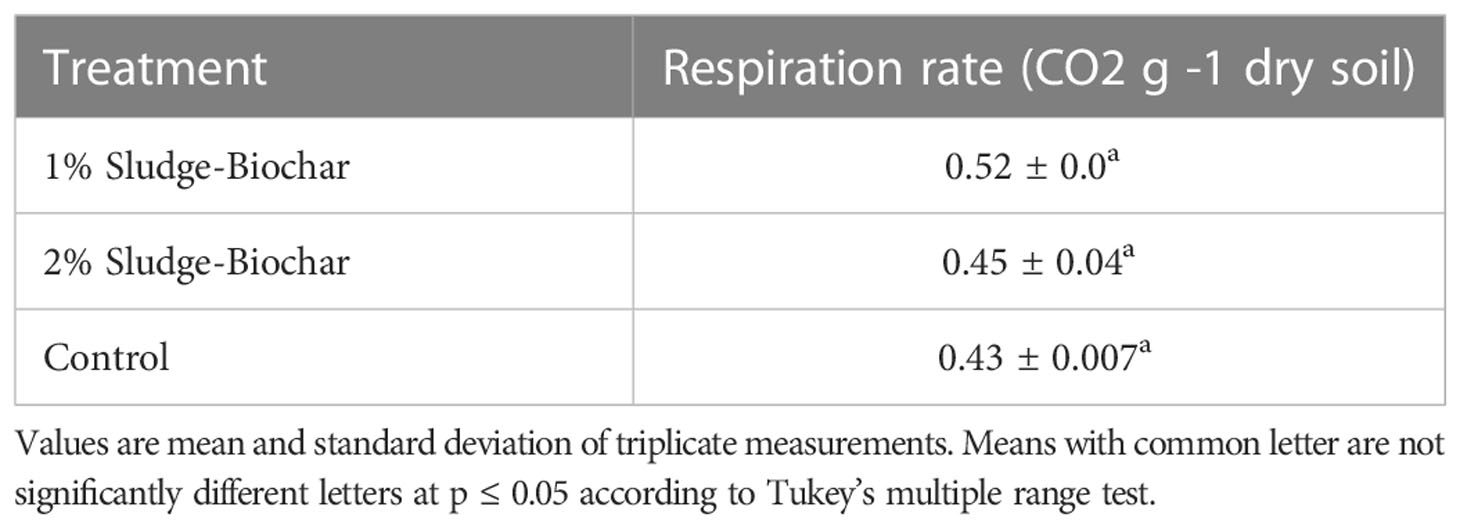
3.6 Effects of sewage sludge derived biochar amendments on soil biological properties
As illustrated in the soil respiration (Table 4), there is no significant differences among the treatments. Typically, the addition of biochar into soils significantly increase respiration rate compared to untreated control, and the ideal respiration rate should be >0.7 mg CO2 g˗1 dry soil (16, 29–31).
The effect of biochar amendments on microbial biomass C (Figure 3) presented mixed results. As observed, control and 2% biochar demonstrated higher microbial biomass C compared to 1% biochar. Typically, soils amended with biochar are expected to have higher microbial biomass C than the control (32, 33), however, microbial biomass C of soil is influenced by several factors including the method of measurement, as it is speculated that 0.5 M K2SO4 may flocculate biochar and cause adsorption of solubilized C onto biochar particles. These results put into question the adaptability of using 0.5 M K2SO4 to extract microbial biomass C in soils amended with biochar.
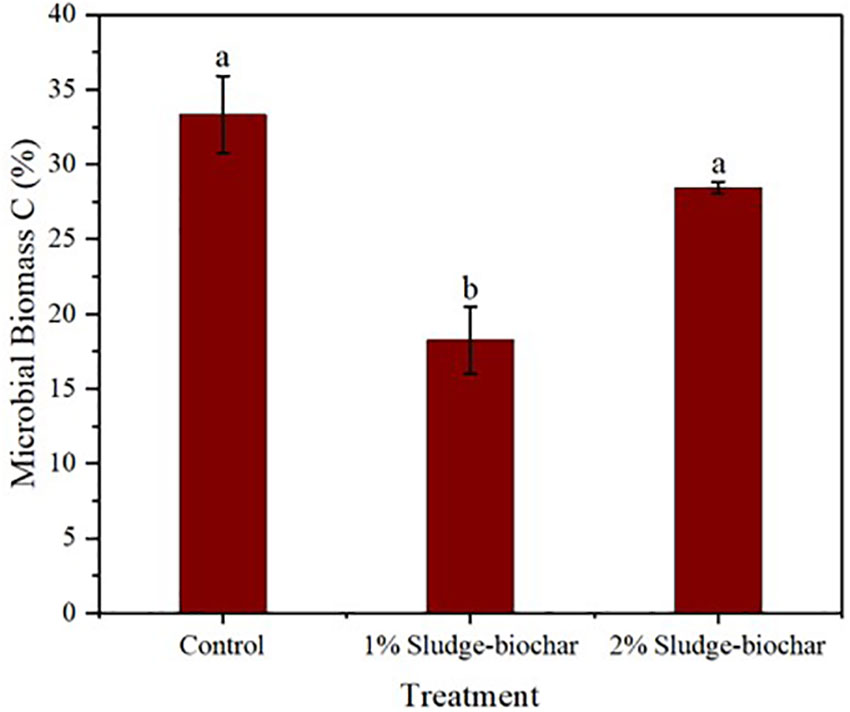
Figure 3 Effect of sludge biochar amendments on soil microbial biomass C. Means with common letters are not significantly different at p ≤ 0.05 according to Tukey’s multiple range test.
4 Conclusions
The strongly acidic soil was amended with sludge biochar to enhance its health and crop productivity. Results demonstrated that 2% biochar amendment had higher biomass in wheat and spinach compared to 1% biochar and unamended control treatment, while mung bean did not present significant differences in all treatments.
Soil health parameters such as aggregates stability and pH were improved by sludge-biochar amendments. As observed, 2% biochar demonstrated high aggregates stability (19.85%) and significant differences compared to control (9%) and 1% biochar (8.3%); soil pH was greater in 2% biochar (6.5) compared to control (5.8) and 1% biochar (5.5). EC was in the ideal level (<2.7 dS m-1) for all treatments. Soil respiration rate did not demonstrate significant differences among 1% biochar, 2% biochar and unamended control. Microbial biomass C was higher in control and 2% biochar with significant differences towards 1% biochar.
Sludge biochar amendment at 2% proved to be the ideal application rate to promote plant growth, enhance aggregates stability, increase soil pH, and reduce soil acidity compared to 1% biochar. However, the effect of sludge biochar amendment was not observed in soil biological properties. Therefore, holistic research through field experiments is recommended to assess the amendment effect of sludge-biochar on soil biological properties to validate the idea of a global adoption of sludge-biochar amendments in agricultural system to facilitate soil health and crop production.
Data availability statement
The raw data supporting the conclusions of this article will be made available by the authors, without undue reservation.
Author contributions
The research execution, hands-on work, planning, day to day activity, writing, and statistical analysis was conducted by AJ. The research idea, methodology, facility, equipment, resources, funds, and supervision were provided by MG. All authors contributed to the article and approved the submitted version.
Acknowledgments
We would like to thank the College of Agriculture, Sciences and Technology of Delaware State University for granting us funds to conduct this research.
Conflict of interest
The authors declare that the research was conducted in the absence of any commercial or financial relationships that could be construed as a potential conflict of interest.
Publisher’s note
All claims expressed in this article are solely those of the authors and do not necessarily represent those of their affiliated organizations, or those of the publisher, the editors and the reviewers. Any product that may be evaluated in this article, or claim that may be made by its manufacturer, is not guaranteed or endorsed by the publisher.
References
1. Collivignarelli MC, Abbà A, Frattarola A, Miino MC, Padovani S, Katsoyiannis I, et al. Legislation for the reuse of biosolids on agricultural land in Europe: overview. Pavia (IT: Sustainability (2019). doi: 10.3390/su11216015
2. WERF. Wastewater sludge: A new resource for alternative energy and resource recovery. factsheet. Alexandria (VA: Water Environ. Res. Foundation (2008). Available at: https://www.wateronline.com/doc/wastewater-sludge-resource-alternative-energy-0001.
3. Stehouwer RC, Wolf AM, Doty WT. Chemical monitoring of sewage sludge in Pennsylvania: Variability and application uncertainty. J Environ Qual (2000) 29:1686–95. doi: 10.2134/jeq2000.00472425002900050041x
4. USEPA. Biosolids generation, use, and disposal in the united states. EPA530-R-99-009. Washington (DC: U.S. Environmental Protection Agency (1999). Available at: www.biosolids.org/docs/18941.PDF.
5. Pescod MB. Wastewater treatment and use in agriculture. Rome (IT: Food and Agriculture Organization of the United Nations (1992). Available at: www.fao.org/3/t0551e/t0551e00.htm.
6. Evanylo GK. Land application of biosolids. In: Haering KC, Evanylo GK, editors. The mid-Atlantic nutrient management handbook. College Park (MD: Mid- Atlantic Water Program (2006). p. 226–52.
7. Roberts DA, Cole AJ, Whelan A, Nys R, Paul NA. Slow pyrolysis enhances the recovery and reuse of phosphorus and reduces metal leaching from biosolids. Queensland (AU): Waste Management (2017). doi: 10.1016/j.wasman.2017.03.012
8. Ma T, Song YH, Li GT, Zhao XR, Lin QM. Characteristics of the form and concentration of heavy metals in the biochar made from municipal sewage sludge (Chinese with English abstract). J China Agric Univi (2013) 18:189–94.
9. Beesley L, Moreno-Jimenez E, Melo L, Sizmur T. Biochar and heavy metals. New York (NY: Routledge (2015).
10. Lu K, Yang X, Gielen G, Bolan N, Sik Y, Niazi K, et al. Effect of bamboo and rice straw biochars on the mobility and redistribution of heavy metals (Cd, Cu, Pb and zn) in contaminated soil. Zhegiang (CN): J Environ Manage (2017) 186:285–92. doi: 10.1016/j.jenvman.2016.05.068
11. Song W, Guo M. Quality variations of poultry litter biochar generated at different pyrolysis temperatures. J Anal Appl Pyrolysis (2012) 94:138–45. doi: 10.1016/j.jaap.2011.11.018
12. Guo M. The 3R principles for applying biochar to improve soil health. Soil Syst (2020) 4(1):9. doi: 10.3390/soilssystems4010009
13. Sombroek WG. Amazon Soils: A reconnaissance of the soils of the Brazilian Amazon region. Wageningen (NL: Centre for Agricultural Publications and Documentation (1966). Available at https://library.wur.nl/WebQuery/wurpubs/fulltext/197516
14. Guo M, Xiao P, Li H. Valorization of agricultural byproducts through conversion to biochar and bio-oil. In: Simpson BK, Kwofie EM, Aryee AN, editors. Byproducts from agriculture and fisheries: Adding value for food, feed, pharma and fuels. Somerset. (NJ: John Wiley & Sons, Inc (2020). p. 501–22. doi: 10.1002/9781119383956.ch21
15. Ouyang L, Wang F, Tang J, Yu L, Zhang R. Effects of biochar amendment on soil aggregates and hydraulic properties. J Soil Sci Plant Nutr (2013) 13:991–1002. doi: 10.4067/S0718-95162013005000078
16. Moebius-Clune BN, Moebius-Clune DJ, Gugino BK, Idowu OJ, Schindelbeck RR, Ristow AJ, et al. Comprehensive assessment of soil health. 3rd edition. Ithaca (NY: Cornell University (2017). Available at https://www.css.cornell.edu/extension/soil-health/manual.pdf.
17. Guo M, Song W, Kazda R. Fertilizer value of lime-stabilized biosolids as soil amendment. Agron J (2012) 104(6):1679–86. doi: 10.2134/agronj2012.0186
18. Finkelnburg D. Managing acidic soils: herbicide and fertility strategies for farm and garden. Moscow (ID). UI – extension (2020). Available at: https://www.uidaho.edu/-/media/UIdaho-Responsive/Files/Extension/county/nez-perce/Ag-handouts/Managing_Acidic_Soils.pdf.
19. Couteaux MM, Henkinet R, Bottner. P. Anomalies in microbial biomass measurements in acid organic soils using extractable carbon following chloroform fumigation. Brunoy (Fr): Soil Biol Biochem (1990) 22:955–7. doi: 10.1016/0038-0717(90)90135-M
20. Zhang J, Lu F, Shao L, Chen D, He P. Multiscale visualization of the structural and characteristics changes of sewage sludge biochar oriented towards potential agronomic and environmental implication. Sci Rep (2015) 5:9406. doi: 10.1038/srep09406
21. Clapp CE, Stark SA, Clay DE, Larson WE. Sewage sludge organic matter and soil properties. In: Chen Y, Avnimelech Y, editors. The role of organic matter in modern agriculture, vol. 25 . Dordrecht: Springer (1986). doi: 10.1007/978-94-009-4426-8_10
22. Gaskin JW, Steiner C, Harris K, Das KC, Bibens B. Effect of low-temperature pyrolysis conditions on biochar for agricultural use. Trans ASABE. (2008) 51(6):2061–9. doi: 10.13031/2013.25409
23. Silva MI, MackowiakII C, MinogueII P, Reis AF III, Da Veiga-MolineII EF. Potential impacts of using sewage sludge biochar on the growth of plant forest seedlings. Cienc Rural (2017) 47:1. doi: 10.1590/0103-8478cr20160064
24. Reibe K, Götz KP, Ross CL, Doering TF, Ellmer F, Ruess L. Impact of quality and quantity of biochar and hydrochar on soil collembola and growth of spring wheat. Soil Biol Biochem (2015) 8:84–7. doi: 10.1016/j.soilbio.2015.01.014
25. Yue Y, Cui L, Lin Q, Li G, Zhao X. Efficiency of sewage sludge biochar in improving urban soil properties and promoting grass growth. Chemosphere (2017) 173:551–56. doi: 10.1016/j.chemosphere.2017.01.096
26. Yu G, Xie S, Ma J, Shang X, Wang Y, Yu C, et al. Influence of sewage sludge biochar on the microbial environment, Chinese cabbage growth, and heavy metals availability of soil In: Abrol V, Sharma P, editors. Biochar - an imperative amendment for soil and the environment. London (UK) (2018). Available at: https://www.intechopen.com/books/biochar-an-imperative-amendment-for-soil-and-the-environment/influence-of-sewage-sludge-biochar-on-the-microbial-environment-chinese-cabbage-growth-and-heavy-met.
27. Biederman LA, Harpole WS. Biochar and its effects on plant productivity and nutrient cycling: A meta-analysis. GCB Bioenergy (2012) 5:202–14. doi: 10.1111/gcbb.12037
28. Herath HMSK, Camps-Arbestain M, Hedley M. Effect of biochar on soil physical properties in two contrasting soils: An alfisol and an andisol. Geoderma (2013) 209–210:188–97. doi: 10.1016/j.geoderma.2013.06.016
29. Paz-Ferreiro J, Mendez A, Tarquis AM, Cerda A, Gasco G. Preface: Environmental benefits of biochar. Solid Earth (2014) 5:1301–3. doi: 10.5194/se-5-1301-2014
30. Wang D, Parikh SJ, Six J, Scow KM. Biochar additions can enhance soil structure and the physical stabilization of c in aggregates. Geoderma (2017) 303:110–7. doi: 10.1016/j.geoderma.2017.05.027
31. Slapakova B, Jerabkova J, Voeisek K, Tejnecky V. The biochar effect on soil respiration and nitrification Vol. 64. . Czech University (CZ: Plant, Soil and Environment (2018). doi: 10.17221/13/2018-PSE
32. Gasco G, Paz-Ferreiro J, Cely P, Plaza C, Mendez A. Influence of pig manure and its biochar on soil CO2 emissions and soil enzymes. Madrid (ES): Ecol Eng (2016) 95:19–24. doi: 10.1016/j.ecoleng.2016.06.039
Keywords: sludge-biochar, amendment, strongly acidic soil, plant growth, soil health
Citation: Junior A and Guo M (2023) Efficacy of sewage sludge derived biochar on enhancing soil health and crop productivity in strongly acidic soil. Front. Soil Sci. 3:1066547. doi: 10.3389/fsoil.2023.1066547
Received: 11 October 2022; Accepted: 03 January 2023;
Published: 24 January 2023.
Edited by:
Mingming Zhu, Cranfield University, United KingdomReviewed by:
Nimas Mayang Sabrina Sunyoto, Faculty of Agricultural Technology Universitas Brawijaya, IndonesiaYafan Cai, Zhengzhou University, China
Copyright © 2023 Junior and Guo. This is an open-access article distributed under the terms of the Creative Commons Attribution License (CC BY). The use, distribution or reproduction in other forums is permitted, provided the original author(s) and the copyright owner(s) are credited and that the original publication in this journal is cited, in accordance with accepted academic practice. No use, distribution or reproduction is permitted which does not comply with these terms.
*Correspondence: Antonio Junior, aajunior@umes.edu
 Antonio Junior
 Mingxin Guo