 Holger Rupp
 Nadine Tauchnitz2
- 1Holger Rupp, Department of Soil System Science, Helmholtz Centre for Environmental Research – UFZ, Halle, Germany
- 2State Institute for Agriculture and Horticulture Saxony‐Anhalt, Centre for Agronomy and Crop Production, Bernburg, Germany
Introduction: Despite various efforts to reduce nitrogen leaching from agricultural land, the permissible nitrate concentrations in groundwater have often been exceeded in the past. Intensive farming is often seen as the cause of the deterioration in water quality. Therefore, the present lysimeter study aimed to quantify nitrogen (N) leaching at different N fertilization levels for the agricultural land use systems of arable land and grassland to derive suitable management measures for improving groundwater quality.
Methods: The effects of three different of mineral fertilization treatments (50%, 100%, and 150%) in arable land and grassland use on four distinct soil types (loamy sand, sand, loam, loess) concerning seepage formation, nitrogen concentrations, nitrogen loads, dry matter yields and nitrogen balances were tested. The study was conducted at the lysimeter facility of the Helmholtz Centre of Environmental Research – UFZ at Falkenberg (northeast Germany). Twenty-four non-weighable lysimeters with a surface area of 1 m² and a depth of 1.25 m were managed as grassland and arable land with three different fertilization treatments since 1985.
Results and Discussion: For arable land use, N leaching differed between the studied soil types, with the highest N loads from the sand (36.6 kg ha–1 yr–1 ) and loamy sand (30.7 kg ha–1 yr–1 ) and the lowest N loads from loess (12.1 kg ha–1 yr–1) and loam soil (13.1 kg ha–1 yr–1). In contrast to grassland use, a reduction of N fertilization level by 50 % did not result in reduced N leaching for arable land, whereas a maximal 29% reduced dry matter yields was observed. An increase of N fertilization by 50 % did not cause significant enhanced N leaching at arable land use. Soil-and management-related factors (soil type, texture, soil tillage, crop rotation, and others) mask the effect of increased N fertilization rates in arable land using lysimeters. For arable land use, a reduction of N fertilizer levels as the only measure was insufficient to reduce NO3– leaching, and other strategies besides N fertilization levels are required to improve groundwater quality. Measures should be targeted to reduce N losses by mineralization processes.
1 Introduction
Today, agricultural land use is often suspected of being responsible for the chemical contamination of groundwater that, in some cases, has been proven to exceed threshold values in many areas (1–3). Extensively applied pesticides and fertilizers that have not been implemented in a plant-physiological manner reach ground and surface waters via surface erosion or the seepage pathway in the case of intensive land cultivation and have a detrimental effect on water quality. In the case of mineral fertilizers, excess nitrogen and phosphorus, in particular, can cause significant water quality problems. The leaching of unused nutrients also represents a cost factor from a farm management point of view, which can be minimized by excellent site-adapted land management (4).
Numerous scientific publications are available regarding the transport and transformation processes of nitrogen (N) compounds in the unsaturated soil zone and leaching into groundwater (5–7). Nitrate (NO3−) has often been the focus of investigations since high NO3− concentrations in drinking water can adversely affect human health. On the one hand, NO3− can be converted to nitrite (NO2−) in the body under certain circumstances. This is especially critical for infants in the first months of life due to a possible cyanosis hazard. On the other hand, NO2− can form the so-called nitrosamines with a probabilistic cancer risk and the resulting disease burden (8). The risk of developing colorectal cancer significantly increased in the case of long-term exposure to more than 16.75 mg NO3 L−1 (9). N loads into surface waters and seas have a eutrophic effect. As a result, algal blooms and oxygen deficiency occur more frequently. To achieve the European limit value for NO3− in groundwater of 50 mg NO3− L−1 (10, 11), the existing NO3− surpluses must be reduced and, thus, the N inputs should be drastically reduced (12).
The relationships between mineral N fertilization and N leaching have been investigated in numerous research projects (13–23). It has been proven in several studies that there is a close link between NO3− leaching losses from fertilized crops and N application rates that exceed crop demand (excessive surpluses of fertilizer N) (5, 22, 24–26). Otherwise, several studies found no significant correlation between NO3− leaching and the fertilizer N surpluses (23, 27–29). As a reason for this, it was pointed out that a large part of the recently added residual N fertilizer is retained in soils in organic pools with intermediate resistance to mineralization (23, 29–31). Consequently, it was noted in different 15N studies that most NO3− leaching from arable land originates from the mineralization of organic soil N (29, 32–34). However, very few long-term studies consider the fate of 15N added in mineral fertilizers in soils, the long-term effects on the soil mineralization capacity, and associated leaching losses (31, 35).
Under the climatic conditions of Southern and Central Europe, climate change is predicted to result in reduced groundwater recharge rates and declining groundwater levels due to the expected development of drought effects. As a result of lysimeter investigations under the climatic conditions in northeastern Germany, a close interaction between the climatic conditions and the nutrient leaching with seepage was proven. In dry years, no seepage formation was observed. The reappearance of seepage in subsequent wet periods was associated with exceptionally high NO3− concentrations, and leaching losses, which exceeded the applicable drinking water limits many times and could lead to a significant risk to water quality (36).
Excessive mineral fertilization, often associated with intensive land management, significantly increases water resource pollution (37–39). However, the leaching of NO3− from arable land is influenced by numerous factors. Weather, soil properties, land use, crop rotation, soil tillage intensity, amount, type, and timing of N fertilizer application are considered the main drivers (40, 41). It is known from several studies that NO3− leaching is reduced in grasslands compared to cropland due to high N efficiency and intense microbial biomass turnover under permanent vegetation (42–44). It has been reported that even with high N fertilizer applications, NO3− leaching remains low under mechanically managed grassland (45). Increased NO3− leaching from grassland was only monitored with extremely high N fertilizer surpluses (46, 47). Higher NO3− leaching was observed in several studies for no-till systems because of a higher proportion of macropores favoring preferential flow (48–51). Otherwise, higher N leaching in the treatments with intensive soil tillage compared to no-till was reported by others and explained by increased mineralization due to oxygen input by soil movement (52–54). Some studies, in turn, showed no significant effect of soil tillage on NO3− leaching (55–57). Hence, the impact of soil tillage on NO3− leaching was discussed controversially. Differences in NO3− leaching were observed between mineral and organic N fertilizers (29, 58). Animal manure is suspected to have a higher NO3− leaching risk compared to mineral fertilizers because of its low N use efficiency (29, 59).
Using a random forest model with a dataset of 48 farms, Dieser et al. (41) identified the factors of soil type, texture, precipitation in October, and crop rotation (main and subsequent crop) as the most relevant factors for the NO3− leaching potential of arable land. It was also confirmed by other authors that NO3− leaching is determined by a combination of environmental conditions (climate and soil) and cropping system management factors (crop rotation, tillage, and fertilization) (60, 61) whereas, among the environmental factors, NO3− leaching was positive correlated with precipitation during the hydrological year (April–March) and during early winter (October–December) (22). Main crops with high N requirements (e.g., winter wheat), large amounts of residues (e.g., rape, legumes), intensive soil movement during harvest (e.g., potatoes), and a high proportion of organic fertilizers (e.g., maize) led to high-soil mineral contents (0 cm–90 cm) in autumn (before the start of the annual leachate period) and can be regarded as a predictor for the NO3− leaching potential (41).
The main objectives of the present long-term lysimeter study were to
i) quantify NO3− leaching and NO3− concentrations of seepage at the different agricultural land use systems, arable land, and grassland;
ii) determine the effects of different soil types and different N fertilization levels on the NO3− leaching and NO3− concentrations of seepage and dry matter yields of both land use systems (arable land and grassland);
iii) evaluate if a reduction of N fertilization is a suitable measure to improve the groundwater quality in the long term.
Long-term studies are scarce, considering the effect of reduced N fertilization on NO3− leaching at agricultural land use systems. However, these studies are necessary to derive efficient management strategies to improve groundwater quality while sustaining high crop productivity.
2 Materials and methods
2.1 Lysimeter facility
A combined multifactorial lysimeter experiment with the experimental components mineral fertilization, land use, and soil type was set up to clarify the relationships between the level of mineral N fertilization and the leachate-bound nutrient discharge (62). Lysimeter experiments are especially suited to investigate water and solute fluxes in soils (63–68). Therefore, a long-term lysimeter experiment was created at the Lysimeter facility of the UFZ in Falkenberg (coordinates 52.859780 N, 11.812595 E) in 1985. The site is located in the North-East German lowlands. It belongs to the temperate zone of Central Europe within the transition zone from maritime to continental climate with an average precipitation of 524.5 mm (1968–2007) and an average temperature of 9.2°C (1994–2007).
This study is based on 24 non-weighing gravity-flow (free drainage) lysimeters (NWLYS). The simple NWLYS type is often used in Germany and other central European countries for applied research on land management and its impact on drainage water quantity and quality (69, 70). They were constructed in the form of a sheet steel vessel with a surface in the shape of a square with sides measuring 1 m × 1 m (surface area of 1 m²) and a total depth of 1.25 m. After the installation at the lysimeter facility, a 25-cm-thick filter layer (sand over gravel over stone gravel) was placed at the bottom of the vessels. A polyvinyl chloride drainage pipe (inner diameter of 63 mm) coated with well-filter gauze was laid within the filter layer to collect the seepage water and drain it into a storage tank in the lysimeter cellar (63, 71).
The lysimeter vessels were filled with soils representative of agricultural sites in the Elbe River basin in 1981 and 1982. The soil types, such as loamy sand, sand, loam, and loess, were used. The soil profiles were mined separately for topsoil (0 cm–30 cm) and subsoil (31 cm–100 cm) at the extraction sites and transported to the Falkenberg lysimeter station. There, the profiles were then installed in the lysimeter vessels in a largely profile-compliant manner. During the manual filling of the lysimeters, particular emphasis was placed on restoring the soil structure of the extraction site within the lysimeter. The lysimeters were irrigated to accelerate the setting process after this filling procedure (approximately 100 mm of irrigation water per year).
The most essential soil-physical and soil-chemical properties of the soils in the lysimeter vessels are listed in Table 1.
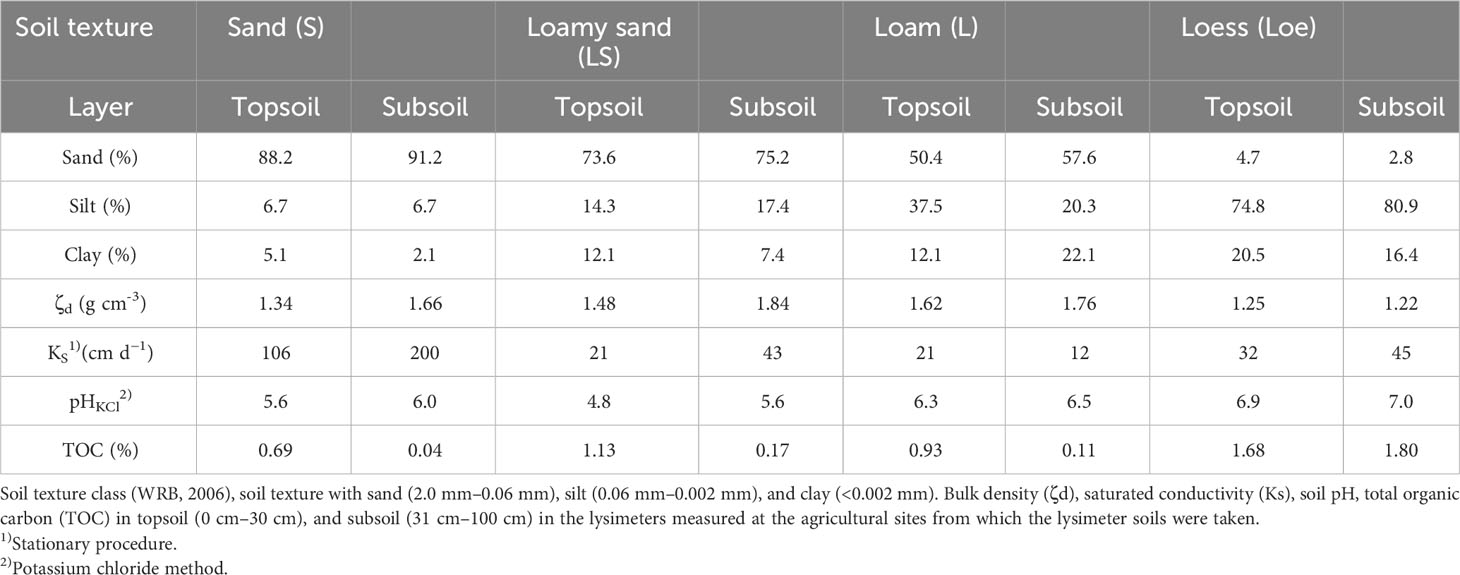
Table 1 Basic parameters of the lysimeter soils.
The results presented here relate to the period 1985–2023. The progression of the experiment over time is shown in a timeline (see Supplementary Figure S1).
In addition, selected climate parameters were also measured at the UFZ lysimeter facility. Precipitation was measured daily at ground level and a height of 1 m above the ground using rain gauges with a collecting surface of 200 cm² (standard rain gauge of the German Meteorological Service).
2.2 Cultivation of the lysimeter soils
Table 2 provides an overview of the different agricultural management systems for arable land and grassland and the associated fertilizer applications. Mineral fertilizers were applied in liquid or solid form. The arable lysimeters were managed according to a grain-fodder crop rotation (clover-grass –winter wheat – winter barley – oats). After harvesting winter barley, a mixture of corn and sunflower was grown as a catch crop, which was harvested in late autumn and removed from the lysimeters. The cultivation was typical for agricultural production in Germany, while fertilization was more experimentally designed. Mineral fertilization (N, P, and K) was determined according to the recommendations for optimal supply valid in the mid-80s of the last century (this corresponds to the fertilization treatment 100%). A variation of mineral fertilization was carried out using increases and decreases of 50% each. Organic fertilization was not applied during the entire study period. The established crop rotation has been maintained ever since. The fertilization regime was not changed throughout the experimental period. In 1985, a stand consisting of 30% German ryegrass (Lolium perenne), 40% orchard grass (Dactylis glomerata), 20% timothy (Phleum pretense), and 10% bluegrass (Poa pratensis) was established on lysimeters managed as grassland. The grassland lysimeters were cut 4 times a year.
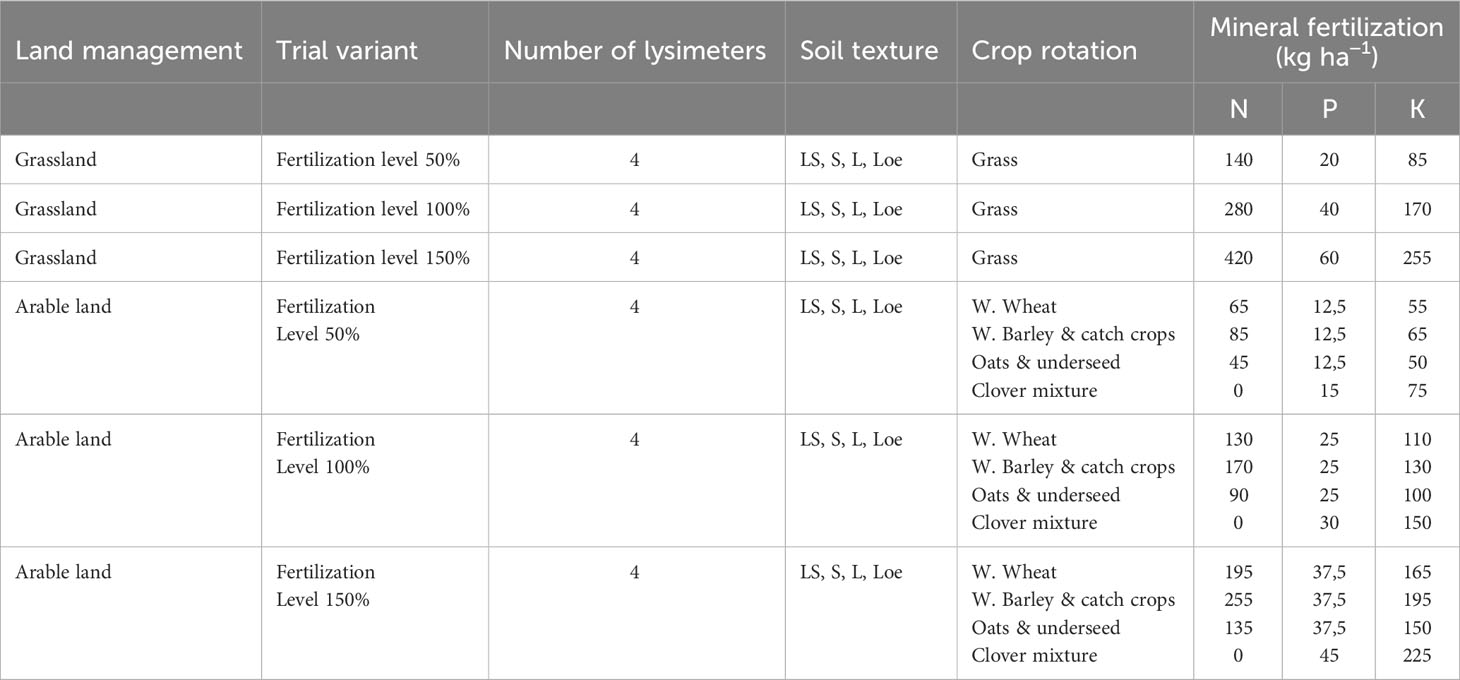
Table 2 Overview on the experimental lysimeter management practices and mineral fertilization (W. = winter).
The lysimeters (both grassland and arable land) were irrigated from 1985 until 2003 according to the plant’s physiological requirements for yield maximization. Depending on crop and specific climate conditions, irrigation water was additionally applied. This irrigation regime was changed in 2004. From this date onwards, the crops were irrigated exclusively to safeguard plant stocks, which significantly reduced the amount of irrigation water applied (up to 50 mm annually).
Nitrogen was fertilized as calcium ammonium nitrate (CAN, 26% N, 10% Ca). The granulated fertilizer was annually spread (treatments according to the management schedule of Best Management Practice) in spring according to the development stages of the cultivated crops. The mineral fertilizer “Triple Super Phosphate” (Helm AG, Hamburg, Germany) containing 20% total P was applied for mineral P fertilization of the lysimeters. Grain potash (K+S Minerals and Agriculture GmbH, Kassel, Germany) was used as potassium fertilizer (40% K2O, 6% MgO, 3% Na, 5% S).
Plant protection products in the form of herbicides, fungicides, insecticides, and growth regulators were not used during the lysimeter experiment. Turning tillage (with a spade) was carried out to a tillage depth of 25 cm on the arable land lysimeters. No tillage was carried out on the grassland lysimeters. The crop residues were tilled into the soil after harvest, and weeds were treated mechanically with a cultivator.
The grass was cut 4 times a year in the second half of May, the second half of June, the end of July, and August. All treatments within the experiment were harvested manually on the same day. Dry matter yield was determined from all harvested products (grass, grain, and field forage). After measuring the fresh weight per lysimeter, approximately 500 g was taken and dried in a drying cabinet for 16h at 60°C to determine the dry-matter yield.
2.3 Leachate sampling, water analyzes, and assessments
Depending on the climatic conditions, leachate occurred in the lysimeters, mainly from November to April. The leachate was continuously collected in the storage tanks (two polyethylene canisters, each with a volume of 30 dm³) in the lysimeter cellar. The amount of leachate was determined monthly by weighing the leachate storage tanks once a month. Monthly samples were taken, filtered through 0.45-µm Millipore syringe filters, and analyzed in the UFZ facility laboratory for concentrations of NO2-N, NO3-N, and ammonium (NH4-N), according to German Industrial Standards (DIN 38405–38406) by ion-exchange chromatography (IC, Thermo Fisher Scientific, Idstein, Germany). Atmospheric deposition was determined using a bulk precipitation sampler BUS 100 from Eigenbrodt (Hamburg, Germany). As the measuring device did not have an active cooling system, the rainwater collected by this device was extracted after significant rain events and stored in a container in the laboratory building at a temperature of 8°C. Here, too, monthly samples were prepared and analyzed according to the chemical methodology described.
The primary data collected were secured, and all work and observations were fully documented. Uniform measurement methods were used to determine the relevant quantitative and qualitative parameters for all lysimeters included in the lysimeter test. In 1993, the analytical method for determining concentrations of nitrate, nitrite, and ammonium was changed from photometric to ion exchange chromatography. Extensive parallel measurements were successfully carried out to ensure the comparability of the results. The analyzers used were serviced and checked annually by the manufacturer’s service staff. In addition, the quality of the analyses performed was assured by participating in round-robin tests with other laboratories.
We calculated monthly loads based on monthly N concentrations and the amount of seepage water, which were finally used to calculate average annual N concentrations and annual loads (seepage-weighted averages), respectively.
2.4 Statistics
Data assessment was performed using ORIGIN software (OriginLab Corporation, Northampton, MA, USA). The available data were checked for normal distribution. As this was not the case, the available time series were statistically compared using the Kruskal–Wallis test (one-way analysis of variance on ranks), a non-parametric method used to test whether lysimeter data originated from the same distribution.
The available measurement series were compared using median values.
Due to the experimental design, only one lysimeter vessel could be used for each fertilization treatment, soil type, and cultivation method. There is no real repetition here. The natural variability is thus reflected to a limited extent.
The Change Point Analyses (CPA) app for OriginPro detected single and multiple changes within the seepage time series. This app can identify changes in mean, variance, or both. The CPA app is based on the R software package changepoint (72).
Time series analyses of the N leaching data (grassland and arable land) for the 38-year long-term series were performed with OriginPro 2024 (OriginLab Corporation, Northampton, MA, USA) with the provided apps “simple time series analysis (v. 1.20)” and “advanced time series analysis (v. 1.00)” to proof data series of stationarity, existing trends (linear regression), autocorrelation [Autocorrelation Function (ACF), Partial Autocorrelation Function (PACF), and Auto Regressive Integrated Moving Average (ARIMA)] and to identify seasonal variations of long-term data series. Thus, time series analyses were used for retrospective analyses of long-term data to detect seasonal patterns and structure of the time series and to compare different time series with each other.
3 Results
3.1 Seepage
Figure 1 presents the medians of seepage for the different soil types and fertilization treatments. Significant differences in seepage between the fertilization treatments could be proved neither for arable land nor for grassland (Figure 1). But, as expected, the amount of seepage was highly significantly different between arable land and grassland (p < 0.0001, cf. Supplementary Table S1). Under the specific conditions of our lysimeter experiment, grassland showed a higher seepage rate with a median value of 158.6 mm year−1 compared to arable land (92.2 mm year−1, Supplementary Table S1). Among soil types, lysimeters filled with sand had significantly higher seepage than those filled with loamy sand, loam, and loess (Supplementary Table S1). The 50% fertilization treatment showed, in most cases, higher seepage rates than the 100% and 150% fertilization treatments, although the differences were not significant. However, there was a trend of decreasing seepage amounts due to increased fertilizer application visible. This relates to increased water consumption by plants with higher nutrient supplies.
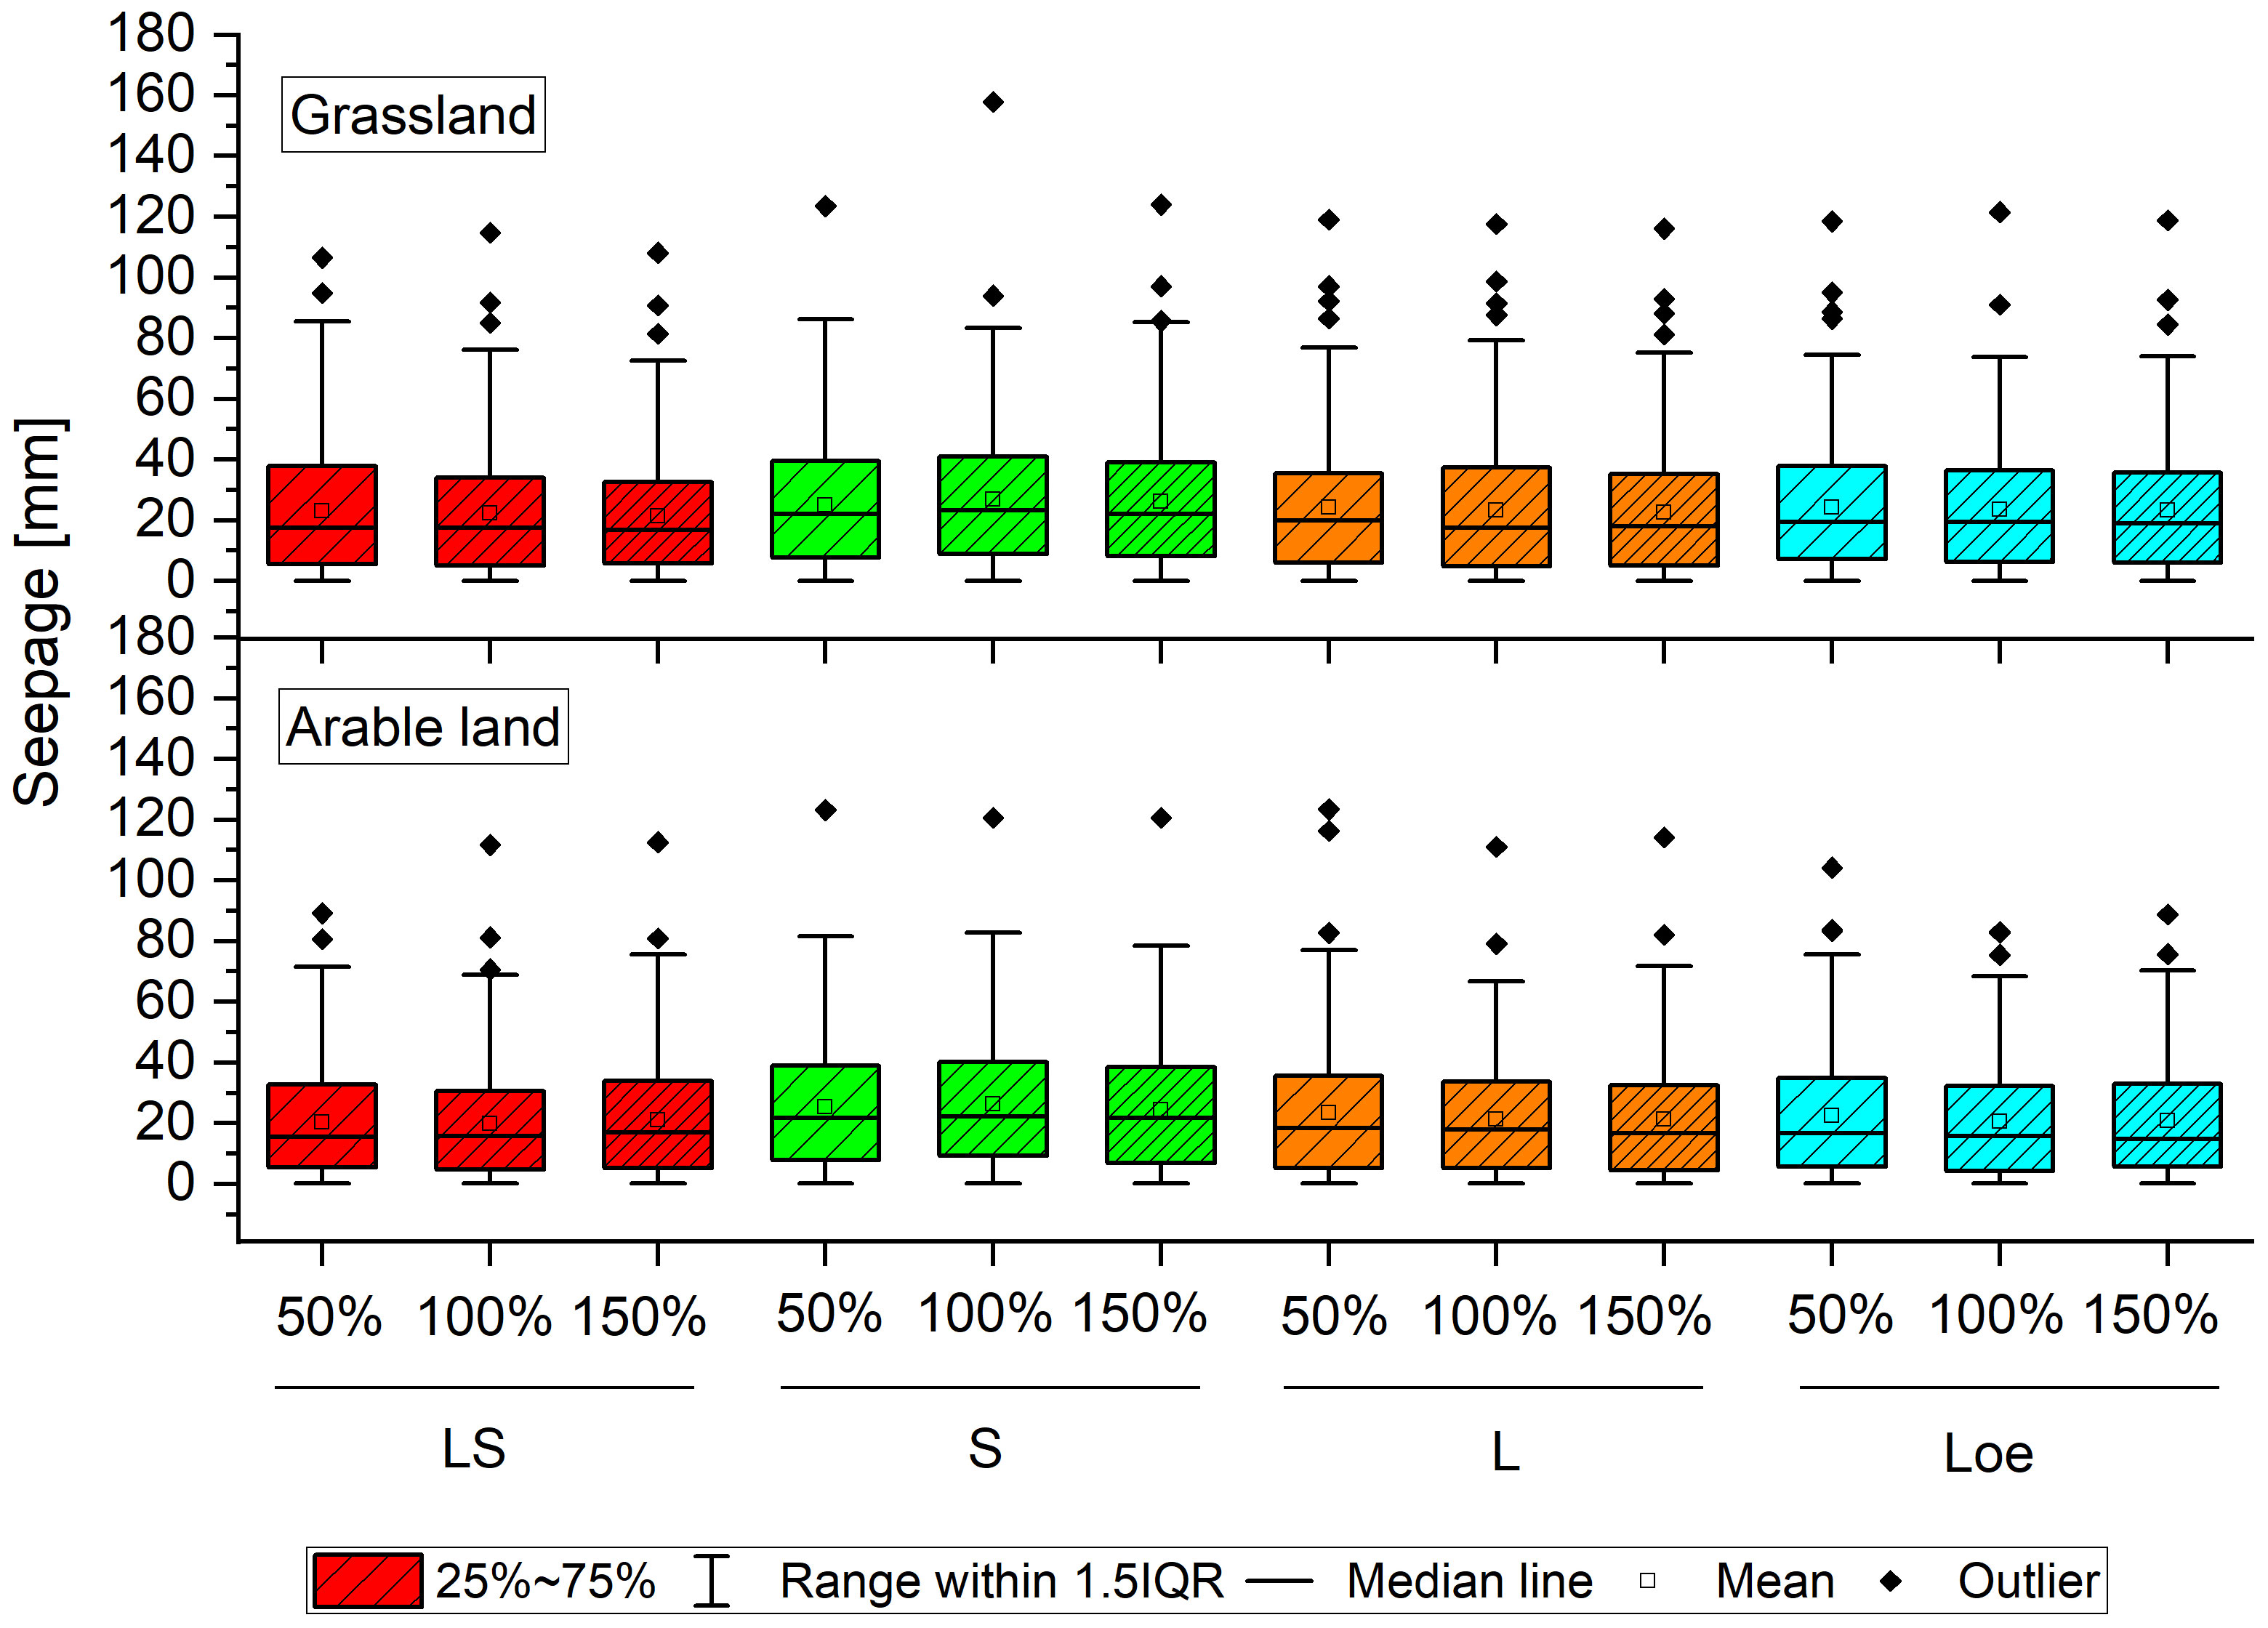
Figure 1 Boxplot of seepage rates measured in lysimeters filled with the soil types loamy sand, sand, loam, and loess under three fertilization treatments (50%, 100%, and 150%) for arable and grassland management (asterisk with bracket as significance mark) for the 38 years observation period 1985–2023.
In contrast, this relationship was not observed for the soil type loamy sand and sand used as arable land at a fertilization treatment of 50%. The seepage measured here decreased compared to the 100% and 150% fertilization treatment at the same use. The 2004 change in the irrigation regime (irrigating only for stand protection) did not change the seepage time series. As a result of a change point analysis, changes in the amount of seepage water occurred in the lysimeters of both grassland and arable land as a consequence of the years 2018, 2019, and 2020, which were characterized by low precipitation and high air temperatures during the growing season (cf. Supplementary Figures S2 and S3).
The quantities of seepage water measured varied considerably from year to year. Seepage fluxes were very closely linked to the climatic conditions, especially the precipitation regime. In wet years, leachate quantities of up to 470 mm were measured (1994, grassland use on sandy soil, fertilization level 100%). In contrast, seepage water fluxes came to a standstill following the dry year of 2018, except for the sand-filled lysimeters in grassland use. In the study period from May 1984 to April 2023, seepage formation was very closely correlated with the amount of precipitation. For grassland use, this relationship was direct, that is, in the result of a simple time series analysis using cross-correlations, the highest correlation coefficients r of 0.26–0.35 were calculated for a time lag of 0 or 6 months. In the case of arable land use, the highest correlation coefficients of 0.22–0.27 were calculated exclusively for the investigated soil types at a time lag of 6 months. The amount of leachate was, thus, significantly influenced by the precipitation 6 months earlier. High-annual seepage volumes corresponded to years with high rainfall and vice versa.
3.2 Nitrogen concentrations
The N concentrations measured during the study period varied considerably and were subject to significant annual fluctuations. The N concentrations showed a minimum of 0.002 mg L−1 (grassland use, soil type loam, and fertilization treatment 50%) and a maximum of 488.0 mg L−1 (grassland use, soil type loam, and fertilization treatment 150%). Further concentration peaks of a comparable magnitude occurred, especially with the 150% fertilization treatments, when leachate resumed after dry periods. Cross-correlation did not establish a relationship between the precipitation regime and the measured N-concentrations. The lowest median N concentration (sum of NO3− N, NO2− N, and NH4+ N concentration) of 1.04 mg L−1 was found in grassland use on the loam soil at the 50% fertilization treatment. In contrast, the highest median N concentration, 40.8 mg L−1, occurred in the loess soil managed as grassland at the 150% fertilization treatment. The median N concentrations averaged over all fertilizer treatments showed significant differences between grassland (5.08 mgN L−1) and arable land (21.6 mgN L−1) (Supplementary Table S2).
In the case of grassland use, there were significant differences between the fertilization treatments for all soil types considered. The lowest median N concentrations of 1.4, 2.9, 1.0, and 5.4 mg L−1 were measured for the 50% fertilization treatment on soil types such as loamy sand, sand, loam, and loess, respectively. On the other hand, the fertilization treatment of 150% showed the highest median concentrations of 6.3, 16.2, 7.9, and 40.8 mg L−1 on soil types such as loamy sand, sand, loam, and loess, respectively. For all soil types investigated, the significantly higher N concentrations of the 150% fertilization treatment compared to the 50% and 100% fertilization treatments were particularly pronounced (Figure 2).
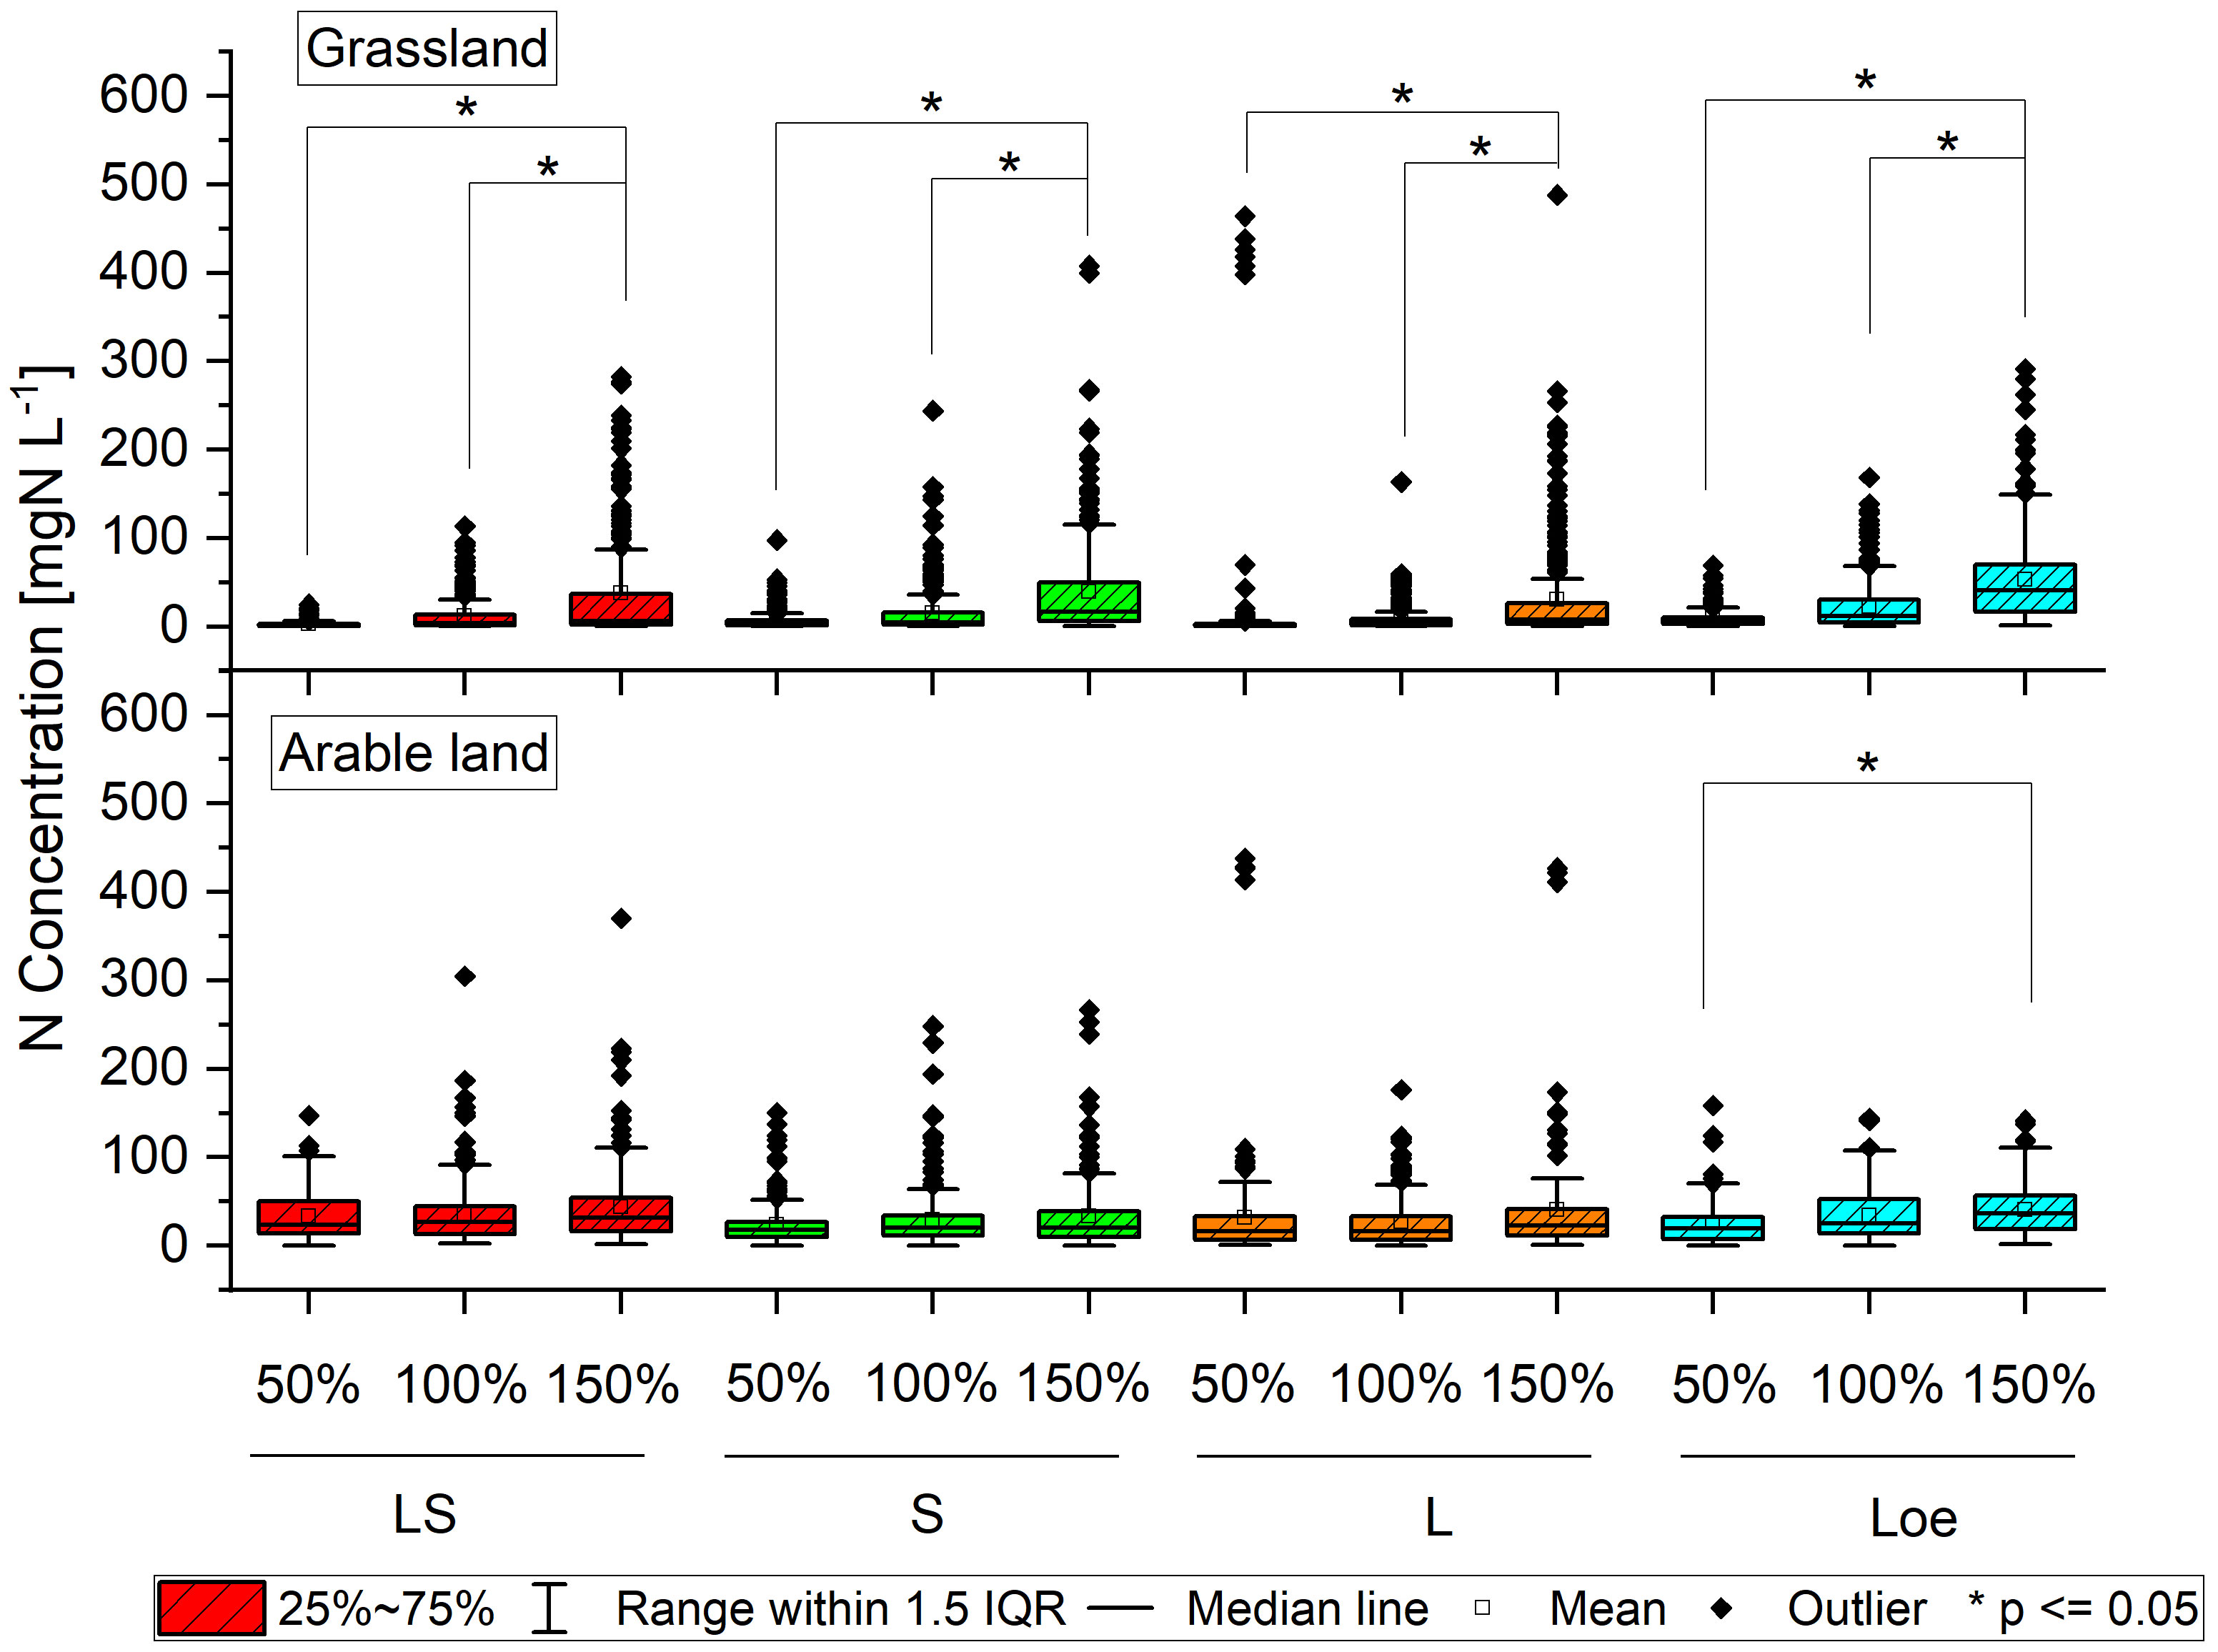
Figure 2 Boxplot of N concentrations measured in lysimeters filled with the soil types loamy sand, sand, loam, and loess under three fertilization treatments (50%, 100%, and 150%) for arable and grassland management (asterisk with bracket as significance mark) for the 38 years observation period 1985–2023.
In the case of arable land, the median N concentrations of the investigated soil types showed a significant differentiation. The lowest median concentrations were found in the loam-filled lysimeter with 16.4 mgN L−1 at the 50% fertilization treatment. The highest median concentration of 36.5 mg L−1 occurred in the soil type loess at the 150% fertilization treatment. The lowest median N concentrations for the 50% fertilization treatments were observed in each case. As expected, the fertilization treatment of 150% showed the highest concentration on soil types such as loamy sand, loam, and loess, with 31.6, 22.5, and 36.5 mg L−1, respectively. For the soil type sand, the highest N concentration was found in fertilization treatment 100% with 20.7 mg L−1. No significant differences between fertilization treatments were evidenced in the soil types except for the 50% and 150% fertilization treatments in the loess soil (Figure 2).
The monthly median values of N concentration calculated as a result of the 38-year study period are presented in Table 3. After a soil passage of 1.25 m, the N concentrations of lysimeters used as grassland with a fertilization level of 50% for all soil types tested did not exceed the limit value currently valid in the European Union (11) for the nitrate concentration in groundwater of 50 mgNO3 L−1 (approximately 11.3 mgN L−1). This could also be proven for grassland use for the soil types such as loamy sand, sand, and loam in the fertilization treatment 100%. In contrast to the treatments with 50% and 100% fertilization, applying mineral fertilizer at 150% resulted in significantly increased N concentrations for grassland use.
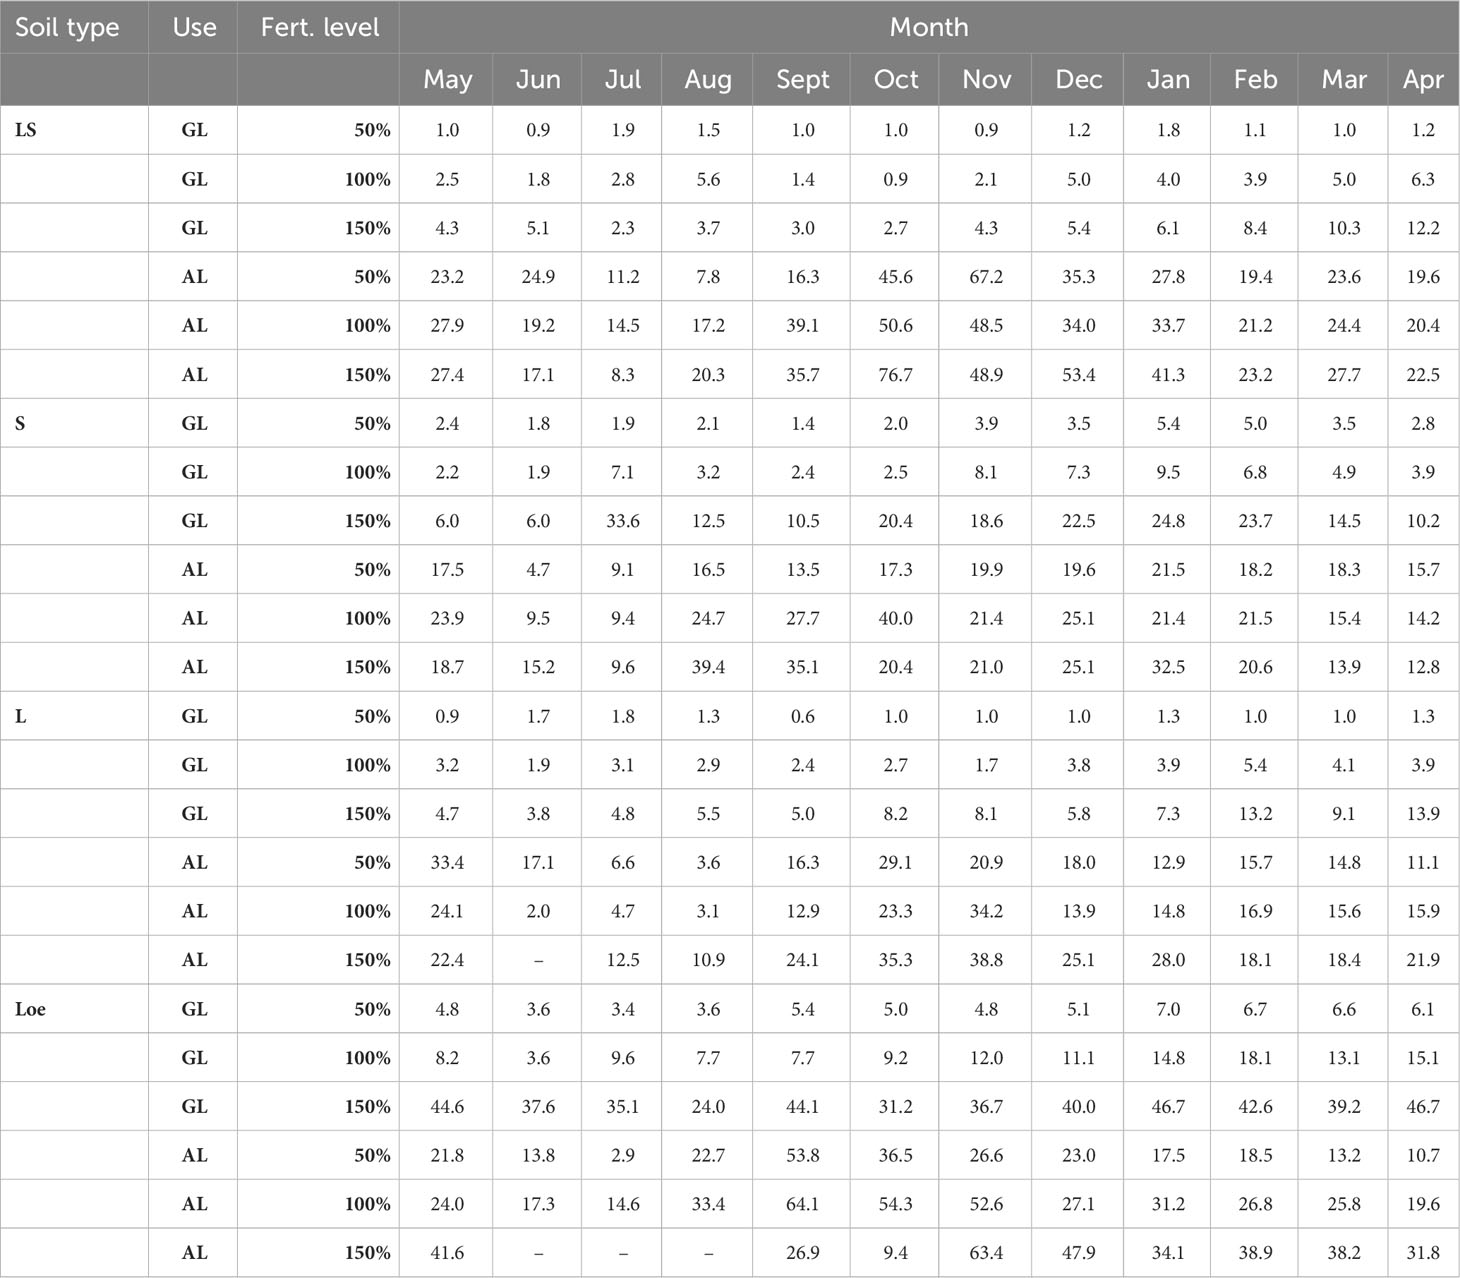
Table 3 Median of monthly N concentrations (mgN L−1) (period May 1984–April 2023).
In arable land use, monthly N concentrations were high for all soil types, and fertilization treatments studied and exceeded the limit values. Peak median values of up to 76.7 mg L−1, mainly caused by NO3−, occurred above all in arable land use in the fertilization of 150% in October to March within the leaching period. In contrast, lower N concentrations tended to occur from April to September during the vegetation period (Table 3).
3.3 Nitrogen loads
Annual N loads showed a high variation between the investigated study years, particularly for grassland use (Figure 3). Here, maximal values of up to 476 kg ha−1 year−1 were observed at the 150% fertilization treatment on the soil type sand in 2011, combined with high precipitation and seepage amounts. Minimal annual N loads of ≤ 0.01 kg N ha−1 were observed for the soil type loamy sand for all fertilization treatments in the dry year 2019 and the loess soil in 2022 at the 100% fertilization treatment. For arable land, annual N loads differed between ≤ 0.01 kg N ha−1 (sand soil and loamy soil in 2019 and 2012) and maximal 395 kg N ha−1 (loamy sand at 150% fertilization treatment in 2011) (Figure 3). High-annual N loads corresponded to years with high precipitation and seepage amounts and vice versa.
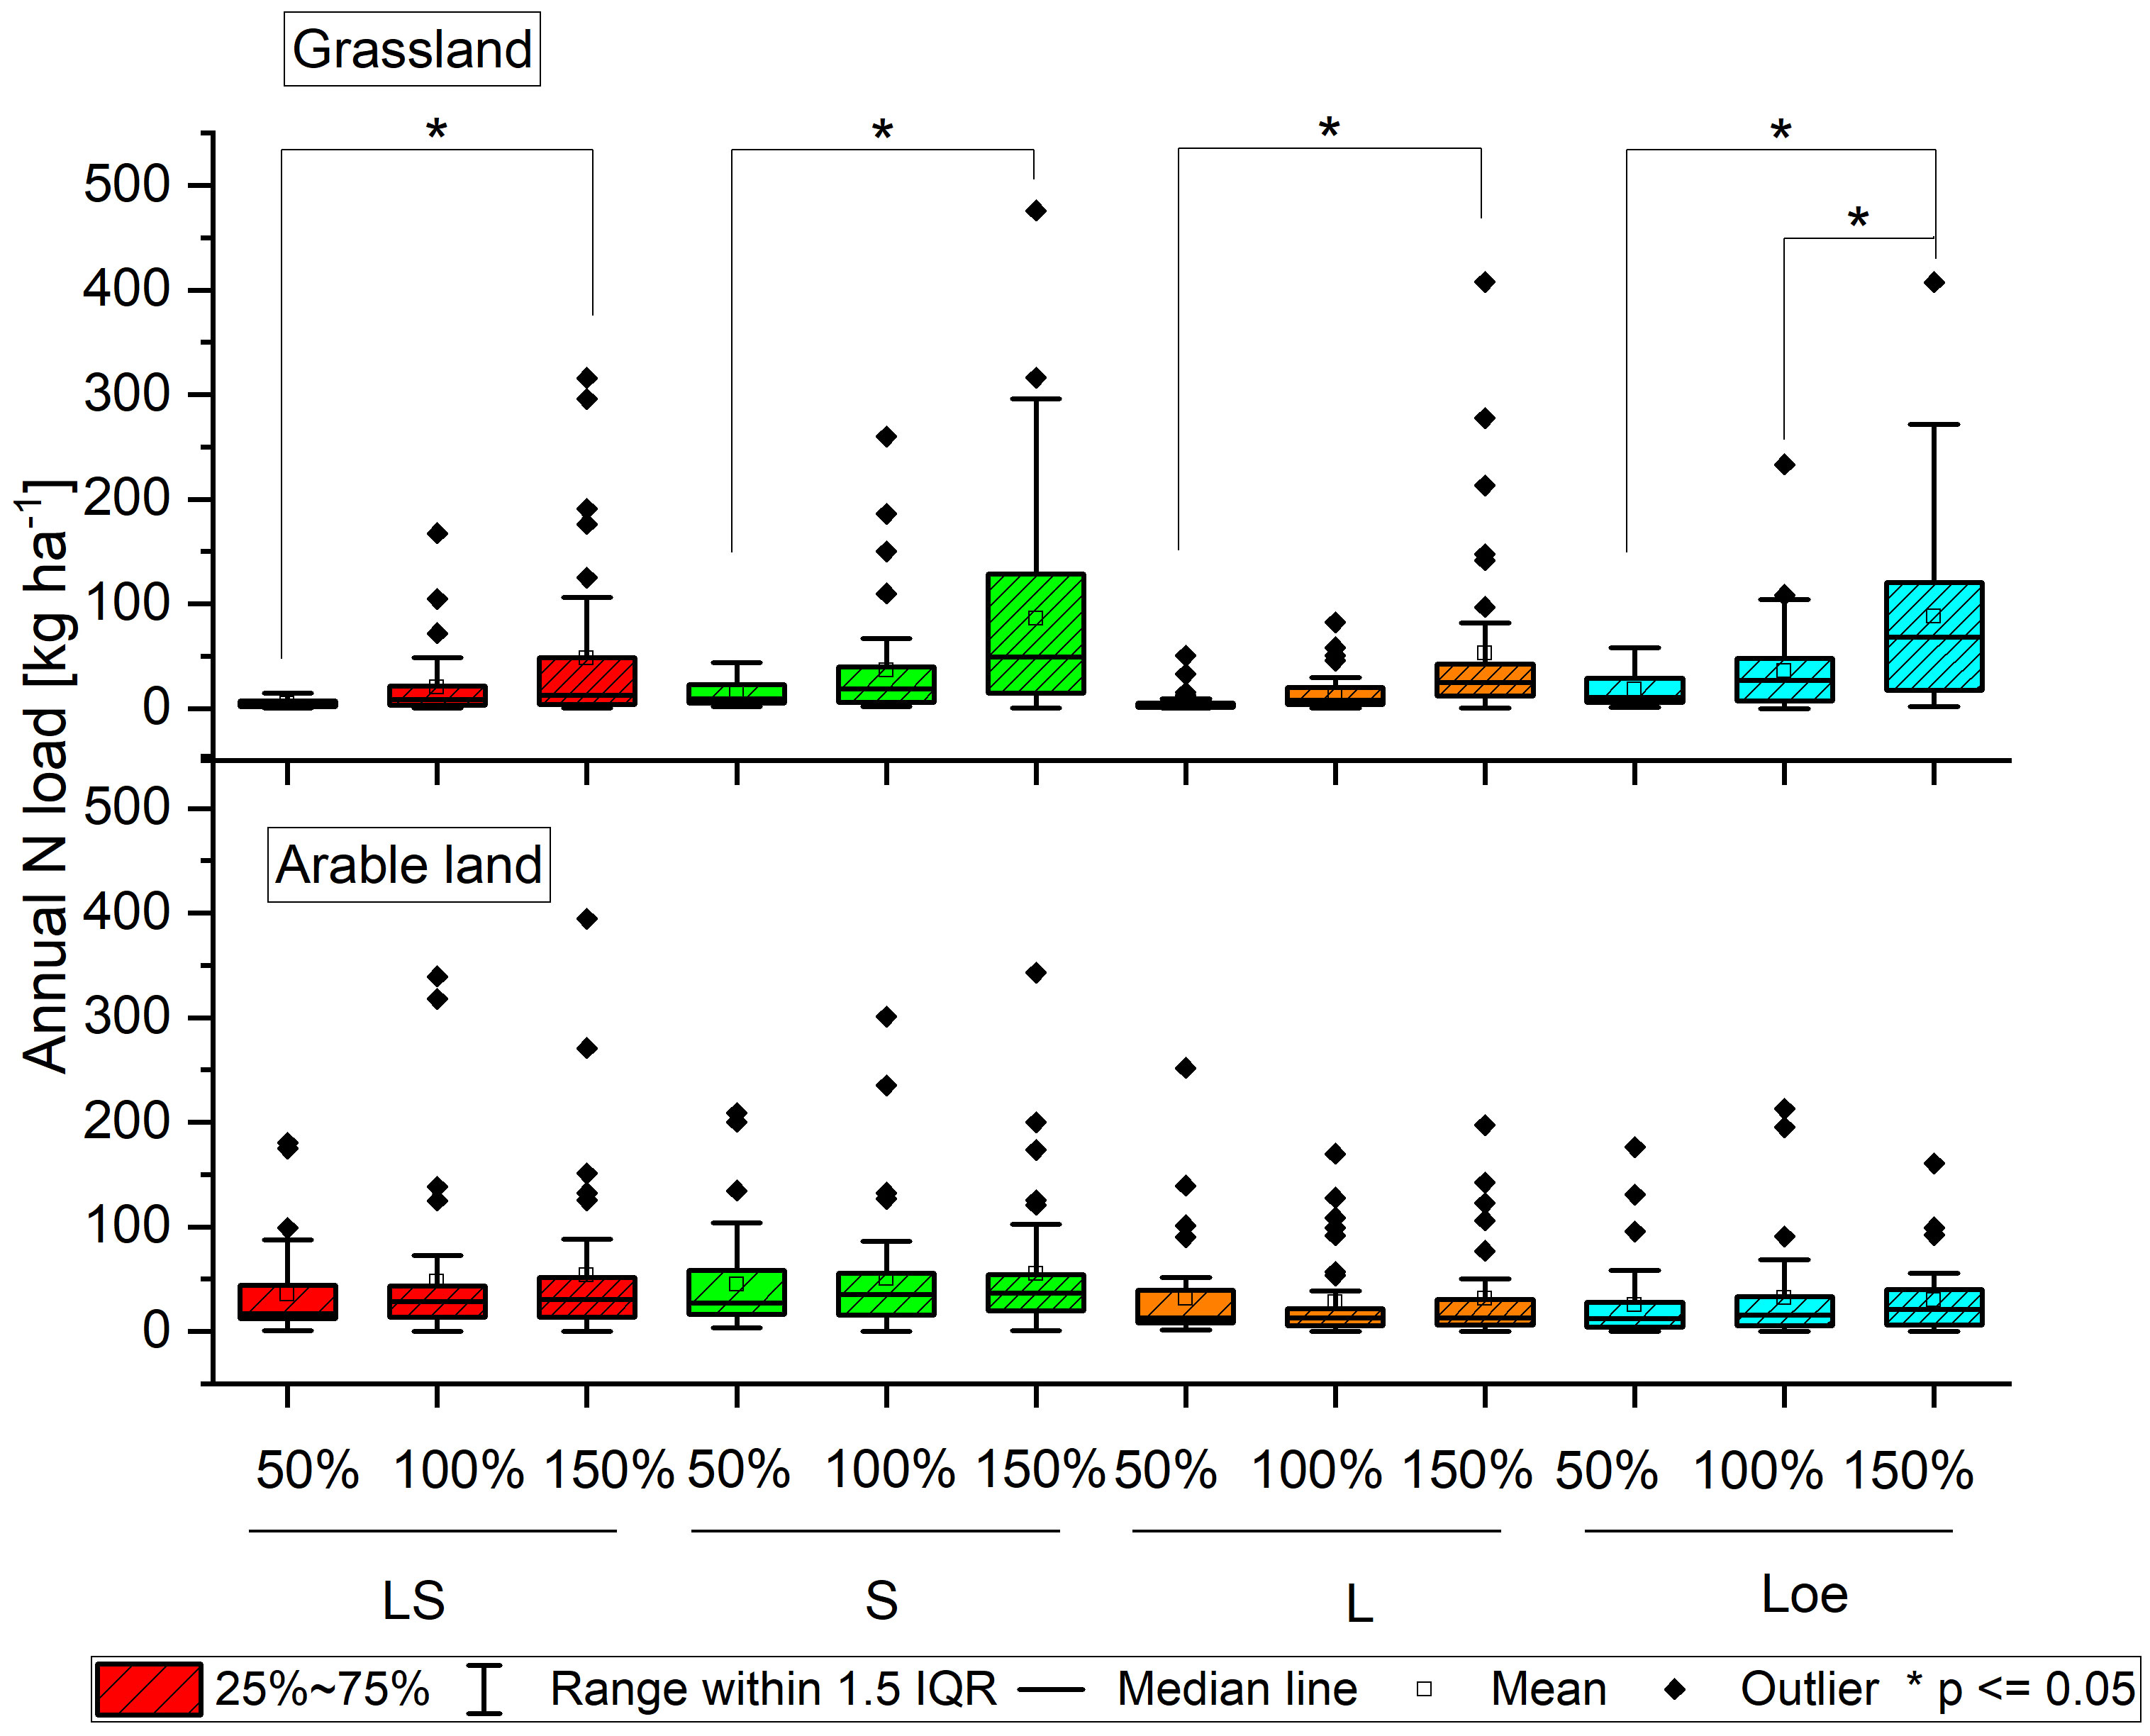
Figure 3 Boxplot of N loads measured in lysimeters filled with the soil types loamy sand, sand, loam, and loess under three fertilization treatments (50%, 100%, and 150%) for arable and grassland management (asterisk with bracket as significance mark) for the 38 years observation period 1985–2023.
Analyses of time series showed a markedly pronounced seasonal variation of N leaching for grassland and arable land, with the highest N leaching occurring from January to March and November to December (Supplementary Figures S4 and S5). In contrast, there was a negative deviation from the long-term average of the long-term series from April to October.
Mean N leaching (median values of all years and averaged for all lysimeters with the same land use) showed significantly different levels after 38 study years for grassland and arable land, at 12.1 kg ha−1 and 20.5 kg ha−1, respectively (Supplementary Table S3).
For grassland, 2.5 kg ha−1 was the lowest mean annual N leaching loss measured at the fertilization treatment of 50% on the soil type loam. In contrast, the highest yearly N leaching losses occurred in the amount of 68.1 kg ha−1 on the soil type loess with grassland use and a fertilization treatment of 150%. The N leaching load in grassland use corresponded to the applied mineral N fertilization for the four different soil types studied. Accordingly, the lowest N leaching losses occurred at the 50% fertilization treatment. On the other hand, the fertilization treatment of 150% showed the highest N loads. The differences between the N-loads of the fertilization treatments, 50% and 150%, were highly significant for all soil types. There were also significant differences between the 100% and 150% fertilization treatment for soil type loess (Figure 3).
In the case of arable land use, the lowest median annual N leaching loss was measured at 12.1 kg ha−1 with a fertilization treatment of 50% on the soil type loess. The fertilization treatment of 150% on sand soil type resulted in the highest N load of 36.6 kg ha−1 with arable land use. Leaching corresponds to the application of mineral fertilization for soil types: loamy sand, sand, and loess. Accordingly, the lowest N leaching was recorded here for the 50% fertilization treatment and the highest for the 150% fertilization treatment. In the case of soil type loess, the fertilization treatment of 50% showed the lowest N-load with 12.1 kg ha−1. In the case of arable land use, a significant differentiation of the N-load between the three investigated fertilization treatments comparable to grassland use could not be proven for the studied soil types (Figure 3).
3.4 Dry matter yield
In the result of the Kruskal–Wallace tests of the dry matter (DM) yields (sum of main crop and catch crop), significant effects of fertilization treatment and land use as grassland or arable land could be proven. In particular, the median values of the DM yields for the soil types loam differed significantly from sand. Based on the 38-year study results, a significant influence of the mineral fertilization treatment could be demonstrated for both types of use, grassland and arable land, with the highest yields in the 150% fertilizer treatments (Supplementary Table S4).
For grassland, there were some highly significant differences between fertilizer treatments on all four soil types, with the lowest DM yield for each of the lysimeter at 50% fertilizer treatment and the highest DM yield at 150% fertilizer treatment. Thus, the differentiation of mean DM yields among the fertilizer levels studied aligned with expectations.
Regarding arable land use, the DM yields significantly differed between the mineral fertilization levels 50% and 150% for the soil types: sand, sandy loam, loam, and loess. Significant differences between the 100% and 150% fertilization treatments were also found for the Loe soil type (Figure 4).
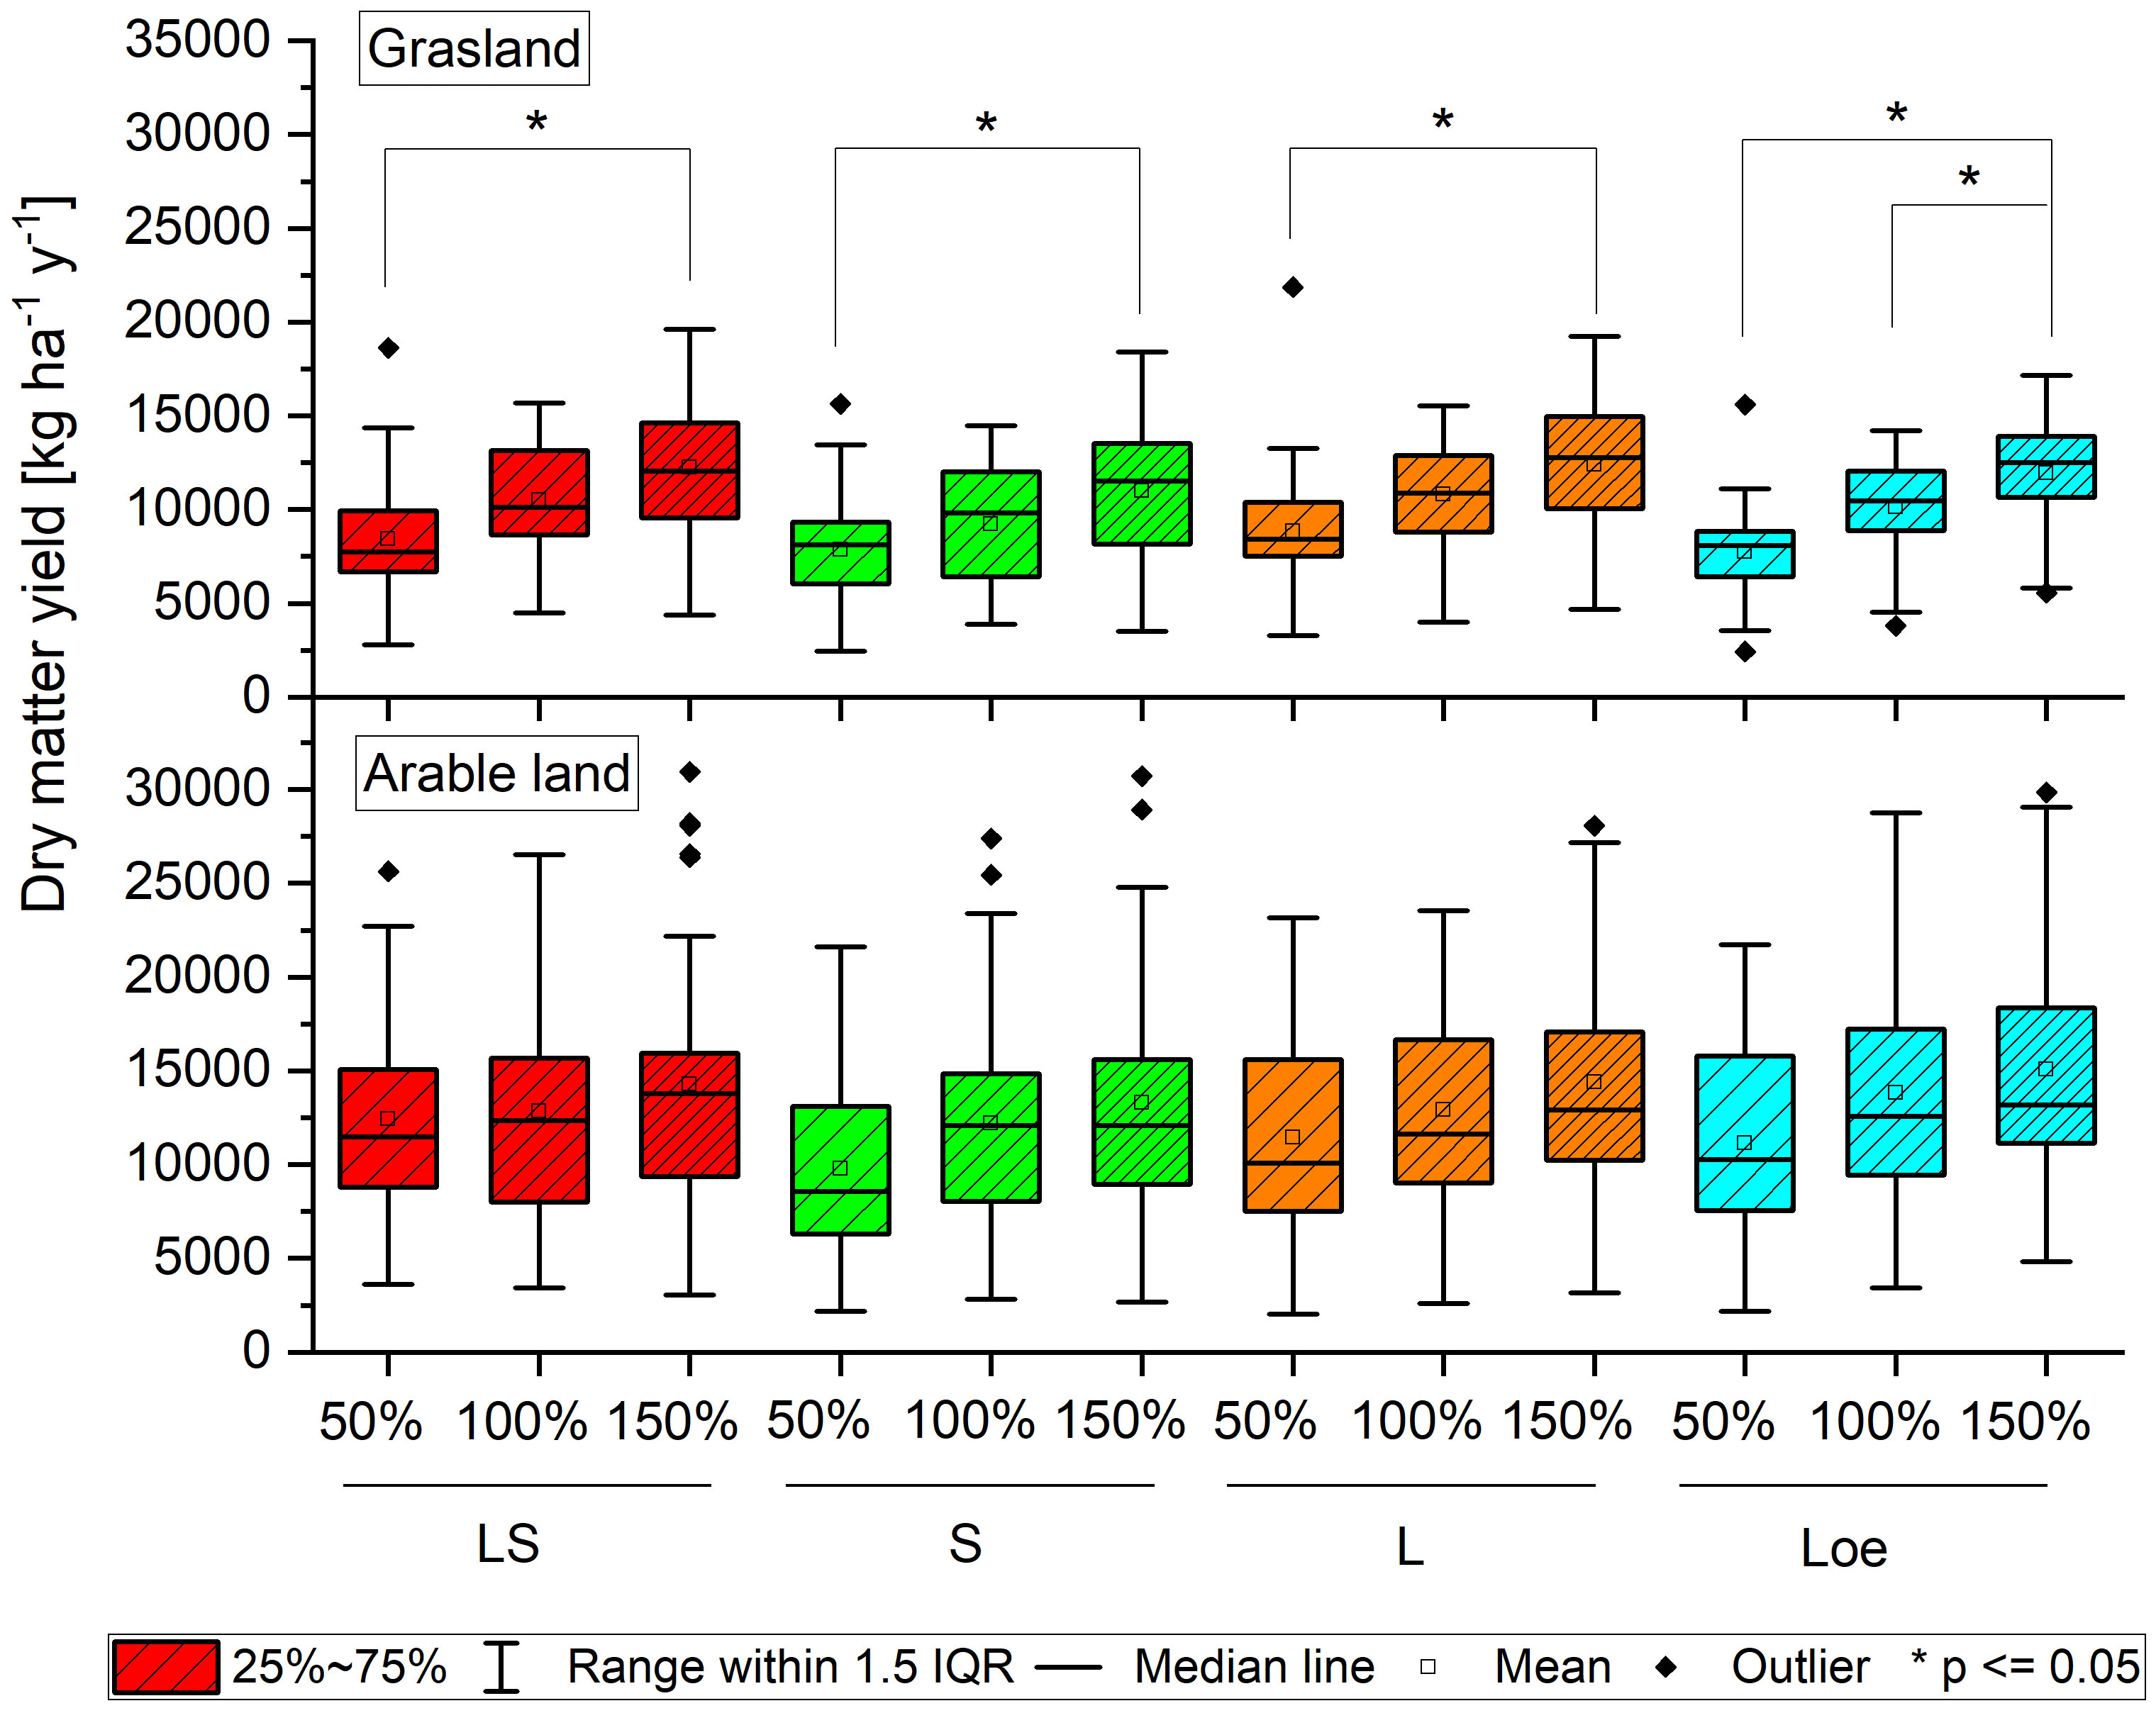
Figure 4 Boxplot of dry matter yields measured in lysimeters filled with the soil types loamy sand, sand, loam, and loess under three fertilization treatments (50%, 100%, and 150%) for arable and grassland management (asterisk with bracket as significance mark) for the 38 years observation period 1985–2023.
3.5 Nitrogen uptake
Long-term mean N uptake values significantly differed concerning mineral fertilizer treatment and land use. In contrast, soil type had no significant effect on N uptake (Supplementary Table S5 and Figure 5). The highest N uptakes were observed in each of the lysimeters with the highest fertilizer treatment of 150%. The N uptake was lowest in the 50% fertilization treatment (Supplementary Table S5). For grassland use, long-term mean N uptake values significantly differed among the three fertilization treatments studied, showing a trend similar to DM yields. For arable land use, N uptake showed a comparable tendency. However, significant differences between the 50% and 150% fertilization treatments were only found for the sand soil type (Figure 5).
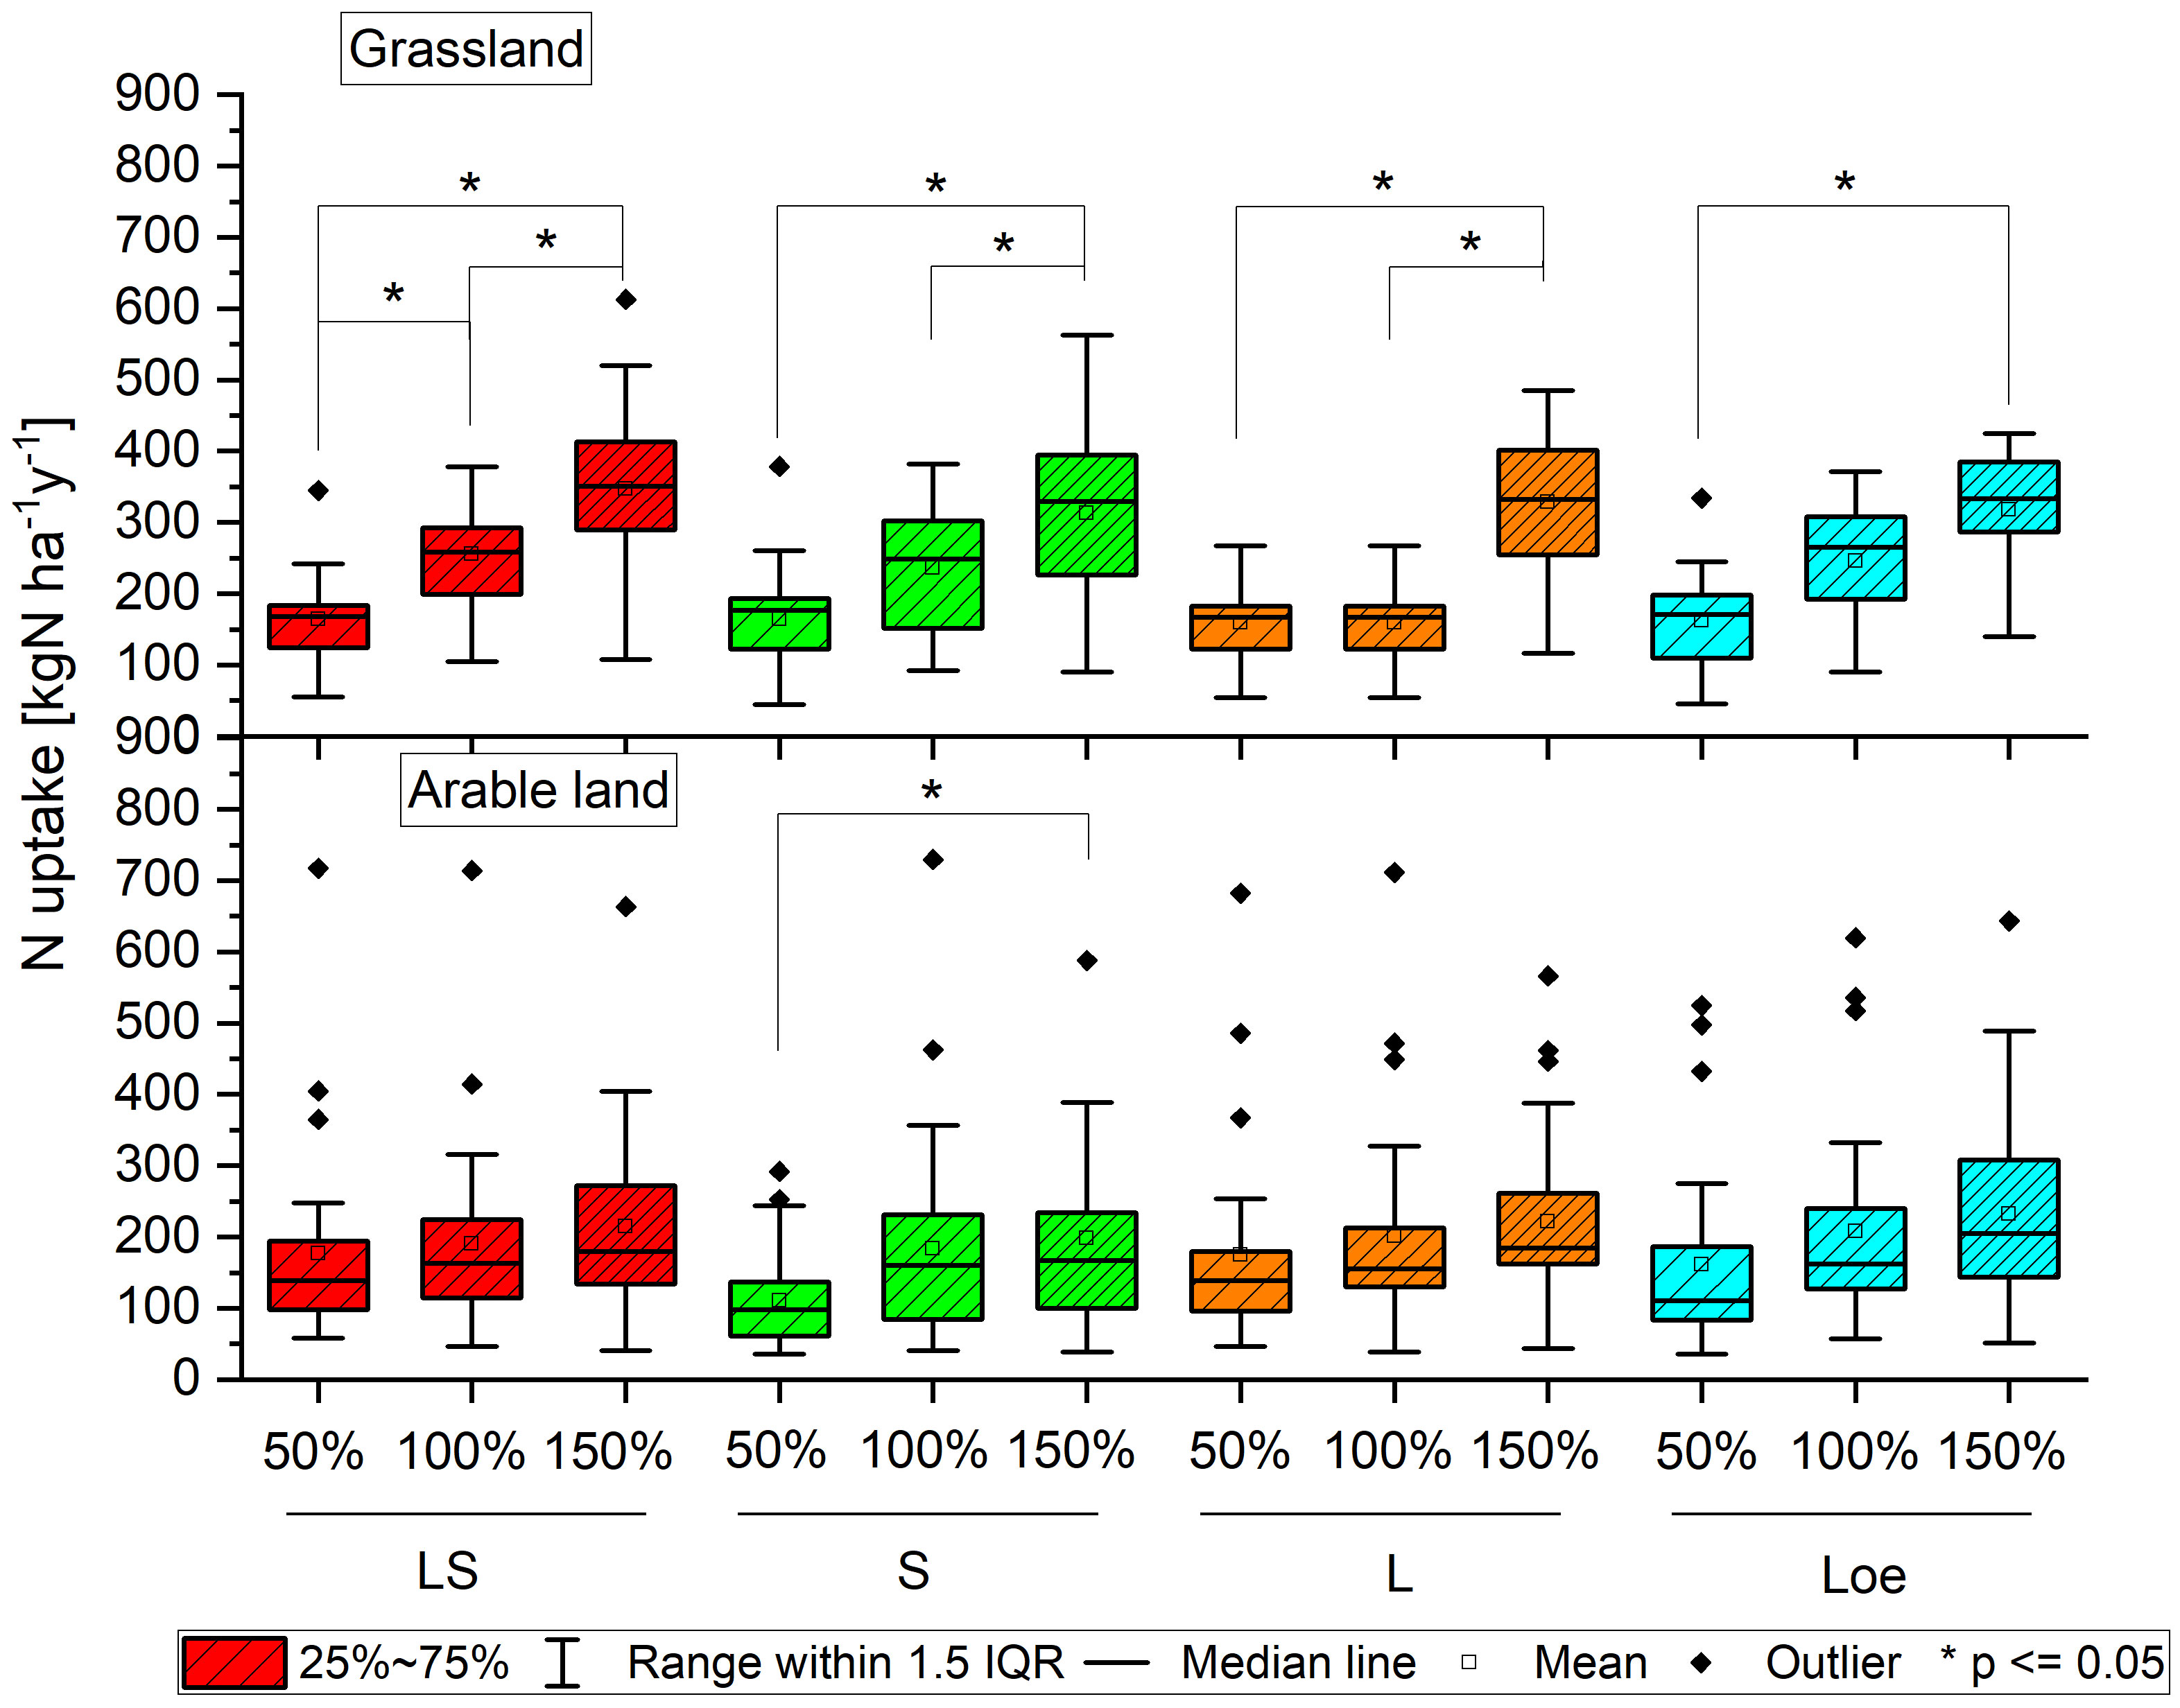
Figure 5 Boxplot of N uptake measured in lysimeters filled with the soil types loamy sand, sand, loam, and loess under three fertilization treatments (50%, 100%, and 150%) for arable and grassland management (asterisk with bracket as significance mark) for the 38 years observation period 1985–2023.
3.6 N-budget
For N balancing, the mean atmospheric (wet and dry) deposition over the experimental period of 8.3 kg ha−1 was considered. The crop rotation of the arable land lysimeters included oats with a clover-grass undersow and, in the following year, clover-grass as the main crop. Own investigations on leguminous N-fixation were not available. The literature describes an annual legume N-fixation of about 400 kg ha−1 (73). In the collection of fertilizer law guidelines of the German federal state of Saxony-Anhalt, a symbiotic N fixation of 230 kg ha−1 was set as binding for the cultivation of clover grass (74). This amount of nitrogen had to be considered in the N balance. Clover grass was cultivated in a rotation of 4 years. Thus, an annual balance input of 57.5 kg N ha−1 was included in the yearly balancing. The balance of N inputs (fertilization, legume N-Fixation, and atmospheric input) and N outputs (plant uptake and leaching) showed a negative N balance in all soil types in the 50% fertilization treatment at grassland use. In contrast, the 100% and 150% fertilization treatments showed balance surpluses of up to 113.1 kg ha−1 for all soil types (fertilization treatment 100% for the loam soil type). Thus, balance surpluses of 21.4 kg ha−1 and 64.4 kg ha−1 for soil type loamy sand were determined for the 100% and 150% fertilization treatments, respectively. For sandy soil, N balance surpluses of 20.5 and 49.4 kg ha−1 and 113.1 and 71.0 kg ha−1 for the loamy soil were calculated. For soil type loess, the balance surplus of the fertilization treatment 150% was 26.6 kg ha−1.
For arable land use, the N budget was negative for the fertilization treatments 50% and 100% for all soil types, with the lowest values occurring in the 50% fertilization treatments with values of −41.1 and −37.1 kg ha−1 for the loamy sand and loam soil types. In contrast, the highest budgets of 8.2 and 14.4 kg ha−1 were calculated for the soil type’s sand and loam with the fertilization treatment of 150% (Supplementary Table S6 and Figure 6).
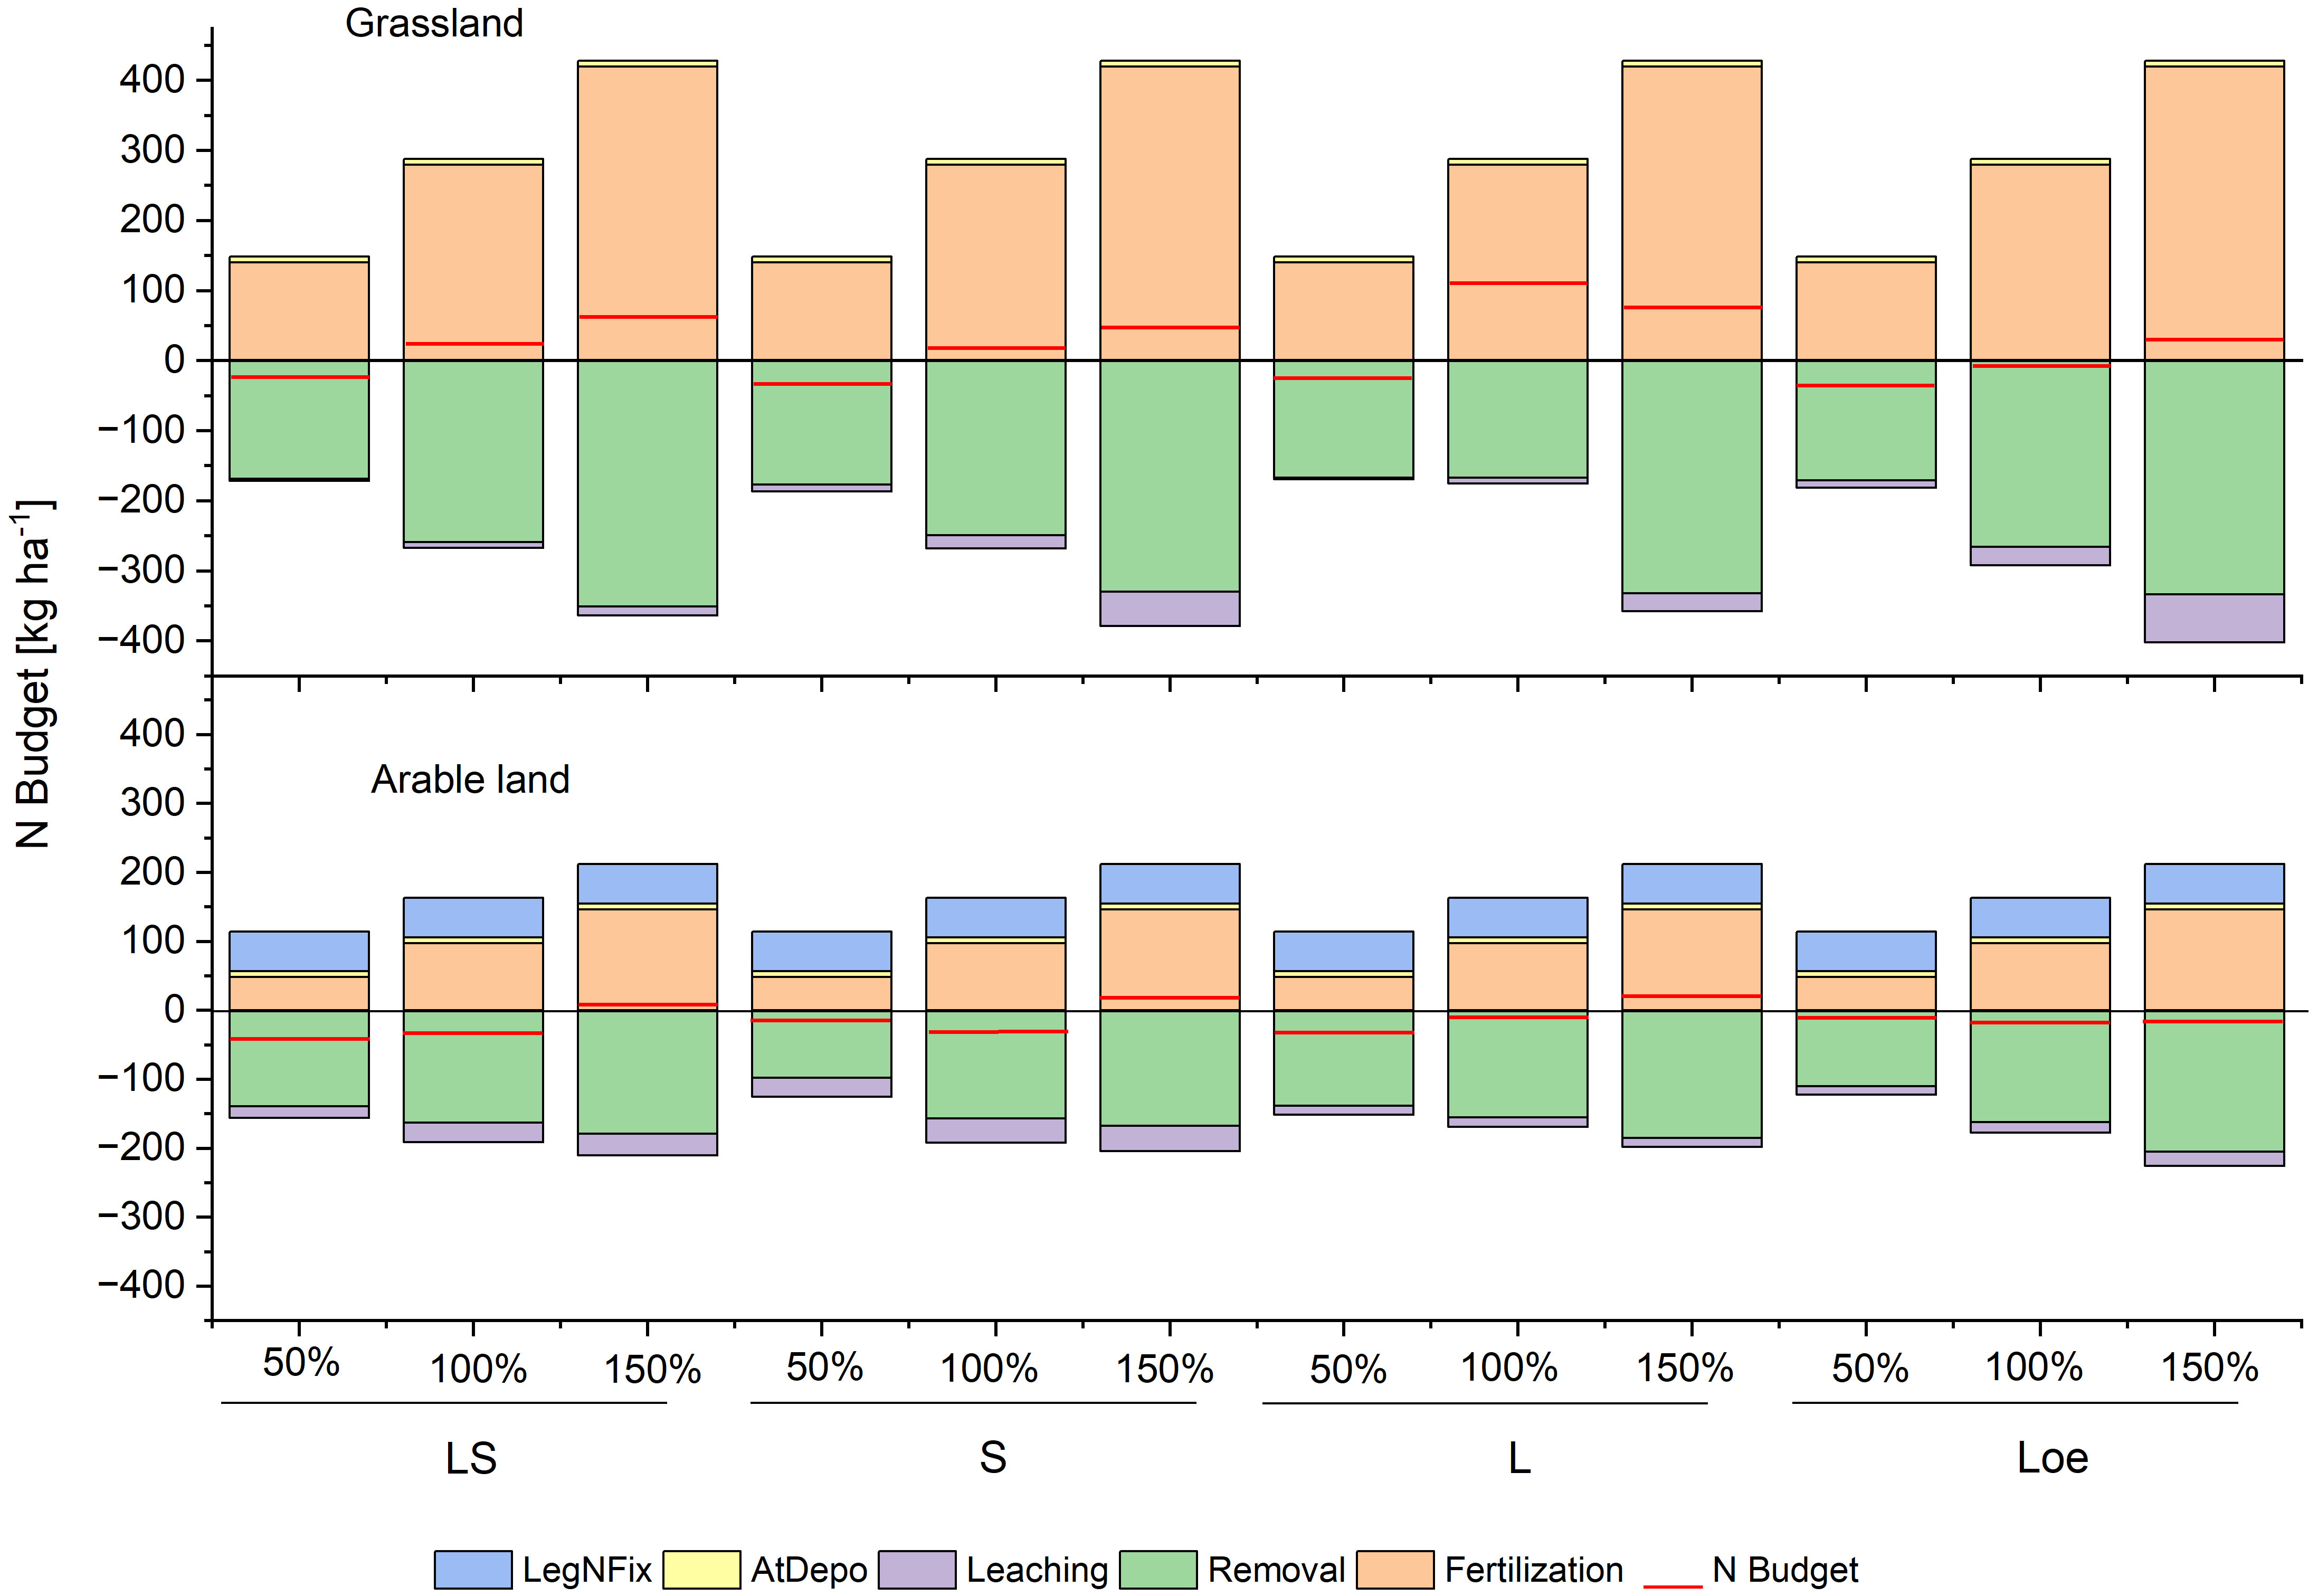
Figure 6 Plot of N budget calculated for the lysimeters filled with the soil types loamy sand, sand, loam, and loess under three fertilization treatments (50%, 100%, and 150%) for arable and grassland management for the 38 years observation period 1985–2023.
4 Discussion
4.1 Seepage
The observed variation in seepage can be attributed to the different soil physical properties of the lysimeter soil types used (75), and to the improved water utilization of fertilized plant stands according to demand (76). The increased seepage under grassland use (increased by approximately 66.4 mm) is seemingly in contrast to other studies (77, 78). On the one hand, it may result from the high supplemental water supply (until 2004), typical for intensively used grass stands under the former management conditions. On the other hand, higher seepage could result from the lack of soil tillage at the grassland management, which is known to favor the formation of macropores and thus might cause preferential flow with higher seepage amounts (48, 50, 51). In addition, a reduction in infiltration was seen as a result of the cultivation of catch crops, which was integrated into the crop rotation of the lysimeters cultivated as arable land. When catch crops are grown, leachate significantly reduces (79–81).
4.2 N leaching and N concentrations of seepage
Despite increased seepage, the N leaching determined for grassland use was significantly lower than for arable land use except for the 150% fertilization treatment. These results align with other studies reporting a high N efficiency and, consequently, very low NO3− leaching of grasslands managed by cutting at moderate N fertilization (44, 82). It is known from the literature that soils under permanent grassland contain more organic C and organic N than arable soils with solid coupling between the C and N cycles (43, 44, 83, 84). Therefore, converting arable land to grassland was assumed to be a solution for improving soil organic C contents and microbial C and N biomass and associated enzyme activities of degraded arable land (84). Otherwise, there is vast evidence that NO3− leaching from grasslands also can be significant, in particular, at intensive grassland management with high N fertilization rates and combined with the more frequent occurrence of drought events due to climate change, which might increase NO3− leaching risk (85, 86). Apostolakis et al. (87) found that grassland management intensity was positively associated with NO3− leaching risk. In contrast, the intensification effect might be directly by changing nutrient cycling or indirectly by changing plant communities and altering interactions between soils, plants, and soil microorganisms (88, 89). In particular, N fertilization is known to increase plant biomass productivity and nutrient concentrations of plants, resulting in a reduction of the C:N ratio of grassland soils with faster mineralization as well as a reduction of plant diversity (90–92). Other studies showed that high N-surplus fertilizer rates could increase NO3 leaching from grassland soils (46, 47). We also observed a relatively high N leaching of all soil types with grassland use in the fertilization treatment of 150%, which was increased by more than 100% compared to the reference fertilization treatment (100%). In the grassland lysimeters with a fertilizer treatment of 150%, the N loads with median values of 12.9 kg ha−1 (loamy sand), 49.4 kg ha−1 (sand), 25.0 kg ha−1 (loam), and 68.1 kg ha−1 (loess) were higher than in the arable lysimeters with 30.7 kg ha−1 (loamy sand), 36.6 kg ha−1 (sand), 13.0 kg N ha−1 (loam), and 21.0 kg ha−1 (loess), except for the loamy sand soil type. However, differences were only significant for the loamy soil. N loads of grassland lysimeters at the 150% fertilizer treatment were higher than those reported in the literature (44, 87, 93) and presumably caused by the intensive management (fertilization and irrigation).
The determined median annual N leaching showed a level of 2.5 to 68.1 kg ha−1 depending on the soil type, fertilization treatment, and land use corresponded to the level described in the literature (94–96). The lowest leaching losses were measured with 50% fertilization in grassland use. Compared to the 100% fertilizer treatment, the N loads were only 35.8% (loamy sand), 50.0% (sand), 30.6% (loam), and 39.2% (loess) of the loads measured with the 100% fertilization treatment. When averaging over all investigated soil types and fertilization treatments, the grassland or arable land use resulted in almost identical annual N leaching of 20.2 kg ha−1 (grassland) and 21.9 kg ha−1 (arable land). These minor differences in the mean N loads between both management systems were only caused by the high N leaching at the 150% fertilization treatment in the grassland lysimeters (Supplementary Table S3). In the other fertilizer treatments (50%, 100%), N leaching of grassland use was lower than arable land use except for the 100% treatment of loess soil. These results align with previous studies reporting reduced NO3− leaching of grassland soils (44, 82, 83).
The determined N leaching is consistent with the level of N leaching under arable land use published in the literature using lysimeter and field experiments (95, 97–102). The annual N leaching found in this experiment for the fertilization treatments 100% and 150% on soil types loamy sand and sand in arable land was slightly below the level of >50 kg N ha−1 given by Asmus (103) for sandy soils in the state of Brandenburg, Germany. Unexpectedly, increased N fertilization rates did not significantly increase N leaching in all soil types of arable land lysimeters as observed for grassland use (see Figure 3). Although the trend of decreasing N loads with a 50% reduction of N fertilization and increasing N leaching with increased N fertilization rates (150%) was observed for almost all soil types, no significant differences between the fertilization treatments could be proven. For grassland use, as expected, an increase of N leaching with increased N fertilization was observed, but the arable land lysimeters showed no significant reaction to increased N fertilization. For example, the loam soil had an equal level of N leaching at the fertilization treatments, 50% and 150% (13 kg ha−1). In contrast, the 50% and 100% fertilization levels showed slightly increased N leaching compared to the 150% treatment. These results contrast previous studies demonstrating a close relationship between amounts of N fertilizer and N leaching losses (104, 105). Earlier studies estimated that 19%–24% of the N applied was leached (104, 106). For our study, it can be assumed that soil- and management-related factors (soil type, texture, soil tillage, crop rotation, and others) mask the effect of increased N fertilization rates, as also shown by Dieser et al. (41). Different studies reported that the prehistory of cropping (carry-over effect) may affect soil N mineralization and, hence, NO3− leaching (21). The largest share of the excess fertilizer N remained in the soil in the organic N pool, and soil microbial biomass built up pools of degradable soil organic N that may subsequently mineralize (31, 32). The soil organic C management is crucial for maximizing the long-term benefit of crop fertilizer applications and minimizing NO3− leaching (35). Thus, management-related factors that favor mineralization processes (soil tillage, N-rich crop residues) may considerably affect NO3− leaching. In this context, the impact of soil tillage and crop residues on mineralization processes and, consequently, N losses might cover the effects of increased N fertilization in the arable lysimeters. These management-related factors are not as pronounced at grassland use.
We observed differences in N leaching between studied soil types at arable land use, with the highest N loads from the sand and loamy sand soils and significantly lower N loads from the loam and loess soils. Dieser et al. (41) also reported that soil type and texture are among the decisive factors for NO3− leaching potential, in addition to the main crop and precipitation in October. Above this, the management strategy in the arable land lysimeters with summer catch crops was very N efficiently, as shown by the high N uptake of excess fertilizer N and consequently low N balances (see Figure 6). It can be assumed that, due to the integration of summer catch crops in the cereal-fodder crop rotation, N surpluses especially in the 150% treatment were absorbed by the catch crops and converted into biomass. This could be one reason for the small and non-significant differences between the different fertilization treatments in arable lysimeters. Numerous studies identified the cultivation of catch crops as the most effective measure for reducing N leaching (100, 101, 107).
Nevertheless, the results presented here indicate an effect of a 50% reduction in mineral fertilization, which resulted in significantly reduced N leaching for grassland use. For arable land use, the trend of reduced N-leaching with a reduced N-fertilization of 50% (excluding soil type loam) was observed, with no significant differences between fertilization treatments. This statement contradicts the results of our first evaluation after 7 years of study (62, 108). Here, the lowest mean annual NO3− leaching of 6 kg N ha−1 was found on the loamy sand soil with grassland use and the highest of 24 kg N ha−1 on sand with arable land use. It was concluded that the fertilization had a noticeable influence on only seepage and DM yield. The more intensive vegetation growth due to higher mineral fertilization treatment also increased water demand. This became apparent from the significant reduction observed in seepage with increasing fertilization and the increased dry matter DM yield. However, the situation was reversed if the plants were sub-optimally fertilized: the plants were not able to convert sub-optimally applied fertilizers into biomass. Consequently, the leaching rates were increased because of enlarged seepage water volume. Therefore, the expected reduction in N loads with a 50% reduction in mineral fertilization could not be statistically proven in the studied application spectrum.
In the case of grassland use, the limit value of 50 mgNO3 L−1 (11) could be achieved in the fertilization treatment of 50% and 100% based on the long-term monthly median values of the N concentration for the soil types: loamy sand, sand, and loam. In contrast, the limit value was frequently exceeded in the 150% fertilization treatment of all soil types and the 100% treatment of the loess soil. The NO3− N concentrations determined in the lysimeter study correspond to the range of values that is also known from other studies at a comparable level of mineral fertilization and comparable seepage amounts from lysimeter studies (15–17, 19). A continuous exceedance of the EU drinking water limit was also found by Biernat et al. (109) by comparing organic and conventional land management systems. In contrast, even the low N intensity management systems led to increased NO3− concentrations in seepage water. Our lysimeter study showed that NO3− leaching at arable land use was affected by the amount of applied N fertilizer and soil mineralization, including all factors controlling mineralization processes (soil type, texture, crop rotation, soil tillage, and others). These results align with other studies that showed only a tiny contribution of applied fertilizer to N leaching (110). Accordingly, Kühling et al. (111) reported that significant N leaching from soil mineralization was also observed without N fertilization.
It was shown in our study that, even at a drastic reduction of N fertilization level by 50%, which exceeded the required reduction in the German Fertilizer Ordinance (112) of 20% markedly, no significant effect on NO3− concentration in seepage and N leaching amounts could be achieved for arable land use. Comparable results with a tiny contribution of a reduction in N fertilization levels below the level stated by the Fertilizer Ordinance to reducing N leaching was also documented by Kage et al. (113) for winter wheat and winter oilseed rape.
Our lysimeter trial showed that a reduction of N fertilizer as the only measure was insufficient to reduce NO3− leaching for arable land use. Thus, other strategies in addition to a reduction of N input are required. Several studies show that managing soil organic matter, including management-related factors controlling mineralization processes, could be critical in reducing NO3− leaching on arable land (35, 114). In this context, management measures such as the reduction of the intensity of soil tillage, crop rotations with the reduction of N-intensive crops (e.g., winter wheat), and reduction of crops leaving high soil mineral N in autumn (e.g., rape, maize) could be effective measures to reduce the risk of NO3− leaching (41). Above this, mineral and organic N fertilization affect the decomposability of the organic N pool and control the N release from mineralization processes. In this context, C:N ratio of organic fertilizers was assumed as a reliable predictor for native soil N mineralization (115–117). Masunga et al. (117) reported that organic fertilizers with lower C:N ratios stimulate more significant N mineralization and microbial biomass. In contrast, the meta-analysis of Liu et al. (118) suggested only a minor influence of C:N ratios of organic fertilizers on the direction of native N soil mineralization. Nevertheless, it is known from different authors that the application of organic fertilizers with high C:N ratios might significantly increase soil organic C contents and, thus, contribute to the effective retention of excess fertilizer-derived N in the organic N pool in the long term (119, 120). In general, the avoidance of N inputs beyond the economic optimum, a high-use efficiency of N fertilization with a better synchronization of N inputs and crop demands, N-efficient application technologies, and N stabilization of fertilizers by the use of nitrification inhibitors are essential to sustain high crop productivity with low N losses (26, 31).
Because the fertilizer-derived N retained in the organic pool can be mineralized during the whole year, it is critical for reducing N losses that the soil is also covered with plants in autumn (and winter) and vegetation-free fallow should be avoided in general (31). Furthermore, catch crops are known to be an effective measure of accumulating excess N and might contribute significantly to reducing the risk of NO3− leaching (31, 100, 121, 122). Nevertheless, it must be considered that the mitigation potential of catch crops depends on a successful stand establishment, which underlies a sizeable yearly variation (123). In this context, the optimal sowing date is decisive for sufficient biomass development for efficient uptake of excess N before the beginning of the leaching period (81). It was assumed that the integration of legumes in the crop rotation of the arable lysimeters in our study also might impact NO3− leaching by supplying N-rich crop residues favoring mineralization processes in times without plant demand. It is known from other studies that grass-clover leys might have a high risk of NO3− leaching due to a high N supply following mineralization of the crop residues during a low N demand in the subsequent crop in autumn (124–126).
4.3 Dry matter yields, N uptake, and N balances
For grassland use, DM yields have differed significantly between the fertilization treatments, with the lowest yields in the 50% fertilization treatment and the highest in the 150% fertilization treatment. A reduction of N fertilization by 50% resulted in a decrease in yields of maximal 23.6% in the loamy sand (see Supplementary Table S4). In contrast, the sand showed a minor reduction of yields of 17.0% in the 50% fertilization treatment compared to the reference level (100%). An increase of N fertilization by 50% (150% fertilization treatment) increased the DM yields by 17.4% (sand and loam) to 19.5% (loess) compared to the reference (100%). Thus, compared to the steep increase of N leaching losses in the 150% fertilization treatment, the N fertilization above the reference treatment only showed little effect on DM yields in the grassland lysimeters.
The arable lysimeters showed no significant differences between the fertilization treatments for the loamy sand, sand, loam, and loess soil (see Figure 4). The reduction of N fertilization by 50% in the lysimeters used as arable land did not lead to a significant decrease in DM yields. For the sand soil, reduced N fertilization (50% treatment) reduced DM yields by 29.0%, whereas no significant decrease in N leaching could be proved. An increase of N fertilization by 50% compared to the reference level (100% treatment) increased DM yields by 11.6%, leading to a significant decrease in N leaching. These results are in contrast to other studies reporting a close relationship between N leaching losses and N fertilization rates (5, 105, 106). Kühling et al. (111) observed that, for a karst aquifer with loamy sand in northwestern Germany, high precipitation amounts decreased N leaching losses by 10%–20%, reduced N fertilization rates, and no significant reductions in crop yields.
Several studies described the relationship between N leaching and applied N fertilizer rates by linear, exponential, or quadratic models (5, 22, 104–106, 127). Some authors reported considerable yield reductions and only small reductions of N leaching below the economic optimal N rate, whereas leaching losses increased exponentially above the economic optimum (82, 128, 129). The economic optimal N rate is calculated based on N incrementality testing (113). In our lysimeter study, an economic optimal N rate was not determined to define levels of different fertilization treatments. However, it can be assumed that the economic optimal N rate was not exceeded excessively in our study for arable land lysimeters because the N balances of the 150% fertilizer treatment were relatively low with 2.1 kg ha−1, 8.3 kg ha−1, 14.4 kg ha−1, and −13.6 kg ha−1 for the soil types loamy sand, sand, loam, and loess, respectively (see Figure 6), indicating a high N efficiency by uptake of excessive fertilizer N by main crops and catch crops. Overall, it must be noted that the calculation of the N budgets was fraught with uncertainties. On the one hand, the symbiotic N fixation for arable land use was estimated at 230 kg ha−1 based on the guideline values for the cultivation of clover grass valid in the follow-up documents of the German Fertilizer Ordinance (74). Another reference gives this as 400 kg ha−1 under comparable conditions (73). On the other hand, an atmospheric N deposition of 10 kg ha−1 to 41 kg ha−1 was determined in container tests using the 15N dilution method (130–132).
In contrast to the arable lysimeters, intensive grassland use with irrigation and high N fertilization (150%) can be assumed to have a significantly lower N efficiency compared to arable land use in this study, which was made clear by the high N balance of up to 113.1 kg ha−1 in the grassland lysimeters (see Figure 6). This could be the reason for the substantial increase in N leaching at the 150% fertilizer treatment in the lysimeters managed as grassland, which is consistent with the strong N leaching at N application above the economically optimal rate described in the literature (82, 128, 129).
5 Conclusions
The present long-term study showed that increased N fertilization rates significantly enhanced N leaching losses and NO3− concentrations in seepage for grassland use. Thus, a reduction of N fertilization levels by 50% was appropriate to reduce NO3− leaching and to comply with the current limit value for NO3− in groundwater of 50 mg NO3− L−1 (11.3 mg N L−1) at simultaneously reduced yields by maximal 29%. In contrast, no significant effects of reduced N fertilization levels on N leaching were proved for arable land use, even at a reduction of N fertilization by 50%. This is because excess nitrogen from fertilizers is retained in the organic nitrogen pool and later released through mineralization processes. For agriculture, this suggests that reducing N fertilization alone is not sufficient to reduce NO3− leaching and comply with the European limit value for NO3−. Rather, the management of organic carbon in the soil appears to be decisive for N losses. Consequently, for arable land use, in addition to avoiding N fertilization levels beyond the economic N optimum, management measures should be targeted to reduce N losses of mineralization processes in times with small plant demand. Other efficient measures to reduce N leaching are the N conservation of excess N in the biomass of catch crops and the synchronization of crop rotations without vegetation-free fallows in N leaching sensible times (autumn, winter). In addition, appropriate management measures to reduce N leaching can be proposed, such as reduced tillage, increasing the N efficiency of fertilization (technical and chemical solutions), crop rotations avoiding crops known to leave high mineral N levels in autumn, such as crops with high N requirements, crops with a need for intensive tillage during harvest, and crops with a high proportion of N-rich crop residues after harvest. Furthermore, we assume that management measures contributing to an increase in the soil’s organic carbon (SOC) content are essential to keeping the excess nitrogen in the SOC pool long term. In this context, the integration of SOC-increasing crops (e.g., legumes), organic fertilization (manure with higher C:N ratio), and retention of agricultural by-products (straw, sugar beet leaves) on the field could reduce N leaching.
In addition to taking into account the specific site conditions, the design of the crop rotation must be an integral part of strategies to minimize N losses. The reduction of mineral N fertilizer use should be combined with crop cultivation and crop rotations adapted to the specific site conditions. Within the present lysimeter study scope, it was impossible to investigate the processes relevant to the dynamics of N compounds in the soil. The contribution of essential processes, such as symbiotic N fixation by legumes, to the N budget, could only be estimated and should be investigated in further studies. In addition, the effects of the quantity and quality of SOC on the contribution of mineralization processes on the one hand and the retention of excess N on the other hand should be investigated in more detail. Therefore, process studies are essential for a comprehensive understanding of the complex soil processes that can lead to the retention and release of N compounds.
Data availability statement
The original contributions presented in the study are included in the article/Supplementary Material. Further inquiries can be directed to the corresponding author.
Author contributions
HR: Conceptualization, Data curation, Software, Writing – original draft, Writing – review & editing. NT: Conceptualization, Writing – original draft, Writing – review & editing. RM: Supervision, Writing – review & editing.
Funding
The author(s) declare financial support was received for the research, authorship, and/or publication of this article. The Helmholtz Centre for Environmental Research (UFZ) financed the study – UFZ budget funds.
Acknowledgments
Special thanks go to the staff of the Falkenberg lysimeter station for their conscientious and dedicated supervision of the lysimeter experiment.
Conflict of interest
The authors declare that the research was conducted in the absence of any commercial or financial relationships that could be construed as a potential conflict of interest.
Publisher’s note
All claims expressed in this article are solely those of the authors and do not necessarily represent those of their affiliated organizations, or those of the publisher, the editors and the reviewers. Any product that may be evaluated in this article, or claim that may be made by its manufacturer, is not guaranteed or endorsed by the publisher.
Supplementary material
The Supplementary Material for this article can be found online at: https://www.frontiersin.org/articles/10.3389/fsoil.2024.1345073/full#supplementary-material
References
1. Khan MN, Mobin M, Abbas ZK, Alamri SA. Fertilizers and their contaminants in soils, surface and groundwater. In: Dellasala DA, Goldstein MI, editors. The Encyclopedia of the Anthropocene. Elsevier, Oxford (2018). p. 225–40.
2. Srivastav AL. Chapter 6 - Chemical fertilizers and pesticides: role in groundwater contamination. In: Prasad MNV, editor. Agrochemicals Detection, Treatment and Remediation. Oxford: Butterworth-Heinemann (2020). p. 143–59. doi: 10.1016/B978-0-08-103017-2.00006-4
3. Akhtar N, Ishak MIS, Bhawani SA, Umar K. Various natural and anthropogenic factors responsible for water quality degradation: A review. Water. (2021) 13:2660. doi: 10.3390/w13192660
4. van Grinsven HJM, Ebanyat P, Glendining M, Gu B, Hijbeek R, Lam SK, et al. Establishing long-term nitrogen response of global cereals to assess sustainable fertilizer rates. Nat Food. (2022) 3:122–32. doi: 10.1038/s43016-021-00447-x
5. Wang Y, Ying H, Yin Y, Zheng H, Cui Z. Estimating soil nitrate leaching of nitrogen fertilizer from global meta-analysis. Sci Total Environ. (2019) 657:96–102. doi: 10.1016/j.scitotenv.2018.12.029
6. Xin J, Liu Y, Chen F, Duan Y, Wei G, Zheng X, et al. The missing nitrogen pieces: A critical review on the distribution, transformation, and budget of nitrogen in the vadose zone-groundwater system. Water Res. (2019) 165:114977. doi: 10.1016/j.watres.2019.114977
7. Anas M, Liao F, Verma KK, Sarwar MA, Mahmood A, Chen ZL, et al. Fate of nitrogen in agriculture and environment: agronomic, eco-physiological and molecular approaches to improve nitrogen use efficiency. Biol Res. (2020) 53:47. doi: 10.1186/s40659-020-00312-4
8. Cai H, Shen C, Xu H, Qian H, Pei S, Cai P, et al. Seasonal variability, predictive modeling and health risks of N-nitrosamines in drinking water of Shanghai. Sci Total Environ. (2023) 857:159530. doi: 10.1016/j.scitotenv.2022.159530
9. Schullehner J, Hansen B, Thygesen M, Pedersen C, Sigsgaard T. Nitrate in drinking water and colorectal cancer risk: A nationwide population-based cohort study. Int J Cancer. (2018) 1431:73–9. doi: 10.1002/ijc.31306
10. EEC. EEC Directive 2000/60/EC of the European Parliament and of the Council establishing a framework for the Community action in the field of water policy. Off J Eur Communities. (2000) L327/1:1–73. Available at: http://data.europa.eu/eli/dir/2000/60/oj.
11. EEC. EEC Directive 2006/118/EC of the European Parliament and of the Council of 12 December 2006 on the protection of groundwater against pollution and deterioration. Off J Eur Union L. (2006) 372/19:19–31. Available at: http://data.europa.eu/eli/dir/2006/118/oj.
12. de Vries W, Schulte-Uebbing L, Kros H, Voogd JC, Louwagie G. Spatially explicit boundaries for agricultural nitrogen inputs in the European Union to meet air and water quality targets. Sci Total Environ. (2021) 786:147283. doi: 10.1016/j.scitotenv.2021.147283
13. Schindler U, Muller L, Dannowski R, Barkusky D, Francis G. Long-term measurements to quantify the impact of arable management practices on deep seepage and nitrate leaching. Long-Term Ecol Research: Between Theory Appl. (2010), 243–52. doi: 10.1007/978-90-481-8782-9_17
14. van der Laan M, Stirzaker RJ, Annandale JG, Bristow KL, Du Preez CC. Monitoring and modelling draining and resident soil water nitrate concentrations to estimate leaching losses. Agric Water Manage. (2010) 97:1779–86. doi: 10.1016/j.agwat.2010.06.012
15. Zhao CS, Hu CX, Huang W, Sun XC, Tan QL, Di HJ. A lysimeter study of nitrate leaching and optimum nitrogen application rates for intensively irrigated vegetable production systems in Central China. J Soils Sediments. (2010) 10:9–17. doi: 10.1007/s11368-009-0063-3
16. Min J, Zhang HL, Shi WM. Optimizing nitrogen input to reduce nitrate leaching loss in greenhouse vegetable production. Agric Water Manage. (2012) 111:53–9. doi: 10.1016/j.agwat.2012.05.003
17. Perego A, Basile A, Bonfante A, De Mascellis R, Terribile F, Brenna S, et al. Nitrate leaching under maize cropping systems in Po Valley (Italy). Agric Ecosyst Environ. (2012) 147:57–65. doi: 10.1016/j.agee.2011.06.014
18. Arauzo M, Valladolid M. Drainage and N-leaching in alluvial soils under agricultural land uses: Implications for the implementation of the EU Nitrates Directive. Agric Ecosyst Environ. (2013) 179:94–107. doi: 10.1016/j.agee.2013.07.013
19. Jurišić A, Zgorelec Ž., Šestak I, M. M, Mikoč V. Nitrate-nitrogen content in soil and lysimeter water under different nitrogen fertilization levels in crop production. Agriculturae Conspectus Scientificus. (2014) 79:45–50. Available at: https://hrcak.srce.hr/120755.
20. He W, Yang JY, Zhou W, Drury CF, Yang XM, Reynolds WD, et al. Sensitivity analysis of crop yields, soil water contents and nitrogen leaching to precipitation, management practices and soil hydraulic properties in semi-arid and humid regions of Canada using the DSSAT model. Nutrient Cycling Agroecosystems. (2016) 106:201–15. doi: 10.1007/s10705-016-9800-3
21. Vogeler I, Hansen EM, Nielsen S, Labouriau R, Cichota R, Olesen JE, et al. Nitrate leaching from suction cup data: Influence of method of drainage calculation and concentration interpolation. J Environ Qual. (2020) 49:440–9. doi: 10.1002/jeq2.20020
22. Zhao Q, Cao W, Chen X, Stomph TJ, Zou C. Global analysis of nitrogen fertilization effects on grain zinc and iron of major cereal crops. Global Food Secur. (2022) 33:100631. doi: 10.1016/j.gfs.2022.100631
23. Fontaine D, Rasmussen J, Eriksen J. Marginal increase in nitrate leaching under grass–clover leys by slurry and mineral fertilizer. Nutrient Cycling Agroecosystems. (2023) 128:1–12. doi: 10.1007/s10705-023-10327-4
24. Andraski TW, Bundy LG, Brye KR. Crop management and corn nitrogen rate effects on nitrate leaching. J Environ Qual. (2000) 29:1095–103. doi: 10.2134/jeq2000.00472425002900040009x
25. Zhao J, Ni T, Li J, Lu Q, Fang Z, Huang Q, et al. Effects of organic–inorganic compound fertilizer with reduced chemical fertilizer application on crop yields, soil biological activity and bacterial community structure in a rice–wheat cropping system. Appl Soil Ecol. (2016) 99:1–12. doi: 10.1016/j.apsoil.2015.11.006
26. Kühling I, Beiküfner M, Vergara M, Trautz D. Effects of adapted N-fertilisation strategies on nitrate leaching and yield performance of arable crops in North-Western Germany. Agronomy. (2020) 11:64. doi: 10.3390/agronomy11010064
27. Glendining M, Dailey A, Williams AG, Van Evert F, Goulding K, Whitmore A. Is it possible to increase the sustainability of arable and ruminant agriculture by reducing inputs? Agric Syst. (2009) 99:117–25. doi: 10.1016/j.agsy.2008.11.001
28. Jayasundara S, Wagner-Riddle C, Parkin G, Lauzon J, Fan MZ. Transformations and losses of swine manure 15N as affected by application timing at two contrasting sites. Can J Soil Sci. (2010) 90:55–73. doi: 10.4141/CJSS08085
29. Frick H, Oberson A, Frossard E, Bünemann EK. Leached nitrate under fertilised loamy soil originates mainly from mineralisation of soil organic N. Agriculture Ecosyst Environ. (2022) 338:108093. doi: 10.1016/j.agee.2022.108093
30. Hart P, Powlson D, Poulton P, Johnston A, Jenkinson D. The availability of the nitrogen in the crop residues of winter wheat to subsequent crops. J Agric Sci. (1993) 121:355–62. doi: 10.1017/S0021859600085555
31. Sørensen P, Pedersen BN, Thomsen IK, Eriksen J, Christensen BT. Plant availability and leaching of 15N-labelled mineral fertilizer residues retained in agricultural soil for 25 years: A lysimeter study. J Plant Nutr Soil Sci. (2023) 186:441–50. doi: 10.1002/jpln.202200288
32. MacDonald JA, Dise NB, Matzner E, Armbruster M, Gundersen P, Forsius M. Nitrogen input together with ecosystem nitrogen enrichment predict nitrate leaching from European forests. Global Change Biol. (2002) 10:1354. doi: 10.1046/j.1365-2486.2002.00532.x
33. Russow R, Schmidt G, Faust H. Elemental analyzer-quadrupole MS coupling – A low cost equipment for the simultaneous determination of carbon/13C and nitrogen/15N in isotopically enriched soil and plant samples. Isotopenpraxis Environ Health Stud. (1995) 31:211–8. doi: 10.1080/10256019508234019
34. Werisch S, Burghardt D. Identification of mechanisms controlling nitrogen export from agricultural lysimeters. Proc 19th Gumpensteiner Lysimetertagung Raumber-Gumpenstein Raumberg Austria. (2021), 13–4.
35. Sebilo M, Mayer B, Nicolardot B, Pinay G, Mariotti A. Long-term fate of nitrate fertilizer in agricultural soils. Proc Natl Acad Sci. (2013) 110:18185–9. doi: 10.1073/pnas.1305372110
36. Rupp H, Tauchnitz N, Meissner R. The effects of soil drying out and rewetting on nitrogen and carbon leaching—Results of a long-term lysimeter experiment. Water. (2021) 13:2601. doi: 10.3390/w13182601
37. Hamid A, Bhat SU, Jehangir A. Local determinants influencing stream water quality. Appl Water Sci. (2019) 10:24. doi: 10.1007/s13201-019-1043-4
38. Ruffatti MD, Roth RT, Lacey CG, Armstrong SD. Impacts of nitrogen application timing and cover crop inclusion on subsurface drainage water quality. Agric Water Manage. (2019) 211:81–8. doi: 10.1016/j.agwat.2018.09.016
39. Muchovej RMC, Rechcigl JE. Impact of nitrogen fertilization of pastures and turfgrasses on water quality. In: Soil processes and water quality. Boca Raton: CRC Press (2020). p. 91–135. doi: 10.1201/9781003070184
40. Di HJ, Cameron KC. Inhibition of nitrification to mitigate nitrate leaching and nitrous oxide emissions in grazed grassland: a review. J Soils Sediments. (2016) 16:1401–20. doi: 10.1007/s11368-016-1403-8
41. Dieser M, Zieseniß S, Mielenz H, Müller K, Greef J-M, Stever-Schoo B. Nitrate leaching potential from arable land in Germany: Identifying most relevant factors. J Environ Manage. (2023) 345:118664. doi: 10.1016/j.jenvman.2023.118664
42. Kopáček J, Cosby BJ, Evans CD, Hruška J, Moldan F, Oulehle F, et al. Nitrogen, organic carbon and sulphur cycling in terrestrial ecosystems: linking nitrogen saturation to carbon limitation of soil microbial processes. Biogeochemistry. (2013) 115:33–51. doi: 10.1007/s10533-013-9892-7
43. Soussana J-F, Lemaire G. Coupling carbon and nitrogen cycles for environmentally sustainable intensification of grasslands and crop-livestock systems. Agriculture Ecosyst Environ. (2014) 190:9–17. doi: 10.1016/j.agee.2013.10.012
44. Kunrath TR, De Berranger C, Charrier X, Gastal F, De Faccio Carvalho PC, Lemaire G, et al. How much do sod-based rotations reduce nitrate leaching in a cereal cropping system? Agric Water Manage. (2015) 150:46–56. doi: 10.1016/j.agwat.2014.11.015
45. Ledgard S, Luo J, Sprosen M, Wyatt J, Balvert S, Lindsey S. Effects of the nitrification inhibitor dicyandiamide (DCD) on pasture production, nitrous oxide emissions and nitrate leaching in Waikato, New Zealand. New Z J Agric Res. (2014) 57:294–315. doi: 10.1080/00288233.2014.928642
46. Stauffer W, Spiess E. Einfluss unterschiedlicher Nutzung und Düngung auf Sickerwassermenge und Nitratauswaschung. In: 11. Gumpensteiner Lysimetertagung. Höhere Bundeslehr- und Forschungsanstalt für Landwirtschaft, A-8952 Irdning, Austria (2005). p. 213–6.
47. Diepolder M, Raschbacher S. Nitratbelastung unter Grünlandflächen – Versuchsergebnisse aus Bayern. Gülle11: Gülle und Gärrestdüngung auf Grünland. LAZBW Aulendorf. (2011) 190–194.
48. Weed D, Kanwar R. Nitrate and water present in and flowing from root-zone soil. Journal of Environmental Quality (1996) 25(4):709–719. doi: 10.2134/jeq1996.00472425002500040010x
49. Anken T, Weisskopf P, Zihlmann U, Forrer H, Jansa J, Perhacova K. Long-term tillage system effects under moist cool conditions in Switzerland. Soil Tillage Res. (2004) 78:171–83. doi: 10.1016/j.still.2004.02.005
50. Meisinger JJ, Palmer RE, Timlin DJ. Effects of tillage practices on drainage and nitrate leaching from winter wheat in the Northern Atlantic Coastal-Plain USA. Soil Tillage Res. (2015) 151:18–27. doi: 10.1016/j.still.2015.02.007
51. Daryanto S, Wang L, Jacinthe P-A. Global synthesis of drought effects on cereal, legume, tuber and root crops production: A review. Agric Water Manage. (2017) 179:18–33. doi: 10.1016/j.agwat.2016.04.022
52. Mkhabela M, Madani A, Gordon R, Burton D, Cudmore D, Elmi A, et al. Gaseous and leaching nitrogen losses from no-tillage and conventional tillage systems following surface application of cattle manure. Soil Tillage Res. (2008) 98:187–99. doi: 10.1016/j.still.2007.12.005
53. Syswerda S, Basso B, Hamilton S, Tausig J, Robertson G. Long-term nitrate loss along an agricultural intensity gradient in the Upper Midwest USA. Agriculture Ecosyst Environ. (2012) 149:10–9. doi: 10.1016/j.agee.2011.12.007
54. Spiess E, Humphrys C, Richner W, Schneider MK, Piepho H-P, Chervet A, et al. Does no-tillage decrease nitrate leaching compared to ploughing under a long-term crop rotation in Switzerland? Soil Tillage Res. (2020) 199:104590. doi: 10.1016/j.still.2020.104590
55. Goss M, Howse K, Lane P, Christian D, Harris G. Losses of nitrate-nitrogen in water draining from under autumn-sown crops established by direct drilling or mouldboard ploughing. J Soil Sci. (1993) 44:35–48. doi: 10.1111/j.1365-2389.1993.tb00432.x
56. Iragavarapu T, Randall G. Yield and nitrogen uptake of monocropped maize from a long-term tillage experiment on a poorly drained soil. Soil Tillage Res. (1995) 34:145–56. doi: 10.1016/0167-1987(95)00470-D
57. Shipitalo M, Dick W, Edwards W. Conservation tillage and macropore factors that affect water movement and the fate of chemicals. Soil tillage Res. (2000) 53:167–83. doi: 10.1016/S0167-1987(99)00104-X
58. Kühn N, Tovar C, Carretero J, Vandvik V, Enquist BJ, Willis KJ. Globally important plant functional traits for coping with climate change. Front Biogeography. (2021) 13. doi: 10.21425/F5FBG53774
59. Bergström L, Kirchmann H. Leaching and crop uptake of nitrogen and phosphorus from pig slurry as affected by different application rates. J Environ Qual. (2006) 35:1803–11. doi: 10.2134/jeq2006.0003
60. Askegaard M, Olesen JE, Kristensen K. Nitrate leaching from organic arable crop rotations: effects of location, manure and catch crop. Soil Use Manage. (2005) 21:181–8. doi: 10.1079/SUM2005315
61. Quemada M, Baranski M, Nobel-de Lange MNJ, Vallejo A, Cooper JM. Meta-analysis of strategies to control nitrate leaching in irrigated agricultural systems and their effects on crop yield. Agriculture Ecosyst Environ. (2013) 174:1–10. doi: 10.1016/j.agee.2013.04.018
62. Meissner R, Rupp H, Seeger J, Schonert P. Influence of mineral fertilizers and different soil types on nutrient leaching: Results of lysimeter studies in East Germany. Land Degradation Dev. (1995) 6:163–70. doi: 10.1002/ldr.3400060304
63. Meissner R, Rupp H, Seeger J, Ollesch G, Gee GW. A comparison of water flux measurements: passive wick-samplers versus drainage lysimeters. Eur J Soil Sci. (2010) 61:609–21. doi: 10.1111/j.1365-2389.2010.01255.x
64. Pütz T, Kiese R, Wollschläger U, Rupp H, Zacharias S, Priesack E, et al. TERENO-SOILCan: a lysimeter-network in Germany observing soil processes and plant diversity influenced by climate change. Environ Earth Sci. (2016) 75. doi: 10.1007/s12665-016-6031-5
65. Dietrich O, Fahle M, Kaiser T, Steidl J. A lysimeter study on the impacts of different groundwater control regimes on the soil water balance of a shallow water table site. Hydrologie und Wasserbewirtschaftung. (2019) 63:6–18. doi: 10.5675/HyWa_2019.1_1
66. Fu J, Gasche R, Wang N, Lu HY, Butterbach-Bahl K, Kiese R. Dissolved organic carbon leaching from montane grasslands under contrasting climate, soil and management conditions. Biogeochemistry. (2019) 145:47–61. doi: 10.1007/s10533-019-00589-y
67. Nolz R, Rodny M. Evaluation and validation of the ASCE standardized reference evapotranspiration equations for a subhumid site in northeastern Austria. J Hydrology Hydromechanics. (2019) 67:289–96. doi: 10.2478/johh-2019-0004
68. Groh J, Vanderborght J, Pütz T, Vogel H-J, Gründling R, Rupp H, et al. Responses of soil water storage and crop water use efficiency to changing climatic conditions: a lysimeter-based space-for-time approach. Hydrol. Earth Syst Sci. (2020) 24:1211–25. doi: 10.5194/hess-24-1211-2020
69. Lanthaler C, Fank J. Lysimeter stations and soil hydrology measuring sites in Europe - results of a 2004 survey. In: 11. Lysimetertagung, Lysimetrie im Netzwerk der Dynamik von Ökosystemen (2005). p. 19–24. am 5. und 6. April 2005 an der 2005.
70. Weihermüller L. Comparison of different soil water extraction systems for the Prognoses of solute transport at the field scale using numerical simulations, field and lysimeter experiments. Bonn: Uni Bonn (2005).
71. Bednorz D, Tauchnitz N, Christen O, Rupp H, Meissner R. Evaluating the transferability of measurements from simple constructed non weighable gravitation lysimeters to predict the water regime on field scale-a case study. J Plant Nutr Soil Sci. (2016) 179:809–20. doi: 10.1002/jpln.201600105
72. Killick R, Eckley I. changepoint: An R package for changepoint analysis. J Stat software. (2014) 58:1–19. doi: 10.18637/jss.v058.i03
73. Loges R. Leguminosen im Futterbau: aktuelle und zukünftige Bedeutung sowie Forschungsbedarf Einleitung und Problemstellung. Lfl. (2013), 9–20.
74. Schimpf H, Stolpe P, Schulze H. Richtwertsammlung Düngerecht. Gartenbau LFLU, editor. Bernburg: Landesanstalt für Landwirtschaft und Gartenbau Sachsen-Anhalt (2019).
75. Amelung W, Blume H-P, Fleige H, Horn R, Kandeler E, Kögel-Knabner I, et al. Scheffer/Schachtschabel Lehrbuch der Bodenkunde. Berlin: Springer-Verlag (2018). doi: 10.1007/978-3-662-55871-3
76. Raven JA, Handley LL, Wollenweber B. Plant nutrition and water use efficiency. Water Use efficiency Plant Biol. (2004) 15:171–97.
77. Ahrends B, Sutmöller J, Schmidt-Walter P, Meesenburg H. Beitrag von Waldflächen zur Sickerwasserbildung in Niedersachsen. Forum für Hydrologie und Wasserbewirtschaftung. (2018) 169-180. doi: 10.14617/for.hydrol.wasbew.39.18
79. Schindler U, Wegehenkel M, Müller L, Eulenstein F. Wirkung von Böden und Fruchtarten auf die Grundwasserneubildung pleistozäner Ackerstandorte Ostbrandenburgs. Arch Agron Soil Sci. (1997) 41:167–79. doi: 10.1080/03650349709365988
80. Hösch J, Dersch G. Einfluss von Bewirtschaftungsmassnahmen auf den zeitlichen Verlauf von N-Verlusten. In: 10. Gumpensteiner Lysimetertagung. Gumpenstein: Bundesanstalt für alpenländische Landwirtschaft (2003). p. 67–70.
81. Beisecker R, Seith T. Zwischenfruchtanbau zur Verringerung der Herbst-N min-Gehalte und Nitratauswaschung mit dem Sickerwasser. KW—Korresp. Wasserwirtsch. (2021) 14:29–35.
82. Simmelsgaard S. The effect of crop, N-level, soil type and drainage on nitrate leaching from Danish soil. Soil Use Manage. (1998) 14:30–6. doi: 10.1111/j.1475-2743.1998.tb00607.x
83. Ledgard S, Schils R, Eriksen J, Luo J. Environmental impacts of grazed clover/grass pastures. Irish J Agric Food Res. (2009) 48(2):209–26. Available at: https://www.jstor.org/stable/20720369.
84. Li W, Gu X, Du Y, Zheng X, Lu S, Cheng Z, et al. Optimizing nitrogen, phosphorus, and potassium fertilization regimes to improve maize productivity under double ridge-furrow planting with full film mulching. Agric Water Manage. (2023) 287:108439. doi: 10.1016/j.agwat.2023.108439
85. Cameron KC, Di HJ, Moir JL. Nitrogen losses from the soil/plant system: a review. Ann Appl Biol. (2013) 162:145–73. doi: 10.1111/aab.12014
86. Klaus VH, Friedritz L, Hamer U, Kleinebecker T. Drought boosts risk of nitrate leaching from grassland fertilisation. Sci Total Environ. (2020) 726:137877. doi: 10.1016/j.scitotenv.2020.137877
87. Apostolakis A, Schöning I, Klaus VH, Michalzik B, Bischoff W-A, Boeddinghaus RS, et al. Direct and plant community mediated effects of management intensity on annual nutrient leaching risk in temperate grasslands. Nutrient cycling agroecosystems. (2022) 123:83–104. doi: 10.1007/s10705-022-10209-1
88. de Vries FT, Bloem J, Quirk H, Stevens CJ, Bol R, Bardgett RD. Extensive management promotes plant and microbial nitrogen retention in temperate grassland. PLoS One. (2012) 7:e51201. doi: 10.1371/journal.pone.0051201
89. Klaus VH, Kleinebecker T, Busch V, Fischer M, Hölzel N, Nowak S, et al. Land use intensity, rather than plant species richness, affects the leaching risk of multiple nutrients from permanent grasslands. Global Change Biol. (2018) 24:2828–40. doi: 10.1111/gcb.14123
90. Klaus VH, Kleinebecker T, Hölzel N, Blüthgen N, Boch S, Müller J, et al. Nutrient concentrations and fibre contents of plant community biomass reflect species richness patterns along a broad range of land-use intensities among agricultural grasslands. Perspect Plant Ecology Evol Systematics. (2011) 13:287–95. doi: 10.1016/j.ppees.2011.07.001
91. Solly EF, Schöning I, Boch S, Kandeler E, Marhan S, Michalzik B, et al. Factors controlling decomposition rates of fine root litter in temperate forests and grasslands. Plant Soil. (2014) 382:203–18. doi: 10.1007/s11104-014-2151-4
92. Gilhaus K, Boch S, Fischer M, Hölzel N, Kleinebecker T, Prati D, et al. Grassland management in Germany: effects on plant diversity and vegetation composition. Tuexenia. (2017) 37:379–97. doi: 10.14471/2017.37.010
93. Prasuhn V, Spiess E, Humphrys C. Nitratauswaschung unter intensiv und extensiv genutztem Grasland. Lysimeter als Bestandteil der Entscheidungsfindung. Bericht über die. (2013) 15:161–4.
94. Cuttle S, Scrulock R, Davies BMS. A 6-year comparison of nitrate leaching from grass/clover and N-fertilized grass pastures grazed by sheep. J Agric Sci. (1998) 131:39. doi: 10.1017/S0021859698005565
95. Kolbe H. Landnutzung und Wasserschutz (Land Use and Water Protection). Leipzig: WLV Wissenschaftliches Lektorat & Verlag Leipzig (2000).
96. Decau ML, Simon JC, Jacquet A. Nitrate leaching under grassland as affected by mineral nitrogen fertilization and cattle urine. J Environ Qual. (2004) 33:637–44. doi: 10.2134/jeq2004.6370
97. Meek B, Carter D, Westermann D, Wright J, Peckenpaugh R. Nitrate leaching under furrow irrigation as affected by crop sequence and tillage. Soil Sci Soc America J. (1995) 59:204–10. doi: 10.2136/sssaj1995.03615995005900010031x
98. Owens LB, Malone RW, Shipitalo MJ, Edwards WM, Bonta JV. Lysimeter study of nitrate leaching from a corn-soybean rotation. J Environ Qual. (2000) 29:467–74. doi: 10.2134/jeq2000.00472425002900020015x
99. Schindler U, Thiere J, Müller L, Altermann M. Ableitung bodenhydrologischer Kennwerte für heterogene Flächeneinheiten Nordostdeutschlands auf Grundlage des Flächentypkonzeptes zur Mittelmaßstäbigen Landwirtschaftlichen Standortkartierung (MMK). Landnutzung und Landentwicklung. (2002) 43:262.
100. Constantin J, Mary B, Laurent F, Aubrion G, Fontaine A, Kerveillant P, et al. Effects of catch crops, no till and reduced nitrogen fertilization on nitrogen leaching and balance in three long-term experiments. Agriculture Ecosyst Environ. (2010) 135:268–78. doi: 10.1016/j.agee.2009.10.005
101. Meisinger JJ, Ricigliano KA. Nitrate leaching from winter cereal cover crops using undisturbed soil-column lysimeters. J Environ Qual. (2017) 46:576–84. doi: 10.2134/jeq2016.09.0372
102. Getahun GT, Bergstrom L, Rychel K, Katterer T, Kirchmann H. Impact of loosening and straw addition to the subsoil on crop performance and nitrogen leaching: A lysimeter study. J Environ Qual. (2021) 50:858–67. doi: 10.1002/jeq2.20231
103. Asmus F. Ständige Pflanzendecke spart Nährstoffe und schont die Umwelt. Neue Landwirtschaft. (1993) 10:35–6.
104. Lin B-L, Sakoda A, Shibasaki R, Suzuki M. A modelling approach to global nitrate leaching caused by anthropogenic fertilisation. Water Res. (2001) 35:1961–8. doi: 10.1016/S0043-1354(00)00484-X
105. Zhou M, Butterbach-Bahl K. Assessment of nitrate leaching loss on a yield-scaled basis from maize and wheat cropping systems. Plant Soil. (2014) 374:977–91. doi: 10.1007/s11104-013-1876-9
106. Stehfest E, Bouwman L. N2O and NO emission from agricultural fields and soils under natural vegetation: summarizing available measurement data and modeling of global annual emissions. Nutr Cycl. Agroecosyst. (2006) 74:207–28. doi: 10.1007/s10705-006-9000-7
107. Tian G, Kolawole GO, Salako FK, Kang BT. An improved cover crop-fallow system for sustaiable management of low activity clay soils of the tropics. Soil Sci. (1999) 164:671. doi: 10.1097/00010694-199909000-00007
108. Meißner R, Rupp H, Seeger J, Schonert P. Langjährige Lysimeterversuchsergebnisse über den Einfluss einer gestaffelten Mineraldüngung auf den Nährstoffaustrag. Arch Agron Soil Sci. (1995) 39:197–219. doi: 10.1080/03650349509365902
109. Biernat L, Taube F, Vogeler I, Reinsch T, Kluß C, Loges R. Is organic agriculture in line with the EU-Nitrate directive? On-farm nitrate leaching from organic and conventional arable crop rotations. Agriculture Ecosyst Environ. (2020) 298:106964. doi: 10.1016/j.agee.2020.106964
110. Cookson W, Rowarth J, Cameron K. The effect of autumn applied 15N-labelled fertilizer on nitrate leaching in a cultivated soil during winter. Nutrient Cycling Agroecosystems. (2000) 56:99–107. doi: 10.1023/A:1009823114444
111. Kühling I, Brinkmeyer T, Schreiber J, Reuter T, Trautz D. Potential of mixed intercropping for enhanced brewing quality of malting barley (hordeum vulgare) under organic growing conditions in North-Western Germany. (2021).
112. BMEL. Verordnung zur Änderung der Düngeverordnung und anderer Vorschriften vom 28. April 2020. In: Justiz BD, editor. Bundesgesetzblatt Jahrgang 2020 Teil I Nr. 20. Bonn: Bundesanzeiger-Verlag (2020).
113. Kage H, Räbiger T, Sieling K. Stickstoffdüngung zu Winterraps und Winterweizen. Berichte über Landwirtschaft-Zeitschrift für Agrarpolitik und Landwirtschaft. (2022) 100(1):1–38. doi: 10.12767/buel.v100i1.415
114. Li Y, Li Y, Zhang Q, Xu G, Liang G, Kim D-G, et al. Enhancing soil carbon and nitrogen through grassland conversion from degraded croplands in China: Assessing magnitudes and identifying key drivers of phosphorus reduction. Soil Tillage Res. (2024) 236:105943. doi: 10.1016/j.still.2023.105943
115. Trinsoutrot I, Recous S, Bentz B, Lineres M, Cheneby D, Nicolardot B. Biochemical quality of crop residues and carbon and nitrogen mineralization kinetics under nonlimiting nitrogen conditions. Soil Sci Soc America J. (2000) 64:918. doi: 10.2136/sssaj2000.643918x
116. Turmel M-S, Speratti A, Baudron F, Verhulst N, Govaerts B. Crop residue management and soil health: a systems analysis. Agric Syst. (2014) 134:6–16. doi: 10.1016/j.agsy.2014.05.009
117. Masunga RH, Nwakaego Uzokwe V, Deusdedit Mlay P, Odeh I, Singh A, Buchan D, et al. Nitrogen mineralization dynamics of different valuable organic amendments commonly used in agriculture. Appl Soil Ecol. (2016) 101:185–93. doi: 10.1016/j.apsoil.2016.01.006
118. Liu X-JA, van Groeningen KJ, Dijkstra P, Hungate BA. Increased plant uptake of native soil nitrogen following fertilizer addition – not a priming effect? Appl Soil Ecol. (2017) 114:105–10. doi: 10.1016/j.apsoil.2017.03.011
119. Körschens M. Soil organic matter and environmental protection. Arch Agron Soil Sci. (2004) 50:3–9. doi: 10.1080/03650340310001627540
120. Ebertseder T, Engels C, Heyn J, Reinhold J, Brock C, Fürstenfeld F, et al. Humusbilanzierung. Eine Methode zur Analyse und Bewertung der Humusversorgung von Ackerland. Verband Deutscher Landwirtschaftlicher Untersuchungs- und Forschungsanstalten. Standpunkte. (2014), 1–21.
121. Tonitto C, David M, Drinkwater L. Replacing bare fallows with cover crops in fertilizer-intensive cropping systems: A meta-analysis of crop yield and N dynamics. Agriculture Ecosyst Environ. (2006) 112:58–72. doi: 10.1016/j.agee.2005.07.003
122. Abdalla M, Hastings A, Cheng K, Yue Q, Chadwick D, Espenberg M, et al. A critical review of the impacts of cover crops on nitrogen leaching, net greenhouse gas balance and crop productivity. Glob Chang Biol. (2019) 25:2530–43. doi: 10.1111/gcb.14644
123. Teixeira EI, Johnstone P, Chakwizira E, De Ruiter J, Malcolm B, Shaw N, et al. Sources of variability in the effectiveness of winter cover crops for mitigating N leaching. Agriculture Ecosyst Environ. (2016) 220:226–35. doi: 10.1016/j.agee.2016.01.019
124. Djurhuus J, Olsen P. Nitrate leaching after cut grass/clover leys as affected by time of ploughing. Soil Use Manage. (1997) 13:61–7. doi: 10.1111/j.1475-2743.1997.tb00558.x
125. Olesen JE, Askegaard M, Rasmussen IA. Winter cereal yields as affected by animal manure and green manure in organic arable farming. Eur J Agron. (2009) 30:119–28. doi: 10.1016/j.eja.2008.08.002
126. Reinsch T, Loges R, Kluß C, Taube F. Effect of grassland ploughing and reseeding on CO2 emissions and soil carbon stocks. Agriculture Ecosyst Environ. (2018) 265:374–83. doi: 10.1016/j.agee.2018.06.020
127. Intergovernmental Panel on Climate Change (IPCC). Climate change and land: an IPCC special report on climate change. In: Desertification, Land Degradation, Sustainable Land Management, Food Security, and Greenhouse Gas Fluxes in Terrestrial Ecosystems (2019). Available at: https://www.ipcc.ch/srccl/download/.
128. Goulding K. Nitrate leaching from arable and horticultural land. Soil Use Manage. (2000) 16:145–51. doi: 10.1111/j.1475-2743.2000.tb00218.x
129. Delin S, Stenberg M. Effect of nitrogen fertilization on nitrate leaching in relation to grain yield response on loamy sand in Sweden. Eur J Agron. (2014) 52:291–6. doi: 10.1016/j.eja.2013.08.007
130. Böhlmann N, Meissner R, Bernsdorf S, Böhme F, Russow R, Wegener U. Studies of atmospheric nitrogen deposition in a mire of the German National Park Hochharz Mountains using two different methods. Water Air Soil pollut. (2005) 168:17–32. doi: 10.1007/s11270-005-0587-0
131. Russow R, Böhme F. Determination of the total nitrogen deposition by the 15N isotope dilution method and problems in extrapolating results to field scale. Geoderma. (2005) 127:62. doi: 10.1016/j.geoderma.2004.11.015
132. Russow R, Veste M, Böhme F. A natural 15N approach to determine the biological fixation of atmospheric nitrogen by biological soil crusts of the Negev Desert. Rapid Commun Mass Spectrometry: Int J Devoted to Rapid Dissemination Up-to-the-Minute Res Mass Spectrometry. (2005) 19:3451–6. doi: 10.1002/rcm.2214
Keywords: Lysimeter, nitrogen leaching, seepage, mineral fertilization, land use
Citation: Rupp H, Tauchnitz N and Meissner R (2024) The influence of increasing mineral fertilizer application on nitrogen leaching of arable land and grassland—results of a long-term lysimeter study. Front. Soil Sci. 4:1345073. doi: 10.3389/fsoil.2024.1345073
Received: 27 November 2023; Accepted: 16 February 2024;
Published: 05 March 2024.
Edited by:
Muhammad Shaaban, Henan University of Science and Technology, ChinaCopyright © 2024 Rupp, Tauchnitz and Meissner. This is an open-access article distributed under the terms of the Creative Commons Attribution License (CC BY). The use, distribution or reproduction in other forums is permitted, provided the original author(s) and the copyright owner(s) are credited and that the original publication in this journal is cited, in accordance with accepted academic practice. No use, distribution or reproduction is permitted which does not comply with these terms.
*Correspondence: Holger Rupp, aG9sZ2VyLnJ1cHBAdWZ6LmRl