 Leichao Nie1,2,3,4†
 Keying Qu1,2,3,4†Lijuan Cui1,2,3,4Xiajie Zhai1,2,3,4Xinsheng Zhao1,2,3,4Yinru Lei1,2,3,4
 Jing Li1,2,3,4Jinzhi Wang1,2,3,4
 Rumiao Wang1,2,3,4
 Wei Li1,2,3,4*
- 1Institute of Wetland Research, Chinese Academy of Forestry, Beijing, China
- 2Beijing Key Laboratory of Wetland Services and Restoration, Beijing, China
- 3Institute of Ecological Conservation and Restoration, Chinese Academy of Forestry, Beijing, China
- 4Beijing Hanshiqiao National Wetland Ecosystem Research Station, Beijing, China
Soil nitrogen and phosphorus are directly related to soil quality and vegetation growth and are, therefore, a common research topic in studies on global climate change, material cycling, and information exchange in terrestrial ecosystems. However, collecting soil hyperspectral data under in situ conditions and predicting soil properties, which can effectively save time, manpower, material resources, and financial costs, have been generally undervalued. Recent optimization techniques have, however, addressed several of the limitations previously restricting this technique. In this study, hyperspectral data were taken from surface soils under different vegetation types in the wetlands of the Shaanxi Yellow River Wetland Provincial Nature Reserve. Through in situ original and first-order differential transformation spectral data, three prediction models for soil carbon, nitrogen, and phosphorus contents were established: partial least squares (PLSR), random forest (RF), and Gaussian process regression (GPR). The and RMSR of the constructed models were then compared to select the optimal model for evaluating soil content. The soil organic carbon, total nitrogen, and total phosphorus content models established based on the first-order differential had a higher accuracy when modeling and during model validation than those of other models. Moreover, the PLSR model based on the original spectrum and the Gaussian process regression model had a superior inversion performance. These results provide solid theoretical and technical support for developing the optimal model for the quantitative inversion of wetland surface soil carbon, nitrogen, and phosphorus based on in situ hyperspectral technology.
1 Introduction
River wetland soils effectively maintain the stability of river wetland ecosystems by filtering, fixing, and enriching various elements (1–3). Of these, soil carbon is an important component of the global terrestrial ecosystem carbon pool (4, 5). Additionally, soil nitrogen and phosphorus are directly related to soil quality and vegetation growth and are, thus, popular topics for research on global climate change, material cycling, and information exchange in terrestrial ecosystems (6–8).
In recent research on hyperspectral inversion for soil nutrients, researchers have effectively improved prediction accuracy through appropriate spectral data preprocessing and model construction methods. In spectral preprocessing, methods include the first derivative of the original spectral reflectance, correlation analysis, and logarithmic transformation, among others (9, 10). Regarding model construction, linear models are mainly used, such as univariate linear regression and partial least squares regression. Additionally, various data mining techniques, including random forest and Gaussian process regression models, have also been employed by numerous scholars in this field (11–13). Soil hyperspectral technology can obtain continuous spectral information for each soil element and can be used to perform feature identification and component inversion (14). Specifically, a visible near-infrared hyperspectral analysis of soil properties can reduce labor needs, with a lower cost and higher efficiency than those of conventional methods (15). Reports on soil in situ spectroscopy in foreign countries emerged in the 1990s. In 1991, Shonk et al. designed a device that measured soil spectral reflectance in an in situ environment to model and predict soil organic carbon content (16). Later, Suduth and Hummel estimated soil organic matter content, cation exchange capacity, and moisture using soil spectral reflectance data obtained in the field in 1993, with a much lower accuracy than that of indoor spectra (17). Since these early studies, there have been relatively few studies on the in situ visible near-infrared spectroscopy of soil in the past decade. However, after entering the new century, soil spectroscopy experts resumed their focus on in situ visible near-infrared spectroscopy predictions in soil fields. In 2003, Kooistra et al. measured the in situ spectral reflectance data of soil under clear and cloudless conditions from 11:00 to 16:00 in summer at a height of 1 m above the ground. They then used partial least squares regression to model soil organic matter and clay content. The study found that the accuracy of the in situ spectral model for predicting soil organic matter and clay content was far inferior to that of the laboratory spectral model (18). In 2009, Rossel et al. modeled soil organic carbon content using both in situ and indoor visible near-infrared spectroscopy, and their results showed that the root mean square error of the in situ spectral model for soil organic carbon content was relatively large (19). Moreover, in 2012, Kuang et al. found that soil moisture negatively impacted the accuracy of estimating soil organic carbon and total nitrogen content when comparing in situ visible near-infrared spectroscopy in the field with visible near-infrared spectroscopy in the laboratory. Therefore, they believed that in situ visible near-infrared spectroscopy in dry soil was more suitable for predicting soil organic carbon and total nitrogen content (20).
In addition, scholars have improved the prediction accuracy of soil content models through a series of optimization algorithms. For example, in 2015, Shuo et al. selected 32 sampling points in the sewage irrigation area of Longkou City, collected in situ hyperspectral reflectance data of soil at each sampling point, and measured the contents of nine heavy metals in the soil samples. Then, the in situ spectral data following a spectral transformation were combined with heavy metal content data to establish a partial least squares regression prediction model. Different spectral transformation methods were used for various heavy metals, and later modeling achieved more desirable results (21). Finally, in 2015, Juanjuan et al. established prediction models for the soil total nitrogen content of two soil types, air-dried rice soil samples and field in situ soil samples, using two linear regression algorithms combined with different spectral preprocessing methods. The results showed that the prediction model achieved a highly accurate quantitative prediction of soil total nitrogen content through in situ spectroscopy (22).
The factors influencing soil spectra, especially the in situ spectra collected in the field, are complex. Early studies primarily focused on indoor spectra under controlled conditions, but the application of in situ spectra in the field has considerable research potential, despite a controversial history (23). Based on this potential, the present study takes the soil of the Shaanxi Yellow River Wetlands as the research subject. Through establishing prediction models for soil organic carbon, total nitrogen, and total phosphorus content using in situ hyperspectral data, our research aims to provide a more convenient and rapid method for accurate detection of wetland soil nutrient information, thereby helping to reduce costs in wetland management.
2 Materials and methods
2.1 Study area
The Shaanxi Yellow River Wetland Provincial Nature Reserve is located in the eastern part of the Guanzhong Plain in Shaanxi Province (34°36′–35°40′ N, 110°10′–110°36′ E). and is an important habitat for terrestrial wildlife. The total area of the entire nature reserve is 45,986 hectares, with functional zones classified according to three standard protected areas: core, buffer, and experimental zones, accounting for 39.60%, 38.65%, and 21.75% of the total protected area, respectively. The riverbed at the junction of the three main rivers (Yellow River, Weihe River, and Luohe River) is composed of the water surfaces of the three rivers, a mudflat along the bank, a floodplain, the riverbed, and a small number of terraces; this junction is one of the main transfer stations on the migration routes of land migratory birds in China and serves as a habitat for the survival and reproduction of numerous local and internationally protected birds in the central and western regions. The study area has a warm temperate continental semi-humid monsoon climate, characterized by four distinct seasons and a concurrence of rainfall and heat. The annual average temperature is 13.5°C, with annual precipitation ranging from 529 to 574 mm. Spring is warm and dry with less rainfall, summer is hot and rainy, autumn is cool and moist with rapid temperature decreases, and winter is cold and windy with sparse rain and snow. The soil types in the area include saline, alluvial, and marsh soils (24). The wetland plant flora in the protected area is mainly composed of globally distributed species, with70 families, 236 genera, and 287 species of seed plants, including 20 species unique to China and one species under national protection. The dominant plant species in the wetland community are Phragmites australis, Typha orientalis, Cyperus rotundis, and other wetland plants.
2.2 Measurements of in situ hyperspectral data
An ASD FS4 spectrometer (Analytical Spectral Devices, Inc., Boulder, CO, USA) was equipped with a soil spectral reflectance testing probe in the wavelength range of 350–2500 nm. The measurement of in-situ spectra in the field was completed prior to the collection of soil samples. However, the collected soil samples were separated according to different habitats, their spectral reflectance data were obtained, and the data from each habitat were averaged to obtain the average soil spectral reflectance.
The key to in situ soil visible near-infrared spectroscopy measurements is to eliminate the limiting effects of weather conditions on spectroscopic measurements and minimize the influence of environmental stray light. In addition, conducting measurements in areas with soil surface conditions such as stones, plant root tissues, and debris should be avoided. In summary, in situ spectral measurements require strong weather conditions and stable light intensity under clear and cloudless conditions to reduce the impact of changes in the light incidence angle and light intensity on spectral measurements. Therefore, measurements were taken between 10 am to 2 pm Beijing time, under clear and windless weather conditions. The soil surface at the points to be measured was cleaned prior to the measurements. A fixed stand was used to stabilize the position of the spectral probe so that the probe was oriented vertically downwards, with a height maintained at approximately 45 cm above the ground. Before each spectral data measurement, a standard whiteboard calibration was performed, and the arithmetic mean of the 20 spectra was taken as the original spectral data for the entire band of the soil sample. To provide, the visible near-infrared spectra of the soil measured in this case will be collectively referred to as “in situ spectra” from hereon.
2.3 Chemical determination of soil carbon, nitrogen, and phosphorus nutrient content
The soil organic carbon (SOC) content was determined using the potassium dichromate–ferrous sulfate titration method, the content of total nitrogen (TN) in the soil was determined using the semi-micro Kjeldahl method, and the content of total phosphorus (TP) in the soil was measured using the sulfuric acid–perchloric acid digestion–molybdenum antimony anti colorimetric method (15).
2.4 Spectral data preprocessing
Spectral data were extracted using the Viewspec Pro software (25). First, the spectral curve was modified using a parabolic correction function to avoid jumps in the connection points during spectral data collection. The spectral reflectance curve was then smoothed through ten consecutive points to eliminate reflectance errors caused by background noise during spectral data collection (26).
To emphasize the correlation between soil spectral reflectance data and soil element content, two spectral mathematical transformations were used: raw spectral reflectance (RAW) and first-order differential reflectance (FD) data (25). The transformation formula was conducted using Equation 1 below:
where is the wavelength of each band, is the first-order differential spectral value of wavelength , and is the wavelength value from band to band +1.
In addition, due to the redundancy in many hyperspectral data bands, raw spectral reflectance (RAW) and first-order differential reflectance (FD) were used as independent variables in Pearson’s correlation analysis with soil carbon, nitrogen, and phosphorus contents to improve the accuracy of the model. This process was implemented using the R language (27).
2.5 Construction and verification of inversion models
The dataset was gradient-sorted according to the organic carbon, total nitrogen, and total phosphorus contents of the soil samples. The samples with the three sorting intervals in the total soil spectral reflectance dataset were grouped into the same sample sublevel, resulting in four sublevel samples. All samples were divided into two groups at a 3:1 ratio, with a total of 357 soil samples from three sublevels used as the modeling set. The other group included 119 soil samples from a small sample level to validate the constructed model. Using the Weka3.8 software, we constructed a model for predicting soil ecological stoichiometric characteristics, and three models were selected for the study: partial least squares regression (PLSR), random forest (RF), and gaussian process regression (GPR). PLSR is an operational method based on Principal Component Analysis, which aids in data dimensionality reduction. RF is an ensemble learning algorithm used for classification and regression tasks. GPR is a popular machine learning technique used for analyzing, classifying, and performing regression analysis on the provided data. The evaluation of the inversion accuracy of the SOC, total nitrogen, and total phosphorus content prediction models was mainly carried out by calculating and comparing the magnitudes of the coefficients of determination (, Equations 2) and root mean square error (RMSE, Equation 3). Specifically, when the value of is larger and closer to 1, and the RMSE is smaller, the prediction accuracy of the prediction model is higher; otherwise, the estimation accuracy of the prediction model is lower (28).
where is the measured value of the soil element content, is the predicted value of the soil element content model, is the average measured value of the soil element content, and n is the number of samples.
3 Results
3.1 Spectral curve characteristics of outdoor and indoor soil in different habitat types
This study selected four typical habitat types in the Shaanxi Yellow River Wetland Nature Reserve: bare flats, Phragmites australis, Typha orientalis, and Cyperus rotundus. Figure 1 shows the spectral reflectance curves of soil with a particle size of 0.2 mm and a moisture content of 0% after thorough drying in the four different habitats, as well as the spectral reflectance curves in situ without any treatment in the field. We selected soil samples with a particle size of 0.2 mm and a moisture content of 0% after thorough drying to obtain indoor spectral data, this approach was used because both soil particle size and soil moisture content have a significant impact on the accuracy of predicting soil organic carbon, total nitrogen, and total phosphorus content based on soil hyperspectral data. As shown in Figure 1, the reflectance of in situ spectra is significantly lower than that of indoor spectra. Although the spectral reflectance of soil samples varied in different habitats, the overall trends of the spectral reflectance curves were similar.
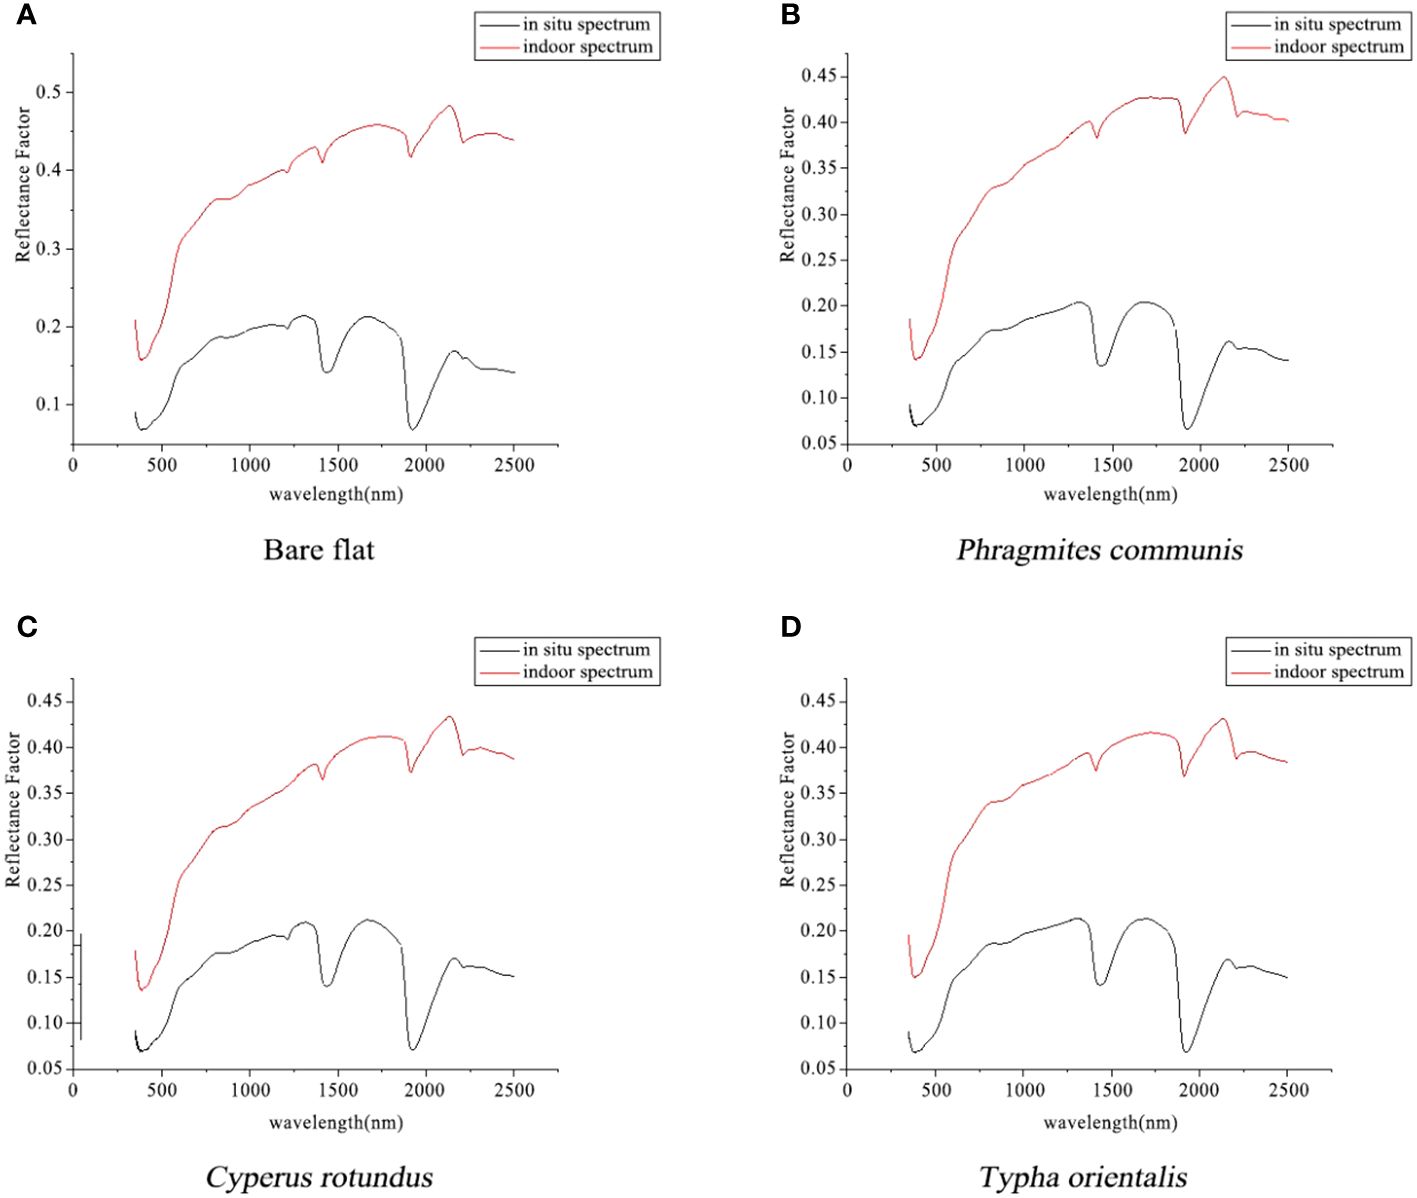
Figure 1 Soil spectral reflectance curves for soil samples from four different habitats: bare flat (A), Phragmites australis (B), Cyperus rotundus (C) and Typha orientalis (D).
After drying the soil samples, the spectral reflectance of the soil in the four habitats ranged from 0.1 to 0.5. The spectral reflectance curves of the soil in each habitat were nearly parallel and in the wavelength range of 350–2500 nm, with similar fluctuations. The absorption peaks and valleys appeared in the same wavelength band, with differences in reflectance sizes. In the visible light band–350–400 nm, the soil spectral reflectance data decreased, followed by an increase in the 400 nm band. With the growth of the band, the soil spectral reflectance rapidly increased and then continued to decrease until the 760 nm band. The rate of increase in soil spectral reflectance began to slow and plateau. The soil spectral reflectance curves in various habitats showed two obvious absorption peaks in the 1400 and 1900 nm bands. Prior to these two absorption peaks, the soil reflectance curves were originally in a gentle upward state but suddenly decreased before the absorption peak with a large amplitude.
3.2 Construction and evaluation of soil element content model based on in situ spectroscopy
This study incorporated the original spectral reflectance data and first-order differential spectral reflectance data of in situ soil in the Shaanxi Yellow River Wetland Nature Reserve. PLSR, GPR, and RF inversion models for soil organic content (SOC), total nitrogen (TN), and total phosphorus (TP) contents were established, and the prediction accuracies of different soil elements were compared. The modeling and validation results are listed in Table 1.
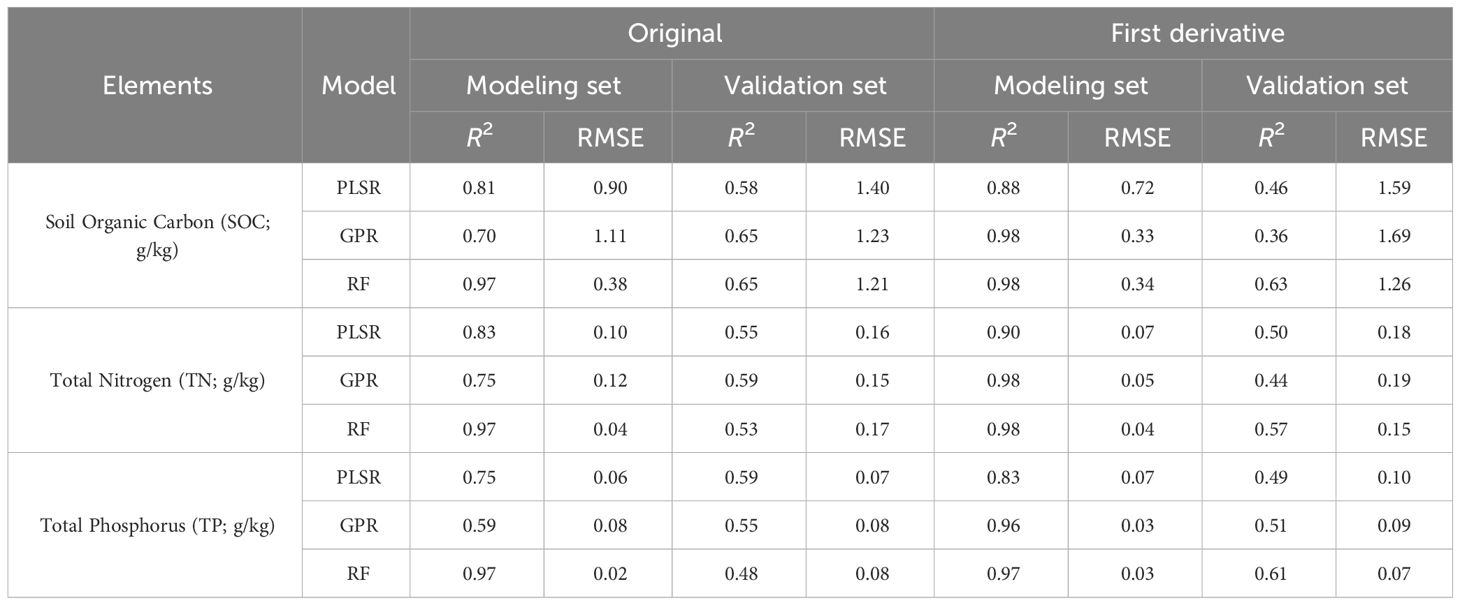
Table 1 Modeling and evaluation of soil organic carbon, total nitrogen, and total phosphorus based on in situ full-band spectroscopy using three different models and two dataset types.
In comparing the performance of the in situ original spectrum and first-order differential spectrum data types, showed that the prediction accuracy of the three models based on the first-order differential was higher than or equal to that of the original spectrum. During model validation, PLSR and GPR, based on the original spectrum, had a higher validation accuracy and lower RMSE than first-order differential modeling. However, when the RF model was used to invert soil TN and TP, the validation accuracy based on first-order differential modeling was slightly higher than that based on the original spectral modeling, and the RMSE was also lower. Therefore, for PLSR and GPR, modeling based on the original spectrum will have more desirable inversion results, whereas for RF, further exploration is needed to determine which data type to use based on the required inversion element type.
Comparing the differences in prediction accuracy of soil SOC, TN, and TP elements, the range for soil SOC modeling was 0.70–0.98, and the validation range was 0.36–0.65; the range for soil TN modeling was 0.75–0.98, and the validation range was 0.44–0.59. The range for soil TP modeling was 0.62–0.97 and the validation range was 0.26–0.65, indicating the worst soil TP content prediction accuracy.
Comparing the three inversion models, the modeling range of PLSR was 0.76–0.98 and the validation range was 0.38–0.80, the modeling of GPR was 0.62–0.97 and the validation range was 0.28–0.92. The modeling range of RF was 0.96–0.99, with an validation range of 0.26–0.91. Taken together, RF had a superior inversion efficacy on the soil SOC, TN, and TP contents, whereas PLSR demonstrated a more stable inversion performance.
Figure 2 presents scatter plots of the in situ original spectra and first-order differential spectra of the soil SOC, TN, and TP contents, as well as full-band PLSR, GPR, and RF estimations. The modeling and prediction accuracies of the three models differed, specifically, the RF modeling set points for soil SOC, TN, and TP contents were mostly distributed near a 1:1 line, and only an exceedingly small number of modeling set points deviated from the 1:1 line, resulting in an extremely high modeling accuracy. However, the validation and modeling sets deviated significantly, thereby lowering the accuracy. The sample points of PLSR deviated slightly from the 1:1 line, but the difference between the fitted lines in the modeling set and the fitted lines in the validation set was small, indicating high stability.
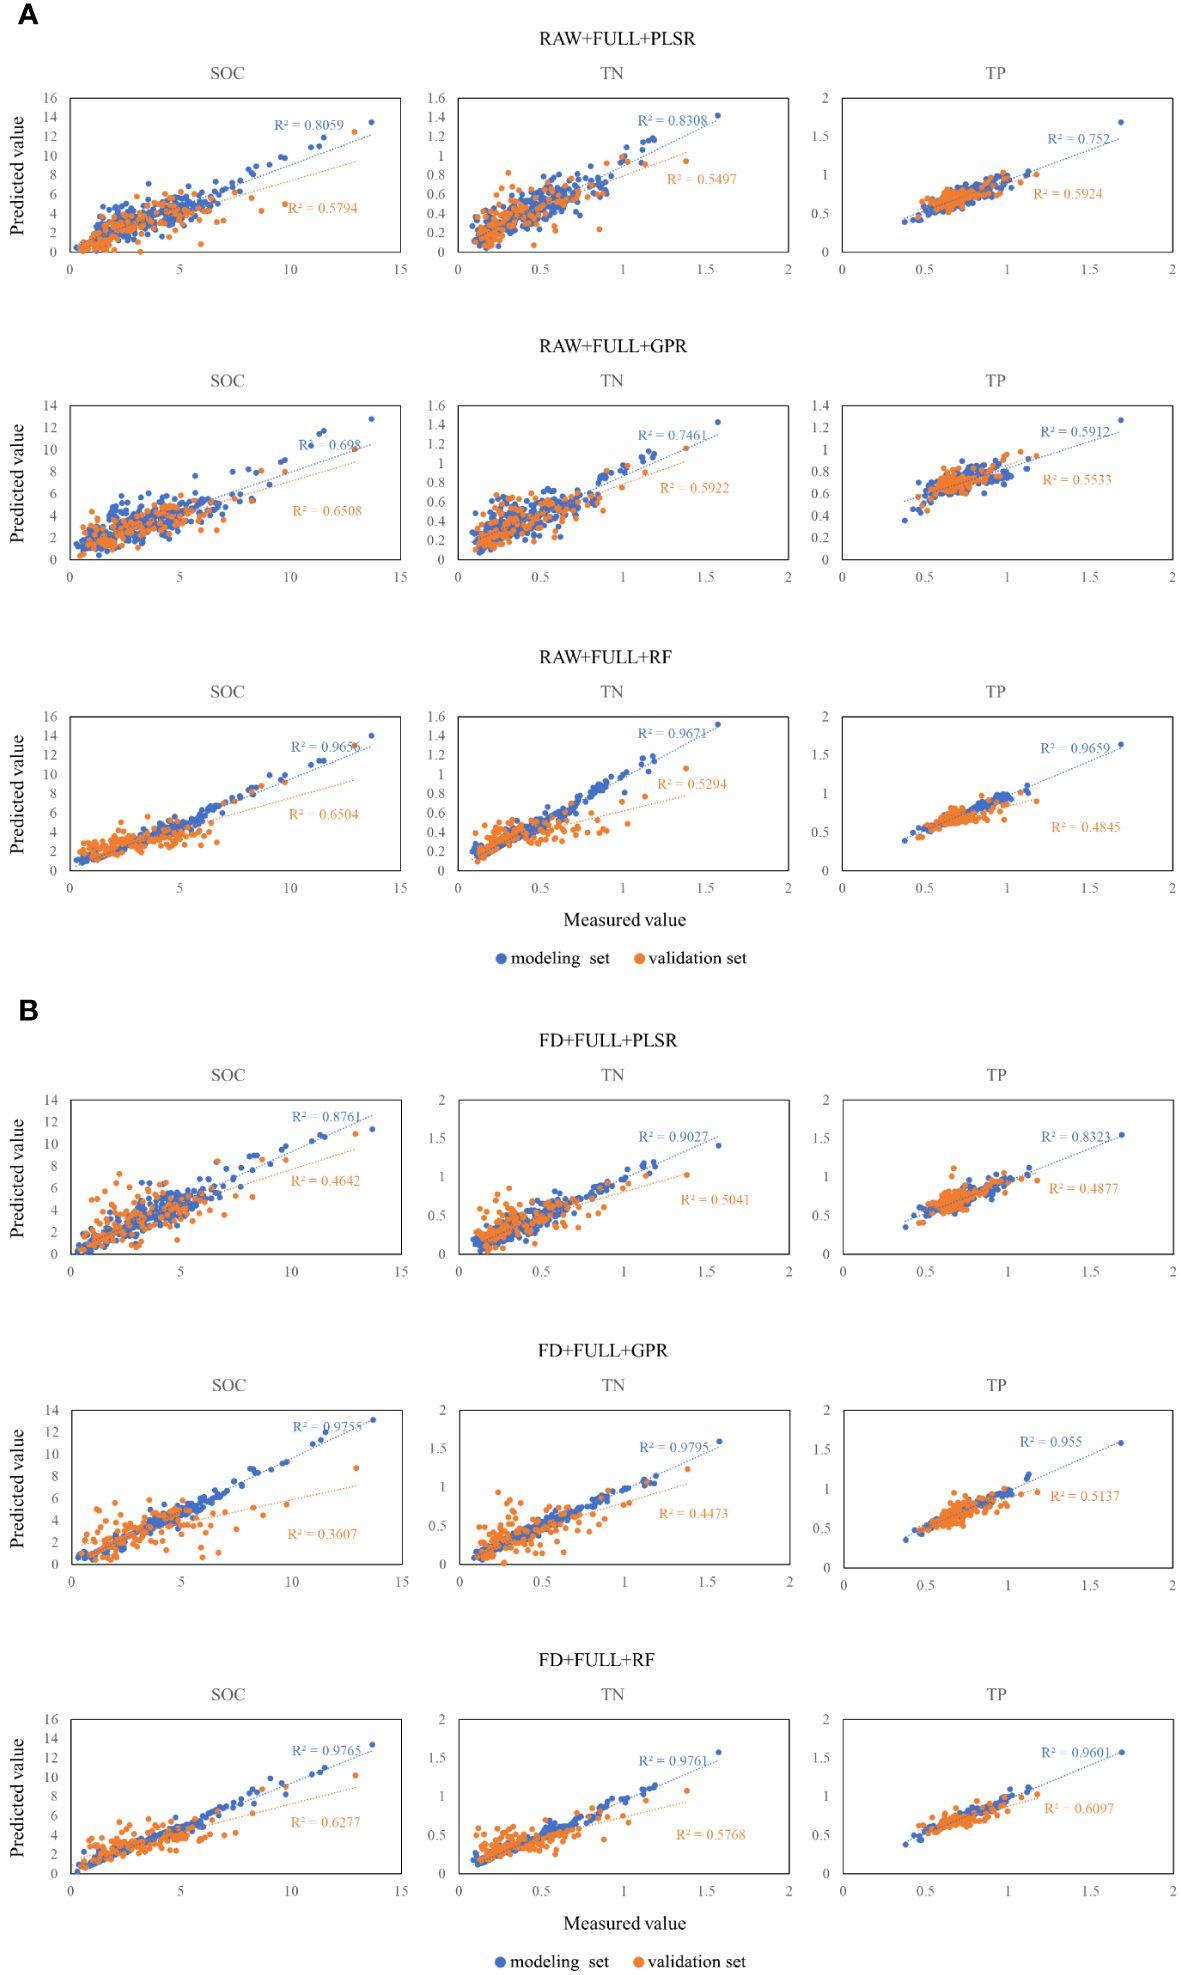
Figure 2 Modeling and validation of the carbon, nitrogen, and phosphorus levels based on field spectra using the partial least-squares regression (PLSR),random forest (RF), and Gaussian process regression (GPR) models. RAW, raw reflectance (A); FD, first derivative reflectance (B).
4 Discussion
4.1 Modeling using in situ spectral data
In comparing the prediction accuracies of soil organic carbon, total nitrogen, and total phosphorus content based on in situ spectral reflectance data and indoor spectral prediction models established in this chapter, we selected soil samples with a particle size of 0.2 mm and a moisture content of 0% after thorough drying to obtain indoor spectral data. This is because both the soil particle size and soil moisture content have a significant impact on the accuracy of predicting soil organic carbon, total nitrogen, and total phosphorus content based on soil hyperspectral data (29–31). Soil conditions exhibit heterogeneity in time, space, and depth, including, but not limited to, changes in soil surface conditions, soil moisture content, and deep soil conditions. This phenomenon poses certain challenges to ensuring the accurate collection of soil spectra for in situ measurements, such as increasing the difficulty of extracting effective information on soil properties and reducing the accuracy of using in situ spectra to monitor soil nutrient content (32–34). Studies have also confirmed that the predictive accuracy of in situ spectra can be improved through spectral preprocessing, model algorithm selection, and other aspects (35, 36), which is consistent with the results of the present study. In this study, original spectral and first-order differential spectral reflectance data of soil in four habitat types were selected, and the partial least squares, random forest, and Gaussian process regression models were used to estimate the soil nutrient contents of organic carbon, total nitrogen, and total phosphorus. Compared with previous research results (37, 38), the prediction accuracy of the model in this study was improved or similar.
4.2 Differences in accuracy of soil element inversion using hyperspectral data
Soil carbon and nitrogen contents have a direct impact on reflectance (39). Visible near-infrared hyperspectral technology indirectly obtains information on multiple soil components through the combined and harmonic peaks of hydrogen groups in the soil (40, 41). The vast majority of nitrogen in soil exists in organically bound forms and is strongly correlated with the soil carbon content. Therefore, using hyperspectral technology to establish soil carbon and nitrogen content models can quickly estimate soil carbon and nitrogen contents with a high prediction accuracy (42). In this study, the prediction accuracy for the soil TP content was lower than that of the soil SOC and TN contents, which was consistent with the results of the correlation analysis. The accuracy of the prediction model and correlation analysis was poor, possibly because of the low phosphorus content in the soil, which increased the prediction difficulty (43).
4.3 Impact of different models on the accuracy of soil element inversion
The summative results on spectral modeling and predictions of soil carbon, nitrogen, and phosphorus elements are listed in Table 2. Currently, most researchers use the RF and PLSRmodels, both of which perform with relative stability and accuracy. The RF model is an integrated machine-learning algorithm used for classification and regression and is constructed by combining the results of various decision trees and packaging the original dataset to select samples (38, 48). The GPR model is a popular machine-learning technique used to analyze, classify, and regress provided data (49). The PLSR model integrates various analyses, such as correlation, principal component analysis, and multiple linear regression, to identify the main control factors affecting the dependent variable from high-dimensional data as well as reduce the dimensionality of the spectral analysis, thereby increasing the robustness of the constructed model (45). In this study, the optimal inversion model for soil elemental content was RF, which had a higher and lower RMSE than those of the other two models; however, PLSR had a more stable influence on the inversion of soil elemental content.
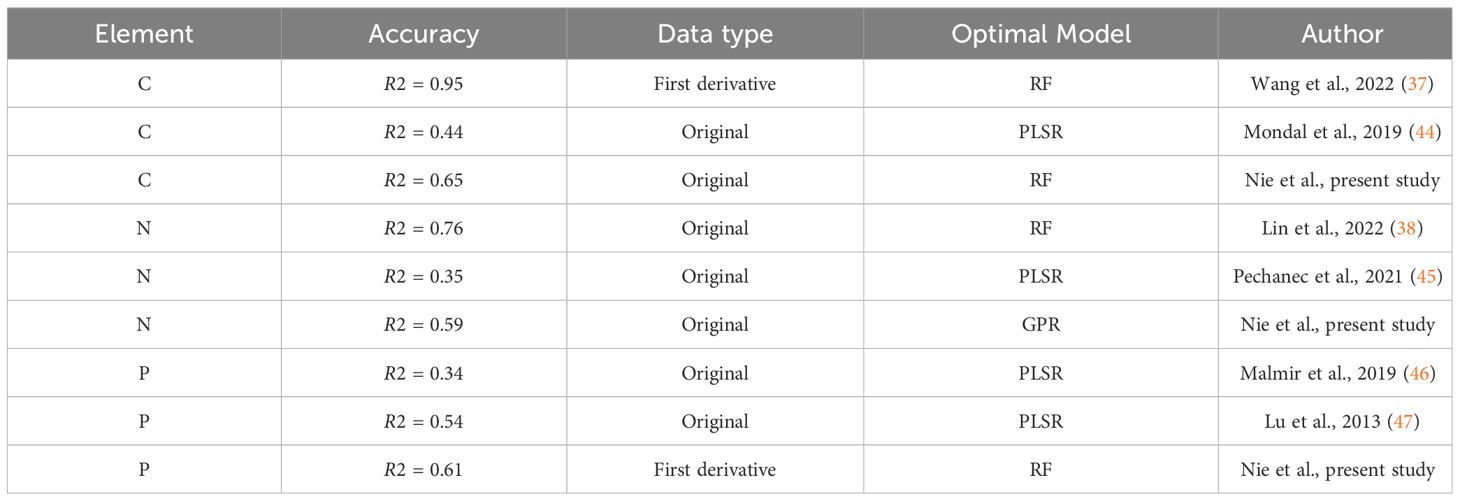
Table 2 Comparison of soil carbon, nitrogen, and phosphorus prediction accuracies, data types, and optimal models between other research results and this paper.
5 Conclusions
This study focuses on the surface soil of the wetlands in the Shaanxi Yellow River Wetland Provincial Nature Reserve. In situ spectral data were collected, and the PLSR-Partial Least Squares, RF-Random Forest, and GPR-Gaussian Process Regression models were established for soil carbon, nitrogen, and phosphorus contents using both the original spectral data and the first derivative transformed spectral data. The conclusions are as follows:
(1) In comparing modeling incorporating in situ original spectra versus first-order differential spectra data, the soil organic carbon, total nitrogen, and total phosphorus models, established based on first-order differential data, had a higher modeling accuracy. During model validation, the PLSR-Partial Least Squares model was based on the original spectrum data, but the GPR-Gaussian Process Regression model had a stronger inversion performance.
(2) In comparing the differences in prediction accuracy of soil organic carbon, total nitrogen, and total phosphorus, the R2 range for modeling soil total phosphorus content was 0.62–0.97, whereas the validation R2 range was 0.26–0.65, indicating the weakest prediction performance.
(3) In comparing the three inversion models, the RF-Random Forest model had a stronger inversion influence on the soil organic carbon, total nitrogen, and total phosphorus contents, the R2 range for the model was 0.96–0.99, and the validation R2 range was 0.38–0.80. The R2 range for PLSR-Partial Least Squares model was 0.76–0.98, and the validation R2 range was 0.38–0.80, indicating a more stable inversion performance.
This study, based on field in situ soil spectral data, estimated the contents of SOC, TN, and TP in the soil using different models. This approach established accurate spectral processing methods and models for estimating their content and variations, with the aim of providing technical and theoretical support for the rapid and accurate monitoring of nutrient contents in wetlands.
Data availability statement
The original contributions presented in the study are included in the article/supplementary material. Further inquiries can be directed to the corresponding author.
Author contributions
LN: Conceptualization, Data curation, Writing – review & editing. KQ: Writing – original draft. LC: Resources, Writing – review & editing. XJZ: Software, Writing – review & editing. XSZ: Software, Writing – review & editing. YL: Project administration, Writing – review & editing. JL: Visualization, Writing – review & editing. JW: Supervision, Writing – review & editing. RW: Methodology, Writing – review & editing. WL: Conceptualization, Funding acquisition, Writing – review & editing.
Funding
The author(s) declare financial support was received for the research, authorship, and/or publication of this article. This work was supported by China’s Special Fund for Basic Scientific Research Business of Central Public Research Institutes (CAFYBB2021MC006 and CAFYBB2021ZB003).
Conflict of interest
The authors declare that the research was conducted in the absence of any commercial or financial relationships that could be construed as a potential conflict of interest.
Publisher’s note
All claims expressed in this article are solely those of the authors and do not necessarily represent those of their affiliated organizations, or those of the publisher, the editors and the reviewers. Any product that may be evaluated in this article, or claim that may be made by its manufacturer, is not guaranteed or endorsed by the publisher.
References
1. Erhui G, Ranhao S, Liding C. Current status and prospects of research on the main ecological service functions of riparian vegetation buffer zones. J Ecol. (2011) 30:1830–7. doi: 10.13292/j.1000-4890.2011.0277
2. Capon SJ, Chambers LE, Nally RM, Naiman RJ, Davies P, Marshall N, et al. Riparian ecosystems in the 21st century: hotspots for climate change adaptation? Ecosystems. (2013) 16:359–81. doi: 10.1007/s10021-013-9656-1
3. Erhui G, Liding C, Ranhao S, Zhaoming W. Effects of riparian vegetation patterns on the distribution and potential loss of soil nutrients: a case study of the Wenyu River in Beijing. Front Environ Sci Eng. (2015) 9:279–87. doi: 10.1007/s11783-014-0667-8
4. Trigalet S, Gabarrón-Galeote MA, Van Oost K, van Wesemael B. Changes in soil organic carbon pools along a chronosequence of land abandonment in southern Spain. Geoderma. (2016) 268:14–21. doi: 10.1016/j.geoderma.2016.01.014
5. Geraei DS, Hojati S, Landi A, Cano AF. Total and labile forms of soil organic carbon as affected by land use change in southwestern Iran. Geoderma Regional. (2016) 7:29–37. doi: 10.1016/j.geodrs.2016.01.001
6. Gregorich EG, Rochette P, McGuire S, Liang BC, Lessard R. Soluble organic carbon and carbon dioxide fluxes in maize fields receiving spring-applied manure. J Environ Qual. (1998) 27:209–14. doi: 10.2134/jeq1998.00472425002700010029x
7. Eswaran H, Van Den Berg E Reich P. Organic carbon in soils of the world. Soil Sci Soc America J. (1993) 57:192–4. doi: 10.2136/sssaj1993.03615995005700010034x
8. Post WM, Emanuel WR, Zinke PJ, Stangenberger AG. Soil carbon pools and world life zones. Nature. (1982) 298:156–9. doi: 10.1038/298156a0
9. Xinyu W. Comparison of soil rapid nitrogen content inversion models based on hyperspectral data. Geomatics Spatial Inf Technol. (2023) 46:201–4. doi: 10.3969/j.issn.1672-5867.2023.03.056
10. Dawei W, Jiangong N, Jiyue G, Xuanhui W, Zhongzhi H. Hyperspectral detection of soil nutrients, heavy metals, and pH in the Dagu River Basin. J Qingdao Agric Univ. (2019) 2:126–130+146. doi: 10.3969/J.ISSN.1674-148X.2019.02.008
11. Senchao W, Liheng L, Weihua D, Xiaoqiang L, Shouqi D. Research progress on soil organic matter inversion models based on hyperspectral remote sensing. Agric Eng Technol. (2023) 21:27–9. doi: 10.16815/j.cnki.11-5436/s.2023.21.005
12. Shengxiang X, Meiyan W, Xuezheng S. Hyperspectral imaging for high-resolution mapping of soil carbon fractions in intact paddy soil profiles with multivariate techniques and variable selection. Geoderma. (2020) 370:114358. doi: 10.1016/j.geoderma.2020.114358
13. Pudełko A, Chodak M. Estimation of total nitrogen and organic carbon contents in mine soils with NIR reflectance spectroscopy and various chemometric methods. Geoderma. (2020) 368:114306. doi: 10.1016/j.geoderma.2020.114306
14. Zhou S, Yan G, Xi J, Haoxiang W. Research progress on soil near earth sensors. J Soil Sci. (2011) 6: 1274–81. doi: 10.11766/trxb201012070517
15. Leichao N, Hui P, Xinsheng Z, Xiajie Z, Wei L. Exploration on the application of hyperspectral prediction model for soil nutrient content in baishanzu national park, Zhejiang province. J Terrestrial Ecosyst Conserv. (2022) 2:9–17. doi: 10.12356/j.2096-8884.2022-0016
16. Shonk JL, Gaultney LD, Schulze DG, Scoyoc GEV. Spectroscopic sensing of soil organic matter content. Trans ASABE. (1991) 34:1978–84. doi: 10.13031/2013.31826
17. Sudduth KA, Hummel JW, Soil Organic Matter CEC. and moisture sensing with a portable NIR spectrophotometer. Soil Sci Soc America J. (1993) 57:1571–82. doi: 10.13031/2013.28498
18. Kooistra L, Wanders J, Epema GF, Leuven RSEW, Wehrens R. Buydens LMC The potential of field spectroscopy for the assessment of sediment properties in river floodplains. Analytica Chimica Acta. (2003) 484:189–200. doi: 10.1016/s0003-2670(03)00331-3
19. Viscarra RRA, Lark RM. Improved analysis and modelling of soil diffuse reflectance spectra using wavelets. Eur J Soil Sci. (2009) 60:453–64. doi: 10.1111/j.1365-2389.2009.01121
20. Kuang B, Mahmood HS, Quraishi MZ, Hoogmoed WB, Mouazen AM, Henten E. Chapter four - sensing soil properties in the laboratory, in situ, and on-line: A review. Adv Agron. (2012) 114:155–223. doi: 10.1016/B978-0-12-394275-3.00003-1
21. Shuo L, Quanyuan W, Longlong Z, Dongquan C, Liyuan Z, Na L, et al. Rapid monitoring of soil heavy metal pollution in sewage irrigation areas based on field measured spectra. J Saf Environ. (2015) 15:297–302. doi: 10.13637/j.issn.1009-6094.2015.02.061
22. Reeves JB, Smith DB. The potential of mid- and near-infrared diffuse reflectance spectroscopy for determining major- and trace-element concentrations in soils from a geochemical survey of North America. Appl Geochemistry. (2009) 24:1472–81. doi: 10.1016/j.apgeochem.2009.04.017
23. Juanjuan Z, Shuping X, Lei S, Xinming M, Gao W. Research on estimating soil total nitrogen content based on near-infrared spectroscopy analysis. Soil. (2015) 47:653–7. doi: 10.13758/j.cnki.tr.2015.04.005
24. Ganjun X, Shengyi W, Wei L, Xinsheng Z, Leichao N, Xiying T, et al. Estimation of carbon storage in shaanxi yellow river wetland nature reserve. J Plant Ecol. (2023) 47:469–78. doi: 10.17521/cjpe.2022.0071
25. Lijuan C, Xueyan Z, Zhiguo D, Yilan H, Xinsheng Z, Xiajie Z, et al. Plant identification of Beijing Hanshiqiao wetland based on hyperspectral data. Spectrosc Lett. (2021) 54:381–94. doi: 10.1080/00387010.2021.1928224
26. Shichao C, Kefa Z, Rufu D. Extracting plant anomaly information from hyperspectral data in mining areas. Spectrosc Spectral Anal. (2019) 39:241–9. doi: 10.3964/j.issn.1000-0593(2019)01-0241-09
27. Xueyan Z, Lijuan C, Wei L, Zhiguo D, Yang C, Zhijun L, et al. Inversion of functional traits of Spartina alterniflora leaves based on hyperspectral data. J Ecol. (2021) 41:6159–69. doi: 10.5846/stxb202004020781
28. Xiaoguang Z, Biao H, Junfeng J, Wenyou H, Weixia S, Yongcun Z. Research on the quantitative model of salt content in northeast saline soil based on visible near infrared hyperspectral analysis. Spectrosc Spectral Anal. (2012) 8: 2075–9. doi: 10.3964/j.issn.1000-0593(2012)08-2075-05
29. Yidan B, Yong H, Hui F, Pereira AG. Research on spectral characteristics of soil and prediction of nitrogen content. J Spectrosc Spectral Anal. (2007) 1: 62–5. doi: 10.3321/j.issn:1000-0593.2007.01.017
30. Lei Y, Yongsheng H, Yaxing Z, Peng H, Qi H, Feng Q. The effect of removing soil moisture on hyperspectral estimation of soil organic matter content. Spectrosc Spectral Anal. (2017) 37:2146–51. doi: 10.3964/j.issn.1000-0593(2017)07-2146-06
31. Fang L, Weiyang L, Jie P, Chunhui F, Wenjun J, Zijin B. In situ spectral inversion of organic matter in cotton fields using soil moisture removal algorithm. Spectrosc Spectral Anal. (2022) 42:222–8. doi: 10.3964/j.issn.1000-0593(2022)01-0222-07
32. Babaeian E, Tuller M. The feasibility of remotely sensed near-infrared reflectance for soil moisture estimation for agricultural water management. Remote Sens. (2023) 15:2736. doi: 10.3390/rs15112736
33. Mutanga O, Skidmore AK, Kumar L, Ferwerda J. Estimating tropical pasture quality at canopy level using band depth analysis with continuum removal in the visible domain. Int J Remote Sens. (2005) 26:1093–108. doi: 10.1080/01431160512331326738
34. Munawar AA, Zulfahrizal Z, Hayati R. Syahrul, Agricultural products quality determination by means of near infrared spectroscopy. IOP Conf Series: Earth Environ Sci. (2022) 951:12112. doi: 10.1088/1755-1315/951/1/012112
35. Krishan G, Bhagwat A, Sejwal P, Yadav BK, Kansal ML, Bradley A, et al. Assessment of groundwater salinity using principal component analysis (PCA): a case study from Mewat (Nuh), Haryana, India. Environ Monit Assess. (2022) 195:37. doi: 10.1007/s10661-022-10555-1
36. Asa G, Luboš B, Mehdi SM, Josef K, Radim V, Karel N. Comparing different data preprocessing methods for monitoring soil heavy metals based on soil spectral features. Soil Water Res. (2015) 10:218–27. doi: 10.17221/113/2015-SWR
37. Sheng W, Kaiyu G, Chenhui Z, DoKyoung L, MA J, Yufeng G, et al. Using soil library hyperspectral reflectance and machine learning to predict soil organic carbon: Assessing potential of airborne and spaceborne optical soil sensing. Remote Sens Environ. (2022) 271:112914. doi: 10.1016/j.rse.2022.112914
38. Lixin L, Xixi L. Mixture-based weight learning improves the random forest method for hyperspectral estimation of soil total nitrogen. Comput Electron Agric. (2022) 192:106634. doi: 10.1016/j.compag.2021.106634
39. Michae K, David S, Kevin T, Court SJ. The effects of tidal inundation on the reflectance characteristics of coastal marsh vegetation. J Coast Res. (2009) 25:1177–86. doi: 10.2112/08-1080.1
40. Rossel RAV, Webster R. Predicting soil properties from the Australian soil visible-near infrared spectroscopic database. Eur J Soil Sci. (2012) 63:848–60. doi: 10.1111/j.1365-2389.2012.01495.x
41. Lei Y, Yongsheng H, Lei G, Yong Z, Qiang Z, Junjun C, et al. Hyperspectral estimation of soil organic matter content based on partial least squares regression. Trans Chin Soc Agric Eng. (2015) 31:103–9. doi: 10.11975/j.issn.1002-6819.2015.14.015
42. Leichao N, Zhiguo D, Lijuan C, Xiying T, Xiajie Z, Xinsheng Z, et al. Hyperspectral inversion of soil carbon and nutrient contents in the yellow river delta wetland. Diversity. (2022) 14:862. doi: 10.3390/d14100862
43. Gomes RS, Santos T, Rabelo d, Gomes CMC, Araújo I, Silva j, et al. Soil organic carbon content prediction using soil-reflected spectra: A comparison of two regression methods. Remote Sens. (2021) 13:4752. doi: 10.3390/rs13234752
44. Mondal BP, Sekhon BS, Sahoo RN, Paul P. Vis-nir reflectance spectroscopy for assessment of soil organic carbon in a rice-wheat field of ludhiana district of punjab. Int Arch Photogrammetry Remote Sens Spatial Inf Sci. (2019) 43:417–22. doi: 10.5194/isprs-archives-XLII-3-W6-417-2019
45. Pechanec V, Mráz A, Rozkošný L, Vyvlečka P. Usage of airborne hyperspectral imaging data for identifying spatial variability of soil nitrogen content. ISPRS Int J Geo-Information. (2021) 10:355. doi: 10.3390/ijgi10060355
46. Mohammad M, Iman T, Zhihong X, Michae F, Hosseini BS. Prediction of soil macro- and micro-elements in sieved and ground air-dried soils using laboratory-based hyperspectral imaging technique. Geoderma Regional. (2019) 340:70–80. doi: 10.1016/j.geoderma.2018.12.049
47. Peng L, Li W, Zheng N, Linghao L, Wenhao Z. Prediction of soil properties using laboratory VIS-NIR spectroscopy and Hyperion imagery. J Geochemical Explor. (2013) 132:26–33. doi: 10.1016/j.gexplo.2013.04.003
48. Hongyang L, Shengyao J, Zichun L. Quantitative analysis of soil total nitrogen using hyperspectral imaging technology with extreme learning machine. Sensors. (2019) 19:4355. doi: 10.3390/s19204355
Keywords: hyperspectral data, wetland soil, optimization techniques, soil nutrient, inversion model hyperspectral data, inversion model
Citation: Nie L, Qu K, Cui L, Zhai X, Zhao X, Lei Y, Li J, Wang J, Wang R and Li W (2024) Inversion of soil carbon, nitrogen, and phosphorus in the Yellow River Wetland of Shaanxi Province using field in situ hyperspectroscopy. Front. Soil Sci. 4:1364426. doi: 10.3389/fsoil.2024.1364426
Received: 02 January 2024; Accepted: 26 March 2024;
Published: 09 April 2024.
Edited by:
Siu Mui Tsai, University of São Paulo, BrazilReviewed by:
Youzhi Li, Hunan Agricultural University, ChinaFeng Li, Chinese Academy of Sciences (CAS), China
Copyright © 2024 Nie, Qu, Cui, Zhai, Zhao, Lei, Li, Wang, Wang and Li. This is an open-access article distributed under the terms of the Creative Commons Attribution License (CC BY). The use, distribution or reproduction in other forums is permitted, provided the original author(s) and the copyright owner(s) are credited and that the original publication in this journal is cited, in accordance with accepted academic practice. No use, distribution or reproduction is permitted which does not comply with these terms.
*Correspondence: Wei Li, d2V0bGFuZHMyMDdAMTYzLmNvbQ==
†These authors have contributed equally to this work and share first authorship