The MEXSAS2 Sample and the Ensemble X-ray Variability of Quasars
 Roberto Serafinelli
 Fausto Vagnetti
 Elia Chiaraluce
 Riccardo Middei
- 1Dipartimento di Fisica, Università di Roma Tor Vergata, Rome, Italy
- 2Dipartimento di Fisica, Università di Roma Sapienza, Rome, Italy
- 3Dipartimento di Matematica e Fisica, Università Roma Tre, Rome, Italy
We present the second Multi-Epoch X-ray Serendipitous AGN Sample (MEXSAS2), extracted from the 6th release of the XMM Serendipitous Source Catalog (XMMSSC-DR6), cross-matched with Sloan Digital Sky Survey quasar Catalogs DR7Q and DR12Q. Our sample also includes the available measurements for masses, bolometric luminosities, and Eddington ratios. Analyses of the ensemble structure function and spectral variability are presented, together with their dependences on such parameters. We confirm a decrease of the structure function with the X-ray luminosity, and find a weak dependence on the black hole mass. We introduce a new spectral variability estimator, taking errors on both fluxes and spectral indices into account. We confirm an ensemble softer when brighter trend, with no dependence of such estimator on black hole mass, Eddington ratio, redshift, X-ray and bolometric luminosity.
1. The MEXSAS2 Catalog
We present here the MEXSAS2 Catalog, obtained from the sixth release of the XMM Newton Serendipitous Source Catalog (XMMSSC-DR6, Rosen et al., 2016), combined with both SDSS-DR7Q (Schneider et al., 2010) and SDSS-DR12Q quasar Catalogs (Pâris et al., 2017). The MEXSAS2 Catalog is the updated version of MEXSAS (Multi-Epoch XMM Serendipitous AGN Sample), published by Vagnetti et al. (2016). It contains 9,735 X-ray observations for 3,366 quasars, which increases by about 25% the numbers of the previous version (7,837 observations, 2,700 quasars). It only contains sources with more than one observation, and it is therefore ideal for variability studies.
We complement the Catalog with measurements of black hole masses, bolometric luminosities and Eddington ratios, which are available for 3,138 quasars (93%) from the Catalogs by Shen et al. (2011) for the sources listed in SDSS-DR7Q, and by Kozłowski (2017) for SDSS-DR12Q. We use homogeneous criteria to derive the masses and bolometric luminosities from the two Catalogs, adapting their criteria, which are slightly different for the redshift intervals where two different broad lines and two continuum luminosities are available. In fact, Shen et al. (2011) adopts different single-epoch virial estimates sharply dividing at redshift z = 0.7 for choosing between Hβ and MgII(2,798Å) relations, and at z = 1.9 for Mg II(2,798Å) and C IV(1,549Å). A similar option is adopted for computing bolometric luminosities from the continua at 5,100Å or 3,000Å dividing at z = 0.7, and at 3,000Å or 1,350Å dividing at z = 1.9. The criteria adopted by Kozłowski (2017) are instead to prefer the Mg II black hole mass estimate when available, rather than that from C IV, which is biased from various effects, and to compute bolometric luminosity as a weighted average of those derived from two different available continua. However, Kozłowski (2017) also find that the DR7Q line widths (which are derived from detailed fits of spectral components) are generally more reliable than the DR12Q ones (which are derived from principal component analysis), thus they are to be preferred, when available. To apply the same criteria to the mass and luminosity data from both DR7Q and DR12Q, we adopt the following choice: (i) for quasars included only inDR12Q and not in DR7Q, we take the estimates by Kozłowski (2017) (2178 objects); (ii) for quasars included in both Catalogs or only in DR7Q, and in redshift intervals with only one broad line and one continuum luminosity available (z ≲ 0.35, 0.9 ≲ z ≲ 1.5, z ≳ 2.25), we take the estimates by Shen et al. (2011) (442 objects); (iii) for quasars included in both Catalogs or only in DR7Q, in redshift intervals with two broad lines and continua (0.35 ≲ z ≲ 0.9, 1.5 ≲ z ≲ 2.25), we apply the Kozłowski (2017) criteria to the DR7Q data, deriving new estimates (518 objects).
The Catalog, including X-ray measurements from XMMSSC and quasar data from SDSS and from our elaboration, will be published elsewhere (Vagnetti et al, in preparation). Here we provide preliminary results of our ensemble analyses of the X-ray variability.
2. Flux Variability and Structure Function
We compute the structure function according to Vagnetti et al. (2016), as a r.m.s. difference of the X-ray flux measured at two epochs differing by τ in the rest-frame, and corrected for the noise contribution,
where is the quadratic contribution of the photometric noise to the observed variations, σn being the error on logfX at each given time.
We use mainly EPIC X-ray fluxes in the XMM-Newton band 9 (0.5–4.5 KeV), as in our previous papers (Vagnetti et al., 2011, 2016).
The SF can be fitted by a power-law SF∝τb. For the whole sample we find a slope b = 0.11±0.01. The SFs in bins of X-ray luminosity and black hole mass are shown in Figure 1. We confirm a strong anti-correlation with X-ray luminosity, approximately as , with correlation coefficient r = −0.92 and null probability p(>r) = 0.04, and no dependence on redshift, similarly to Vagnetti et al. (2016). There is an apparent decrease of the SF with black hole mass, approximately as , with r = −0.97 and p(>r) = 0.03, but partial correlation analysis suggests that this is due to the strong correlation of mass with X-ray luminosity. Limiting the analysis to the luminosity interval , the mass-luminosity correlation reduces (r = −0.83, p(>r) = 0.06), and the dependence of the SF on black hole mass is weaker, . We find neither dependence on bolometric luminosity nor on Eddington ratio.
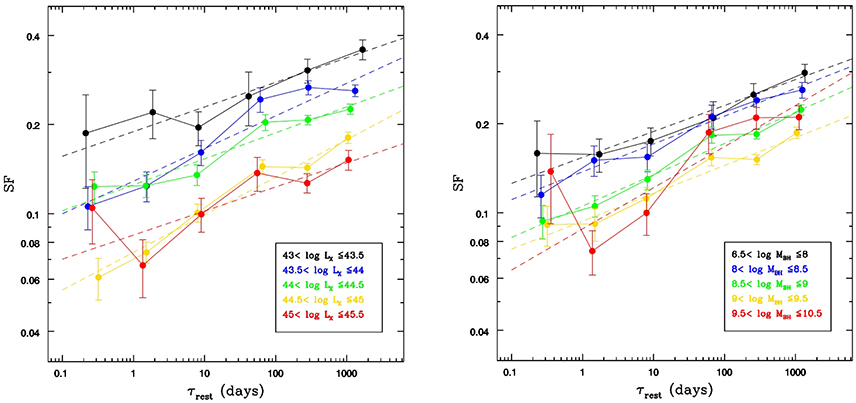
Figure 1. The structure function in bins of X-ray luminosity LX and black hole mass MBH (data and continuous lines) with power-law fits (dashed lines). Left panel: Black, 43 < log LX ≤ 43.5; blue, 43.5 < log LX ≤ 44; green, 44 < log LX ≤ 44.5; yellow, 44.5 < log LX ≤ 45; red, 45 < log LX ≤ 45.5. Right panel: Black, 6.5 ≲ log MBH ≤ 8; blue, 8 < log MBH ≤ 8.5; green, 8.5 < log MBH ≤ 9; yellow, 9 < log MBH ≤ 9.5; red, 9.5 < log MBH ≲ 10.5.
3. Spectral Variability
We update the analysis of the spectral variability parameter, initially introduced by Trevese and Vagnetti (2002) and recently adapted to the X-ray band by Serafinelli et al. (2017)
relating variations of the photon index Γ with those of the X-ray flux in a given band.
The spectra of most Seyfert galaxies with Eddington ratios above 0.01 typically become steeper in their brighter phases (e.g., Markowitz et al., 2003; Sobolewska and Papadakis, 2009; Connolly et al., 2016), as well as for many galactic black hole binary systems (e.g., Remillard and McClintock, 2006; Done et al., 2007; Dong et al., 2014). This is known as “softer when brighter” behavior and translates to a negative β value according to Equation 2. We also found this “softer when brighter” behavior, obtaining β = −0.69±0.03 in our ensemble analysis, for the previous version of the MEXSAS sample, using fluxes in the soft X-ray band 0.5–2 keV, and computing variations with respect to the mean values of each source (Serafinelli et al., 2017).
Since the ensemble correlation between ΔΓ and ΔlogfX contains a large scatter, also due to the large measurement errors for the fainter sources, we fit a linear relation ΔΓ ∝ ΔlogfX to the MEXSAS2 data set taking the uncertainties in both variables into account. We run a high number of linear fits replacing original data with Gaussian distributed values within the associated error box. Moreover, following Isobe et al. (1990), we computed both ordinary least squares regressions OLS(Y|X) of the dependent variable Y on the independent variable X (which result we call for brevity βxy), the inverse regression OLS(X|Y) (βyx), and the bisector:
For the whole sample, we find ensemble values βxy = −0.22±0.04 and βbis = −1.22±0.05, confirming the “softer when brighter” behavior for both spectral variability parameters (see Figure 2).
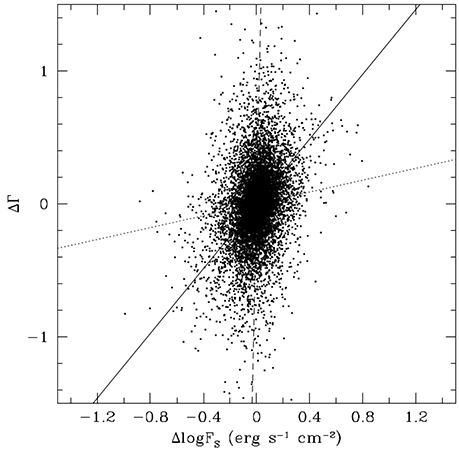
Figure 2. The ensemble correlation between the variations of the photon index ΔΓ and the variations of the logarithmic flux ΔlogF are shown. The dotted line represents βxy, the dashed line represents βyx, while the bisector βbis is shown as a continuous line.
We then divide our sample in bins of soft X-ray flux, to show that the resulting β does not change within the errors (see Figure 3). In fact this was expected, because measurement errors do affect the estimate of β, but this must reflect an intrinsic relation between the flux and slope variations which should not change with an observational parameter like the average flux of the sources.
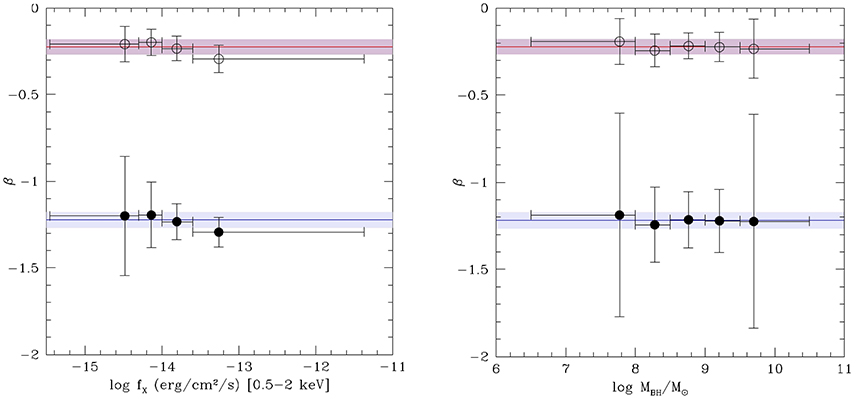
Figure 3. The dependence of βxy and βbis in bins of soft X-ray flux (Left panel) and black hole mass (Right panel). No dependence is found, and all the values of βxy (empty circles) and βbis (filled circles) are compatible with the corresponding ensemble values βxy = −0.22±0.04 and βbis = −1.22±0.05, which are indicated respectively by the red and blue lines, and by the lighter bands for the uncertainties. The horizontal bars indicate bin widths, not errors.
We also divide our sample in bins of black hole mass, MBH, and show the result in Figure 3. Both βxy and βbis are independent of MBH within the errors, and always compatible with their overall ensemble values.
We similarly analyse possible dependencies on Eddington ratio, redshift, X-ray and bolometric luminosities, finding no evidence of change. This analysis will be reported in an upcoming paper (Vagnetti et al., in preparation).
4. Summary
- We have updated our X-ray quasar Catalog MEXSAS to MEXSAS2.
- We have confirmed our previous results for the structure function dependence on X-ray luminosity, and no dependence on redshift; we find a weak dependence on black hole mass, and no dependence on bolometric luminosity and Eddington ratio.
- We have developed new spectral variability estimators, by computing ordinary least squares and bisector fits with errors in both variables.
- We obtain “softer when brighter” trends for the new MEXSAS2 sample using both estimators.
- Our spectral variability estimates, that also take errors on both fluxes and spectral indices into account, do not present a dependence on the flux.
- No trend with black hole mass, Eddington ratio, redshift, X-ray and bolometric luminosities is found, in agreement with our previous results (Serafinelli et al., 2017).
Author Contributions
RS performed the spectral variability analysis and wrote part of the text, FV was responsible for the idea that resulted in the paper and also contributed to the text, EC built the dataset of the MEXSAS2 Catalog, RM performed the structure function analysis.
Conflict of Interest Statement
The authors declare that the research was conducted in the absence of any commercial or financial relationships that could be construed as a potential conflict of interest.
References
Connolly, S. D., McHardy, I. M., Skipper, C. J., and Emmanoulopoulos, D. (2016). Long-term X-ray spectral variability in AGN from the Palomar sample observed by Swift. Month. Notices R. Astron. Soc. 459, 3963–3985. doi: 10.1093/mnras/stw878
Done, C., Gierliński, M., and Kubota, A. (2007). Modelling the behaviour of accretion flows in X-ray binaries. Everything you always wanted to know about accretion but were afraid to ask. Astron. Astrophys. Rev. 15, 1–66. doi: 10.1007/s00159-007-0006-1
Dong, A.-J., Wu, Q., and Cao, X.-F. (2014). A New Fundamental Plane for Radiatively Efficient Black-hole Sources. Astrophys. J. Lett. 787:L20. doi: 10.1088/2041-8205/787/2/L20
Isobe, T., Feigelson, E. D., Akritas, M. G., and Babu, G. J. (1990). Linear regression in astronomy. Astrophys. J. 364, 104–113. doi: 10.1086/169390
Kozłowski, S. (2017). Virial Black Hole Mass Estimates for 280,000 AGNs from the SDSS Broadband Photometry and Single-epoch Spectra. Astrophys. J. Suppl. 228:9. doi: 10.3847/1538-4365/228/1/9
Markowitz, A., Edelson, R., and Vaughan, S. (2003). Long-Term X-Ray Spectral Variability in Seyfert 1 Galaxies. Astrophys. J. 598, 935–955. doi: 10.1086/379103
Pâris, I., Petitjean, P., Ross, N. P., Myers, A. D., Aubourg, É., Streblyanska, A., et al. (2017). The sloan digital sky survey quasar catalog: twelfth data release. Astron. Astrophys. 597:A79. doi: 10.1051/0004-6361/201527999
Remillard, R. A., and McClintock, J. E. (2006). X-Ray Properties of black-hole binaries. Annu. Rev. Astron. Astrophys. 44, 49–92. doi: 10.1146/annurev.astro.44.051905.092532
Rosen, S. R., Webb, N. A., Watson, M. G., Ballet, J., Barret, D., Braito, V., Carrera, F. J., et al. (2016). The XMM-Newton serendipitous survey. VII. The third XMM-Newton serendipitous source catalogue. Astron. Astrophys. 590:A1. doi: 10.1051/0004-6361/201526416
Schneider, D. P., Richards, G. T., Hall, P. B., Strauss, M. A., Anderson, S. F., Boroson, T. A., et al. (2010). The sloan digital sky surveyquasar catalog. V. Seventh data release. Astron. J. 139, 2360–2373. doi: 10.1088/0004-6256/139/6/2360
Serafinelli, R., Vagnetti, F., and Middei, R. (2017). Quasar spectral variability from the XMM-Newton serendipitous source catalogue. Astron. Astrophys. 600:A101. doi: 10.1051/0004-6361/201629885
Shen, Y., Richards, G. T., Strauss, M. A., Hall, P. B., Schneider, D. P., Snedden, S., et al. (2011). A catalog of quasar properties from sloan digital sky survey data release 7. Astrophys. J. Suppl. 194:45. doi: 10.1088/0067-0049/194/2/45
Sobolewska, M. A., and Papadakis, I. E. (2009). The long-term X-ray spectral variability of AGN. Month. Notices R. Astron. Soc. 399, 1597–1610. doi: 10.1111/j.1365-2966.2009.15382.x
Trevese, D., and Vagnetti, F. (2002). Quasar spectral slope variability in the optical band. Astrophys. J. 564, 624–630. doi: 10.1086/324541
Vagnetti, F., Middei, R., Antonucci, M., Paolillo, M., and Serafinelli, R. (2016). Ensemble X-ray variability of active galactic nuclei. II. Excess variance and updated structure function. Astron. Astrophys. 593:A55. doi: 10.1051/0004-6361/201629057
Keywords: catalogues, quasars, spectral variability, structure function, X-rays
Citation: Serafinelli R, Vagnetti F, Chiaraluce E and Middei R (2017) The MEXSAS2 Sample and the Ensemble X-ray Variability of Quasars. Front. Astron. Space Sci. 4:21. doi: 10.3389/fspas.2017.00021
Received: 17 July 2017; Accepted: 26 September 2017;
Published: 11 October 2017.
Edited by:
Paola Marziani, Osservatorio Astronomico di Padova (INAF), ItalyReviewed by:
Edi Bon, Belgrade Astronomical Observatory, SerbiaIsabel Marquez Perez, Instituto de Astrofísica de Andalucía (CSIC), Spain
Copyright © 2017 Serafinelli, Vagnetti, Chiaraluce and Middei. This is an open-access article distributed under the terms of the Creative Commons Attribution License (CC BY). The use, distribution or reproduction in other forums is permitted, provided the original author(s) or licensor are credited and that the original publication in this journal is cited, in accordance with accepted academic practice. No use, distribution or reproduction is permitted which does not comply with these terms.
*Correspondence: Roberto Serafinelli, roberto.serafinelli@roma2.infn.it