 C. Tortora
 N. R. Napolitano
- 1School of Physics and Astronomy, Sun Yat-sen University Zhuhai Campus, Zhuhai, China
- 2INAF—Osservatorio Astronomico di Capodimonte, Napoli, Italy
Dark matter (DM) is predicted to be the dominant mass component in galaxies. In the central region of early-type galaxies it is expected to account for a large amount of the total mass, although the stellar mass should still represent the majority of the mass budget, depending on the stellar initial mass function (IMF). We discuss latest results on the DM fraction and mean DM density for local galaxies and explore their evolution with redshifts in the last 8 Gyr of the cosmic history. We compare these results with expectations from the ΛCDM model and discuss the role of the IMF and galaxy model through the central total mass density slope. We finally present future perspectives offered by next-generation instruments/surveys (Rubin/LSST, Euclid, CSST, WEAVE, 4MOST, and DESI), which will provide the unique chance to measure the DM evolution with time for an unprecedented number of galaxies and constrain their evolutionary scenario.
1 Introduction
Early-type galaxies (ETGs) are the most massive galaxy systems in the Universe and represent the final stage of galaxy evolution. As such, they carry the fossil record of the assembly of stellar and dark matter through time, and, because they are bright and massive, can be studied in detail from low to high redshifts. They are the result of a complex alchemy of physical processes that can be grouped into two major categories: galaxy merging (Trujillo et al., 2006, 2007; Cenarro and Trujillo 2009; Naab et al., 2009; Hopkins et al., 2010) and feedback mechanisms (e.g., Dekel and Birnboim 2006; Dekel and Burkert 2014). The variety of evolutionary mechanisms they have experienced make them a crucial test bench of the galaxy formation theories and the ultimate probe of the hierarchical evolutionary scenario. In particular, they can be used to trace the assembly of both the luminous and the dark components across time and check if the observations are consistent with predictions from simulations. For example, the total stellar-to-dark mass ratio of ETGs depends strongly on the galaxy mass, and observational and theoretical studies have suggested this to be connected to the overall star formation efficiency (Benson et al., 2000; Marinoni and Hudson 2002; Napolitano et al., 2005; Mandelbaum et al., 2006; van den Bosch et al., 2007; Conroy and Wechsler 2009; Moster et al., 2010; Alabi et al., 2016).
The ETG centers should experience, on small scales, the effect of the mechanisms acting at the large scales and show similar correlations for the central masses as the ones involving their total masses. In the last two decades, increasing evidences have been collected, showing that the central DM fraction (typically within one effective radius, Re hereafter) is higher in larger and more massive galaxies (e.g., Hyde and Bernardi 2009b; Ruszkowski and Springel 2009; Tortora et al., 2009; Auger et al., 2010a; Napolitano et al., 2010; Thomas et al., 2011; Tortora et al., 2012).
This positive correlation with mass seems almost insensitive to the adopted galaxy mass profile or initial mass function (IMF) (e.g., Cardone et al., 2009; Cardone and Tortora 2010; Cardone et al., 2011), but it can become uncertain in case a non-ΛCDM scenario, with mass following the (nonhomologous) light distribution, is adopted (e.g., Trujillo et al., 2004; Tortora et al., 2009, 2012). In general, a general consensus about the existence of such a trend is not yet reached as there are sparse evidences of an anticorrelation of the dark matter fraction with mass (e.g., Grillo et al., 2009; Grillo 2010; Grillo and Gobat 2010).
Among the largest source of uncertainty to quantify the stellar and DM mass budget in the central galactic regions, the IMF remains the most difficult to account for. Direct constraints from gravity-sensitive spectral lines (see Spiniello et al., 2012; La Barbera et al., 2013) are strongly required, albeit quite expensive in terms of observational requirements. In the absence of these constraints, the simplest approach is to assume a “universal” IMF. Unfortunately, this can introduce unreasonable fluctuations of the stellar mass involved in the models, i.e., by a factor of 2 or more (e.g., assuming a Chabrier (2001) or a Salpeter (1955) IMF or even super-Salpeter IMF, e.g., Tortora et al. (2009)). This can strongly affect the conclusions on the central DM fraction in these extreme cases. On the other hand, “non-universality” of the IMF, i.e., the systematic variation of the IMF with mass (or velocity dispersion), from a bottom-lighter (i.e., “lower-mass”) IMF for low mass ETGs to a bottom-heavier (i.e., “higher-mass”) IMF in massive galaxies, has accumulated convincing evidences in the last decade (e.g., Treu et al., 2010; Cappellari et al., 2012; Conroy and van Dokkum 2012; Spiniello et al., 2012; Goudfrooij and Kruijssen 2013; La Barbera et al., 2013; Tortora et al., 2013; Martín-Navarro et al., 2015; Li et al., 2017; Domínguez Sánchez et al., 2019), despite, also in this case, contradicting evidences pointing to bottom-light IMFs for massive systems have been reported (Smith et al., 2015). This nonuniversal IMF can, in principle, incorporate most (if not all) of the “apparent” DM fraction trend with mass (e.g., Thomas et al., 2011; Tortora et al., 2013).
A still almost unexplored area, to test the correlation of the dark-matter fraction with mass, is represented by high-redshift (i.e., z > 0.3) galaxies. For these systems, the difficulty of obtaining extended kinematics over large samples of galaxies is a barrier for large statistical studies. Here, one possibility is the use of strong gravitational lensing (Auger et al., 2009, 2010a; Tortora et al., 2010b; Sonnenfeld et al., 2013). However, at the moment the number of available systems with all the necessary data to perform accurate mass models is still restricted to small samples and small redshift windows, i.e., z ≲ 0.7 (e.g., Shajib et al., 2020). Another option is to use simple dynamical analysis based on integrated aperture kinematics, as the one provided by large sky surveys, such as SDSS/BOSS (e.g., Thomas et al., 2013), GAMA (e.g., Liske et al., 2015), and LAMOST (Napolitano et al., 2020). It has been proven that in these cases Jeans equation analysis can produce results consistent with more sophisticated dynamical modeling (Tortora et al. (2009), see also Section 2).
The first systematic studies of the evolution of the central DM fraction with redshift have been performed by Beifiori et al. (2014) and Tortora et al. (2014b), which provided evidences that high − z ETGs are less DM dominated than their local counterparts. Only recently, we have updated our previous analysis to include the effect of the IMF in the dynamical analysis and discussed in more detail the results in the context of the hierarchical scenario (Tortora et al., 2018b).
The paucity of high − z studies remains a strong limitation in the understanding of the DM content in galaxies. In fact, by studying correlations at higher redshift we could possibly separate the effect of the DM assembly and the IMF non-universality more clearly, when one or either effects start to emerge or the freedom on the choice of some parameters (e.g., age, metallicity of stars, concentration of the DM haloes) is lower.
In this article we present some updated results about the DM content of the central regions of massive ETGs, compare them with other observations and simulations, and discuss some perspectives in the context of the upcoming sky surveys. Despite that in the last decade there has been a significant production of studies addressing these specific measurements in ETGs (Padmanabhan et al., 2004; Cappellari et al., 2006, 2013b; Hyde and Bernardi 2009b; Tortora et al., 2009, 2010a, 2012, 2014b,a; Thomas et al., 2009, 2011; Ruszkowski and Springel 2009; Auger et al., 2010a; Cardone et al., 2009; Cardone and Tortora 2010; Napolitano et al., 2010; Beifiori et al., 2014; Shu et al., 2015; Nigoche-Netro et al., 2016, 2019; Xu et al., 2017; Lovell et al., 2018), only few reviews on dark matter in galaxies have touched this specific subject (e.g., Courteau et al., 2014; Salucci 2019), with little emphasis on the insight the dark matter fractions can provide about the ETG structure and evolution.
The article outline is as follows. In Section 2, we present the procedure we have used to determine the DM content and datasamples. We correlate the DM fraction with galaxy parameters in Section 3, deriving hints on the DM and total mass density slopes in Section 4. The evolution of DM fraction with redshift and the interpretation within the galaxy evolution scenario is provided in Section 5. Alternatives to the ΛCDM are briefly touched on in Section 6. A summary of the results and future prospects are presented in Section 7.
2 Estimating the Dark Matter Content
We start by defining the dynamical mass within a given galaxy radius, r. This is historically estimated using a simplistic “virial formula”
where G is the gravitational constant, σ is the galaxy velocity dispersion within some aperture (e.g., circular from fiber spectroscopy, or rectangular from multi-slit spectroscopy), and K is a, so called, pressure correction term (e.g., Padmanabhan et al., 2004; Cappellari et al., 2006; Tortora et al., 2009, 2012). This correction term depends on several factors, including the radius where the dynamical mass, Mdyn is computed in, the aperture used to measure the σ, the viewing angle of the system, the orbital distribution of stars in the same radius, the luminosity profile slope, and, finally, the DM density profile properties.
This explains why this approach, albeit simple and quite diffuse, does not really capture the full intrinsic dynamics of a given galaxy, and usually some approximated expressions are used to account for average behaviors of the systems under examination.
2.1 Jeans Equations and Total Mass Determination
More precise mass estimates come from the direct modeling of individual galaxies using the Jeans equations. In this case one can fully take into account the spatial distribution of the stars, e.g., from some detailed modeling of their surface brightness (e.g., using a Sérsic profile, Sersic (1968)), assume some anisotropy of the stellar orbits, and finally assume different DM density profiles, hence testing different DM models. With this approach one can finally estimate the model parameters of the dynamical mass, Mdyn, within any radius (although the usual choice is to take r = 1 Re) by solving the Jeans equation. In particular, one can derive the mass model parameters by best-fitting the velocity dispersion, projected along the line-of-sight and integrated within a given aperture, to the observed one from fiber or long-slit spectroscopy via χ2 minimization (see, e.g., Tortora et al., 2009; Cardone and Tortora 2010; Tortora et al., 2010b, 2012). In detail:
1. The projected luminosity profile I(r) is parameterized by a Sersic (1968) model.
2. The total cumulative (deprojected) dynamical mass profile M(r) is assumed to follow different distributions: a) a constant-M/L profile M(r) = ϒ0 L(r), where L(r) is the cumulative luminosity profile, e.g., from the curve of growth of the surface brightness profile I(r), and ϒ0 is the constant stellar mass-to-light ratio, or b) a singular isothermal sphere (SIS), where
3. The Jeans equation:
where
4. Eq. 3 is projected along the line-of-sight to obtain the projected velocity dispersion:
where
is the projected density profile.
5. σlos is integrated within a fixed aperture RAp to obtain the aperture velocity dispersion, σAp using the equation:
where
6. The modeled σAp derived above is fitted to the observed velocity dispersion, σ, by varying the mass model free parameters until the best-fit is achieved. In this article, we will adopt one-parameter mass models. As a matter of fact, even in the case of multi-parametric models, we will reduce these to a single parameter, by using realistic correlations among the model parameters. In particular, as one-parameter models we will adopt the SIS or constant-M/L profiles (e.g., Tortora et al., 2009, 2012). As a multi-parameter profile we will use NFW + Sérsic for DM + stars, where we fix the NFW dark mass parameters by using independent information from the literature, e.g., the concentration and virial mass by adopting realistic cvir–Mvir and also force the virial mass to obey an observed virial-to-stellar mass relation, Mvir–M∗, where the stellar mass, M∗, can be a free parameter (the impacts of these assumptions have been extensively discussed in Tortora et al. (2013), (2014a)). In the latter case, this allows us to have freedom on the stellar mass-to-light ratio and evaluate the IMF normalization. In this article we will adopt as reference results the ones derived in Tortora et al. (2013), where the DM halo is set using the cvir–Mvir correlation from N-body simulations (Macciò et al., 2008) and Mvir–M∗ correlations from abundance matching results in Moster et al. (2010). This reduction of the parameter space is obliged, in our case, by having a single observable for each galaxy. However, the robustness of such approaches has been demonstrated in more complex analysis using spatially resolved kinematics (e.g., Cappellari et al., 2013b) and combining dynamics with strong and weak gravitational lensing (e.g., Auger et al., 2010b).
7. The resulting best-fit mass profile then provides the total spherical Mdyn(r).
The dynamical procedure described above does not take into account the contribution of the black hole (BH) mass, orbital anisotropy, and rotation. We have estimated that these latter, in most of the cases, do not impact the Mdyn(r) estimates for more than few per cents (see more in Tortora et al. (2009, 2012, 2018b)).
2.2 Central Dark Matter
The main prediction of the virial formula (Eq. 1) and Jeans analysis (Section 2.1) is Mdyn(r), which, under the reasonable assumption of no cold gas and dust in the galaxy centers, is made up only from the stellar mass, M∗ and the dark mass, MDM, at a given radius r. Hence, if an accurate and independent estimate of M∗(r) is available, one can quantify the dark mass just by MDM(r) = Mdyn(r) − M∗(r) in the galaxy regions probed by the observed σ. Thus, the DM content can be characterized by computing the following quantities. First, the de-projected DM fraction, fDM(r) = 1 − M∗(r)/Mdyn(r) or, equivalently, the total-to-stellar mass ratio Mdyn(r)/M∗(r), which avoids the negative values arising in the DM fractions when M∗(r) > Mdyn(r). Second, the de-projected average DM density,
2.3 Datasamples
To apply the method illustrated in Section 2.1 and derive the quantities in Section 2.2, one needs datasets for which accurate surface photometry (e.g., high-quality imaging in one or more optical and/or near-infrared, NIR, bands) and accurate stellar masses (e.g., from optical + NIR multiband stellar population synthesis models or from spectroscopy) are available. In case one wants to study the evolution with redshift of the DM content, these datasets should provide uniform measurements from z = 0 to some higher redshifts. For our analysis we rely on two datasamples with these properties.
Our reference sample is made of massive and red galaxies collected in Tortora et al. (2018b), including stellar masses and structural parameters derived from Kilo Degree Survey (KiDS) imaging (de Jong et al., 2015, 2017). This sample encompasses a quite large range of redshifts and it is suitable to study the dark and luminous properties of galaxies from z ∼ 0.1 to z ∼ 0.7. The dataset consists of ∼ 9700 selected ETGs with optical and NIR photometry information. The sample is complete in stellar mass, obtained by the SED fitting of the KiDS optical bands and assuming a Chabrier (2001), at log M∗/M⊙ > 11.2 and redshifts z < 0.7. Structural parameters (e.g., effective radius Re and Sérsic index n) are obtained by a PSF-convolved Sérsic fit of the KiDS galaxy images in g-, r-, and i-bands (using 2DPHOT, La Barbera et al. 2008). In our calculations, these are rest-framed, as described in Tortora et al. (2018b). Spectroscopic redshifts and central velocity dispersions are taken from SDSS–DR7 (z < 0.2, Abazajian et al., 2009) and BOSS (z > 0.2, (Thomas et al. 2013)). We refer the reader to Tortora et al. (2018b) for more details about data selection and analysis.
We also use an external properly selected sample of local galaxies with analogous photometry and spectroscopy information, as control sample at z = 0. This is made of
There are other datasets that have been used to perform similar studies. In the following, we will compare our results with this independent literature, when available.
3 Correlation With Structural Parameters and Mass Probes
To characterize the central DM content in massive ETGs, we start looking for correlations among Mdyn/M∗ and galaxy parameters.
3.1 Results for Kilo Degree Survey and SPIDER Datasamples
We will consider first the results found using the KiDS dataset and compare these with the results obtained on the SPIDER dataset at z ∼ 0. In Figure 1 we show Mdyn/M∗ as a function of effective radius, stellar mass, and velocity dispersion. We fix the IMF to the Chabrier one, which implies that the measured Mdyn/M∗ trends correspond to a variation in the DM content. Red symbols represent the estimates of the KiDS sample with redshift z < 0.7 and masses log M∗/M⊙ > 11.2. Dashed blue lines with light blue-shaded regions represent the SPIDER sample, assuming g-band structural parameters. Error bars and the shaded regions are the 25–75th per cent quantiles. All the correlations are significant at more than 99 per cent. The best-fitted slopes of the correlations are also reported.
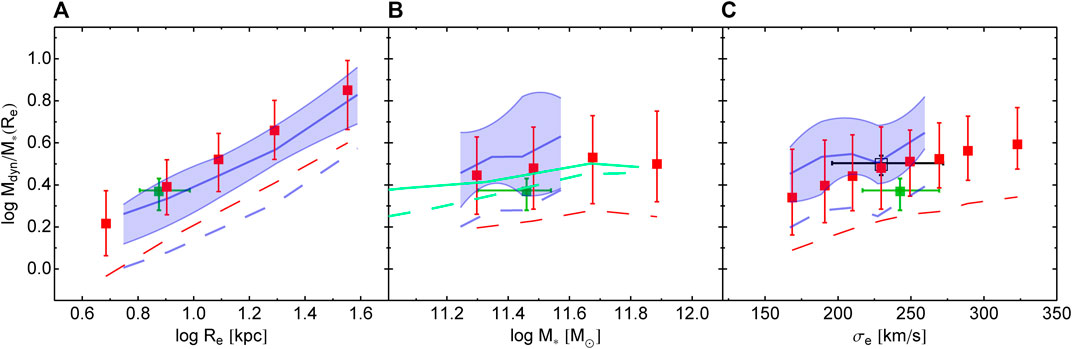
FIGURE 1. The total-to-stellar mass ratio Mdyn/M∗ within effective radius, Re, assuming a Chabrier IMF, as a function of Re (A), total stellar mass M∗ (B), and velocity dispersion within effective radius σe (C). Lines correspond to medians, and shaded regions or error bars to the 25–75th percentile. Red squares with error bars are for the whole KiDS sample. Dark blue line and light blue region are for SPIDER galaxies with M∗ > 1011.2 M⊙. Red and blue dashed lines are medians for KiDS and SPIDER galaxies adopting a Salpeter IMF. Green squares and error bars are for SLACS lenses from Auger et al. (2010a). The cyan lines in the middle panel are from IllustrisTNG simulated galaxies in Lovell et al. (2018): solid line is from the reference IllustrisTNG, while dashed one is for galaxies that, simulated within the full-physics IllustrisTNG simulation, are placed in their corresponding DM haloes simulated within the DM-only simulation. In the right panel, black open square and error bars are for the results obtained applying a Schwarzschild’s orbit superposition technique to ETGs in Thomas et al. (2011).
Figure 1 shows a tight and positive correlation between (the logarithm of) Mdyn/M∗ and Re with a slope α = 0.72. This can be interpreted as a physical aperture effect, where a larger Re subtends a larger portion of a galaxy DM halo (e.g., Napolitano et al., 2010, 2011). In practice, larger Re are found in galaxies with larger stellar mass; however, being these massive ETGs characterized by a steep halo-to-stellar mass relation (e.g., Moster et al., 2010), the halo DM mass is increasing too. The net effect is the observed positive correlation between Mdyn/M∗ and Re. A similar correlation can also be found for the Sérsic index (see Tortora et al. 2018b), due to the positive correlation existing between the n − index and effective radius (e.g., Tortora et al., 2012). However, if we plot Mdyn/M∗ as a function of Re and bin the galaxies in terms of the Sérsic index, then we see that there is a negligible dependence on n (this result is not shown in the figure for brevity). Because smaller effective radii correspond to higher stellar densities, this correlation with Re also translates into a sharp anticorrelation between DM content and central average stellar density, which has been reported for the first time in Tortora et al. (2012) and subsequently confirmed in Tortora et al. (2018b). Galaxies with the smallest Re (
Moving to the correlations of the Mdyn/M∗ with “mass” parameters, we find a shallow correlation with M∗, with an average Mdyn/M∗ ∼ 3 (i.e., 67 percent of DM) and slope of 0.11. We also find that Mdyn/M∗ correlates with σe (
The impact of the IMF is also shown: Mdyn/M∗ for a Salpeter IMF are plotted as dashed lines for both the KiDS and SPIDER samples, obtained by multiplying the stellar mass by a factor of 1.8 (Tortora et al., 2009). The change of IMF moves downward the Mdyn/M∗ of a factor
These trends are consistent with the ones found at z ∼ 0 using SPIDER galaxies (blue lines with shaded regions; Tortora et al., 2012), also confirming previous results reported in the literature at z ∼ 0 (e.g., Cappellari et al., 2006; Hyde and Bernardi 2009a; Tortora et al., 2009, 2012; Napolitano et al., 2010; Nigoche-Netro et al., 2016; Lovell et al., 2018), or at intermediate redshift (Auger et al., 2010a; Tortora et al., 2010b; Tortora et al., 2014b). The evolution with redshifts will be discussed in the next sections.
3.2 Comparison With the Literature
We compare our results with Mdyn/M∗ estimates from gravitational lensing of the SLACS sample with log M∗/M⊙ > 11.2 and average redshift of z ∼ 0.2 (Auger et al., 2009; 2010a). For a fair comparison, we have homogenized the lensing results, and derived medians and 25–75th percentiles. These are shown in Figure 1 with green symbols. A good agreement is clearly seen for the Mdyn/M∗–Re correlation, while we notice that at fixed M∗ and σe SLACS Mdyn/M∗ are smaller of
In the middle panel of Figure 1 we also compare our Mdyn/M∗ with the results from the state-of-the-art IllustrisTNG simulations from Lovell et al. (2018), which adopt a Chabrier IMF (cyan lines). The agreement with both SPIDER and KiDS galaxies is quite good, considered the uncertainties in observations and simulations.
In the right panel of the same figure we also show that the Mdyn/M∗–σe correlation for KiDS galaxies, and in particular for the SPIDER sample, is fairly consistent with the DM fractions from Schwarzschild’s orbit superposition models in axisymmetric potentials in Thomas et al. (2011) applied to a sample of 16 COMA ETGs.
In Figure 2 we expand the comparison of the Mdyn/M∗–Re with further theoretical and observational results, and investigate the impact of a non-Universal IMF. In particular, in the left panel we confirm one of the results presented in Figure 1 thanks to the comparison with Lovell et al. (2018): our DM fractions are fairly well consistent with the expectations from Wang et al. (2020), who also use IllustrisTNG. The IllustrisTNG sample also includes galaxies with log M∗/M⊙ < 11.2 and has smaller sizes; for this reason we find an overlap with the smallest galaxies in our sample. This result provides a further confirmation that the prescriptions adopted by IllustrisTNG are able to realistically provide a quite good agreement with observations. Moreover, the comparison with state-of-the-art observations is presented in Figure 2B, where we also compare with the recent results from Shajib et al. (2020), who determine the mass density slope and DM fraction of a sample of SLACS lenses, using their strong lensing data, velocity dispersions, and weak lensing constraints. These results are plotted as orange symbols. Shajib et al. (2020) show that most of the totality of SLACS galaxies are well fitted by a NFW profile with a Salpeter IMF. For this reason, we converted our Mdyn/M∗ into Salpeter-based versions in this panel. As a consistency check we also overplot the results from Auger et al. (2010a), using the same IMF and find a striking consistency of the two analyses.
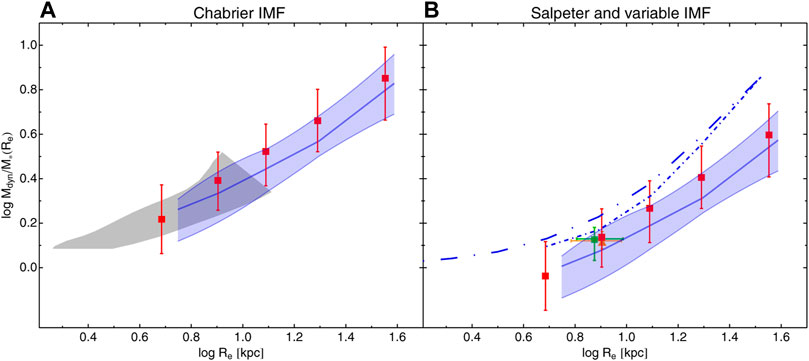
FIGURE 2. The total-to-stellar mass ratio Mdyn/M∗ within rest-frame effective radius, Re, as a function of rest-frame effective radius Re, assuming a Chabrier IMF (A) and Salpeter and variable IMF (B). Red and blue symbols are for KiDS and SPIDER, respectively. Following Figure 1, red squares with errors bars and solid lines with shaded regions adopt a fixed IMF (Chabrier and Salpeter in the two panels). Short-dashed-dotted is for IMF variable from Tortora et al. (2013) and Tortora et al. (2014a) with log M∗/M⊙ > 11.2, while long-dashed-dotted with log M∗/M⊙ > 10.5. The gray region is from IllustrisTNG (Wang et al., 2020), extracted from Figure 15 in Shajib et al. (2020); note that in that figure they only show results for Re ≲ 10 kpc. Orange triangle is from the lensing analysis in Shajib et al. (2020), in a good agreement with Auger et al.’s (2010a) results, plotted in green.
3.3 The Intruder: The Impact of Initial Mass Function
In Figure 1 we have shown that, on average the DM fractions are positive, independently of the IMF adopted. However, the fDM estimates present single cases where galaxies have negative fDM < 0, implying unphysical Mdyn (Re) < M∗(Re). In the KiDS dataset, only the
These indications cope with a large number of observational studies that in the last decade have suggested that IMF in ETGs is different from the one estimated by star counts in our Milky Way, where the standard forms for the IMF were identified (e.g., Kroupa 2001; Chabrier 2003). Now, this hypothesis of IMF universality is questioned by different lines of observational evidence, using completely independent data, as spectral features, galaxy dynamics, and gravitational lensing (e.g., Treu et al., 2010; Conroy and van Dokkum 2012; Cappellari et al., 2012, 2013a; Spiniello et al., 2012; Goudfrooij and Kruijssen 2013; La Barbera et al., 2013; Tortora et al., 2013, 2014a,c, 2018a; McDermid et al., 2014; Martín-Navarro et al., 2015; Corsini et al., 2017; Li et al., 2017). Among the others, using SPIDER data, we have found a larger stellar mass in the most massive galaxies (high-velocity dispersion) than that provided by a Milky-Way Chabrier IMF, which can be translated into a bottom-heavy IMF (Salpeter-like) or a larger dwarf-to-giant star ratio (Tortora et al., 2013). On the contrary, in ETGs with a low-velocity dispersion, the IMF resembles the one that is found in the Milky-Way. We have found that this very tight correlation with velocity dispersion is safe independently of the galaxy model adopted, and also in an alternative gravity scenario, in which DM is not included, as MOND (Tortora et al., 2014c) and Emergent Gravity (Tortora et al., 2018a). Despite these positive strong trends with σ and stellar mass (when this last takes into account of the dynamically inferred IMF), milder trends are found with Re, n, and M∗ when a fixed IMF is adopted for this latter (Tortora et al., 2014a).
If a strongly varying IMF as a function of velocity dispersion is translated into a central DM fraction, we find a fairly universal DM fraction, consistent with fDM ∼ 0.2 for a NFW profile DM halo1 with no further baryonic effects (e.g., adiabatic contraction, AC, Gnedin et al., 2004), or ∼ 0.4 if one accounts the physics of baryon collapse, e.g., via AC (Tortora et al., 2013). The positive correlation of DM fraction with mass has been typically invoked as the driver for the “tilt” of the ETG fundamental plane (Tortora et al., 2009), but it turns out that this latter can also be explained, also if partially, by a realistic DM halo model and a nonuniversal IMF.
Here, for the first time, in Figure 2B, we can show that, instead, the positive trend between Mdyn/M∗ and Re still survives if a nonuniversal IMF is adopted. And this is expected considering that, unlike the trend with σ, IMF varies mildly with Re. Short-dashed-dotted is for IMF variable from Tortora et al. (2013) and Tortora et al. (2014a) with log M∗/M⊙ > 11.2, while long-dashed-dotted with log M∗/M⊙ > 10.5. The Mdyn/M∗ values found in this way are slightly larger than those made with SPIDER and KiDS, and the results from lensing; however, at least a part of these discrepancies can be also ascribed by the fact that K-band is used, and thus using g-band the curves should move toward right.
4 Dark Matter Density, Dark Matter, and Total Mass Density Slope
Once deduced the DM content on the central regions of galaxies, one can check how this connects to the whole DM halo properties, e.g., as predicted from the cosmological simulations. This step is tricky because obtaining inferences on the total DM halo from the measurements in the center is impracticable. The only possible way is to assume some standard recipe for the DM halo and try to match the predictions from these recipes with the central DM inferences (see, e.g., (Tortora et al. 2009; 2012; 2014b; Napolitano et al. 2010)).
There are different mechanisms that can affect the central DM content and decouple it from the overall DM. In fact, the central fDM can also reflect the local conditions and thus the environment density at the time of initial halo collapse. Moreover, it is well known that baryons interact with DM, changing its distribution (as in the case of AC, (Gnedin et al. 2004)). From a practical point of view, the DM fraction is somewhat more strongly dependent on the particular values of Re for the stars rather than the DM properties directly. These effects imply strong degeneracies among the parameters in the galaxy models (see, e.g., Napolitano et al. 2010), and providing a quantitative comparison to the cosmological theory is a necessary but difficult task.
One direct way to investigate the DM halos and study their properties is to define its average density within some small radius, i.e., ⟨ρDM⟩. Following Napolitano et al. (2010) and Tortora et al. (2010b), we focus on the correlations of the average DM density with galaxy size and stellar mass for SPIDER and KiDS datasamples. Figure 3 shows that ⟨ρDM⟩ strongly anticorrelates with Re. Considering the aperture effect and assuming DM halo homogeneity, this implies that we are measuring a mean DM density profile with radius. In fact, as first discussed in Napolitano et al. (2010), if we assume a power-law for the DM profile, i.e., ρDM(r) ∝ rα, with α negative, then, with a little of algebra, for α > − 3 one finds MDM ∝ rα+3 and finally
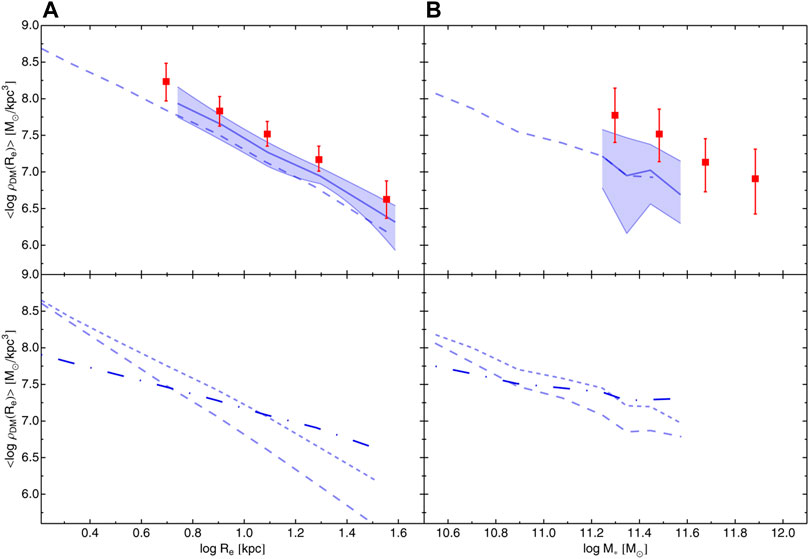
FIGURE 3. Average (log) DM density as a function of Re (A) and M∗ (B). In the top panels the KiDS data in red are compared with the SPIDER data in the same mass range. The dashed lines are plotted considering SPIDER galaxies with log M∗/M⊙ > 10.5 dex. g-band rest-frame structural parameters are used. In the bottom panel, instead, we focus on the SPIDER datasets. K-band structural parameters are used. Short- and long-dashed lines are the medians for a SIS and a constant-M/L. The point-dashed line is the result obtained fitting a NFW for DM halo and a free IMF.
A similar negative correlation is also obtained when the average densities are plotted as a function of stellar mass. The most massive galaxies are characterized by systematically lower values of the DM density; in fact, at increasingly higher masses, size gets bigger and bigger, lowering the DM average density. In both the panels, the more distant galaxies in the KiDS sample have, at fixed Re or M∗ larger average DM densities, also because of the systematically smaller sizes in these galaxies. The results for SPIDER galaxies are almost unchanged if the lower-mass cut of log M∗/M⊙ = 11.2 dex is removed (dashed lines).
In the bottom panels of Figure 3 we focus on the local SPIDER datasample and investigate the impact of different assumptions for galaxy model. Differently from the previous plots, we use here the K-band structural parameters to calculate the DM fractions. Consistently with the results in Tortora et al. (2009) and Tortora et al. (2012), we find that if we model the total mass distribution with a constant-M/L (long-dashed line), then the DM content is decreased with respect to an isothermal profile (short-dashed line). We notice that the trend with radius is steeper than the SIS profile when the constant-M/L is adopted, pointing to a slope of
We can now do a step forward, by comparing these correlations with the average DM densities obtained fitting a NFW. We recall that, in this case, we leave the IMF free to change, and assume a realistic cvir–Mvir and Mvir–M∗ correlations, to constrain the shape of the total mass profile at ≲ Re. In this case we find that to match the DM distribution of a NFW profile the total mass profiles of the most massive galaxies are well reproduced by an isothermal profile, while lower mass galaxies are better fitted by a constant-M/L, this implying a steeper mass density in the central regions. This result implies a DM non-homology in the central galaxy regions, i.e., the total mass density slope in ETGs is not universal and is a function of the stellar mass, a result that we had suggested in Tortora et al. (2009), and demonstrated in more detail in Tortora et al. (2014a). These results have been confirmed by independent observations and simulations (e.g., Remus et al., 2013; Dutton and Treu 2014; Wang et al., 2020). The steepest slopes are found at M∗ ∼ 3 × 10¹⁰ M⊙, while isothermal profiles are common in the most massive galaxies. This trend with mass may be related to a varying role of dissipation and galaxy mergers with galaxy mass (see also Tortora et al. 2019).
5 Evolution With Redshift
One firm evidence of the hierarchical scenario in a ΛCDM cosmology is the size and mass growth of galaxies with time, after the Big Bang (Daddi et al., 2005; Trujillo et al., 2006, 2007, 2011; Saglia et al., 2010; Tortora et al., 2014b, 2018b; Roy et al., 2018). These observations all seem to exclude a simple monolithic-like scenario, according to which the bulk of the stars is formed in a single dissipative event followed by a passive evolution, while they seem to support a scenario where galaxy evolution is mainly driven by merging, even though of different kind.
While the understanding of the stellar component of galaxies has been supported by a multiplicity of observational probes, basically measuring the properties of the light distribution in galaxies (e.g., La Barbera et al., 2010, Tortora et al., 2016, 2018c; Roy et al., 2018, and reference therein) and their stellar populations (e.g., Kauffmann et al., 2003; Gallazzi et al., 2005; Renzini 2006; Sánchez et al., 2012; Maraston et al., 2013), evidences about the growth of the DM with time come mainly from theory (e.g., Conroy and Wechsler 2009; Moster et al., 2010; Lovell et al., 2018) but there are yet little analyses trying to systematically study the evolution of size and mass of DM halo with redshift.
5.1 Evolution of the Dark Matter Fractions at Fixed Mass
In the previous paragraphs we have seen that the Mdyn/M∗, as well as the fDM, are tightly correlated to observables like the velocity dispersion and the (stellar or dark) masses. When studying the evolution of the galaxy DM fractions with redshift, one needs to estimate how much of this evolution is driven by the correlated quantities and how much by the actual mass assembly of galaxies. In Figure 4 we show the dependence on redshift of Re, σe, Mdyn/M∗, and ⟨ρDM⟩, at fixed stellar mass, using the KiDS sample as reference2. With respect to Tortora et al. (2018b), we show here the results for all the galaxies with log M∗/M⊙ > 11.2. First, we clearly see the effect of the size growth of galaxies, as the galaxy effective radii are smaller at earlier epochs and increase toward z = 0 (Daddi et al., 2005; Trujillo et al., 2006, 2007; Buitrago et al., 2008; van der Wel et al., 2008 see also Roy et al., 2018, for further details about size evolution in KiDS galaxies). To quantify this size-redshift relation, we can use a standard formula Re = Re, 0 (1 + z)α to fit the data. In the case of no progenitor bias correction (i.e., assuming that the same kind of galaxies has evolved from one redshift bin to another, red filled squares with error bars), we find a slope, α = − 2.4. If the progenitor bias is taken into account (i.e., galaxies observed today as passive systems might be active in earlier redshift bin, open squares with dashed red lines), the slope becomes shallower, i.e., α = − 1.8. This is because active/disk systems tend to have larger sizes than passive/spheroids systems at high − z, hence increasing the overall sizes at high − z and diluting the size-redshift relation. Overall, these measured slopes are steeper than other literature results for spheroid-like systems with M∗ > 1011 M⊙ (solid black line in the top panels in Figure 4; Trujillo et al., 2007; Conselice 2014). However, at low − z we find a good agreement with the Res from the local sample from SPIDER.
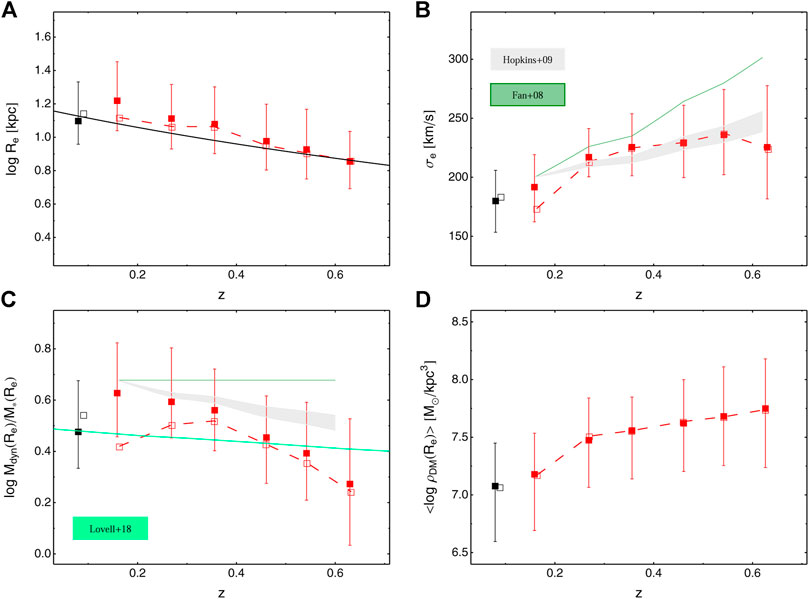
FIGURE 4. Evolution with redshift of (log) Re (A), σe (B), (log) Mdyn/M∗ (C), and (log) ⟨ρDM⟩ (D) for log M∗/M⊙ > 11.2. Red symbols are as in the previous figures. Open black square with error bar is median and 25–75th percentiles for SPIDER galaxies, while open black square is the median for the SPIDER sample when the progenitor bias is taken into account. The black solid line in the top panel is taken from the average Re/Re, 0–z trends (with Re, 0 = Re (z ∼ 0)) for spheroid-like galaxies in Trujillo et al. (2007) normalized to Re, 0 = 15 kpc. Shaded gray region and green line are our predictions using the merging model of Hopkins et al. (2009) and the “puffing-up” scenario from Fan et al. (2008), respectively. The cyan line in the bottom-left panel is for galaxies with a stellar mass of ∼ 1011M⊙ from IllustrisTNG simulations (Lovell et al., 2018). See explanations in the main text.
In Figure 4B, we plot the effective velocity dispersion, σe, as a function of the redshift. Here the evolution with redshift looks shallower than the one shown by the Re, with higher − z galaxies having slightly larger velocity dispersions than the lower − z ones (Cenarro and Trujillo 2009; Posti et al., 2014). We can quantify the σe − z evolution using the relation
The total-to-stellar mass ratio (assuming a Chabrier IMF) is plotted in Figure 4C. In this case we see that galaxies show a dominating DM content in their Res at lower redshift (i.e., 75–80% of DM at z ∼ 0.2), while the fDM are smaller at higher–z (40–50% at z ∼ 0.6). In this case we can use the relation
Going to the theoretical interpretation of these observed trends, we can compare them with the predictions from two different scenarios, typically adopted to explain the galaxy size evolution. First, the merging scenario (MS, hereafter), which predicts that size growth is driven by the accretion of matter as sizes of the merger remnants are larger than those of their progenitors. The merging model of Hopkins et al. (2009) also predicts that the velocity dispersion decreases as a consequence of the size growth as the relation
To check these predictions against the observed trends we need to derive the expected redshift dependences of velocity dispersions and Mdyn/M∗ on the redshift, starting from the Re–z relation from KiDS median values in panels a). We have used the best-fit Re − z relations discussed above and inserted into the σ∗(z) equation to derive the expected velocity dispersion in the two schemes. To obtain the Mdyn/M∗(z) relation we need to translate the predicted velocity dispersions into a Mdyn/M∗. This is done by solving the spherical Jeans equation (see Eq. 2), which includes 1) the 3D luminous density profile, and 2) the total potential, as a function of redshift. For the light distribution we have assumed a Sérsic profile with n = 4 for simplicity (i.e., a pure de Vaucouleurs) and the effective radius given by our interpolated Re(z) relation as defined above. For the total potential we have used the SIS model. By imposing that the velocity dispersion inferred by the Jeans equation (averaged within Re) equals the σ(z) in the two scenarios, MS and PS, we can obtain Mdyn and Mdyn/M∗ as a function of redshift. We remark here that in this calculation the relevant information we are interested in is the trend with redshift and not the normalization, which can be adjusted by hand, since in the σ∗(z) formulae the normalization factor is unspecified.
The predicted trends for σe and Mdyn/M∗ are plotted in Figure 4B,C. Here, the PS predicts a too strong evolution (with a variation of
To complement this analysis, we also compare the Mdyn/M∗–z trend with IllustrisTNG expectations from Lovell et al. (2018). Although the agreement with IllustrisTNG is quite good in terms of normalization, as confirmed by the analysis of the trends with M∗ and Re (Figures 1, 2), the simulations predict a change with redshift which is milder than what we find with KiDS data.
For the first time, in this article we also present the evolution with z of the average DM density. This is shown in Figure 4D, where for simplicity we limit to show the results for KiDS and SPIDER datasamples, without comparing with any toy-model. The average DM density within Re reaches its largest values at z ∼ 0.6 (
5.2 The Evolution of Size- and Dark Matter–Mass Relations: Constraints on Merger Scenario
In the previous section we have found evidence that simple recipes for the size growth and the velocity dispersion evolution in a merging scenario reproduce better the observed evolution of the dark-to-stellar mass ratio, at least for massive ETGs. In this section we want to check further the merging scenario and see whether we can gain more insight on the mechanisms driving the size and mass growth in massive ETGs. In particular, we want to focus on two scaling relations discussed in previous sections, the Re–M∗ and Mdyn/M∗–M∗, and figure out how galaxies evolve in this parameter space in response of the joint evolution of size and mass predicted by different kinds of merging events.
Indeed, dissipationless major mergers from simulations of elliptical galaxies have predicted that the DM fraction within a certain physical radius decreases mildly after the merger (Boylan-Kolchin et al., 2005). But they have also shown that the DM fraction within the final Re is greater than the DM fraction within the initial Re, because the total mass within Re, Mtot (Re), changes, after the merger, more than M∗(Re). The problem has been investigated in detail with hydrodynamic simulations by Hilz et al. (2013) who find that the equal-mass mergers produce a smaller size increase of multiple minor mergers. In particular, the variation of Re with respect to the initial radius, Re/R0, in terms of the variation of M∗ with respect to the initial stellar mass, M∗/M0, is found to be
We can test all these predictions against the Re–M∗ and Mdyn/M∗–M∗ relations (assuming a fixed Chabrier IMF) for KiDS galaxies at different redshifts, as shown in Figure 5. Blue, green, and red lines are for KiDS galaxies in three redshift bins 0.1 < z ≤ 0.3, 0.3 < z ≤ 0.5, and 0.5 < z ≤ 0.7. Here, we see that lower redshifts galaxies are larger in size and contain more DM in their cores at all values of M∗, confirming the trends in Figure 4. The trend is weaker if we consider the progenitor bias, which affects mostly the lowest redshift bin (dashed lines in Figure 4). We will check if mass, size, and total-to-stellar mass evolution in KiDS galaxies can be explained, consistently, through major or minor mergers.
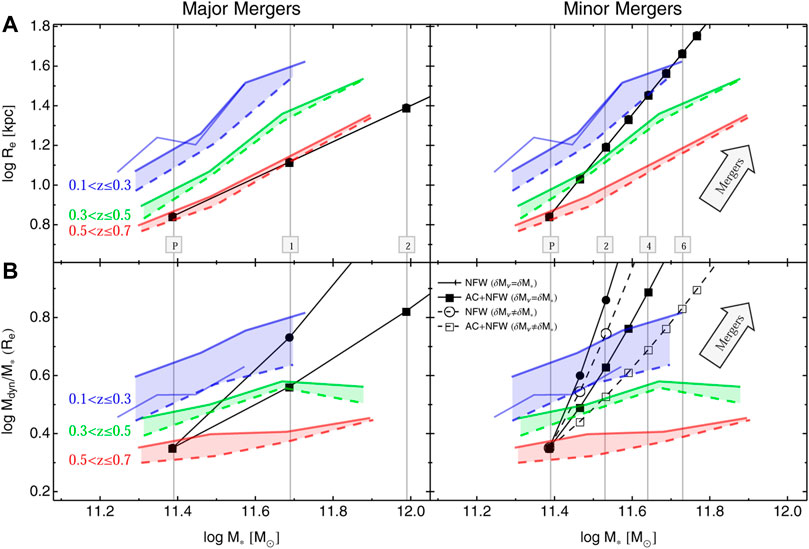
FIGURE 5. Evolution of Re–M∗ (A) and Mdyn/M∗–M∗ (B). Blue, green, and red lines are for galaxies in three redshift bins 0.1 < z ≤ 0.3, 0.3 < z ≤ 0.5, and 0.5 < z ≤ 0.7. Solid lines are medians for the full sample, while dashed lines are for results corrected for progenitor bias. The medians for SPIDER galaxies are plotted as thin blue lines. In the left (right) panels major (minor) toy-model merging predictions (discussed in the text) are drawn in black. We take, as example progenitor galaxy (P), the average galaxy at log M∗/M⊙ = 11.4 and evolve it according to the toy-models, the number of mergers is also indicated. In the bottom panels, dots and filled squares are for NFW and AC + NFW profiles when δM∗ = δMvir, and set the Re, M∗ and Mdyn/M∗ after each single merging event. In the bottom-right panel, open circles and squares are for the NFW and AC + NFW profiles when δM∗ ≠ δMvir. The direction of the merger effect is indicated with the arrows in the right panels. Updated and improved version of Figure 4 of Tortora et al. (2018b).
To reproduce these trends we need to account for the dark mass inside the effective radius, as we have to reproduce the Mdyn/M∗, where Mdyn = M∗ + MDM and the evolution of the Re/R0 vs. M∗/M0 is incorporated into the relations discussed above. To do that, we have constructed some simplified toy-models assuming that MDM ∝ Mvirrη around Re, with η ∼ 2 for a standard NFW and η ∼ 1.2 for a contracted NFW, hereafter AC + NFW according to (Boylan-Kolchin et al. 2005)]. We start assuming that the systems participating in merging (i.e., the progenitors) all have the same Mvir/M∗, which is reasonable for most of the stellar mass range covered by our sample, i.e., δMvir ≈ δM∗. However, we cannot exclude for the minor merging case that the virial mass changes at a different rate to the stellar mass, since the main galaxy is merging with another galaxy with a different Mvir/M∗.
Having all ingredients set, we have considered the evolution tracks related to the two different merging types: for the major merging we take the average evolution of Re in terms of M∗ evolution for the equal-mass merging, i.e.,
In Figure 5, we show the evolution tracks for a progenitor galaxy with log M∗/M⊙ = 11.4. Dots and squares are for NFW and AC + NFW profiles, respectively. In the left panels, the major merging tracks are shown as black lines with dots/squares indicating the events corresponding to masses δM∗ × M∗,0, with the mass increments δM∗ = 1, 2, 4, …, assuming that δMvir = δM∗. The first dot/square at log M∗/M⊙ = 11.4 corresponds to the initial progenitor galaxy. The second dot/square is the result of one major merger, which doubles the initial mass of the progenitor, while the third dot/square corresponds to a second major merger with mass 4 times the mass of the initial progenitor and 2 times the mass of the remnant of the first merging event. The minor merging tracks are shown in the right panels by black lines. Dots/squares indicate remnants with masses M∗,0 + δM∗ × M∗,0 where δM∗ = 0, 0.2, 0.4, 0.6, …, and we use two different increment laws for Mvir. In the top-right panel we use δMvir = δM∗. In the bottom-right panel filled symbols are for δMvir = δM∗, while open symbols correspond to δMvir = 0.05 δM∗. In this case we suppose that the initial progenitor galaxy with mass M∗,0 is experiencing a collection of minor mergers with galaxies having masses of 20 percent of M∗,0.
From these different tracks we can see that major mergers can be excluded, since the predicted evolution in size of a galaxy in the highest redshift bin (with z ∼ 0.6) and with stellar mass 1011.4 M⊙ is parallel to the size-mass relation in this same redshift bin (see Figure 5B).
On the contrary, the same galaxy can evolve to z ∼ 0.2 experiencing few (5 or 6) minor mergers, which accrete
This result suggests that our massive galaxies at z ∼ 0.6 have to merge with a population of less massive galaxies with lower total-to-stellar mass ratios. Abundance matching studies predict that galaxies with M∗ < 1011.4 M⊙ have, on average, smaller Mdyn/M∗ (see, e.g., Moster et al., 2010).
6 A Comment on Alternatives to Cold Dark Matter
In this article we have presented a dynamical analysis that allows us to derive constraints on the total mass in the central regions of ETGs from simple aperture velocity dispersion measurements (e.g., from fiber or multi-slit spectroscopy). As a starting working hypothesis we have assumed a strict Cold Dark Matter (CDM) paradigm (e.g., galaxies are hosted in cuspy NFW haloes with or without baryonic effects such as adiabatic contraction, see Section 4). In this scenario, our results point to a significant DM fraction within Re, which strongly depends on the assumptions made on the IMF. However, both the lack of direct evidence of the DM particle constituent and the presence of mismatches between predictions from the CDM and observations (e.g., the “missing satellite” problem, (Simon and Geha 2007), or the “too big to fail” problem, (Boylan-Kolchin et al. 2011)) have stimulated a wide range of alternative explanations, including different DM “flavors” (e.g., warm, self-interacting, or fuzzy DM: (Viel et al. 2013; Tulin and Yu 2018; Hu et al. 2000)) and even fully alternative to the DM (e.g., MOND: (Milgrom 2001; Tortora et al. 2014c)), Emergent Gravity: (Verlinde 2017), no-DM f(R) theories: (Napolitano et al. 2012).
Neither scenario, though, has found full observational or theoretical support. There are simulations adopting different DM flavors, or more complex cosmologies based on dark energy models or other alternative gravity theories. However, to our knowledge, these are not providing predictions for central DM fractions in massive ellipticals we can test against the data (Vogelsberger et al., 2020).
From the modeling point of view, there have been a few attempts to incorporate in dynamical analyses of ETGs, some of these alternative theories. For example, we have demonstrated that the outcomes of particular f(R) theories3, predicting an effective total potential including a Yukawa modification to the standard Newtonian potential, fit quite well the extended kinematic data of ellipticals (Napolitano et al., 2012). Moreover, in Tortora et al. (2014c) and Tortora et al. (2018a), we have shown that the central velocity dispersion of massive ETGs can be interpreted within such alternative scenarios to DM, if a non-universal IMF is considered. Interestingly, within these alternative theories, we find that a bottom-heavy (bottom-light) IMF is needed in the ETGs with the largest (smallest) σ, similarly to what is found within a standard ΛCDM paradigm.
7 Conclusion and Future Perspectives
In this article we have summarized a simple but accurate dynamical method based on Jeans equations (see Section 2.1), to estimate the DM content within 1 effective radius in early-type galaxies, making use of high quality (i.e., good seeing and high resolution) surface photometry and aperture internal kinematics (i.e., velocity dispersion). The method has been proved to reproduce results consistent with more accurate techniques (e.g., Schwarzschild’s orbital superposition, (Thomas et al. 2011; Tortora et al. 2018b)), if limited to the central effective radii, measuring DM fractions across cosmic time and constraining physical processes driving this evolution.
We have focused, in particular, on the study of the Mdyn/M∗ and fDM for massive ETGs (log M∗/M⊙ > 11.2, Chabrier IMF) as a function of redshift, discussing the impact of galaxy models and IMF. We base our conclusions on the results obtained with two reference samples of ETGs: one made of z ∼ 0 local galaxies from the SPIDER project (Tortora et al., 2012) and one assembled cross-matching KiDS photometry with SDSS and BOSS spectroscopy (Tortora et al., 2018b). We list below the main results.
• The DM fraction strongly correlates with different galaxy parameters, e.g., the effective radius, the total mass within the effective radius, the Sérsic index, the mean stellar density, while it has a milder correlation with stellar mass and velocity dispersion, if the IMF is taken constant (see Section 3). In particular we have found that more massive and larger galaxies have a larger amount of DM. However, looking at the Mdyn/M∗ vs. M∗ relation, a significant part of the scatter of the Mdyn/M∗ vs. M∗ relation comes from the variation of the Mdyn/M∗ with redshift at fixed mass (see below), hence containing crucial information on the galaxy assembly processes. These DM fractions are quite consistent with independent literature, as combined dynamical + lensing analysis (Auger et al., 2010a; Shajib et al., 2020) or simulations (e.g., Lovell et al., 2018; Wang et al., 2020).
• Different lines of evidences suggest that IMF is not universal and change with galaxy parameters. Mdyn/M∗ analysis presented in this article offers a simple way to reach this conclusion since higher stellar M/L normalizations, as those produced by a Salpter IMF, produce unphysical negative fDM for those systems that tend to have smaller sizes and masses (see also Tortora et al., 2013; Tortora et al., 2014b). If from one side the large variation of the IMF with velocity dispersion makes DM fraction constant with this parameter, the milder correlation with sizes produces a strong variation of DM fraction with size.
• The central mean DM density shows indications of cuspy DM haloes in both local and higher-redshift galaxies. Moreover, we have confirmed the evidences of a DM non-homology first discussed in Tortora et al. (2009), showing that observations prefer nearly isothermal total mass profiles at large masses and sizes and constant-M/L profiles at lower masses. This is consistent with a non-universality of the total mass density slope with mass. In fact, lower-mass galaxies, down to M∗ ∼ 3 × 10¹⁰ M⊙, present steeper profiles, and this can be explained by a varying role of dissipation and merging in terms of mass (Dutton and Treu 2014; Tortora et al., 2014a, 2019).
• DM fractions of massive ETGs decrease with redshift: at a given mass galaxies at higher redshift tend to have smaller Mdyn/M∗ than galaxies at lower redshift. On the contrary, because of the smaller Re at larger redshift, the average DM density is larger at higher redshift. We have demonstrated that this is an effect of minor merging of progenitor galaxies with lower-mass galaxies characterized by a smaller total-to-stellar mass ratio. Indeed, minor merging, unlike major merging, produces the correct growth of the galaxies moving from the highest redshift bin to the lower one and still supplies the necessary stellar mass for the stellar mass growth, but possibly a faster growth of the DM, which, combined with larger sizes, contributes to a faster growth of the overall Mdyn/M∗.
The results discussed are very promising in view of the plethora of new observations that will increase data for massive ETGs up to z = 1 and above. The simple Jeans modeling described here has the great advantage of being applicable to large galaxy samples with elementary measurements, which will be soon under the reach of all sky surveys either from ground (photometry: e.g., Vera Rubin observatory/LSST, (Ivezić et al. 2019); spectroscopy: StePS@WEAVE, (Costantin et al. 2019); 4MOST, (de Jong 2011); DESI, (DESI Collaboration et al. 2016) or from Space (photometry: Euclid, Laureijs et al., 2011; CSST, Zhan, 2018)). The disadvantage is that the methods cannot constrain the stellar orbital anisotropy (which is assumed in the analysis to be reasonably constantly equal to zero in the very galaxy centers, (Tortora et al. 2009)) and are limited to the inference of the total mass; thus, the DM halo properties are model dependent (e.g., Tortora et al., 2014a). This makes the method equivalent to “gravitational lensing” only analyses (see, e.g., Auger et al., 2010a). Hence, the two methods are often used in combination to break mutual degeneracies and/or derive constraints on the DM density slope (e.g., Shajib et al., 2020). However, if one is interested in collecting information on the DM content of very large samples, eventually up to millions of galaxies in the era of next-generation spectroscopic surveys, we have demonstrated in this article that the Jeans method has a great potential in providing DM estimates that can be used to test models for dark and stellar mass assembly (see, e.g., Section 5.2), with lower computation times with respect to more complex approaches. Furthermore, it can be easily adapted to test alternative theories of gravity or different DM flavor predictions.
However, on smaller samples, there are two different ways to obtain more precise constraints on the DM distribution. One consists in the combination of the Jeans analysis with strong gravitational lensing and stellar population. This will be possible with new samples of strong lenses that will be discovered in future wide-field observations (e.g., from Euclid and Rubin Observatory). In particular, Euclid is expected to find ∼ 170, 000 potential galaxy-scale gravitational lenses within the 15, 000 sq. deg. of the survey (Collett, 2005; Petrillo et al., 2019). For a large part of these systems a measure of spectroscopic redshifts and velocity dispersions will be available, providing us an exceptional dataset for the determination of DM fractions. A second one is offered by repeated observations on individual galaxies observations from multiple instruments/surveys (see, e.g., BOSS and LAMOST: Napolitano et al., 2020). In particular, the possibility of relying on different fiber/slit apertures will provide multiple constraints on the central mass profile of these galaxies, which can be eventually further improved if combined with lensing and/or high-spatial resolution from adaptive optics [e.g., MAVIS@VLT, (McDermid et al. 2020)].
Finally, the brightest possible future to push forward this kind of analysis will consist of deep spectroscopic surveys measuring velocity dispersions for lower-mass and higher-z ETGs, complementing what is only possible now at very high masses (M∗ ≳ 1011 M⊙) and z ≲ 0.7 (e.g., Tortora et al., 2018b). Collecting new observations for ETGs with M∗ ∼ 3 × 10¹⁰ M⊙ will allow us to map, as a function of cosmic time, the dynamical properties and the DM content of those galaxies that are characterized by the largest baryonic content and star formation efficiency. This “bimodality” mass scale, corresponding to a virial mass of ∼ 1012 M⊙, emerges from different kinds of observations and typically separates passive from star-forming systems, separating two mass regimes where galaxies are driven by different kinds of physical processes (e.g., Napolitano et al., 2005; Dekel and Birnboim 2006; Dekel et al., 2019; Tortora et al., 2019, and references therein). Going further below this characteristic mass scale, these observations, combined with current and future cosmological simulations, will allow us to describe the DM assembly of galaxies across a wide range of masses and redshifts within a single coherent galaxy formation framework.
Data Availability Statement
The raw data supporting the conclusion of this article will be made available by the authors, without undue reservation.
Author Contributions
CT and NRN have been involved in method preparation, data analysis and discussion of the results and perspectives.
Conflict of Interest
The authors declare that the research was conducted in the absence of any commercial or financial relationships that could be construed as a potential conflict of interest.
Publisher’s Note
All claims expressed in this article are solely those of the authors and do not necessarily represent those of their affiliated organizations, or those of the publisher, the editors and the reviewers. Any product that may be evaluated in this article, or claim that may be made by its manufacturer, is not guaranteed or endorsed by the publisher.
Footnotes
1We remind the reader that we fix the DM NFW halo using the cvir–Mvir correlation from N-body simulations in Macciò et al. (2008) and Mvir–M∗ correlations from abundance matching results in Moster et al. (2010), and finally use the Jeans equation to constrain the IMF normalization.
2We refer the reader to Tortora et al. (2018b) for the analysis of systematics and for a full description of data selection and analysis.
3These theories come from the generalization of the scalar invariant in the General Relativity.
References
Abazajian, K. N., Adelman-McCarthy, J. K., Agüeros, M. A., Allam, S. S., Allende Prieto, C., An, D., et al. (2009). The Seventh Data Release of the Sloan Digital Sky Survey. ApJS 182, 543. doi:10.1088/0067-0049/182/2/543
Alabi, A. B., Forbes, D. A., Romanowsky, A. J., Brodie, J. P., Strader, J., Janz, J., et al. (2016). The SLUGGS Survey: the Mass Distribution in Early-type Galaxies within Five Effective Radii and beyond. Mon. Not. R. Astron. Soc. 460, 3838–3860. doi:10.1093/mnras/stw1213
Auger, M. W., Treu, T., Bolton, A. S., Gavazzi, R., Koopmans, L. V. E., Marshall, P. J., et al. (2009). The Sloan Lens ACS Survey. IX. Colors, Lensing, and Stellar Masses of Early-type Galaxies. ApJ 705, 1099–1115. doi:10.1088/0004-637X/705/2/1099
Auger, M. W., Treu, T., Bolton, A. S., Gavazzi, R., Koopmans, L. V. E., Marshall, P. J., et al. (2010a). The Sloan Lens ACS Survey. X. Stellar, Dynamical, and Total Mass Correlations of Massive Early-type Galaxies. ApJ 724, 511–525. doi:10.1088/0004-637X/724/1/511
Auger, M. W., Treu, T., Gavazzi, R., Bolton, A. S., Koopmans, L. V. E., and Marshall, P. J. (2010b). Dark Matter Contraction and the Stellar Content of Massive Early-type Galaxies: Disfavoring "Light" Initial Mass Functions. ApJ 721, L163–L167. doi:10.1088/2041-8205/721/2/L163
Beifiori, A., Thomas, D., Maraston, C., Steele, O., Masters, K. L., Pforr, J., et al. (2014). Redshift Evolution of the Dynamical Properties of Massive Galaxies from SDSS-III/BOSS. ApJ 789, 92. doi:10.1088/0004-637X/789/2/92
Benson, A. J., Cole, S., Frenk, C. S., Baugh, C. M., and Lacey, C. G. (2000). The Nature of Galaxy Bias and Clustering. Monthly Notices R. Astronomical Soc. 311, 793–808. doi:10.1046/j.1365-8711.2000.03101.x
Boylan-Kolchin, M., Bullock, J. S., and Kaplinghat, M. (2011). Too Big to Fail? the Puzzling Darkness of Massive Milky Way Subhaloes. MNRAS 415, L40–L44. doi:10.1111/j.1745-3933.2011.01074.x
Boylan-Kolchin, M., Ma, C.-P., and Quataert, E. (2005). Dissipationless Mergers of Elliptical Galaxies and the Evolution of the Fundamental Plane. MNRAS 362, 184–196. doi:10.1111/j.1365-2966.2005.09278.x
Buitrago, F., Trujillo, I., Conselice, C. J., Bouwens, R. J., Dickinson, M., and Yan, H. (2008). Size Evolution of the Most Massive Galaxies at 1.7. ApJ 687, L61–L64. doi:10.1086/592836
Burkert, A. (1995). The Structure of Dark Matter Halos in Dwarf Galaxies. ApJ 447, L25. doi:10.1086/309560
Cappellari, M., Bacon, R., Bureau, M., Damen, M. C., Davies, R. L., de Zeeuw, P. T., et al. (2006). The SAURON Project--IV. The Mass-To-Light Ratio, the Virial Mass Estimator and the Fundamental Plane of Elliptical and Lenticular Galaxies. Monthly Notices R. Astronomical Soc. 366, 1126–1150. doi:10.1111/j.1365-2966.2005.09981.x
Cappellari, M., McDermid, R. M., Alatalo, K., Blitz, L., Bois, M., Bournaud, F., et al. (2012). Systematic Variation of the Stellar Initial Mass Function in Early-type Galaxies. Nature 484, 485–488. doi:10.1038/nature10972
Cappellari, M., McDermid, R. M., Alatalo, K., Blitz, L., Bois, M., Bournaud, F., et al. (2013a). The ATLAS3D Project - XX. Mass-Size and Mass-σ Distributions of Early-type Galaxies: Bulge Fraction Drives Kinematics, Mass-To-Light Ratio, Molecular Gas Fraction and Stellar Initial Mass Function. MNRAS 432, 1862–1893. doi:10.1093/mnras/stt644
Cappellari, M., Scott, N., Alatalo, K., Blitz, L., Bois, M., Bournaud, F., et al. (2013b). The ATLAS3D Project - XV. Benchmark for Early-type Galaxies Scaling Relations from 260 Dynamical Models: Mass-To-Light Ratio, Dark Matter, Fundamental Plane and Mass Plane. MNRAS 432, 1709–1741. doi:10.1093/mnras/stt562
Cardone, V. F., Del Popolo, A., Tortora, C., and Napolitano, N. R. (2011). Secondary Infall Model and Dark Matter Scaling Relations in Intermediate-Redshift Early-type Galaxies. MNRAS 416, 1822–1835. doi:10.1111/j.1365-2966.2011.19162.x
Cardone, V. F., and Tortora, C. (2010). Dark Matter Scaling Relations in Intermediate Z Haloes. MNRAS 409, 1570–1576. doi:10.1111/j.1365-2966.2010.17398.x
Cardone, V. F., Tortora, C., Molinaro, R., and Salzano, V. (2009). The Global Mass-To-Light Ratio of SLACS Lenses. Astron.Astrophys 504, 769–788. doi:10.1051/0004-6361/200811090
Chabrier, G. (2003). Galactic Stellar and Substellar Initial Mass Function. Publ. Astron. Soc. Pac. 115, 763–795. doi:10.1086/376392
Chabrier, G. (2001). The Galactic Disk Mass Budget. I. Stellar Mass Function and Density. ApJ 554, 1274–1281. doi:10.1086/321401
Collett, T. E. (2005). The Population of Galaxy-Galaxy Strong Lenses in Forthcoming Optical Imaging Surveys. ApJ 811, 20. doi:10.1088/0004-637X/811/1/20
Conroy, C., and van Dokkum, P. G. (2012). The Stellar Initial Mass Function in Early-type Galaxies from Absorption Line Spectroscopy. II. Results. ApJ 760, 71. doi:10.1088/0004-637X/760/1/71
Conroy, C., and Wechsler, R. H. (2009). Connecting Galaxies, Halos, and Star Formation Rates across Cosmic Time. ApJ 696, 620–635. doi:10.1088/0004-637X/696/1/620
Conselice, C. J. (2014). The Evolution of Galaxy Structure over Cosmic Time. Annu. Rev. Astron. Astrophys. 52, 291–337. doi:10.1146/annurev-astro-081913-040037
Corsini, E. M., Wegner, G. A., Thomas, J., Saglia, R. P., and Bender, R. (2017). The Density of Dark Matter Haloes of Early-type Galaxies in Low-Density Environments. Mon. Not. R. Astron. Soc. 466, 974–995. doi:10.1093/mnras/stw2935
Costantin, L., Iovino, A., Zibetti, S., Longhetti, M., Gallazzi, A., Mercurio, A., et al. (2019). A Few StePS Forward in Unveiling the Complexity of Galaxy Evolution: Light-Weighted Stellar Ages of Intermediate-Redshift Galaxies with WEAVE. A&A 632, A9. doi:10.1051/0004-6361/201936550
Courteau, S., Cappellari, M., de Jong, R. S., Dutton, A. A., Emsellem, E., Hoekstra, H., et al. (2014). Galaxy Masses. Rev. Mod. Phys. 86, 47–119. doi:10.1103/RevModPhys.86.47
Daddi, E., Renzini, A., Pirzkal, N., Cimatti, A., Malhotra, S., Stiavelli, M., et al. (2005). Passively Evolving Early‐Type Galaxies at 1.4 ≲z≲ 2.5 in the Hubble Ultra Deep Field. ApJ 626, 680–697. doi:10.1086/430104
de Jong, J. T. A., Kleijn, G. A. V., Erben, T., Hildebrandt, H., Kuijken, K., Sikkema, G., et al. (2017). The Third Data Release of the Kilo-Degree Survey and Associated Data Products. A&A 604, A134. doi:10.1051/0004-6361/201730747
de Jong, J. T. A., Verdoes Kleijn, G. A., Boxhoorn, D. R., Buddelmeijer, H., Capaccioli, M., Getman, F., et al. (2015). The First and Second Data Releases of the Kilo-Degree Survey. A&A 582, A62. doi:10.1051/0004-6361/201526601
Dekel, A., and Birnboim, Y. (2006). Galaxy Bimodality Due to Cold Flows and Shock Heating. Monthly Notices R. Astronomical Soc. 368, 2–20. doi:10.1111/j.1365-2966.2006.10145.x
Dekel, A., and Burkert, A. (2014). Wet Disc Contraction to Galactic Blue Nuggets and Quenching to Red Nuggets. MNRAS 438, 1870–1879. doi:10.1093/mnras/stt2331
Dekel, A., Lapiner, S., and Dubois, Y. (2019). Origin of the Golden Mass of Galaxies and Black Holes. arXiv e-prints , arXiv:1904.08431
Desi Collaboration, , Aghamousa, A., Aguilar, J., Ahlen, S., Alam, S., Allen, L. E., et al. (2016). The DESI Experiment Part I: Science, Targeting, and Survey Design. arXiv e-prints, arXiv:1611.00036
Domínguez Sánchez, H., Bernardi, M., Brownstein, J. R., Drory, N., and Sheth, R. K. (2019). Galaxy Properties as Revealed by MaNGA - I. Constraints on IMF and M∗/L Gradients in Ellipticals. MNRAS 489, 5612–5632. doi:10.1093/mnras/stz2414
Dutton, A. A., and Treu, T. (2014). The Bulge-Halo Conspiracy in Massive Elliptical Galaxies: Implications for the Stellar Initial Mass Function and Halo Response to Baryonic Processes. MNRAS 438, 3594–3602. doi:10.1093/mnras/stt2489
Fan, L., Lapi, A., De Zotti, G., and Danese, L. (2008). The Dramatic Size Evolution of Elliptical Galaxies and the Quasar Feedback. ApJ 689, L101–L104. doi:10.1086/595784
Gallazzi, A., Charlot, S., Brinchmann, J., White, S. D. M., and Tremonti, C. A. (2005). The Ages and Metallicities of Galaxies in the Local Universe. MNRAS 362, 41–58. doi:10.1111/j.1365-2966.2005.09321.x
Gavazzi, R., Treu, T., Rhodes, J. D., Koopmans, L. V. E., Bolton, A. S., Burles, S., et al. (2007). The Sloan Lens ACS Survey. IV. The Mass Density Profile of Early‐Type Galaxies Out to 100 Effective Radii. ApJ 667, 176–190. doi:10.1086/519237
Gnedin, O. Y., Kravtsov, A. V., Klypin, A. A., and Nagai, D. (2004). Response of Dark Matter Halos to Condensation of Baryons: Cosmological Simulations and Improved Adiabatic Contraction Model. ApJ 616, 16–26. doi:10.1086/424914
Goudfrooij, P., and Diederik Kruijssen, J. M. (2013). The Optical Colors of Giant Elliptical Galaxies and Their Metal-Rich Globular Clusters Indicate a Bottom-Heavy Initial Mass Function. ApJ 762, 107. doi:10.1088/0004-637X/762/2/107
Grillo, C., Gobat, R., Lombardi, M., and Rosati, P. (2009). Photometric Mass and Mass Decomposition in Early-type Lens Galaxies. A&A 501, 461–474. doi:10.1051/0004-6361/200811604
Grillo, C., and Gobat, R. (2010). On the Initial Mass Function and Tilt of the Fundamental Plane of Massive Early-type Galaxies. MNRAS 402, L67–L71. doi:10.1111/j.1745-3933.2009.00803.x
Grillo, C. (2010). Projected Central Dark Matter Fractions and Densities in Massive Early-type Galaxies from the Sloan Digital Sky Survey. ApJ 722, 779–787. doi:10.1088/0004-637X/722/1/779
Hilz, M., Naab, T., and Ostriker, J. P. (2013). How Do Minor Mergers Promote Inside-Out Growth of Ellipticals, Transforming the Size, Density Profile and Dark Matter Fraction? MNRAS 429, 2924–2933. doi:10.1093/mnras/sts501
Hopkins, P. F., Croton, D., Bundy, K., Khochfar, S., van den Bosch, F., Somerville, R. S., et al. (2010). Mergers in Λcdm: Uncertainties in Theoretical Predictions and Interpretations of the Merger Rate. ApJ 724, 915–945. doi:10.1088/0004-637X/724/2/915
Hopkins, P. F., Hernquist, L., Cox, T. J., Keres, D., and Wuyts, S. (2009). Dissipation and Extra Light in Galactic Nuclei. IV. Evolution in the Scaling Relations of Spheroids. ApJ 691, 1424–1458. doi:10.1088/0004-637X/691/2/1424
Hu, W., Barkana, R., and Gruzinov, A. (2000). Fuzzy Cold Dark Matter: The Wave Properties of Ultralight Particles. Phys. Rev. Lett. 85, 1158–1161. doi:10.1103/PhysRevLett.85.1158
Hyde, J. B., and Bernardi, M. (2009a). Curvature in the Scaling Relations of Early-type Galaxies. MNRAS 394, 1978–1990. doi:10.1111/j.1365-2966.2009.14445.x
Hyde, J. B., and Bernardi, M. (2009b). The Luminosity and Stellar Mass Fundamental Plane of Early-type Galaxies. MNRAS 396, 1171–1185. doi:10.1111/j.1365-2966.2009.14783.x
Ivezić, Ž., Kahn, S. M., Tyson, J. A., Abel, B., Acosta, E., Allsman, R., et al. (2019). LSST: From Science Drivers to Reference Design and Anticipated Data Products. ApJ 873, 111. doi:10.3847/1538-4357/ab042c
Javier Cenarro, A., and Trujillo, I. (2009). Mild Velocity Dispersion Evolution of Spheroid-like Massive Galaxies since Z ∼ 2. ApJ 696, L43–L47. doi:10.1088/0004-637X/696/1/L43
Kauffmann, G., Heckman, T. M., White, S. D. M., Charlot, S., Tremonti, C., Peng, E. W., et al. (2003). The Dependence of star Formation History and Internal Structure on Stellar Mass for 105low-Redshift Galaxies. MNRAS 341, 54–69. doi:10.1046/j.1365-8711.2003.06292.x
Koopmans, L. V. E., Bolton, A., Treu, T., Czoske, O., Auger, M. W., Barnabè, M., et al. (2009). The Structure and Dynamics of Massive Early-type Galaxies: On Homology, Isothermality, and Isotropy inside One Effective Radius. ApJ 703, L51–L54. doi:10.1088/0004-637X/703/1/L51
Koopmans, L. V. E., Treu, T., Bolton, A. S., Burles, S., and Moustakas, L. A. (2006). The Sloan Lens ACS Survey. III. The Structure and Formation of Early‐Type Galaxies and Their Evolution since Z ≈ 1. ApJ 649, 599–615. doi:10.1086/505696
Kroupa, P. (2001). On the Variation of the Initial Mass Function. Monthly Notices R. Astronomical Soc. 322, 231–246. doi:10.1046/j.1365-8711.2001.04022.x
La Barbera, F., de Carvalho, R. R., de La Rosa, I. G., Lopes, P. A. A., Kohl-Moreira, J. L., and Capelato, H. V. (2010). SPIDER - I. Sample and Galaxy Parameters in the grizYJHK Wavebands. MNRAS 408, 1313–1334. doi:10.1111/j.1365-2966.2010.16850.x
La Barbera, F., de Carvalho, R. R., Kohl-Moreira, J. L., Gal, R. R., Soares-Santos, M., Capaccioli, M., et al. (2008). 2DPHOT: A Multi-Purpose Environment for the Two-Dimensional Analysis of Wide-Field Images. Publ. Astron. Soc. Pac. 120, 681–702. doi:10.1086/588614
La Barbera, F., Ferreras, I., Vazdekis, A., de la Rosa, I. G., de Carvalho, R. R., Trevisan, M., et al. (2013). SPIDER VIII - Constraints on the Stellar Initial Mass Function of Early-type Galaxies from a Variety of Spectral Features. MNRAS 433, 3017–3047. doi:10.1093/mnras/stt943
Laureijs, R., Amiaux, J., Arduini, S., Auguères, J. L., Brinchmann, J., Cole, R., et al. (2011). Euclid Definition Study Report. arXiv e-prints , arXiv:1110.3193
Li, H., Ge, J., Mao, S., Cappellari, M., Long, R. J., Li, R., et al. (2017). SDSS-IV MaNGA: Variation of the Stellar Initial Mass Function in Spiral and Early-type Galaxies. ApJ 838, 77. doi:10.3847/1538-4357/aa662a
Liske, J., Baldry, I. K., Driver, S. P., Tuffs, R. J., Alpaslan, M., Andrae, E., et al. (2015). Galaxy and Mass Assembly (GAMA): End of Survey Report and Data Release 2. MNRAS 452, 2087–2126. doi:10.1093/mnras/stv1436
Lovell, M. R., Pillepich, A., Genel, S., Nelson, D., Springel, V., Pakmor, R., et al. (2018). The Fraction of Dark Matter within Galaxies from the IllustrisTNG Simulations. MNRAS 481, 1950–1975. doi:10.1093/mnras/sty2339
Macciò, A. V., Dutton, A. A., and van den Bosch, F. C. (2008). Concentration, Spin and Shape of Dark Matter Haloes as a Function of the Cosmological model:WMAP1, WMAP3 andWMAP5 Results. MNRAS 391, 1940–1954. doi:10.1111/j.1365-2966.2008.14029.x
Mamon, G. A., and Łokas, E. L. (2005). Dark Matter in Elliptical Galaxies - I. Is the Total Mass Density Profile of the NFW Form or Even Steeper? MNRAS 362, 95–109. doi:10.1111/j.1365-2966.2005.09225.x
Mamon, G. A., and Łokas, E. L. (2006). Erratum: Dark Matter in Elliptical Galaxies - I. Is the Total Mass Density Profile of the NFW Form or Even Steeper? MNRAS 370, 1581. doi:10.1111/j.1365-2966.2006.10647.x
Mandelbaum, R., Seljak, U., Kauffmann, G., Hirata, C. M., and Brinkmann, J. (2006). Galaxy Halo Masses and Satellite Fractions from Galaxy-Galaxy Lensing in the Sloan Digital Sky Survey: Stellar Mass, Luminosity, Morphology and Environment Dependencies. Monthly Notices R. Astronomical Soc. 368, 715–731. doi:10.1111/j.1365-2966.2006.10156.x
Maraston, C., Pforr, J., Henriques, B. M., Thomas, D., Wake, D., Brownstein, J. R., et al. (2013). Stellar Masses of SDSS-III/BOSS Galaxies at Z ∼ 0.5 and Constraints to Galaxy Formation Models. MNRAS 435, 2764–2792. doi:10.1093/mnras/stt1424
Marinoni, C., and Hudson, M. J. (2002). The Mass‐to‐Light Function of Virialized Systems and the Relationship between Their Optical and X‐Ray Properties. ApJ 569, 101–111. doi:10.1086/339319
Martín-Navarro, I., Barbera, F. L., Vazdekis, A., Falcón-Barroso, J., and Ferreras, I. (2015). Radial Variations in the Stellar Initial Mass Function of Early-type Galaxies. MNRAS 447, 1033–1048. doi:10.1093/mnras/stu2480
McDermid, R. M., Cappellari, M., Alatalo, K., Bayet, E., Blitz, L., Bois, M., et al. (2014). Connection between Dynamically Derived Initial Mass Function Normalization and Stellar Population Parameters. ApJ 792, L37. doi:10.1088/2041-8205/792/2/L37
McDermid, R. M., Cresci, G., Rigaut, F., Bouret, J.-C., De Silva, G., Gullieuszik, M., et al. (2020). Phase A Science Case for MAVIS – the Multi-Conjugate Adaptive-Optics Visible Imager-Spectrograph for the VLT Adaptive Optics Facility. arXiv e-prints , arXiv:2009.09242
Moster, B. P., Somerville, R. S., Maulbetsch, C., van den Bosch, F. C., Macciò, A. V., Naab, T., et al. (2010). Constraints on the Relationship between Stellar Mass and Halo Mass at Low and High Redshift. ApJ 710, 903–923. doi:10.1088/0004-637X/710/2/903
Naab, T., Johansson, P. H., and Ostriker, J. P. (2009). Minor Mergers and the Size Evolution of Elliptical Galaxies. ApJ 699, L178–L182. doi:10.1088/0004-637X/699/2/L178
Napolitano, N. R., Capaccioli, M., Romanowsky, A. J., Douglas, N. G., Merrifield, M. R., Kuijken, K., et al. (2005). Mass-to-light Ratio Gradients in Early-type Galaxy Haloes. MNRAS 357, 691–706. doi:10.1111/j.1365-2966.2005.08683.x
Napolitano, N. R., Capozziello, S., Romanowsky, A. J., Capaccioli, M., and Tortora, C. (2012). Testing Yukawa-like Potentials fromf(r)-Gravity in Elliptical Galaxies. ApJ 748, 87. doi:10.1088/0004-637X/748/2/87
Napolitano, N. R., D’Ago, G., Tortora, C., Zhao, G., Luo, A.-L., Tang, B., et al. (2020). Central Velocity Dispersion Catalogue of LAMOST-DR7 Galaxies. MNRAS 498, 5704–5719. doi:10.1093/mnras/staa2409
Napolitano, N. R., Romanowsky, A. J., Capaccioli, M., Douglas, N. G., Arnaboldi, M., Coccato, L., et al. (2011). The PN.S Elliptical Galaxy Survey: a Standard ΛCDM Halo Around NGC 4374?∗. MNRAS 411, 2035–2053. doi:10.1111/j.1365-2966.2010.17833.x
Napolitano, N. R., Romanowsky, A. J., and Tortora, C. (2010). The central Dark Matter Content of Early-type Galaxies: Scaling Relations and Connections with star Formation Histories. MNRAS 405, no. doi:10.1111/j.1365-2966.2010.16710.x
Navarro, J. F., Frenk, C. S., and White, S. D. M. (1996). The Structure of Cold Dark Matter Halos. ApJ 462, 563. doi:10.1086/177173
Nigoche-Netro, A., Ramos-Larios, G., Lagos, P., de la Fuente, E., Ruelas-Mayorga, A., Mendez-Abreu, J., et al. (2019). The Quantity of Dark Matter in Early-type Galaxies and its Relation to the Environment. MNRAS 488, 1320–1331. doi:10.1093/mnras/stz1786
Nigoche-Netro, A., Ramos-Larios, G., Lagos, P., Ruelas-Mayorga, A., de la Fuente, E., Kemp, S. N., et al. (2016). Dark Matter inside Early-type Galaxies as Function of Mass and Redshift. Mon. Not. R. Astron. Soc. 462, 951–959. doi:10.1093/mnras/stw1661
Padmanabhan, N., Seljak, U., Strauss, M. A., Blanton, M. R., Kauffmann, G., Schlegel, D. J., et al. (2004). Stellar and Dynamical Masses of Ellipticals in the Sloan Digital Sky Survey. New Astron. 9, 329–342. doi:10.1016/j.newast.2003.12.004
Petrillo, C. E., Tortora, C., Vernardos, G., Koopmans, L. V. E., Verdoes Kleijn, G., Bilicki, M., et al. (2019). LinKS: discovering galaxy-scale strong lenses in the Kilo-Degree Survey using convolutional neural networks. Mon. Not. R. Astron. Soc. 484, 3879–3896. doi:10.1093/mnras/stz189
Posti, L., Nipoti, C., Stiavelli, M., and Ciotti, L. (2014). The Imprint of Dark Matter Haloes on the Size and Velocity Dispersion Evolution of Early-type Galaxies. MNRAS 440, 610–623. doi:10.1093/mnras/stu301
Remus, R.-S., Burkert, A., Dolag, K., Johansson, P. H., Naab, T., Oser, L., et al. (2013). The Dark Halo-Spheroid Conspiracy and the Origin of Elliptical Galaxies. ApJ 766, 71. doi:10.1088/0004-637X/766/2/71
Renzini, A. (2006). Stellar Population Diagnostics of Elliptical Galaxy Formation. Annu. Rev. Astron. Astrophys. 44, 141–192. doi:10.1146/annurev.astro.44.051905.092450
Roy, N., Napolitano, N. R., Barbera, F. L., Tortora, C., Getman, F., Radovich, M., et al. (2018). Evolution of Galaxy Size-Stellar Mass Relation from the Kilo-Degree Survey. MNRAS 480, 1057–1080. doi:10.1093/mnras/sty1917
Ruszkowski, M., and Springel, V. (2009). The Role of Dry Mergers for the Formation and Evolution of Brightest Cluster Galaxies. ApJ 696, 1094–1102. doi:10.1088/0004-637X/696/2/1094
Saglia, R. P., Sánchez-Blázquez, P., Bender, R., Simard, L., Desai, V., Aragón-Salamanca, A., et al. (2010). The Fundamental Plane of EDisCS Galaxies. A&A 524, A6. doi:10.1051/0004-6361/201014703
Salpeter, E. E. (1955). The Luminosity Function and Stellar Evolution. ApJ 121, 161. doi:10.1086/145971
Salucci, P. (2019). The Distribution of Dark Matter in Galaxies. Astron. Astrophys Rev. 27, 2. doi:10.1007/s00159-018-0113-1
Sánchez, S. F., Kennicutt, R. C., Gil de Paz, A., van de Ven, G., Vílchez, J. M., Wisotzki, L., et al. (2012). CALIFA, the Calar Alto Legacy Integral Field Area Survey. A&A 538, A8. doi:10.1051/0004-6361/201117353
Shajib, A. J., Treu, T., Birrer, S., and Sonnenfeld, A. (2020). Massive Elliptical Galaxies at Z ∼ 0.2 Are Well Described by Stars and a Navarro-Frenk-White Dark Matter Halo. arXiv e-prints , arXiv:2008.11724
Shu, Y., Bolton, A. S., Brownstein, J. R., Montero-Dorta, A. D., Koopmans, L. V. E., Treu, T., et al. (2015). The Sloan Lens ACS Survey. XII. Extending Strong Lensing to Lower Masses. ApJ 803, 71. doi:10.1088/0004-637X/803/2/71
Simon, J. D., and Geha, M. (2007). The Kinematics of the Ultra‐faint Milky Way Satellites: Solving the Missing Satellite Problem. ApJ 670, 313–331. doi:10.1086/521816
Smith, R. J., Lucey, J. R., and Conroy, C. (2015). The SINFONI Nearby Elliptical Lens Locator Survey: Discovery of Two New Low-Redshift strong Lenses and Implications for the Initial Mass Function in Giant Early-type Galaxies★. MNRAS 449, 3441–3457. doi:10.1093/mnras/stv518
Sonnenfeld, A., Treu, T., Gavazzi, R., Suyu, S. H., Marshall, P. J., Auger, M. W., et al. (2013). The SL2S Galaxy-Scale Lens Sample. IV. The Dependence of the Total Mass Density Profile of Early-type Galaxies on Redshift, Stellar Mass, and Size. ApJ 777, 98. doi:10.1088/0004-637X/777/2/98
Spiniello, C., Trager, S. C., Koopmans, L. V. E., and Chen, Y. P. (2012). Evidence for a Mild Steepening and Bottom-Heavy Initial Mass Function in Massive Galaxies from Sodium and Titanium-Oxide Indicators. ApJ 753, L32. doi:10.1088/2041-8205/753/2/L32
Swindle, R., Gal, R. R., La Barbera, F., and de Carvalho, R. R. (2011). SPIDER. V. Measuring Systematic Effects in Early-type Galaxy Stellar Masses from Photometric Spectral Energy Distribution Fitting. Astronomical J. 142, 118. doi:10.1088/0004-6256/142/4/118
Thomas, D., Steele, O., Maraston, C., Johansson, J., Beifiori, A., Pforr, J., et al. (2013). Stellar Velocity Dispersions and Emission Line Properties of SDSS-III/BOSS Galaxies. MNRAS 431, 1383–1397. doi:10.1093/mnras/stt261
Thomas, J., Saglia, R. P., Bender, R., Thomas, D., Gebhardt, K., Magorrian, J., et al. (2009). Dark Matter Scaling Relations and the Assembly Epoch of Coma Early-type Galaxies. ApJ 691, 770–782. doi:10.1088/0004-637X/691/1/770
Thomas, J., Saglia, R. P., Bender, R., Thomas, D., Gebhardt, K., Magorrian, J., et al. (2011). Dynamical Masses of Early-type Galaxies: a Comparison to Lensing Results and Implications for the Stellar Initial Mass Function and the Distribution of Dark Matter. MNRAS 415, 545–562. doi:10.1111/j.1365-2966.2011.18725.x
Tortora, C., Cardone, V. F., and Piedipalumbo, E. (2007). Dynamical and Gravitational Lensing Properties of a New Phenomenological Model of Elliptical Galaxies. A&A 463, 105–118. doi:10.1051/0004-6361:20065552
Tortora, C., Koopmans, L. V. E., Napolitano, N. R., and Valentijn, E. A. (2018a). Testing Verlinde's Emergent Gravity in Early-type Galaxies. MNRAS 473, 2324–2334. doi:10.1093/mnras/stx2432
Tortora, C., La Barbera, F., Napolitano, N. R., de Carvalho, R. R., and Romanowsky, A. J. (2012). SPIDER - VI. The central Dark Matter Content of Luminous Early-type Galaxies: Benchmark Correlations with Mass, Structural Parameters and Environment. Monthly Notices R. Astronomical Soc. 425, 577–594. doi:10.1111/j.1365-2966.2012.21506.x
Tortora, C., La Barbera, F., Napolitano, N. R., Romanowsky, A. J., Ferreras, I., and de Carvalho, R. R. (2014a). Systematic Variations of central Mass Density Slopes in Early-type Galaxies. MNRAS 445, 115–127. doi:10.1093/mnras/stu1616
Tortora, C., La Barbera, F., Napolitano, N. R., Roy, N., Radovich, M., Cavuoti, S., et al. (2016). Towards a Census of Supercompact Massive Galaxies in the Kilo Degree Survey. Mon. Not. R. Astron. Soc. 457, 2845–2854. doi:10.1093/mnras/stw184
Tortora, C., Napolitano, N. R., Cardone, V. F., Capaccioli, M., Jetzer, P., and Molinaro, R. (2010a). Colour and Stellar Population Gradients in Galaxies: Correlation with Mass. MNRAS 407, 144–162. doi:10.1111/j.1365-2966.2010.16938.x
Tortora, C., Napolitano, N. R., Romanowsky, A. J., Capaccioli, M., and Covone, G. (2009). Central Mass-To-Light Ratios and Dark Matter Fractions in Early-type Galaxies. MNRAS 396, 1132–1150. doi:10.1111/j.1365-2966.2009.14789.x
Tortora, C., Napolitano, N. R., Romanowsky, A. J., and Jetzer, P. (2010b). Central Dark Matter Trends in Early-type Galaxies from Strong Lensing, Dynamics, and Stellar Populations. ApJ 721, L1–L5. doi:10.1088/2041-8205/721/1/L1
Tortora, C., Napolitano, N. R., Roy, N., Radovich, M., Getman, F., Koopmans, L. V. E., et al. (2018b). The Last 6 Gyr of Dark Matter Assembly in Massive Galaxies from the Kilo Degree Survey. MNRAS 473, 969–983. doi:10.1093/mnras/stx2390
Tortora, C., Napolitano, N. R., Saglia, R. P., Romanowsky, A. J., Covone, G., and Capaccioli, M. (2014b). Evolution of central Dark Matter of Early-type Galaxies up to Z ∼ 0.8. MNRAS 445, 162–174. doi:10.1093/mnras/stu1712
Tortora, C., Napolitano, N. R., Spavone, M., La Barbera, F., D’Ago, G., Spiniello, C., et al. (2018c). The First Sample of Spectroscopically Confirmed Ultra-compact Massive Galaxies in the Kilo Degree Survey. MNRAS 481, 4728–4752. doi:10.1093/mnras/sty2564
Tortora, C., Posti, L., Koopmans, L. V. E., and Napolitano, N. R. (2019). The Dichotomy of Dark Matter Fraction and Total Mass Density Slope of Galaxies over Five Dex in Mass. MNRAS 489, 5483–5493. doi:10.1093/mnras/stz2320
Tortora, C., Romanowsky, A. J., Cardone, V. F., Napolitano, N. R., and Jetzer, P. (2014c). MOND and IMF Variations in Early-type Galaxies from ATLAS3D. Monthly Notices R. Astronomical Soc. Lett. 438, L46–L50. doi:10.1093/mnrasl/slt155
Tortora, C., Romanowsky, A. J., and Napolitano, N. R. (2013). An Inventory of the Stellar Initial Mass Function in Early-type Galaxies. ApJ 765, 8. doi:10.1088/0004-637X/765/1/8
Treu, T., Auger, M. W., Koopmans, L. V. E., Gavazzi, R., Marshall, P. J., and Bolton, A. S. (2010). The Initial Mass Function of Early-type Galaxies. ApJ 709, 1195–1202. doi:10.1088/0004-637X/709/2/1195
Trujillo, I., Burkert, A., and Bell, E. F. (2004). The Tilt of the Fundamental Plane: Three-Quarters Structural Nonhomology, One-Quarter Stellar Population. ApJ 600, L39–L42. doi:10.1086/381528
Trujillo, I., Conselice, C. J., Bundy, K., Cooper, M. C., Eisenhardt, P., and Ellis, R. S. (2007). Strong Size Evolution of the Most Massive Galaxies since Z ∼ 2. MNRAS 382, 109–120. doi:10.1111/j.1365-2966.2007.12388.x
Trujillo, I., Ferreras, I., and de La Rosa, I. G. (2011). Dissecting the Size Evolution of Elliptical Galaxies since Z∼ 1: Puffing-Up versus Minor-Merging Scenarios. MNRAS 415, 3903–3913. doi:10.1111/j.1365-2966.2011.19017.x
Trujillo, I., Forster Schreiber, N. M., Rudnick, G., Barden, M., Franx, M., Rix, H. W., et al. (2006). The Size Evolution of Galaxies Sincez∼3: Combining SDSS, GEMS, and FIRES. ApJ 650, 18–41. doi:10.1086/506464
Tulin, S., and Yu, H.-B. (2018). Dark Matter Self-Interactions and Small Scale Structure. Phys. Rep. 730, 1–57. doi:10.1016/j.physrep.2017.11.004
van den Bosch, F. C., Yang, X., Mo, H. J., Weinmann, S. M., Macciò, A. V., More, S., et al. (2007). Towards a Concordant Model of Halo Occupation Statistics. MNRAS 376, 841–860. doi:10.1111/j.1365-2966.2007.11493.x
van der Wel, A., Holden, B. P., Zirm, A. W., Franx, M., Rettura, A., Illingworth, G. D., et al. (2008). Recent Structural Evolution of Early‐Type Galaxies: Size Growth Fromz= 1 Toz= 0. Astrophysical J. 688, 48–58. doi:10.1086/592267
Verlinde, E. (2017). Emergent Gravity and the Dark Universe. Scipost Phys. 2, 016. doi:10.21468/SciPostPhys.2.3.016
Viel, M., Becker, G. D., Bolton, J. S., and Haehnelt, M. G. (2013). Warm Dark Matter as a Solution to the Small Scale Crisis: New Constraints from High Redshift Lyman-αforest Data. Phys. Rev. D 88–043502. doi:10.1103/PhysRevD.88.043502
Vogelsberger, M., Marinacci, F., Torrey, P., and Puchwein, E. (2020). Cosmological Simulations of Galaxy Formation. Nat. Rev. Phys. 2, 42–66. doi:10.1038/s42254-019-0127-2
Wang, Y., Vogelsberger, M., Xu, D., Mao, S., Springel, V., Li, H., et al. (2020). Early-type Galaxy Density Profiles from IllustrisTNG - I. Galaxy Correlations and the Impact of Baryons. MNRAS 491, 5188–5215. doi:10.1093/mnras/stz3348
Xu, D., Springel, V., Sluse, D., Schneider, P., Sonnenfeld, A., Nelson, D., et al. (2017). The Inner Structure of Early-type Galaxies in the Illustris Simulation. MNRAS 469, 1824–1848. doi:10.1093/mnras/stx899
Keywords: dark matter - galaxies, galaxies: formation -, galaxies: evolution -, galaxies: elliptical, surveys - galaxies
Citation: Tortora C and Napolitano NR (2022) The Central Dark Matter Fraction of Massive Early-Type Galaxies. Front. Astron. Space Sci. 8:704419. doi: 10.3389/fspas.2021.704419
Received: 02 May 2021; Accepted: 14 October 2021;
Published: 03 January 2022.
Edited by:
Claudia Maraston, University of Portsmouth, United KingdomReviewed by:
Paolo Salucci, International School for Advanced Studies (SISSA), ItalyKazuharu Bamba, Fukushima University, Japan
Copyright © 2022 Tortora and Napolitano. This is an open-access article distributed under the terms of the Creative Commons Attribution License (CC BY). The use, distribution or reproduction in other forums is permitted, provided the original author(s) and the copyright owner(s) are credited and that the original publication in this journal is cited, in accordance with accepted academic practice. No use, distribution or reproduction is permitted which does not comply with these terms.
*Correspondence: N. R. Napolitano, bmFwb2xpdGFub0BtYWlsLnN5c3UuZWR1LmNu