LunaR: Overview of a versatile Raman spectrometer for lunar exploration
 E. A. Cloutis1*
  C. Caudill1
  E. A. Lalla2,3 J. Newman1 M. Daly2 E. Lymer2 J. Freemantle2 R. Kruzelecky4 D. Applin1 H. Chen4 S. Connell1 D. Fernandes5
  F. Giusto5
  J. Hawke4 J. Lamamry5 P. Murzionak4 A. Parkinson1
  Q.-Y. Peng4 N. Turenne1
  Z. U. Wolf1
- 1Centre for Terrestrial and Planetary Exploration, University of Winnipeg, Winnipeg, MB, Canada
- 2Centre for Research in Earth and Space Science, York University, Toronto, ON, Canada
- 3Canadensys Aerospace Corporation, Bolton, ON, Canada
- 4MPB Communications Inc, Pointe-Claire, QC, Canada
- 5Ispace, Tokyo, Japan
The LunaR concept study investigated the scientific value, feasibility, and deployment options for a Raman spectrometer on future lunar landed missions. It consists of a breadboard instrument that covers the 150–4000 cm−1 wavelength range with a resolution of ∼6 cm−1; Raman scattering is induced by a 532 nm continuous wave laser. The current conceptual design envisions the Raman spectrometer performing a downward-looking, 90-point one-dimensional across-track scan (±45°off nadir) of the lunar surface with the instrument mounted on the underside of a rover. A downward-looking context camera would provide information on the physical nature of targets interrogated by the Raman spectrometer and localization of the Raman spectra. Our laboratory investigations indicate that Raman spectroscopy is applicable to addressing a wide range of lunar surface exploration goals related to geology, in situ resource identification, and condensed volatile detection in diverse geological terrains, including permanently shadowed regions. Testing of a breadboard and commercial instrument on lunar samples and analogues indicates that a complete spectral scan of a target of interest can be completed in ∼90 min, permitting its use on even short-duration lunar landed missions. All of the major minerals present on the Moon can be detected, and in many cases their compositions can be quantified or constrained.
1 Introduction
Exploration of the Moon is being undertaken by a number of nations and organizations. It is an objective with wide international support (e.g., ISECG, 2018). Canada is among the various nations with an interest in participating in lunar exploration, and has made long-term commitments to this endeavor through various initiatives, largely through the Canadian Space Agency (CSA).
Among Canada’s commitments is a support program termed the Lunar Exploration Accelerator Program (LEAP) (https://www.asc-csa.gc.ca/eng/funding-programs/programs/leap/default.asp). This initiative aims to enable the Canadian space sector to develop and conduct science experiments designed for lunar conditions, to help prepare for robotic and human missions, advance and demonstrate innovative technologies in lunar orbit and on the Moon’s surface, and begin to develop technologies that will be required as part of future deep-space missions.
In the context of the LEAP program, a multi-institutional, multi-organizational collaboration has been working to advance both the Science Readiness Level (SRL) and Technology Readiness Level (TRL) of a Raman spectrometer to conduct surface exploration geared toward a variety of science goals and objectives on different landed assets. Our initiative, termed LunaR: A Versatile Raman Spectrometer for Lunar Exploration, was designed to address various issues related to advancing its operational readiness, which we report here.
The LunaR initiative involves researchers, engineers, scientists, and students from a variety of organizations. It is led by the University of Winnipeg (Winnipeg, Manitoba, Canada), in collaboration with York University (Toronto, Ontario, Canada), MPB Communications Inc. (Pointe Claire, Quebec, Canada), and ispace (headquartered in Tokyo, Japan).
2 Raman spectroscopy for lunar exploration
Our selection of a Raman spectrometer for lunar surface exploration was driven by several factors. The main ones were assessing whether Raman spectroscopy could address multiple lunar exploration objectives and goals as outlined by recent CSA prioritization exercises, such as the CSEW6 Steering Committee (2009) and Canadian Space Exploration (2017). Our assessment demonstrated that Raman spectroscopy would fulfill multiple Canadian (and international) priorities related to lunar exploration.
The main scientific and technical goals associated with LunaR are to: 1) demonstrate the information content inherent in Raman spectroscopy for a low volume/power/mass instrument for both sunlit and shadowed regions; 2) explore the ruggedization, and optimization of power, mass, and volume of a baseline flight instrument; 3) investigate a variety of augmentations to the baseline instrument; and 4) demonstrate its unique and desirable capabilities for a wide range of lunar landed missions (landers/rovers) in both sunlit and shadowed regions.
2.1 LunaR goals
A LunaR-type Raman spectrometer could offer many benefitsfor lunar prospecting, where addressing multiple science objectives is possible with a single landed instrument. The science objectives (SO) that were deemed achievable by LunaR included the following:
• SO-1: Determine the nature of any abiogenic organic molecules on the Moon
• SO-2: Determine the Raman signatures of any lunar abiogenic organic molecules
• SO-3: Determine the mineralogy of the landing site
• SO-4: Detect the presence of ilmenite
• SO-5: Detect the presence of water ice
• SO-6: Detect and characterize condensed volatiles
• SO-7: Detect the presence of olivine and orthopyroxene
• SO-8: Detect exogenic impactors and characterize their mineralogy
• SO-9: Detect electrostatically levitated dust
• SO-10: Characterize the mineralogy of the lunar swirls
• SO-11: Characterize individual lunar regolith components
The relevant priorities and associated mission goals assigned to LunaR are presented in the science traceability matrix (STM) (Table 1). The STM was used to drive instrument performance requirements. Some of the relevant performance requirements that derived from the STM include:
• Some of the science objectives can be attained over a limited wavelength range (e.g., SO-7), while others require a wider wavelength range (e.g., SO-10). Because the materials that may be encountered at a landing site may be more diverse than expected, it was felt prudent to specify a larger wavelength range. Identification of a particular material is strengthened by detecting as many Raman peaks as possible. This also argues for a wider wavelength range.
• An increased wavelength range adds very little additional data volume. For the baseline Raman instrument, increasing the long wavenumber limit from 1500 cm−1 to 3800 cm−1, and assuming 12-bit resolution and 6 cm−1 resolution, would increase data volume from ∼2700 bit to ∼7300 bits per spectrum. For a scan consisting of 90 data points, this would translate to an increase in data volume from ∼243,000 bits to ∼657,000 bits. This is less than the data volume of a single context image, which would consist of a ∼2 Mpixel sensor. At 12-bit resolution, a full-frame image would have a data volume of 24 Mbits.
• Using signal-to-noise to drive Raman instrument requirements is a more robust way to define the science requirements and instrument performance. This arises from the fact that Raman spectroscopy is a largely qualitative technique, best suited to determine whether a particular phase is present. It is difficult to translate Raman spectra into a lower detection limit or quantification because Raman spectra are highly sensitive to the physical properties of a target (Wang, 1999), and the lunar regolith is a complex mixture of different phases, grain sizes, porosities, and particle types.
• The spectral resolution outlined in the traceability matrix was driven by laboratory studies of Raman spectroscopy of lunar samples and components of the lunar surface, linked to the science objectives. Spectral resolution must also balance competing requirements: higher spectral resolution would require a higher integration time, may add additional mass to the instrument, and would generate more data points per spectrum. The selected spectral resolution balances these and other requirements. For instance, Raman peaks are generally a few cm−1 to a few tens of cm−1 wide. A number of minerals, such as olivine and pyroxene, show shifts in Raman peak positions as a function of composition, which are on the order of 10–50 cm−1 (described below). Because Raman peaks consist of multiple data points at the specified spectral resolution, simple curve fitting techniques to the data points that comprise these peaks should allow the actual peak position to be determined to within 2–3 cm−1. When all of these factors are considered together, the specified spectral resolution allows the science objectives to be met in a data-efficient manner.

TABLE 1. LunaR Science Traceability Matrix (STM) presenting space community priorities and the mission goals.
In an operational scenario, the Science Traceability Matrix guides the Science Intent and the exact operational component activities–precise measurements to be acquired on rock, regolith, ice, or other materials. The STM serves to deliver this guidance to directly achieve the science goals and objectives, and during operations this translates to the planned activities and sequences with the acquisition parameters necessary for Raman spectroscopy to meet those objectives. The following sections describe the specific Raman analyses necessary to discern materials and meet the needs of the system operators, the major Raman spectral features for the main minerals and phases expected to be found based on previous analyses of returned samples from Apollo missions and new measurements undertaken in our laboratory for this study. More details of this aspect of the study are the subject of a companion paper (Cloutis et al., in preparation).
2.2 Measurement needs
Raman emission peaks are directly linked to the properties of chemical bonds, such as between oxygen and other elements in oxy-anionic groups of minerals (e.g., SiO4, or PO4) and their structural symmetry. Determining whether a phase has been detected will depend on a number of factors, including spectral resolution, wavelength range, and signal-to-noise ratio. These will be the subject of a future paper focusing on the technical specifications of the LunaR instrument (Kruzelecky et al., in preparation). The major Raman peak positions are affected by any change in structural properties of the minerals, such as cation variations or substitutions in the crystalline structure due to pressure and temperature conditions present at the time of crystallization. The peak position variation depends on the mineral and the associated vibrational mode and can reach up to ∼30 cm−1 Raman shift (as described below for specific lunar materials). Calibrations have been done to estimate the compositional information from major Raman peak position shifts, e.g., Wang et al. (2001) for pyroxenes, Kuebler et al. (2006) for olivine, Freeman et al. (2008) for feldspars, Jolliff et al. (2006) for phosphates, and Wang et al. (2004) for oxides (Table 2). Compared to visible and near-infrared spectroscopy, Raman spectroscopy produces sharper and less blended peaks, making it better suited to detect specific phases and compositional variations with better accuracy.
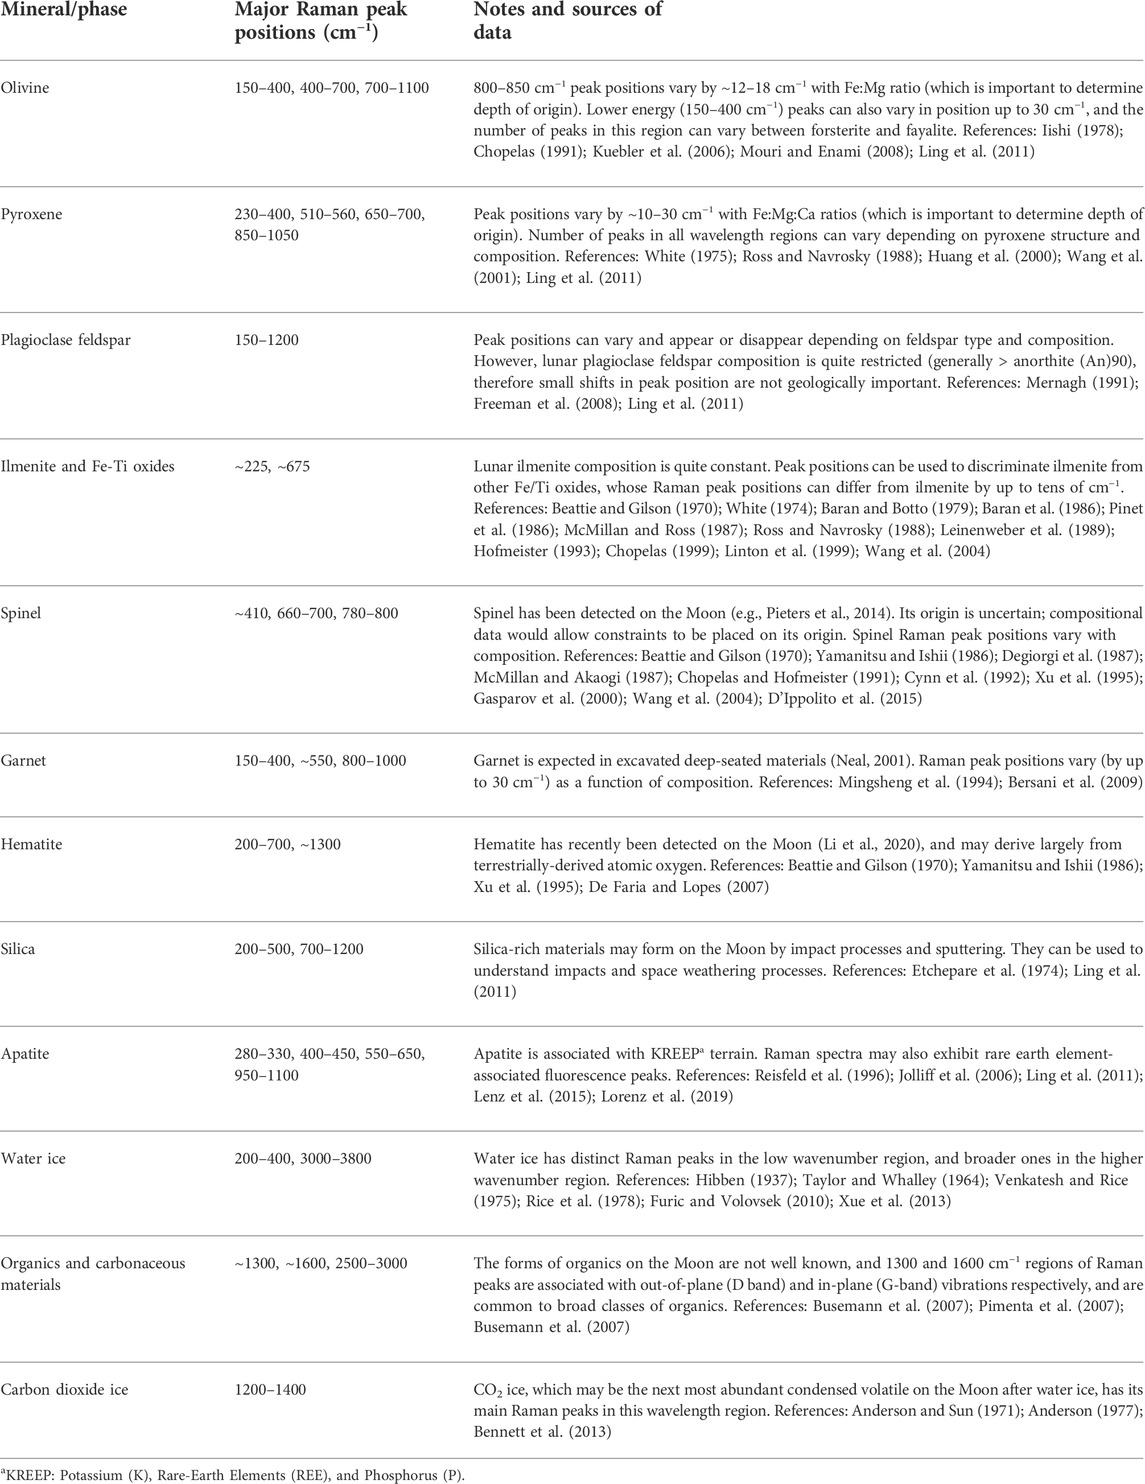
TABLE 2. Major peaks detected in Raman spectra of minerals and phases of interest for lunar application.
2.3 In-house Raman analysis of lunar samples
To fully define the functional requirements for LunaR, we relied on multiple data sources, including previously published Raman spectra of Apollo lunar samples and mineral separates, lunar meteorites, and terrestrial analogues (referenced below). Detailed results will be presented in Cloutis et al. (in preparation).
To further define the instrument performance requirements, we acquired Raman spectra in-house of lunar-relevant minerals and lunar meteorites. Such meteorites extend the range of compositions of Apollo samples and also allow us to relate composition to specific spots on a sample. They also allow us to compare spectra of whole rocks and powders, so that we can better explore the effects of differences in physical properties (e.g., powder versus rock) on Raman data quality and mineral detectability. To this end, we acquired several lunar meteorites for Raman analyses within the development of LunaR (Table 3). For this analysis, we used a BWTek iRaman 532 nm instrument (Cloutis et al., 2018).
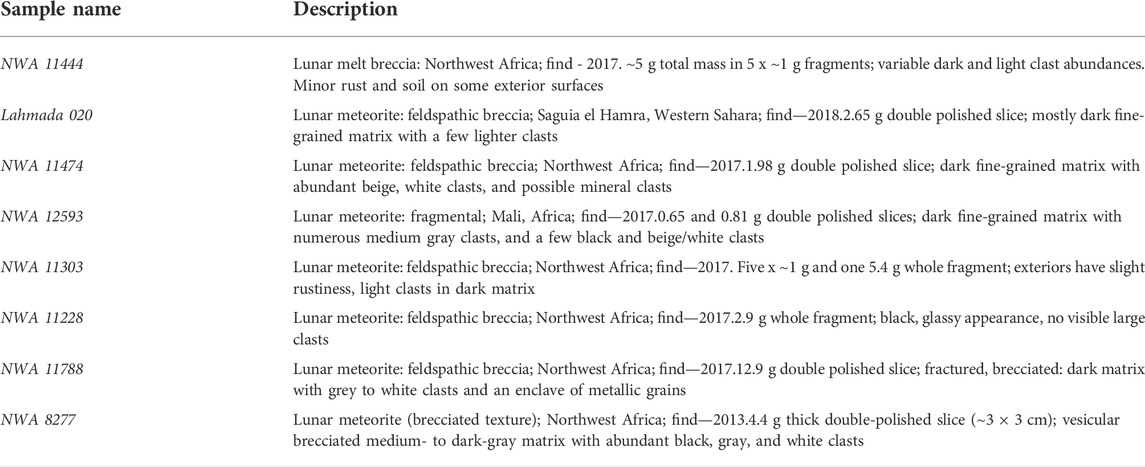
TABLE 3. Lunar meteorites used in this study.
Figure 1 shows an image of one of our lunar meteorites and Raman spectra of visually diverse spots on its surface (Figure 2). Raman spectra were acquired on a rough saw-cut surface of the interior of lunar breccia meteorite NWA 12593. The roughened surface allows us to avoid specular reflections, and while this slab does not fully capture the complexities of rocks on the lunar surface (which may have patinas from space weathering or adhering surface powders), it provides a first-order examination of how a Raman spectrometer may perform on the lunar surface. We are conducting follow-on studies using a suite of Apollo <1 mm lunar regolith samples for better assessment of LunaR’s performance on the lunar surface, and these results will be presented in a follow-on paper. The color points in Figure 1 mark the positions where the acquisitions were performed and match their respective Raman spectra shown in Figure 2. Detailed results of the Raman analysis of this sample will be presented in Cloutis et al. (in preparation).
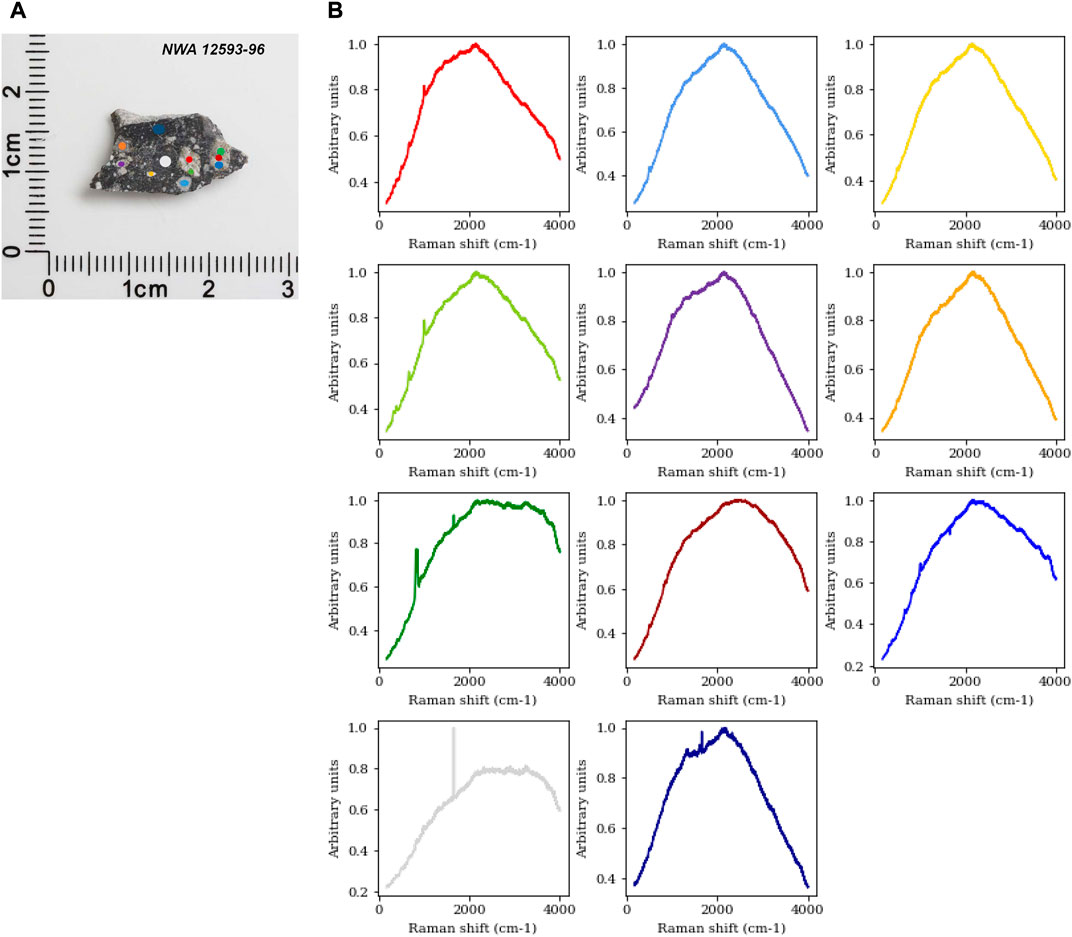
FIGURE 1. (A) Image of a slab of the NWA 12593 lunar meteorite showing the positions of the Raman spectroscopy acquisitions. (B) Raman spectra of selected spots on the NWA 12593 meteorite. The intensity has been normalized to the maximum value. The spectra were acquired with a 532 nm excitation laser. The spectra correspond to the various spots on the slab shown in (A).
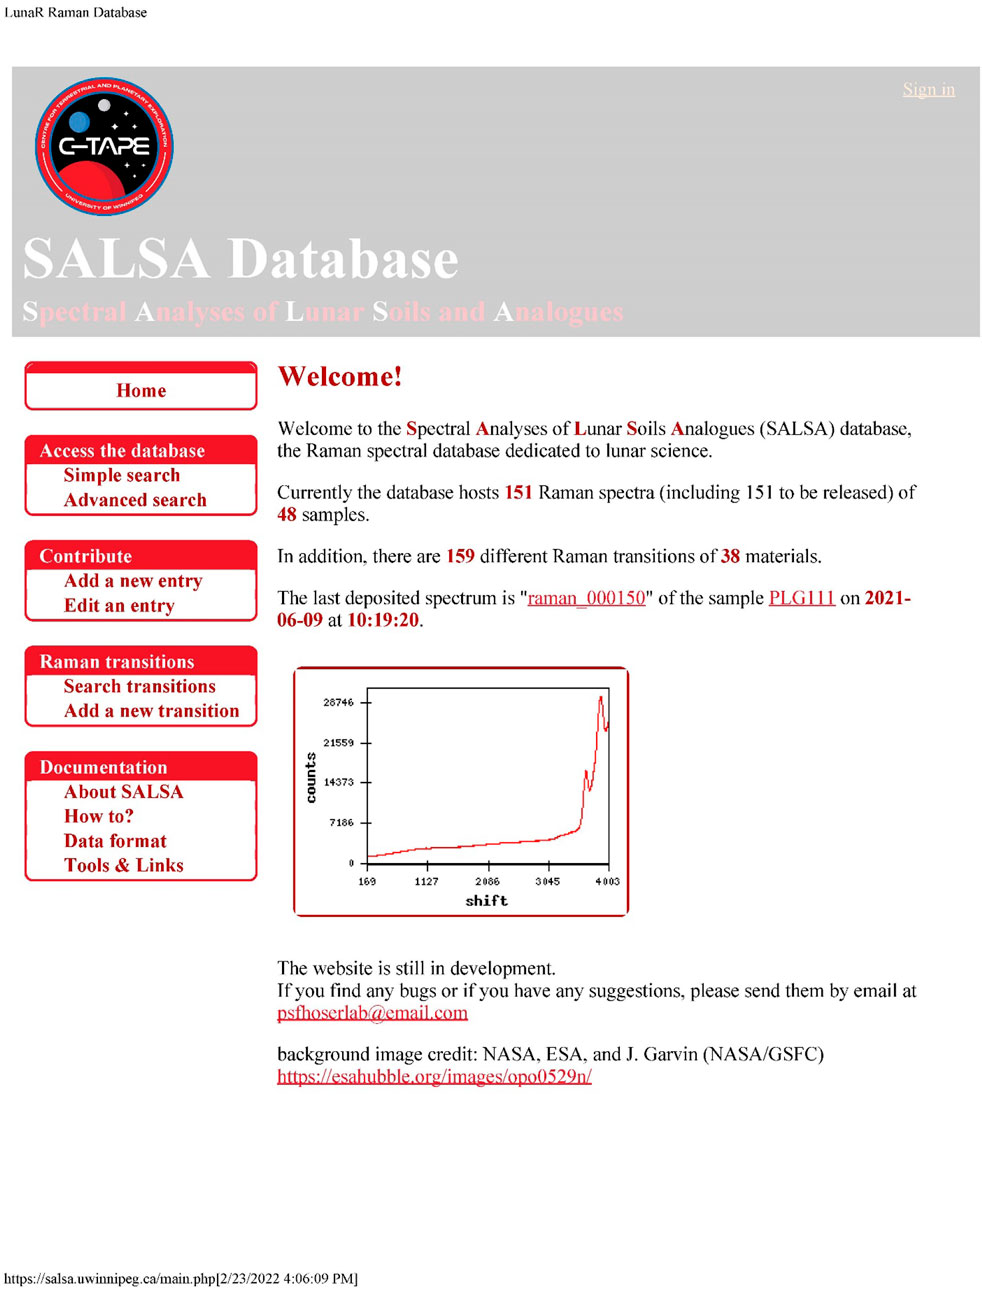
FIGURE 2. Screen shot of the home page of the Spectral Analysis of Lunar Soils and Analogues database dedicated to the LunaR Raman data (https://salsa.uwinnipeg.ca/main.php).
2.4 Previous Raman analyses of lunar samples
The use of Raman spectroscopy for lunar exploration is scientifically valuable because of its ability to provide information on minerals at the molecular level and its sensitivity to mineral structure (e.g., Perry et al., 1972; Haskin et al., 1997; Ling et al., 2011; Wang et al., 2015; Chou and Wang, 2017). Raman is also favorable for lunar exploration because it can be conducted with no sample preparation requirements. It also has the ability to perform rapid analysis within several seconds at spatial and spectral resolutions relevant to lunar science and exploration goals (Ling et al., 2011; Wang et al., 2015; Chou and Wang, 2017). The ability to provide data at a spatial resolution of tens to hundreds of microns makes it suitable for the identification of the primary mineralogy on a single-grain basis, as well as at a sub-grain resolution to identify any inclusions, or for analysis of complex multi-component grains (Perry et al., 1972; Haskin et al., 1997; Ling et al., 2011; Chou and Wang, 2017).
Raman spectra also do not exhibit the broad overlapping of features caused by overtones and combinations of modes that are seen in other forms of analysis, such as visible-near infrared-infrared spectroscopy (Haskin et al., 1997; Ling et al., 2011). Thus, Raman spectroscopy can enable more straightforward mineral phase identification within mixtures such as soils and rocks (Haskin et al., 1997; Ling et al., 2011).
Raman spectroscopy has been applied to the analysis of lunar samples for decades, beginning with Raman analysis of Apollo 11 and 12 samples, and later to Apollo 14 to 17 samples (Estep et al., 1972; Perry et al., 1972; Chou and Wang, 2017; Wang et al., 2019). Even with the technical limitations of Raman technology at the time, Raman spectroscopy excelled at detecting minerals and phases commonly found on the Moon, such as olivine, pyroxene, feldspar, and silicate glasses (Estep et al., 1972; Perry et al., 1972; Chou and Wang, 2017; Wang et al., 2019).
As Raman technology advanced, Raman spectroscopy became more popular for interplanetary exploration (Estep et al., 1972; Perry et al., 1972; Haskin et al., 1997; Ling et al., 2011; Wang et al., 2015; Chou and Wang, 2017; Wang et al., 2019), with Raman systems deployed on a number of landed planetary missions, such as Perseverance (Bhartia et al., 2021; Wiens et al., 2021) and the upcoming ExoMars mission (Rull et al., 2017). Its ability to separately identify olivine, pyroxene, and feldspars present in lunar and terrestrial basalts, because of the narrow Raman peak widths of these minerals, allowed for direct and unambiguous mineral identifications (Estep et al., 1972; Perry et al., 1972; Haskin et al., 1997; Ling et al., 2011; Wang et al., 2015; Chou and Wang, 2017).
Raman analysis of Apollo samples has allowed for the determination between clinopyroxenes which were seen within the Apollo 11 sample (10,059), and orthopyroxenes in Apollo 12 (12,002; 12,065) and Apollo 14 (14,310) samples (Perry et al., 1972).
Ling et al. (2011) conducted a study focusing on mineral detection using Raman spectroscopy of four whole-rock Apollo 14, 15, 16, and 17 samples. Pyroxene, olivine, and feldspars were detected, identified, and further subcategorized on the basis of elemental differences. This information allowed for the differentiation of clinopyroxenes from orthopyroxenes, understanding the origins of olivine through the comparison of Mg/(Mg + Fe) ratios, and the identification of several feldspar groupings. Ling et al. (2011) detected major, minor, and trace minerals through Raman analysis with additional information on the compositional distributions seen for olivine and pyroxene minerals. Similar results were reported by Haskin et al. (1997), where the type of pyroxene (clinopyroxene and orthopyroxene) was identified, and the use of compositional differences was demonstrated for olivine minerals.
Several studies have also focused on Raman spectroscopy for the analysis of lunar meteorites. This has allowed for a more diverse understanding of lunar materials beyond those collected by the Apollo and Luna missions (Righter et al., 2005; Gyollai et al., 2009; Huidobro et al., 2018; Smith et al., 2018; Chen et al., 2019). These studies further confirmed the ability of Raman spectroscopy to determine the mineralogy of lunar samples (Gyollai et al., 2009; Smith et al., 2018; Chen et al., 2019), and the effects of lunar surface modification processes such as weathering, physical-chemical processes (Huidobro et al., 2018), igneous petrology, and bombardment history (Righter et al., 2005; Chen et al., 2019).
2.4.1 Induced fluorescence and rare Earth elements
One potential issue regarding a limitation of Raman spectroscopy is the possibility of induced fluorescence. Sources of induced fluorescence include: 1) the presence of organic molecules trapped within porous materials such as clay, or 2) electronic transitions modes of REEs or transition metals (Chou and Wang, 2017; Wang et al., 2019). However, extraterrestrial materials, such as lunar samples, have 10 to 100 times weaker fluorescence emissions compared to terrestrial clay samples; thus, induced fluorescence is felt to be less problematic for lunar versus terrestrial samples (Wei et al., 2015).
REEs are concentrated in KREEP terrains (Wieczorek and Phillips, 2000). The most extensive KREEP-rich area on the Moon underlies the Oceanus Procellarum and Imbrium Basin region on the lunar nearside (the Procellarum KREEP Terrain, PKT) (Wieczorek and Phillips, 2000). KREEP likely includes 20–25 parts per million of rubidium, and a concentration of the element lanthanum that is 300–350 times the concentrations found in carbonaceous chondrites (Warren and Wasson, 1979; Wieczorek and Phillips, 2000). The majority of lunar samples (Apollo, Luna, or meteoritic samples) contain REE-bearing minerals as trace phases, e.g., apatite and/or merrillite, with merrillite potentially contributing up to 3% of the PKT (Wieczorek and Phillips, 2000). Other REE-bearing lunar phases include monazite, yittrobetafite (up to 94,500 ppm yttrium), and tranquillityite (up to 4.6 wt% yttrium, up to 0.25 wt% neodymium) (Heiken et al., 1991). KREEP terrains are targets of economic interest, as they may contain exploitable deposits of REEs and related elements that are incompatible with highland and mare rock types (Wieczorek and Phillips, 2000). The PKT region has the potential to yield higher REE concentrations at local scales (<10 s of kms) (McLeod and Krekeler, 2017).
McCubbin et al. (2010) showed that for Apollo sample 15,058,128, REE induced fluorescence peaks were detected and could be assigned to Sm3+, Eu3+, and Pr3+. This indicates that a visible region spectrometer, as is present in LunaR, could be used as a detection and prospecting tool for REEs.
2.5 Raman spectroscopy of lunar phases
This section describes the major Raman spectral features for the main minerals and phases expected to be found on the Moon and detectable by Raman spectroscopy (e.g., Basaltic Volcanism Study Project, 1981; Heiken et al., 1991).
2.5.1 Pyroxenes
Lunar pyroxenes are compositionally variable solid silicates that can incorporate Mg, Fe, or Ca, and a number of other elements in their structure. Pyroxenes are classified based on their crystal structure: the monoclinic pyroxenes (or clinopyroxenes, which includes species such as augite, diopside, hedenbergite, high-temperature pigeonite), and the orthorhombic pyroxenes (or orthopyroxenes, which include species such as inverted pigeonite, enstatite, bronzite, and hypersthene) (Deer et al., 1997). Raman spectra of pyroxenes typically exhibit two strong peaks in the 1000–1010 cm−1 and 650–670 cm−1 Raman shift ranges (Ling et al., 2011). The ∼1000 cm−1 peak corresponds to the symmetric stretching vibration mode of the Si-O bond in SiO4 tetrahedra, and the 670 cm−1 peak is assigned to the symmetric stretching vibration of Si-O-Si bonds in (Si2O6)n chains (White, 1975). The ∼670 cm−1 peak appears as a singlet for clinopyroxenes, and as a doublet for orthopyroxenes, with the second component at 650 cm−1, reflecting the different types of chain structure (Wang et al., 2001). A third Raman feature, weaker and broader than the others, at 320 cm−1, can be used in conjunction with the other Raman peaks to determine the Mg/(Mg + Fe + Ca) and Ca/(Mg + Fe + Ca) ratio (Wang et al., 1995, 2001). See Table 2 for a summary of pyroxene Raman spectral properties.
2.5.2 Olivine
Olivine has an orthorhombic structure that incorporates Fe and Mg atoms in complete solid solution (Papike 1987). Its Raman features are divided into three spectral regions: <400 cm−1, 400–700 cm−1, and 700–1100 cm−1 (Table 2). The peaks below 400 cm−1 are associated with the lattice modes: the rotational and translational motions of SiO4 as a unit, and the translational motions of octahedral cations (Mg2+, Fe2+) in the crystal lattice. The peaks between 400 and 700 cm−1 are attributed to the internal bending vibrational modes of the SiO4 ionic groups (Chopelas, 1991).
The peaks between 700 and 1100 cm−1 (near 800–850 and 900–950 cm−1) are assigned to the internal stretching vibrational modes of the SiO4 ionic group. The dominant features in this spectral region appear as a doublet near 820 and 850 cm−1 and another weaker doublet at 920 and 950 cm−1 (Iishi 1978; Chopelas 1991; Ling et al., 2011). The 820–850 cm−1 doublet feature is generally used as a characteristic signature of olivine presence in a target. The molar ratio of Mg/(Mg + Fe), also called “Fo value,” can be estimated from the peak position of the strong doublet at 820 and 850 cm−1 following an empirical relation (Wang et al., 1995; Kuebler et al., 2006; Mouri and Enami, 2008).
2.5.3 Plagioclase feldspars
Plagioclase feldspars are the major silicate in the lunar crust and mainly consist of Ca-rich plagioclase (Heiken et al., 1991). They have a structure of linked SiO4 and AlO4 tetrahedra, with a Si:Al ratio varying between 3:1 to 1:1 (Papike, 1988).
The Raman spectral features of feldspar can be separated into five groups, based on their vibrational mode: Group I from 450 to 520 cm−1, Group II from 200 to 400 cm−1, Group III below 200 cm−1, Group IV from 550 to 850 cm−1, and Group V from 900 to 1200 cm−1 (Ling et al., 2011) (Table 2). Group I includes the two most intense peaks associated with the ring-breathing modes of the four-member tetrahedral ring. Group II and III peaks are the result of rotation-translation vibrational modes of the four-member rings and cage-shear modes, respectively. The peaks of group V are assigned to the vibrational stretching mode of the tetrahedra. These features are weaker. Group IV peaks correspond to the deformation modes of the tetrahedra (Freeman et al., 2008).
Anorthite Raman features are sensitive to temperature due to a transition phase that alters the crystalline structure at 514 K (Daniel et al., 1995). This transition can be triggered by meteoritic impact, resulting in pressure shocks (Johnson et al., 2002). The shocked anorthite spectra show mostly broadened and weaker peaks compared to the low-temperature anorthite. Plagioclase feldspar exhibits sharp Raman peaks allowing for their detection in lunar fines and breccias (Wang et al., 1995).
2.5.4 Ilmenite and Fe-Cr-Ti oxides
Ilmenite is the most abundant oxide mineral in lunar regolith (Heiken et al., 1991). It has a rhombohedral structure that alternates between layers of TiO6 and FeO6. Besides ilmenite, some Fe/Ti oxides (e.g., ulvospinel, Mg-Al spinel) have a similar ilmenite (pseudo-corundum) structure, but they show different Raman features. Wang et al. (2004) reported a systematic Raman study of Fe-Ti-Cr oxide minerals, including lunar ilmenite and found that ilmenites could be distinguished from other Fe-Ti-Cr oxides on the basis of the number of Raman peaks and their positions. There are two characteristic peaks for ilmenite: one at 683 cm−1 attributed to the symmetric stretching vibration of Ti4+O6 octahedra, and a strong and sharp peak at 224 cm−1 produced by the translational motion of the Fe cation in the crystal lattice (Table 2). The peak at 683 cm−1 can be misinterpreted as belonging to other Fe-Ti-Cr oxides, as most of them exhibit Raman features at this position, but the peak at 224 cm−1 makes the identification of ilmenite unique (Wang et al., 2004).
2.5.5 SiO2 polymorphs and glasses
Silica polymorphs can exist in multiple forms depending on physico-chemical origin and local environment. On the Moon, cristobalite is the most common SiO2 polymorph, and represents about 5 wt% of some basaltic materials (Heiken et al., 1991). Quartz is only present in felsite clasts (Quick et al., 1981), and, rarely, in coarse-grained fragments (Warren et al., 1983). A typical silica Raman spectrum can be divided into three spectral regions depending on the vibration mode involved (Ling et al., 2011) (Table 2). The peaks in the 700–800 cm−1 region and beyond 1050 cm−1 are attributed to the Si-O-Si bending and torsional/twisting vibration modes. Peaks between 350 and 500 cm−1 result from O-Si-O bending modes, and the peaks below 300 cm−1 are associated with the Si-O stretching vibration modes (Etchepare et al., 1974). Specific Raman features for either cristobalite or quartz in the 350–500 and <300 cm−1 spectral regions can be used to distinguish the two mineral structures, and as a barometric-thermal determinator. Cristobalite has two strong peaks at 410 and 228 cm−1, whereas at low temperature, quartz produces peaks at 464 and 206 cm−1.
Glasses are also contributing to the amount of silica in lunar materials as a result of space weathering into agglutinates (glass-rich aggregates) and formation of silica-rich rinds on mineral grains, and a shocked and molten product of meteoritical impact process and pyroclastic eruptions. The Raman spectra of silica-rich glassy materials have a broad peak centered around 860 cm−1 with a full-width half-maximum (FHWM) of about 200 cm−1, which is attributed to a Si–O stretching mode in the short-range-ordered structure (Ling et al., 2011).
2.5.6 Apatite
As discussed above, KREEP appears to be present across a large portion of the lunar nearside. It likely includes up to a few percent apatite (Warren and Wasson, 1979; Wieczorek and Phillips, 2000). Raman spectra of apatite exhibit several emission peaks (e.g., Ling et al., 2011), particularly in the 28–650, and 900–1100 cm−1 regions (Table 2), making this indicator mineral detectable by Raman spectroscopy.
2.5.7 Spinel
Spinel refers to a group of oxide minerals (general formula: AB2X4, where A and B are various cations, and X is generally oxygen (Deer et al., 1966). Spinel group minerals have been detected on the lunar surface from orbital remote sensing at a number of locations (e.g., Pieters et al., 2014). Its origin is not fully known, but is likely derived from an appreciable depth in the Moon (Pieters et al., 2014). Its Raman spectra show multiple peaks whose positions vary with composition (e.g., D’Ippolito et al., 2015) (Table 2).
2.5.8 Garnet
Garnet is a group of silicate minerals (ideal formula: R3R2(SiO4)3, where R3 is a bivalent metal and R2 is a trivalent metal), that if detected on the Moon, would be strong evidence of derivation from deep in the interior (Neal, 2001). Garnets encompass a number of compositionally-distinct species. Garnet Raman spectra exhibit differences in peak positions between different species (e.g., Bersani et al., 2009) (Table 2).
2.5.9 Hematite
The recent discovery of hematite (Fe2O3) on the Moon (Li et al., 2020) has presented an interesting opportunity to study how the Earth’s atmosphere may interact with and affect the lunar surface. Li et al. (2020) suggest that oxygen delivered to the Moon from the Earth’s upper atmosphere could be the major oxidant that forms lunar hematite. Raman spectra of hematite show a number of emission peaks that can be used to detect it (Beattie and Gilson, 1970; Yamanitsu and Ishii, 1986; Xu et al., 1995; De Faria and Lopes, 2007) (Table 2).
2.5.10 Organic compounds
Organic compounds may be present on the Moon, with diverse compositions and derived from multiple possible sources (e.g., Abell et al., 1971; Colaprete et al., 2010; Liu et al., 2012). Organic molecules are detectable by Raman spectroscopy, and peak positions can be used to constrain their composition and structure. For meteoritic organics (specifically, the kerogen-like insoluble macromolecular material that forms the bulk of meteoritic organic carbon), major Raman peaks are seen in the 1300–1600 and 2700 cm−1 regions (Table 2). The particular organic molecules that are present will determine where they exhibit Raman peaks (e.g., Busemann et al., 2007; Pimenta et al., 2007).
2.6 Other potential applications of Raman spectroscopy to lunar characterization
2.6.1 Raman as a probe of temperature
Raman spectroscopy affords the ability to probe the temperature of targets of interest. In the context of condensed volatiles (ice) mapping and detection, Raman spectra of water ice show variations in peak height and shape as a function of temperature (Angel et al., 2012), affording the possibility to use Raman spectroscopy to probe the temperature of such deposits.
With decreasing temperature, the Raman peaks of mineral phases usually shift to higher wavenumbers, and their widths (full width of half-maximum) decrease (e.g., Stange et al., 2018). However, temperature variations can cause differential shrinking or expansion along different crystallographic axes, and as a result, Raman peaks could also shift to lower wavenumber (e.g., Weber et al., 2014).
The black body radiation of a sample decreases with decreasing temperature, leading to a progressive increase the signal-to-noise ratio, thereby increasing detectability. Identifying minerals at low (or high) temperatures is complicated by the fact that most reference Raman spectral databases, such as the RRUFF database (https://rruff.info/), only contains room-temperature Raman spectra that may differ significantly from lower- and higher-temperature counterparts. Such temperature effects have been seen, for example, in Raman spectra of olivines acquired at different temperatures (Weber et al., 2014). Given that lunar surface temperatures can vary from ∼100 to ∼400 K (Williams et al., 2017), temperature effects on lunar surface Raman spectra could be a valuable probe of lunar surface temperatures and may need to be taken into account for accurate phase identification.
2.6.2 Water ice structure
The forms of water ice on the Moon could range from amorphous to crystalline (Basilevsky et al., 2012). Water/water ice may also be present as a monolayer or few layers thick coating mineral grains or as transient frost (e.g., Lucey et al., 2021). Raman spectroscopy has been shown to be able to distinguish and characterize such layers based on how water molecules bind together and to their substrates (e.g., Shin et al., 2019).
Ice structure is also derivable from Raman spectroscopy. Venkatesh and Rice (1975) measured Raman spectra of amorphous solid H2O, [H2O(as)], D2O (as), and 12% H2O in D2O (as) over a temperature range from 30 to 160 K. The spectra of H2O(as) resemble those of liquid water more than they do those of ice Ic or ice Ih. The spectra suggest that the water molecules are located in two or three distinct configurations. No structural changes were observed in the Raman spectra between 30 and 120 K, but at ∼160 K, the amorphous samples transformed rapidly and irreversibly to ice Ic.
Rice et al. (1978) studied the Raman spectral properties of amorphous ice, crystalline ice, and deuterated ice. They found that amorphous ice versus crystalline ice have very different Raman spectra in terms of overall shape and peak positions, further indicating that different forms of ice could be distinguished by Raman spectroscopy.
2.6.3 Isotopic ratios—water ice
There are likely multiple source of lunar water ice (Lucey et al., 2021). Major possible sources include volcanic eruptions on the Moon, infall of comets and water-rich asteroids, and production of water on the surface by reactions of oxygen-bearing minerals with solar wind hydrogen (Lucey et al., 2021). Each of these sources can have different D/H ratios, and as discussed above, D2O, H2O, and DHO have different Raman peak positions (Venkatesh and Rice, 1975). Therefore, the possibility exists that relative heights of the Raman emission peaks of these different forms of water may be able to constrain their isotopic ratios and abundances.
3 Raman analytical tools
To support Raman analysis of the lunar surface, in addition to our laboratory Raman studies of lunar samples and minerals, we have developed a Raman spectral library and accompanying spectral analysis tools. The current version is based on previous Raman spectral studies and data for lunar minerals and meteorites acquired with our iRaman 532 nm system (Cloutis et al., in preparation).
The development of LunaR and its utilization in future rover missions will generate a large amount of Raman spectra of lunar samples, meteorites, or analogues, either for calibration of the instrument, references, performance tests, or science applications.
A database to archive Raman spectroscopy data of lunar and analogues materials has been developed (Figure 2). It is hosted on the University of Winnipeg’s Centre for Terrestrial and Planetary Exploration (C-TAPE) server (http://www.uwinnipeg.ca/c-tape; https://salsa.uwinnipeg.ca/). The community will have free access to all spectra in the database and to the documentation hosted on the website. No registration is needed to extract spectra from the database. However, the submission and addition of a spectrum to the database requires the acceptance of the registration by the database administrator.
The lunar Raman database (SALSA: Spectral Analysis of Lunar Soils and Analogues) is built as a relational database managed via SQL queries; see Figure 2. The database includes information on the spectra, i.e., the metadata, the sample, the laboratory where the data have been acquired, and the corresponding publication, each stored in different tables. The spectra are stored in individual tables, which are linked to the corresponding entry in the metadata table. The flexibility of the relational database architecture allows the modifications of the tables by automatically updating every entry already in the database and is easily applicable to other types of spectroscopic data (reflectance, IR spectroscopy, XRD, etc.). The database is accessible through a PHP web public interface, and a relational database management system, such as phpMyAdmin, depending on the server capabilities/system.
The SALSA database website also hosts several analytical tools under the name PyRANA: a Python Raman Analyzer Library. PyRANA was developed under the same project as the SALSA database. The PyRANA library is a custom library that facilitates the analysis of Raman spectra. It provides a set of functions to load spectra in a different format, remove a background, fit isolated or blended peaks, generate plot figures, and produce fit report files. The dependencies necessary to be able to run the library are already included in most of the Python environments. Cloutis et al. (in preparation) provide details of PyRANA.
4 LunaR breadboard
As previously mentioned, LunaR performance requirements derive from the STM (Table 1). From the science objectives, instrument requirements were defined for SNR, Raman spectral range, and spectral resolution. Our conceptual design has a baseline close-up Raman system starting from a breadboard design. The driving requirements are provided in Table 4.
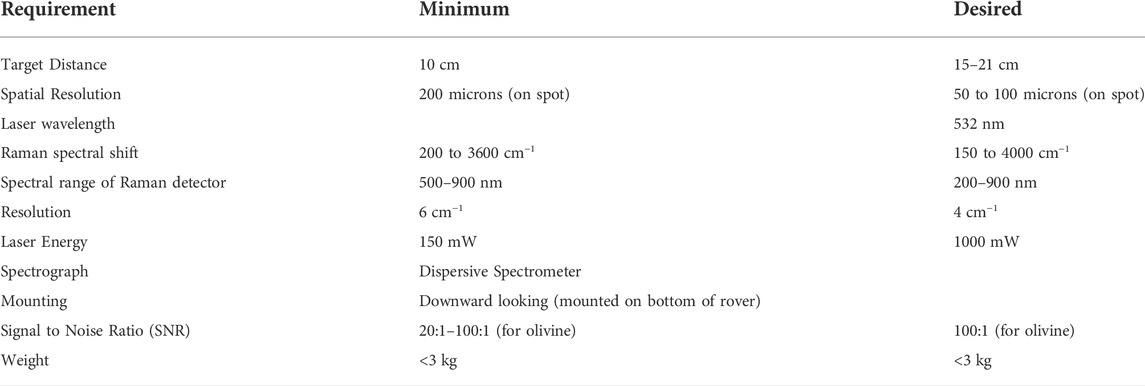
TABLE 4. Selected LunaR instrument and performance requirements.
The information reported here is focused on the design, acquisition, and initial testing of the breadboard instrument components. The intention of the baseline instrument is to prepare and investigate the emission and collection optics, as well as detection subsystems. A future paper (Kruzelecky et al., in preparation) will report on testing and evolution of the breadboard.
The initial close-up Raman system concept design that has been investigated is based on the inherited optimal designs from previous Raman systems investigated at York University, MPB Communications Inc. and the University of Winnipeg, and a commercial unit (BWTek iRaman 532) at the University of Winnipeg. Moreover, we also considered other Raman instruments flown on Mars, such as the SuperCam and SHERLOC instruments on the NASA Perseverance rover (Bhartia et al., 2021; Wiens et al., 2021) as well as the future Raman Laser Spectrometer (RLS) on board on ESA-ExoMars Rosalind Franklin rover (Rull et al., 2017). The initial system conceptual design assumed the following (see Figure 3):
The optimal wavelength is 532 nm for a continuous wave (CW) laser delivery through an optical fiber into a beam expander
The expanded beam is focused by using a 25.4 mm off-axis parabolic mirror
The collection optics are aligned on the same axis as the off-axis parabolic mirror in order to maximize the energy on the point to generate the Raman effect (with 75 mm diameter optics)
The backscattered Raman signal is collected by a telescope and focused onto a fiber and distributed to the Spectrograph CCD system
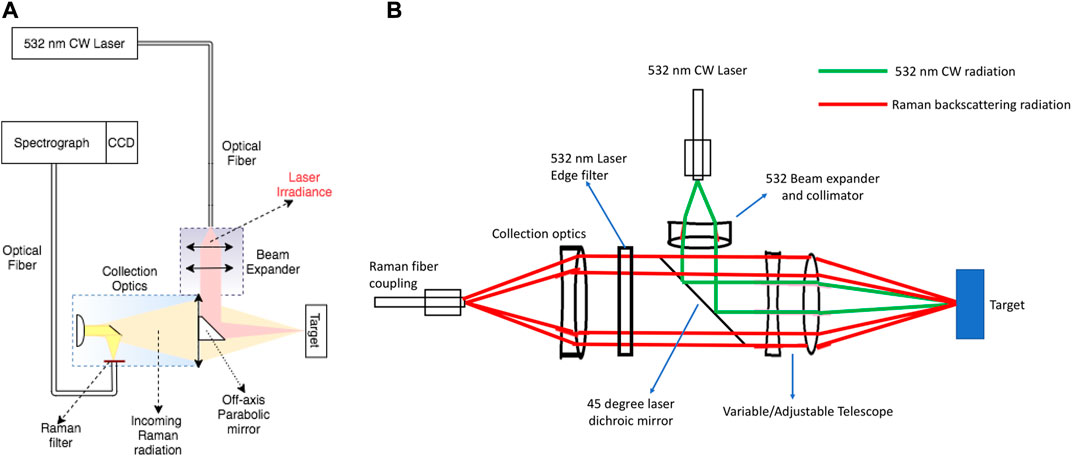
FIGURE 3. (A). Conceptual design of the LunaR Raman system. (B). Design of the LunaR Raman system breadboard instrument.
This optical configuration has shown advantages in previous systems such as LIRS (Cote et al., 2019) and SuperCam (Wiens et al., 2021). Our conceptual system design currently has three main subsystems (Figure 3): 1) laser subsystem; 2) optical delivery and collections subsystem; and 3) optical spectrograph + CCD detection subsystem.
The initial conceptual design presented several advantages from previous flown Raman systems and bread-board design. However, the opto-mechanical components may overpass the 3 kg maximum mass but still fulfill the operational requirements. With that in mind, the final bread-board demonstrator was re-designed with a more stable and robust optical system assuming various estimations (Tables 4–6). We estimated the final bread-board design based on a nominal Raman efficiency probability with 0.01% at 532 nm and a system capable to predict the net SNR for the Raman measurements based on the LunaR system configuration and measurement parameters.
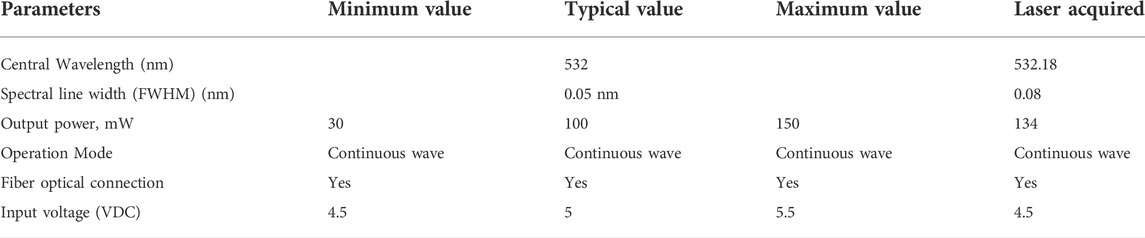
TABLE 5. Selected LunaR laser subsystem specifications and requirements.
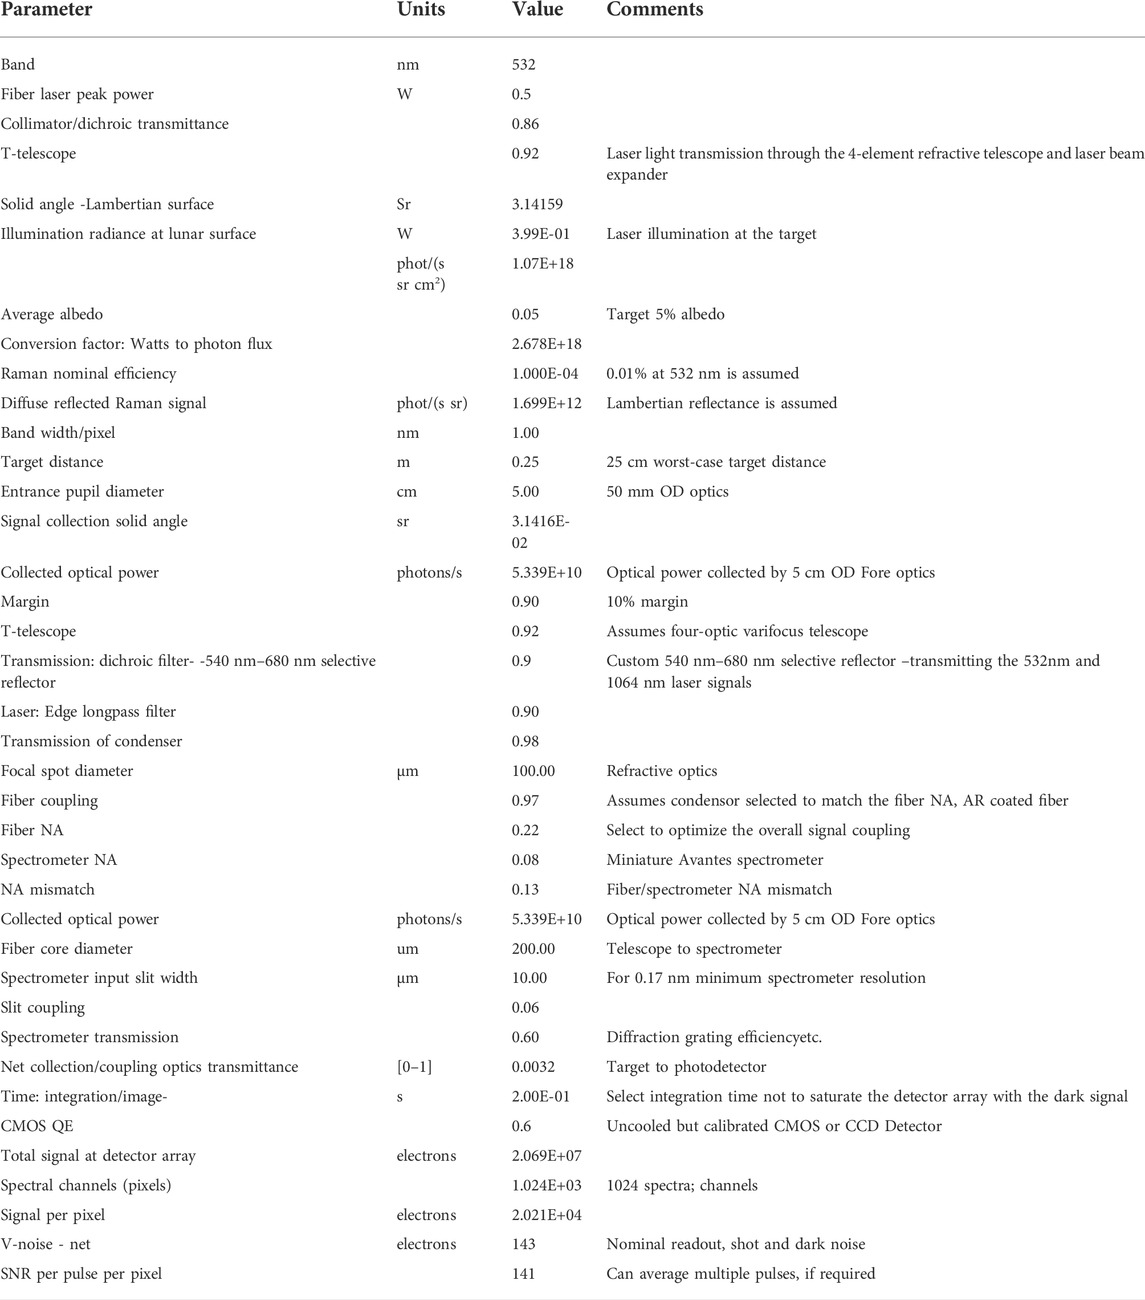
TABLE 6. Parameters for 532 nm laser for LunaR breadboard.
In order to develop a potential flight instrument, mass was a driver of possible optical designs and selection of a laser subsystem for the breadboard. This led to the selection of a continuous wave (CW) laser with specifications shown in Table 5. LunaR will consist of a 532 nm CW laser to fulfill the requirements for generating a strong and detectable Raman effect, and a targeted <3 kg instrument with high-quality spectra.
The LunaR system conceptual design starts with an optimal wavelength is 532 nm for a continuous wave (CW) laser delivery through an optical fiber into a beam expander and beam target collimator (Figure 3B). The expanded-collimated beam is reflected at 45° using a 532 nm dichroic mirror at 45° in the same optical axis of the collection optics. Subsequently, the reflected-collimated-expanded beam is delivered to a variable focusing lens that can vary between 15 and 21 cm from the target point. The collection optics use the same lens for target focusing. The backscattered Raman signal is collected by the lens and collimated for subsequent detection. The backscattered collimated signal (from ∼533 to 1000 nm) passes through the 45° dichroic mirror and is collected by an aspheric lens and focused onto a fiber and distributed to the spectrograph CCD system. The present configuration is aligned on a common optical axis to maximize the input and Raman emitted energy on the point to generate the Raman effect. Moreover, this optical configuration has shown advantages due to its robustness and simplicity (Cote et al., 2019) and is used by SuperCam (Wiens et al., 2021). In order to develop a potential flight instrument, mass was a driver of possible optical designs and selection of laser subsystem. This led to the selection of a continuous wave (CW) laser with specifications shown in Table 5. LunaR will consist of a 532 nm CW laser to fulfill the requirements for generating a strong and detectable Raman effect, and a targeted <3 kg instrument with high quality spectra. A detailed discussion of the LunaR breadboard is the subject of a future paper (Kruzelecky et al., in preparation).
5 Possible deployment/accommodation
Our investigation of LunaR in terms of possible deployment options to the Moon has focused to date on rovers. Because the Raman effect is weak compared to reflected light, we have prioritized deployment of LunaR in a downlooking configuration mounted in the lower section or underside of a rover (Figure 4), so that direct sunlight is minimized or eliminated; indirect sunlight will likely still exist unless the rover is operating in a shadowed region, but we consider this to be likely only for short periods of time.
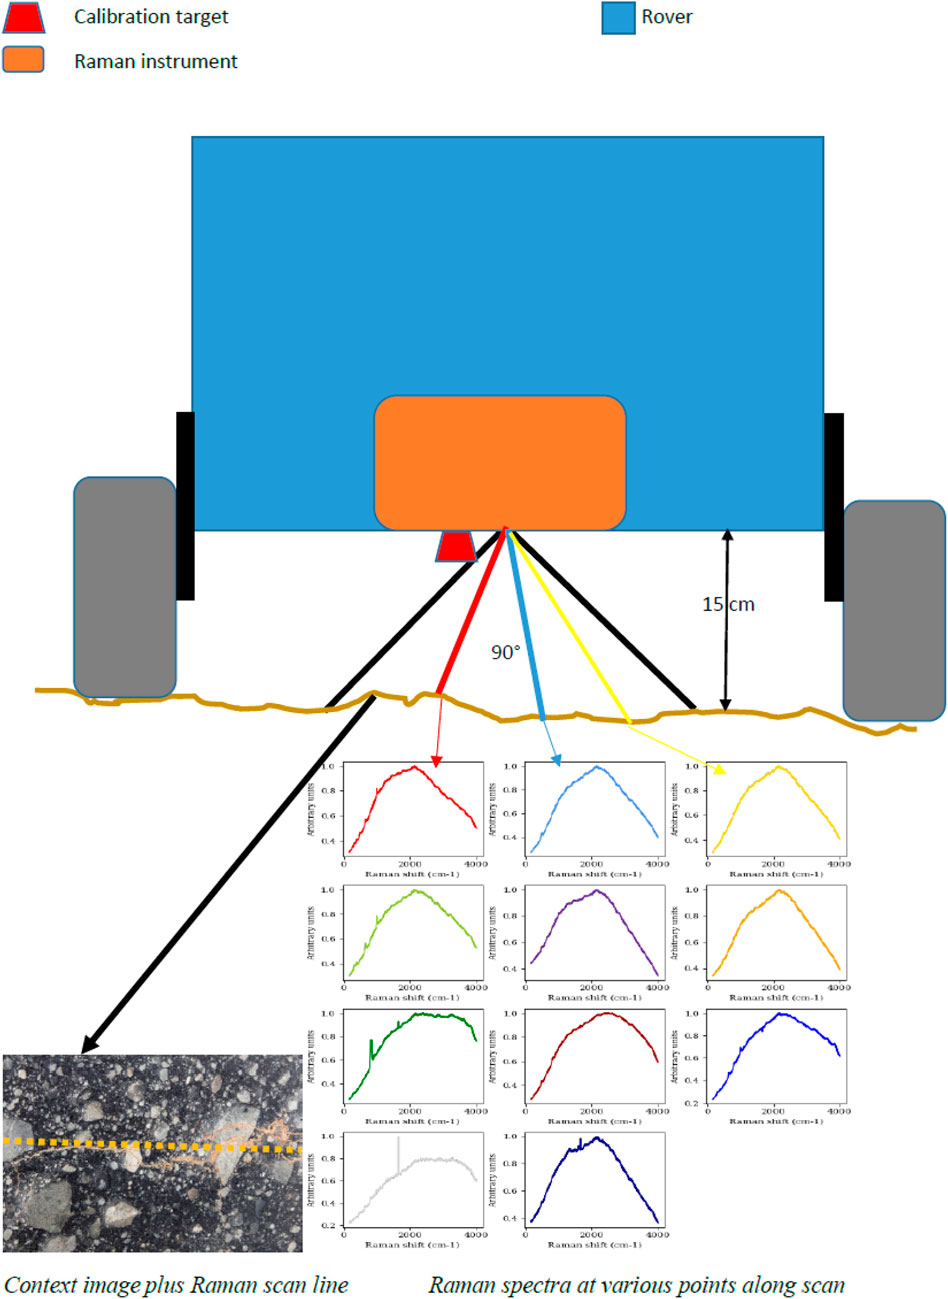
FIGURE 4. Sketch front view of a LunaR Raman spectrometer-hosting rover showing across-track field of view of the Raman spectrometer (±45° off nadir) and calibration target located at the edge of the field of view of the Raman spectrometer; not to scale.
An important operation factor is acquisition time. Acquisition time depends on multiple factors, including laser power, laser spot size, field of view, focus at sample surface, sample Raman spectrum intensity, sample properties, including fluorescence, crystalline orientation, (grain) size and surface roughness. The integration time is typically set in order to obtain a good signal-to-noise ratio in a minimum of time while avoiding the sample being altered by the laser heating.
We used the results of our laboratory Raman studies of lunar materials to estimate the integration time required to acquire a Raman spectrum with a signal-to-noise ratio of at least 100:1. Attaining this requirement is dependent on multiple factors, but we determined that the current configuration of LunaR would, on average, be able to acquire a >100:1 single Raman spectrum in ∼1 min. Results of breadboard testing are the subject of a companion future paper (Kruzelecky et al., in preparation). We have not yet rigorously investigated the depth of field for LunaR, which would depend on the choice of optical elements. This is an important consideration for an irregular surface such as the lunar regolith.
To provide some spatial information on the composition of lunar regolith, the current configuration of LunaR will have a one-dimensional scanning capability, and with a downward-looking instrument, we have set a 90° across-track scanning capability, providing 90 spectra spaced at 1° intervals, and a spot size of ∼100 microns per spectrum. This provides the opportunity to acquire Raman spectra of individual regolith particles and single minerals (Heiken et al., 1991; Pieters et al., 2002) combined with some areally-extensive investigations.
The LunaR Raman instrument would be accompanied by a 2 Mpixel RGB camera, also downward-looking. This would provide contextual information on the target associated with each Raman spectrum at a spatial resolution comparable to or better than the spot size of the Raman spectrometer.
A Raman wavelength calibration target would also be mounted underneath the rover and would be imaged by LunaR at the start or end of each raster scan (i.e., the last one or few data points from the Raman spectrometer would be of the calibration target). It would be used to correct any spectral drift associated with instrumental and environmental parameters, such as instrument temperature. Our initial choice of calibration target is a disk of space-grade Spectralon® (Mann et al., 2016), as it shows multiple Raman peaks and excellent stability in vacuum and resistance to UV irradiation.
6 Concept of operations
The concept of operations assumes that the rover must be stationary in order to collect data. The operational mission timeframe is assumed to be one lunar day, though nested and/or treed multi-day operational scenarios are possible if the particular mission/rover software is designed for autonomy that is robust enough. If the rover is able to survive the lunar night, then extended science operations with the Raman spectrometer can continue.
Overall, the lunar mission that hosts LunaR will utilize previously-demonstrated data acquisition plans from previous rover missions (both in analogue environments and on Mars) (e.g., Marion et al., 2019; Andres et al., 2020; Cloutis et al., 2021a, 2021b). A more detailed description of the concept of operations will be presented in a future paper.
The overall operational steps include:
1) Analysis of pre-landing imagery to identify regions of interest (ROIs) that are expected to contain specific targets of interest (TOIs) and for rover path planning.
2) Post-landing imagery to define the exact landing site relative to the orbital imagery using navigation cameras (NavCams). Post-landing imagery will also be used to identify an initial set of TOIs and for rover path planning. This may only require a subset of NavCam spectral bands, subsampled imagery (i.e., pixel averaging), or lossy compression.
3) Interrogate the first TOI with LunaR and with any other stand-off or contact instruments, such as multispectral/hyperspectral sensors.
4) Use data from these instruments for TOI triage—i.e., does it seem to still retain its scientific importance and triage level?
5) Acquire and download Raman data for TOI.
6) While at the TOI location, acquire new imagery.
7) Use new imagery and acquired Raman data to validate or refine the selection of subsequent TOIs and refine rover path planning.
8) Move to next TOI, acquire Raman data and new imagery.
9) Repeat for subsequent TOIs.
To enable direct rover operations, there are a number of techniques available to reduce data volumes. Regardless of the lunar mission type, “quick look” tools for reducing NavCam and LunaR context camera data volumes are essential for enabling the science team to rapidly identify TOIs for Raman analysis and interpreting Raman data “on the fly.” Such tools are available and can be integrated with simple or real-time analysis tools.
6.1 Rover mission path planning
Given the likelihood that early lunar robotic missions will last one lunar day (∼14 Earth days), we investigated methods by which operations can be maximized in this time frame. Using data from the China National Space Administration (CNSA) Chang’e-4 mission, we have determined that initial rover path planning is feasible prior to landing using high-resolution orbital or descent imagery and refined using post-landing imagery.
The Lunar Reconnaissance Orbiter Camera (LROC) is able to image the lunar surface using two systems: a Wide Angle Camera (WAC) that acquires imagery with 100 m/pixel resolution in seven wavelength bands, and the Narrow Angle Camera (NAC) that acquires monochromatic images at 0.5m/pixel resolution (Robinson et al., 2010). Figure 5A shows an LROC orthophoto mosaic of the Chang’e-4 landing site. The lander on the surface is shown in greater detail in Figures 5B,C. These are post-landing images and are very useful for initial target-of-interest selection (Figure 5D). However, it is unlikely that they would be available for operational support during a 14 Earth day mission unless they were acquired and available within one or a few days of landing. On the other hand, such imagery could be used for operations if it was acquired prior to landing, and the landing location could be located on it very soon after landing. Such superposition would depend on how well and how fast the landing site location could be determined. In the absence of orbital imagery, lander descent imagery could be used for features of interest identification (Figure 5E). Descent and landed imagery help with determining lander orientation and position and provide complementary perspectives of surface TOIs.
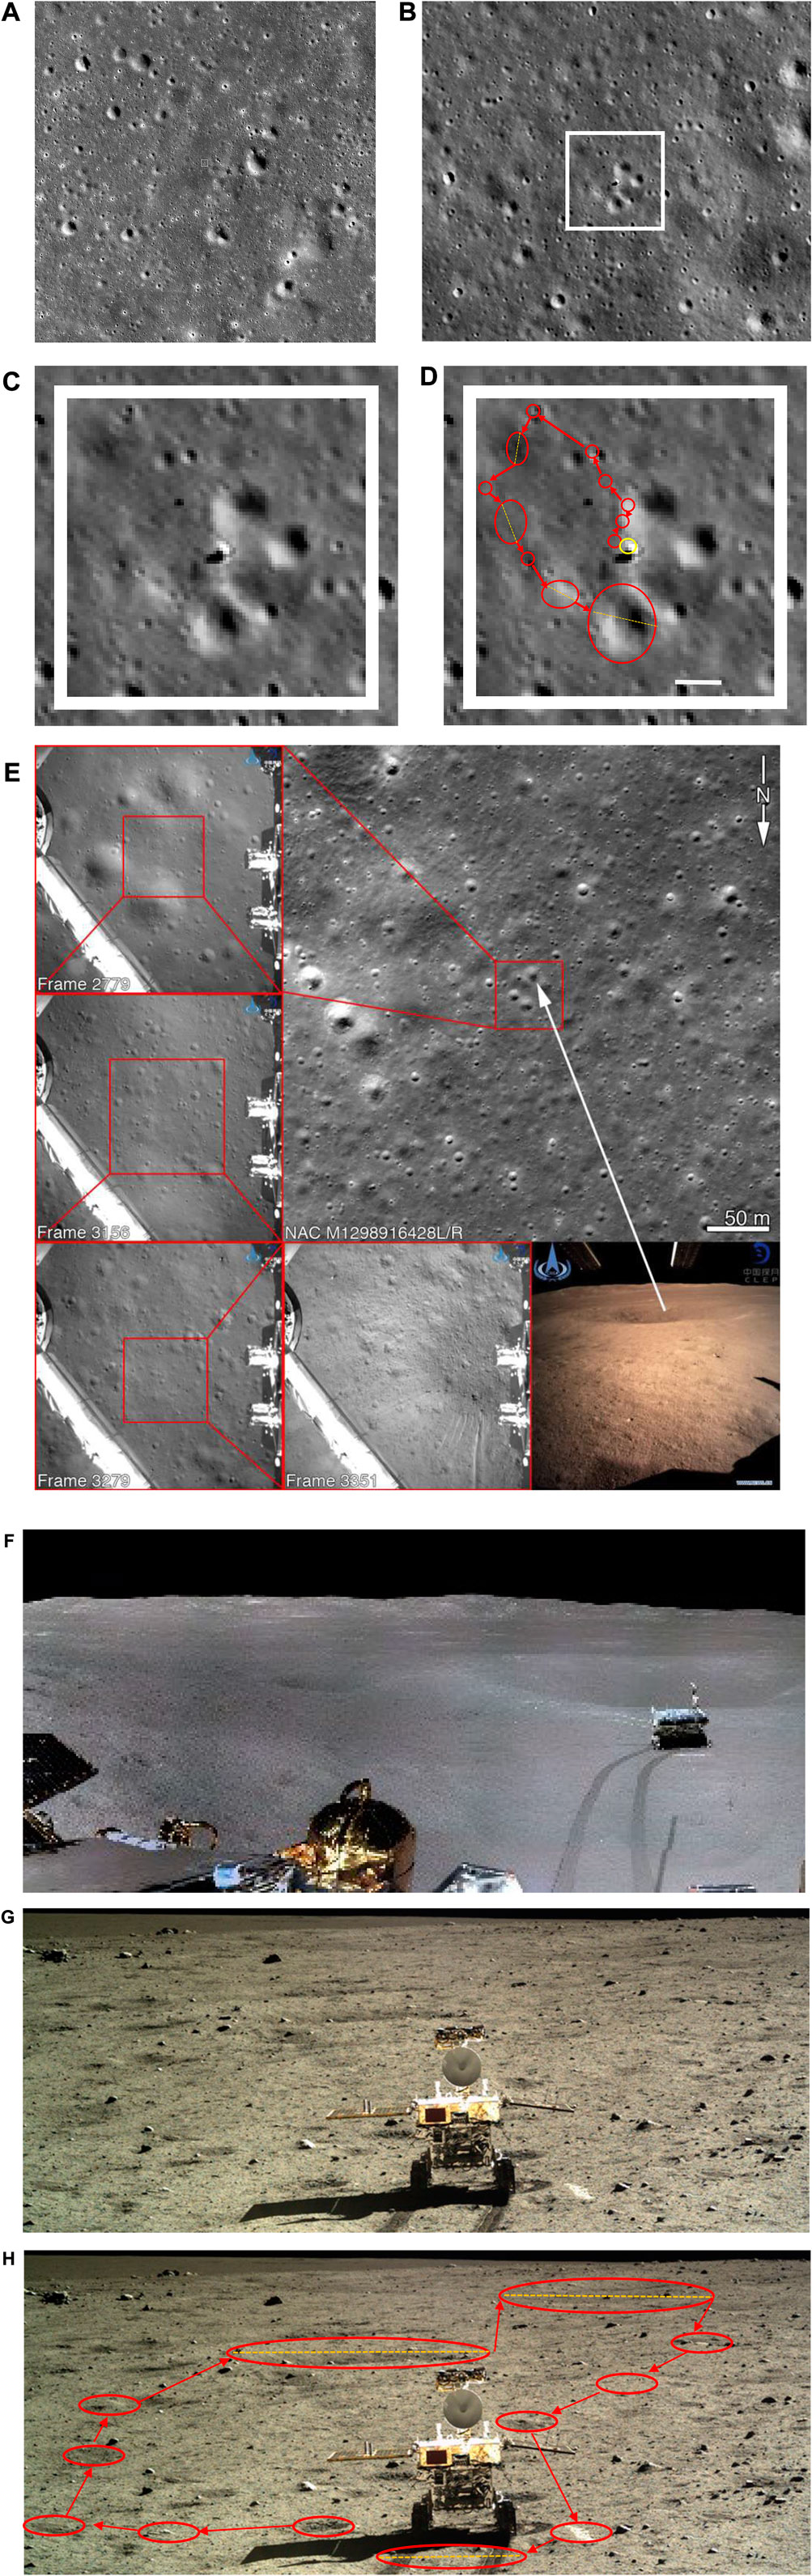
FIGURE 5. (Continued).
The initial selection of TOIs is dependent on both texture and tone (color). It is also dependent on local lighting conditions. Descent images may not be readily interpretable as how the lunar surface would look to our eyes. However, they can still provide much useful information and could be an excellent source of rapid data for TOI identification. Once on the surface, it is likely that a lander would acquire panoramic imagery, as was done by the Chang’e-4 mission (Figure 5F). Such imagery compares well with orbital imagery, and similar landmarks can be seen in both.
As mentioned, lighting conditions will affect how we identify features of interest for exploration. Figure 5G shows a view of the Chang’e-4 Yutu-2 rover as imaged by the lander. Note how the surface appears compared to Figure 5F, where lighting conditions have changed (also the surface-acquired imagery is in color). This more focused image allows a science team to better identify TOIs, as well as to identify smaller-scale TOIs as compared to that derivable from the orbital and panoramic imagery. Using this imagery could lead to the selection of a different suite of TOIs for analysis. As with the orbital and descent imagery, lander imagery can be used to select TOIs for detailed investigations (Figure 5H), which may differ from those selected from orbital and descent imagery.
6.2 Mission success criteria
At the mission level, the minimum, nominal, and augmented success criteria are described below. The instrument requirements and targeted performance are presented in the STM (Table 1).
Mission-level success criteria assume that a rover will be equipped with the baseline LunaR Raman instrument and NavCams for rover path planning and TOI selection.
6.2.1 Minimum mission success
Minimum mission success criteria include a context image and Raman characterization of at least one TOI per Earth day, within the rover’s field of operations, under required instrumental performance. Each TOI requires ∼2 h for data collection and consists of a one-dimensional across-track raster scan of a TOI and acquisition and evaluation of a context camera image. The number of Raman data points for this raster scan is pre-programmable or can be specified. For the nominal instrument performance and a 14-Earth day duration mission, this translates to:
1) At least 12 days of data collection (allowing 1 day for post-landing rover and instrument check-out)
2) At least 12 Raman spectral scans that includes a calibration target visible to the instrument at one end of the raster scan. The size and position of TOI from context imaging will determine the spacing and positioning of Raman analytical points.
3) At least 12 different TOIs selected by the science team are characterized over the ∼14 Earth day mission duration.
4) AT each TOI, at least 90 evenly spaced (pre-programmed) or user-specified Raman spectra across the 30 cm wide field of regard are acquired, with 1 min per spectrum and 30 min of context image analysis.
6.2.2 Nominal mission success
Nominal mission success includes a context image and Raman characterization of at least 3 TOIs per Earth day within the rover’s field of operations. This assumes ∼2 h for data collection, and 6 h of TOI selection and drive between TOIs, under required instrumental performances. This also translates to:
1) At least 12 Earth days of data collection (allowing 1 day for post-landing rover and instrument check-out)
2) At least 36 Raman spectral scans that includes calibration target visible to the instrument at one end of the raster scan. Size and position of TOI from context imaging will determine the spacing and positioning of Raman analytical points.
3) At least 36 different TOIs selected by the science team are characterized over the 14 Earth day duration of the mission.
4) At least 90 evenly-spaced or science team-specified Raman spectra across the 30 cm field of regard, with 1 min per spectrum and 30 min of context image analysis are acquired.
6.2.3 Augmented mission success
Augmented mission success includes a context image and detailed Raman characterization of at least 3 TOIs per Earth day within the rover’s field of operations. This assumed ∼4 h for data collection and 4 h of feature of interest selection and drive between TOIs. The augmented mission will stress data collection over driving. This translates to:
1) At least 12 Earth days of data collection (allowing 1 day for post-landing rover and instrument check-out)
2) At least 36 Raman spectral scans that includes a calibration target visible to the instrument at one end of the raster scan. The size and position of TOIs will determine the spacing and positioning of Raman analytical points.
3) At least 36 different TOIs selected by the science team are characterized
4) At least 180 evenly spaced or science-team specified spectra across the 30 cm field of regard, with 1 min per spectrum and 30 min of context image analysis.
7 Perspectives
In addition to investigating the Science Readiness Level (SRL) of a Raman spectrometer for lunar surface exploration, we have also been advancing the Technology Readiness Level (TRL) of a Raman spectrometer. TRL-based analysis includes conducting trade space analysis and optimization of different instrument configurations in terms of optical layout, mass-power-volume determinations for different configurations, technology requirements for greater stand-off distances, and rover accommodation requirements. The results of these engineering-based studies and deployment options are the subject of a future paper (Kruzelecky et al., in preparation).
On the SRL side, we plan to continue to design, evaluate, and test different optical layouts on data quality for lunar meteorites, as well as expand the suite of samples we are testing LunaR on to include additional lunar meteorites and Apollo rock and regolith samples.
8 Summary and conclusion
Our extensive laboratory and literature-based analysis of Raman spectroscopy for lunar exploration (Cloutis et al., in preparation) and engineering design and breadboard testing (to be reported in a future follow-on paper: Kruzelecky et al., in preparation) have indicated that a compact, sub-3 kg Raman spectrometer is feasible for future exploration of the Moon on a landed mission. Raman spectroscopy is capable of detecting and discriminating a wide variety of lunar surface materials. A wavelength range of ∼150–4000 cm−1 would allow for the detection of many geological materials and condensed volatiles. The wider the wavelength range, the more Raman peaks that would be potentially detectable, leading to more robust identifications of surface materials. A spectral resolution of 6 cm−1 would enable detailed characterization of surface materials, such as the composition of specific minerals (via elemental substitutions that can shift or change Raman peak positions and shapes), the structure of condensed volatiles, and possible detection of fluorescence associated with rare Earth elements.
Data availability statement
The datasets presented in this study can be found in online repositories. The names of the repository/repositories and accession number(s) can be found below: http://www.uwinnipeg.ca/c-tape.
Author contributions
EC conceived the study. CC, EL, JN MD, and EL conducted the analyses. JF oversaw the project. RK, Q-YP, HC, and PM undertook the engineering aspects of this study. DA, SC, AP, NT, and ZW conducted the laboratory analyses of the samples and data analysis. DF, FG, JH, and JL examined accommodation of the instrument on lunar rovers.
Funding
This study was funded by the Canadian Space Agency grant #9F050-200032/B. This project is undertaken with the financial support of the Canadian Space Agency. Ce projet est réalisé(e) avec l’appui financier de l’Agence spatiale canadienne. Laboratory spectroscopic studies were supported by funding from the Canadian Space Agency, the Canada Foundation for Innovation, Research Manitoba, the Natural Sciences and Engineering Research Council of Canada, and the University of Winnipeg.
Acknowledgments
Finally, thanks to the two reviewers whose comments and suggestions greatly improved the manuscript. Thanks to Sandra Potin Manigand and Sebastien Manigand for their contributions to this project.
Conflict of interest
RK, HC, JH, PM, and Q-YP were employed by MPB Communications Inc. DF, FG, and JL were employed by ispace. EL was employed by Canadensys Aerospace Corporation.
The remaining authors declare that the research was conducted in the absence of any commercial or financial relationships that could be construed as a potential conflict of interest.
Publisher’s note
All claims expressed in this article are solely those of the authors and do not necessarily represent those of their affiliated organizations, or those of the publisher, the editors and the reviewers. Any product that may be evaluated in this article, or claim that may be made by its manufacturer, is not guaranteed or endorsed by the publisher.
References
Abell, P. I., Cadogan, P. H., Eglinton, G., Maxwell, J. R., and Pillinger, C. T. (1971)., 2. Cambridge, Mass: MIT Press, 1843–1863.Survey of lunar carbon compounds. I. The presence of indigenous gases and hydrolysable carbon compounds in Apollo 11 and Apollo 12 samplesProc. 2nd Lunar Sci. Conf.
Anderson, A., and Sun, T. S. (1971). Raman spectra of molecular crystals. Carbon dioxide and nitrous oxide. Chem. Phys. Lett. 8, 537–542. doi:10.1016/0009-2614(71)80086-6
Anderson, G. R. (1977). The Raman spectra of carbon dioxide in liquid H2O and D2O. J. Phys. Chem. 81, 273–276. doi:10.1021/j100518a017
Andres, C. N., Ratcliffe, K., Newman, J. D., Osinski, G. R., Cloutis, E. A., Marion, C. L., et al. (2020). Rover command sequencing and instrument utilization during the CanMoon analogue mission. Lunar Planet. Sci. Conf. 51. March 16-20, 2020; abstract #2584.
Angel, S., Gomer, N., Sharma, S., and McKay, C. (2012). Remote Raman spectroscopy for planetary exploration: A review. Appl. Spectrosc. 66, 137–150. doi:10.1366/11-06535
Baran, E. J., Botto, I. L., Muto, F., Kumada, N., and Kinomura, N. (1986). Vibrational spectra of the ilmenite modifications of LiNbO3 and NaNbO3. J. Mat. Sci. Lett. 5, 671–672. doi:10.1007/bf01731546
Baran, E. J., and Botto, I. L. (1979). Raman spectra of zinc titanate (IV) and cadmium titanate (IV). Z. Anorg. Allg. Chem. 448, 188–192. doi:10.1002/zaac.19794480123
Basaltic Volcanism Study Project (1981). Basaltic volcanism on the terrestrial planets. NY: Pergamon Press.
Basilevsky, A. T., Abdrakhimov, A. M., and Dorofeeva, V. A. (2012). Water and other volatiles on the moon: A review. Sol. Syst. Res. 46, 89–107. doi:10.1134/S0038094612010017
Beattie, I. R., and Gilson, T. R. (1970). The single-crystal Raman spectra of nearly opaque materials. Iron(III) oxide and chromium(III) oxide. J. Chem. Soc. A 6, 980–986. doi:10.1039/j19700000980
Bennett, C. J., Brotton, S. J., Jones, B. M., Misra, A. K., Sharma, S. K., and Kaiser, R. I. (2013). High sensitivity Raman spectrometer to study pristine and irradiated interstellar ice analogs. Anal. Chem. 85, 5659–5665. doi:10.1021/ac303259y
Bersani, D., Ando, S., Vignola, P., Moltifiori, G., Marino, I.-G., Lottici, P. P., et al. (2009). Micro-Raman spectroscopy as a routine tool for garnet analysis. Spectrochimica Acta Part A Mol. Biomol. Spectrosc. 73, 484–491. doi:10.1016/j.saa.2008.11.033
Bhartia, R., Beegle, L. W., DeFlores, L., Abbey, W., Razzell Hollis, J., Uckert, K., et al. (2021). Perseverance’s scanning habitable environments with Raman and luminescence for organics and chemicals (SHERLOC) investigation. Space Sci. Rev. 217, 58. doi:10.1007/s11214-021-00812-z
Busemann, H., Alexander, C. M. O’D., and Nittler, L. R. (2007). Characterization of insoluble organic matter in primitive meteorites by microRaman spectroscopy. Meteorit. Planet. Sci. 42, 1387–1416. doi:10.1111/j.1945-5100.2007.tb00581.x
Canadian Space Exploration (2017). Canadian space exploration: Science and space health priorities 2017. St. Hubert, QC, Canada: Canadian Space Agency.
Chen, J., Jolliff, B. L., Wang, A., Korotev, R. L., Wang, K., Carpenter, P. K., et al. (2019). Petrogenesis and shock metamorphism of basaltic lunar meteorites Northwest Africa 4734 and 10597. J. Geophys. Res. Planets 124, 2583–2598. doi:10.1029/2019je006084
Chopelas, A. (1999). Estimates of mantle-relevant Clapeyron slopes in the MgSiO3 system from high-pressure spectroscopic data. Am. Mineralogist 84, 233–244. doi:10.2138/am-1999-0304
Chopelas, A., and Hofmeister, A. M. (1991). Vibrational spectroscopy of aluminate spinels at 1atm. and of MgAl2O4 to over 200 kbar. Phys. Chem. Min. 18, 279–293. doi:10.1007/bf00200186
Chopelas, A. (1991). Single-crystal Raman-spectra of forsterite, fayalite, and monticellite. Am. Mineralogist 76, 1101–1109.
Chou, I.-M., and Wang, A. (2017). Application of laser Raman micro-analyses to Earth and planetary materials. J. Asian Earth Sci. 145, 309–333. Part B. doi:10.1016/j.jseaes.2017.06.032
Cloutis, E. A., Hewson, D., Applin, D. M., Mann, J. P., and Mertzman, S. A. (2018). Raman and reflectance spectroscopy of serpentinites and related hydrated silicates: Effects of physical properties and observational parameters, and implications for detection and characterization on Mars. Planet. Space Sci. 159, 66–83. doi:10.1016/j.pss.2018.04.016
Cloutis, E., Applin, D., Connell, S., Kubanek, K., Kuik, J., Parkinson, A., et al. (2021b). A simulated rover exploration of a long-lived hypersaline spring environment: The East German Creek (MB, Canada) Mars analogue site. Planet. Space Sci. 195, 105130. doi:10.1016/j.pss.2020.105130
Cloutis, E., Stromberg, J., Applin, D., Connell, S., Kubanek, K., Kuik, J., et al. (2021a). The lake st. Martin impact structure (Manitoba, Canada): A simulated rover exploration of a sulfate-bearing impact crater. Planet. Space Sci. 208, 105336. doi:10.1016/j.pss.2021.105336
Colaprete, A., Schultz, P., Heldmann, J., Wooden, D., Shirley, M., Ennico, K., et al. (2010). Detection of water in the LCROSS ejecta plume. Science 330, 463–468. doi:10.1126/science.1186986
Cote, K., Lalla, E. A., Konstantinidis, M., Daly, M., and Dietrich, P. (20192019). A combined Raman, LIF, and micro-LIBS system with time-resolved fluorescence capabilities for planetary exploration applications, 21-25. Washington, DC, USA: 70th International Astronautical Congress. IAC-19-A3.3B.12.
CSEW6 Steering Committee (2009). Proceedings of the 6th Canadian space exploration workshop. St-Hubert, Quebec, Canada.Canadian scientific priorities for the global exploration strategy
Cynn, H., Sharma, S. K., Cooney, T. F., and Nicol, M. (1992). High-temperature Raman investigation of order-disorder behavior in the MgAl2O4 spinel. Phys. Rev. B 45, 500–502. doi:10.1103/physrevb.45.500
Daniel, I., Gillet, P., and Ghose, S. (1995). A new high-pressure phase-transition in anorthite (CaAl2Si2O8) revealed by Raman-spectroscopy. Am. Mineralogist 80, 645–648.
De Faria, D. L. A., and Lopes, F. N. (2007). Heated goethite and natural hematite: Can Raman spectroscopy be used to differentiate them? Vib. Spectrosc. 45, 117–121. doi:10.1016/j.vibspec.2007.07.003
Deer, W. A., Howie, R. A., and Zussman, J. (1997). in Rock-forming minerals. 2nd edition (London, UK: The Geological Society), Vol. 2A.Single-Chain Silicates
Deer, W. A., Howie, R. A., and Zussman, J. (1966). An introduction to the rock-forming minerals. London, UK: The Geological Society.
Degiorgi, L., Blatter-Moerke, I., and Wachter, P. (1987). Magnetite: Phonon modes and the verwey transition. Phys. Rev. B 35, 5421–5424. doi:10.1103/physrevb.35.5421
D’Ippolito, V., Andreozzi, G. B., Bersani, D., and Lottici, P. P. (2015). Raman fingerprint of chromate, aluminate and ferrite spinels. J. Raman Spectrosc. 46, 1255–1264. doi:10.1002/jrs.4764
Estep, P. A., Kovach, J. J., Waldstein, P., and Karr, C. (1972). Infrared and Raman spectroscopic studies of structural variations in minerals from Apollo 11, 12 and 14 samples. Lunar Sci. Conf. 3, 244–246.
Etchepare, J., Merian, M., and Smetankine, L. (1974). Vibrational normal modes of SiO2. I. a and b quartz. J. Chem. Phys. 60, 1873–1876. doi:10.1063/1.1681287
Freeman, J. J., Wang, A., Kuebler, K. E., Jolliff, B. L., and Haskin, L. A. (2008). Characterization of natural feldspars by Raman spectroscopy for future planetary exploration. Can. Mineralogist 46, 1477–1500. doi:10.3749/canmin.46.6.1477
Furic, K., and Volovsek, V. (2010). Water ice at low temperatures and pressures: New Raman results. J. Mol. Struct. 976, 174–180. doi:10.1016/j.molstruc.2010.03.024
Gasparov, L. V., Tanner, D. B., Romero, D. B., Berger, H., Margaritondo, G., and Forro, L. (2000). Infrared and Raman studies of the Verwey transition in magnetite. Phys. Rev. B 35, 7939–7944. doi:10.1103/physrevb.62.7939
Gyollai, I., Nagy, Sz., Gucsik, A., Bérczi, Sz., and Veres, M. (2009). Raman and infrared spectroscopy of feldspars in lunar meteorites (Asuka-881757 and Yamato- 86032). Eur. Planet. Sci. Congr.
Haskin, L. A., Wang, A., Rockow, K. M., Jolliff, B. L., Korotev, R. L., and Viskupic, K. M. (1997). Raman spectroscopy for mineral identification and quantification for in situ planetary surface analysis: A point count method. J. Geophys. Res. 102, 19293–19306. doi:10.1029/97je01694
Heiken, G., Vaniman, D. T., and French, B. M. (1991). Lunar sourcebook: A user’s guide to the Moon. Lunar and Planetary Institute and Cambridge University Press.
Hibben, J. H. (1937). The Raman spectra of water, aqueous solutions and ice. J. Chem. Phys. 5 (3), 166–172. doi:10.1063/1.1750001
Hofmeister, A. M. (1993). IR reflectance spectra of natural ilmenite: Comparison with iso-structural compounds and calculation of thermodynamic properties. Eur. J. Mineral. 5, 281–296. doi:10.1127/ejm/5/2/0281
Huang, E., Chen, C. H., Huang, T., Lin, E. H., and Xu, J-a. (2000). Raman spectroscopic characteristics of Mg-Fe-Ca pyroxenes. Am. Mineralogist 85, 473–479. doi:10.2138/am-2000-0408
Huidobro, J., Aramendia, J., and Madariaga, J. M. (2018). Raman and XRF analysis of the new NWA 11273 lunar meteorite. Eur. Planet. Sci. Congr. 12, EPSC2018–883.
Johnson, J. R., Hörz, F., Lucey, P. G., and Christensen, P. R. (2002). Thermal infrared spectroscopy of experimentally shocked anorthosite and pyroxenite: Implications for remote sensing of Mars. J. Geophys. Res. 107, 5073. doi:10.1029/2001JE001517
Jolliff, B. L., Hughes, J. M., Freeman, J. J., and Zeigler, R. A. (2006). Crystal chemistry of lunar merrillite and comparison to other meteoritic and planetary suites of whitlockite and merrillite. Am. Mineralogist 91, 1583–1595. doi:10.2138/am.2006.2185
Kuebler, K. E., Jolliff, B. L., Wang, A., and Haskin, L. A. (2006). Extracting olivine (Fo–Fa) compositions from Raman spectral peak positions. Geochimica Cosmochimica Acta 70, 6201–6222. doi:10.1016/j.gca.2006.07.035
Leinenweber, K., Navrotsky, A., McMillan, P., and Ito, E. (1989). Transition enthalpies and entropies of high pressure zinc metasilicates and zinc metagermanates. Phys. Chem. Min. 16, 799–808. doi:10.1007/bf00209704
Lenz, C., Nasdala, L., Talla, D., Hauzenberger, C., Seitz, R., and Kolitsch, U. (2015). Laser-induced REE3+ photoluminescence of selected accessory minerals – an “advantageous artefact” in Raman spectroscopy. Chem. Geol. 415, 1–16. doi:10.1016/j.chemgeo.2015.09.001
Li, S., Lucey, P. G., Fraeman, A. A., Poppe, A. R., Sun, V. Z., Hurley, D. M., et al. (2020). Widespread hematite at high latitudes of the Moon. Sci. Adv. 6, eaba1940. eaba 1940. doi:10.1126/sciadv.aba1940
Ling, Z. C., Wang, A., and Jolliff, B. L. (2011). Mineralogy and geochemistry of four lunar soils by laser-Raman study. Icarus 211, 101–113. doi:10.1016/j.icarus.2010.08.020
Linton, J. A., Fei, Y., and Navrotsky, A. (1999). The MgTiO3-FeTiO3 join at high pressure and temperature. Am. Mineralogist 84, 1595–1603. doi:10.2138/am-1999-1013
Liu, Y., Guan, Y., Zhang, Y., Rossman, G. R., Eiler, J. M., and Taylor, L. A. (2012). Direct measurement of hydroxyl in the lunar regolith and the origin of lunar surface water. Nat. Geosci. 5, 779–782. doi:10.1038/ngeo1601
Lorenz, S., Seidel, P., Ghamisi, P., Zimmermann, R., Tusa, L., Khodadadzadeh, M., et al. (2019). Multi-sensor spectral imaging of geological samples: A data fusion approach using spatio-spectral feature extraction. Sensors 19, 2787. doi:10.3390/s19122787
Lucey, P. G., Petro, N., Hurley, D. M., Farrell, W. M., Prem, P., Costello, E. S., et al. (2021). Volatile interactions with the lunar surface. Geochemistry, 125858. in press. doi:10.1016/j.chemer.2021.125858
Mann, P., Cloutis, E. A., Bell, J. F., Wiens, R. C., Johnson, J. R., and Durell, C. (2016). The stability of Spectralon, a potential calibration target for Mars 2020. Lunar Planet. Sci. Conf. 47. abstract #2362.
Marion, C. L., Osinski, G. R., Bourassa, M., Caudill, C. M., Cloutis, E. A., Christofferson, P., et al. (2019). CanMoon Team (2020) Overview of the CanMoon lunar sample return analogue mission. Lunar Planet. Sci. Conf. 51. March 16-20, 2020; abstract #2349.
McCubbin, F. M., Steele, A., Nekvasil, H., Schneiders, A., Rose, T., Fries, M., et al. (2010). Detection of structurally bound hydroxyl in fluorapatite from Apollo mare basalt 15058, 128 using TOF-SIMS. Am. Mineralogist 95, 1141–1150. doi:10.2138/am.2010.3448
McLeod, C. L., and Krekeler, M. P. S. (2017). Sources of extraterrestrial rare earth elements: To the moon and beyond. Resources 6, 40. doi:10.3390/resources6030040
McMillan, P., and Akaogi, M. (1987). Raman spectra of beta-Mg2SiO4 (modified spinel) and gamma-Mg2SiO4 (spinel). Am. Mineralogist 72, 361–364.
McMillan, P. F., and Ross, N. L. (1987). Heat capacity calculations for Al2O3 corundum and MgSiO3 ilmenite. Phys. Chem. Min. 14, 225–234. doi:10.1007/bf00307986
Mernagh, T. P. (1991). Use of the laser Raman microprobe for discrimination amongst feldspar minerals. J. Raman Spectrosc. 22, 453–457. doi:10.1002/jrs.1250220806
Mingsheng, P., Mao, H. K., Dien, L., and Chao, E. C. T. (1994). Raman spectroscopy of garnet-group minerals. Chin. J. Geochem. 13, 176–183. doi:10.1007/bf02838517
Mouri, T., and Enami, M. (2008). Raman spectroscopic study of olivine-group minerals. J. Mineralogical Petrological Sci. 103, 100–104. doi:10.2465/jmps.071015
Neal, C. R. (2001). Interior of the Moon: The presence of garnet in the primitive deep lunar mantle. J. Geophys. Res. 106, 27865–27885. doi:10.1029/2000JE001386
Papike, J. J. (1988). Chemistry of the rock-forming silicates: Multiple-chain sheet, and framework structures. Rev. Geophys. 26, 407–444. doi:10.1029/rg026i003p00407
Papike, J. J. (1987). Chemistry of the rock-forming silicates: Ortho, ring, and single chain structures. Rev. Geophys. 25, 1483–1526. doi:10.1029/rg025i007p01483
Perry, C. H., Agrawal, D. K., Anastassakis, E., Lowndes, R. P., and Tornberg, N. E. (1972). Far infrared and Raman spectroscopic investigations of lunar materials from Apollo 11, 12, 14, and 15. Lunar Planet. Sci. Conf. 3, 3077.
Pieters, C. M., Donaldson Hanna, K., Cheek, L., Dhingra, D., Prissel, T., Jackson, C., et al. (2014). The distribution of Mg-spinel across the Moon and constraints on crustal origin. Am. Mineralogist 99, 1893–1910. doi:10.2138/am-2014-4776
Pieters, C. M., Stankevich, D. G., Shkuratov, Y. G., and Taylor, L. A. (2002). Statistical analysis of the links among lunar mare soil mineralogy, chemistry, and reflectance spectra. Icarus 155, 285–298. doi:10.1006/icar.2001.6749
Pimenta, M. A., Dresselhaus, G., Cancado, L. G., Jorio, A., and Saito, R. (2007). Studying disorder in graphite-based systems by Raman spectroscopy. Phys. Chem. Chem. Phys. 9, 1276–1290. doi:10.1039/b613962k
Pinet, M., Smith, D. C., and Boyer, H. (1986). Raman fingerprinting of opaque and semi-opaque minerals: The natural system geikielite-ilmenite-pyrophanite (GIP). Terra Cogn. 7, 18.
Quick, J., Albee, A., and James, O. (1981). Petrology and petrogenesis of lunar breccia 12013. Proc. Lunar Planet. Sci. Conf. 12B, 117–172.
Reisfeld, R., Gaft, M., Boulon, G., Panczer, C., and Jorgenson, C. K. (1996). Laser-induced luminescence of rare-Earth elements in natural fluor-apatites. J. Luminescence 69, 343–353. doi:10.1016/s0022-2313(96)00114-7
Rice, S. A., Madden, W. G., McGraw, R., Sceats, M. G., and Berger, M. S. (1978). On the relationships between low-density amorphous solid water and ice ih. J. Glaciol. 21, 509–535. doi:10.1017/s0022143000033657
Righter, K., Collins, S. J., and Brandon, A. D. (2005). Mineralogy and petrology of the LaPaz Icefield lunar mare basaltic meteorites. Meteorit. Planet. Sci. 40, 1703–1722. doi:10.1111/j.1945-5100.2005.tb00139.x
Robinson, M. S., Brylow, S. M., Tschimmel, M., Humm, D., Lawrence, S. J., Thomas, P. C., et al. (2010). Lunar reconnaissance orbiter camera (LROC) instrument overview. Space Sci. Rev. 150, 81–124. doi:10.1007/s11214-010-9634-2
Ross, N. L., and Navrosky, A. (1988). Study of MgGeO3 polymorphs (orthopyroxene, clinopyroxene, and ilmenite structures) by calorimetry, spectroscopy, and phase equilibria. Am. Mineralogist 73, 1355–1365.
Rull, F., Maurice, S., Hutchinson, I., Moral, A., Perez, C., Diaz, C., et al. on behalf of the RLS Team (2017). The Raman laser spectrometer for the ExoMars rover mission to Mars. Astrobiology 17, 627–654. doi:10.1089/ast.2016.1567
Shin, I., Hwang, J., and Jhe, W. (2019). Ice-VII-like molecular structure of ambient water nanomeniscus. Nat. Commun. 10, 286. doi:10.1038/s41467-019-08292-0
Smith, J. P., Smith, F. C., and Booksh, K. S. (2018). Multivariate curve resolution–alternating least squares (MCR-ALS) with Raman imaging applied to lunar meteorites. Appl. Spectrosc. 72, 404–419. doi:10.1177/0003702817721715
Stange, K., Lenting, C., and Geisler, T. (2018). Insights into the evolution of carbonate-bearing kaolin during sintering revealed by in situ hyperspectral Raman imaging. J. Am. Ceram. Soc. 101, 897–910. doi:10.1111/jace.15209
Taylor, M. J., and Whalley, E. (1964). Raman spectra of ices Ih, Ic, II, III, and V. J. Chem. Phys. 40 (6), 1660–1664. doi:10.1063/1.1725375
Venkatesh, C. G., Rice, S. A., and Bates, J. B. (1975). A Raman spectral study of amorphous solid water. J. Chem. Phys. 63, 1065–1071. doi:10.1063/1.431447
Wang, A., Jolliff, B. L., Haskin, L. A., Kuebler, K. E., and Viskupic, K. M. (2001). Characterization and comparison of structural and compositional features of planetary quadrilateral pyroxenes by Raman spectroscopy. Am. Mineralogist 86, 790–806. doi:10.2138/am-2001-0703
Wang, A., Jolliff, B. L., and Haskin, L. A. (1995). Raman spectroscopy as a method for mineral identification on lunar robotic exploration missions. J. Geophys. Res. 100, 21189–21199. doi:10.1029/95JE02133
Wang, A., Korotev, R. L., Jolliff, B. L., and Ling, Z. (2015). Raman imaging of extraterrestrial materials. Planet. Space Sci. 112, 23–34. doi:10.1016/j.pss.2014.10.005
Wang, A., Kuebler, K. E., Jolliff, B. L., and Haskin, L. A. (2004). Raman spectroscopy of Fe–Ti–Cr-oxides, case study: Martian meteorite EETA79001. Am. Mineralogist 89, 665–680. doi:10.2138/am-2004-5-601
Wang, A. (1999). Some grain size effects on Raman scattering intensity for in situ measurements on rocks and soils experimental tests and modeling. Lunar Planet. Sci. 30.
Wang, S., Song, Z., Kong, Y., and Liu, Q. (2019). Relationship of Stokes shift with composition and structure in Ce3+/Eu2+-doped inorganic compounds. J. Luminescence 212, 250–263. doi:10.1016/j.jlumin.2019.04.036
Warren, P. H., Taylor, G. J., Keil, K., Shirley, D. N., and Wasson, J. T. (1983). Petrology and chemistry of two “large” granite clasts from the moon. Earth Planet. Sci. Lett. 64, 175–185. doi:10.1016/0012-821x(83)90202-9
Warren, P. H., and Wasson, J. T. (1979). The origin of KREEP. Rev. Geophys. 17, 73–88. doi:10.1029/rg017i001p00073
Weber, I., Bottger, U., Pavlov, S. G., Jessberger, E. K., and Hubers, H.-W. (2014). Mineralogical and Raman spectroscopy studies of natural olivines exposed to different planetary environments. Planet. Space Sci. 104, 163–172. doi:10.1016/j.pss.2014.08.016
Wei, J., Wang, A., Lambert, J. L., Wettergreen, D., Cabrol, N., Warren-Rhodes, K., et al. (2015). Autonomous soil analysis by the Mars micro-beam Raman spectrometer (MMRS) on-board a rover in the atacama desert: A terrestrial test for planetary exploration. J. Raman Spectrosc. 46, 810–821. doi:10.1002/jrs.4656
White, W. B. (1974). “Order-disorder effects,” in The infrared spectra of minerals. Mineralogical society monograph 4. Editor V. C. Farmer (Dorking, Surrey: Adlard & Son Ltd., Bartholomew Press).
White, W. B. (1975). “Structural interpretation of lunar and terrestrial minerals by Raman spectroscopy,” in Infrared and Raman spectroscopy of lunar and terrestrial minerals by Raman spectroscopy (New York: Academic Press), 325–358.
Wieczorek, M. A., and Phillips, R. J. (2000). The “Procellarum KREEP Terrane”: Implications for mare volcanism and lunar evolution. J. Geophys. Res. 105 (8), 20417–20430. doi:10.1029/1999je001092
Wiens, R. C., Maurice, S., Robinson, S. H., Nelson, A. E., Cais, P., Bernardi, P., et al. (2021). The SuperCam instrument suite on the NASA Mars 2020 rover: Body unit and combined system tests. Space Sci. Rev. 217, 4. doi:10.1007/s11214-020-00777-5
Williams, J.-P., Paige, D. A., Greenhagen, B. T., and Sefton-Nash, E. (2017). The global surface temperatures of the moon as measured by the diviner lunar radiometer experiment. Icarus 283, 300–325. doi:10.1016/j.icarus.2016.08.012
Xu, J., Huang, E., Lin, J., and Xu, L. Y. (1995). Raman study at high pressure and the thermodynamic properties of corundum: Application of Kieffer’s model. Am. Mineralogist 80, 1157–1165. doi:10.2138/am-1995-11-1206
Xue, X., He, Z.-Z., and Liu, J. (2013). Detection of water-ice phase transition based on Raman spectrum. J. Raman Spectrosc. 44, 1045–1048. doi:10.1002/jrs.4310
Keywords: Moon, Raman spectroscopy, space exploration, geology, moon–methods
Citation: Cloutis EA, Caudill C, Lalla EA, Newman J, Daly M, Lymer E, Freemantle J, Kruzelecky R, Applin D, Chen H, Connell S, Fernandes D, Giusto F, Hawke J, Lamamry J, Murzionak P, Parkinson A, Peng Q-Y, Turenne N and Wolf ZU (2022) LunaR: Overview of a versatile Raman spectrometer for lunar exploration. Front. Astron. Space Sci. 9:1016359. doi: 10.3389/fspas.2022.1016359
Received: 10 August 2022; Accepted: 20 September 2022;
Published: 07 October 2022.
Edited by:
Simon Pete Worden, Breakthrough Initiatives, Breakthrough Prize Foundation, USAReviewed by:
Xiang Wu, China University of Geosciences Wuhan, ChinaFrédéric Foucher, UPR4301 Centre de biophysique moléculaire (CBM), France
Copyright © 2022 Cloutis, Caudill, Lalla, Newman, Daly, Lymer, Freemantle, Kruzelecky, Applin, Chen, Connell, Fernandes, Giusto, Hawke, Lamamry, Murzionak, Parkinson, Peng, Turenne and Wolf. This is an open-access article distributed under the terms of the Creative Commons Attribution License (CC BY). The use, distribution or reproduction in other forums is permitted, provided the original author(s) and the copyright owner(s) are credited and that the original publication in this journal is cited, in accordance with accepted academic practice. No use, distribution or reproduction is permitted which does not comply with these terms.
*Correspondence: E. A. Cloutis, e.cloutis@uwinnipeg.ca