A Plant Characterization Unit for Closed Life Support: Hardware and Control Design for Atmospheric Systems
 Antonio Pannico1
  Gionata Cimini2
  Claudia Quadri3
  Roberta Paradiso1* Lorenzo Bucchieri3
  Youssef Rouphael1
  Stefania De Pascale1
- 1Department of Agricultural Sciences, University of Naples Federico II, Portici, Italy
- 2ODYS S.r.l., Milan, Italy
- 3EnginSoft S.p.A., Bergamo, Italy
Growth chambers are critical to the characterization of higher plant performance within BLSSs for long term crewed missions in Space. The Plant Characterization Unit (PCU) is a 2.16 m3 environmentally controlled sealed chamber, realized in 2019 at the Laboratory of Crop research for Space of the University of Naples (Italy), within the European Space Agency Programme MELiSSA. The PCU enables terrestrial investigations of BLSS higher plant compartments that produce food, water, and oxygen for the crew. It accommodates two separate sub-systems, an atmospheric module and a hydroponic module. Such systems regulate autonomously temperature, relative humidity, light intensity and spectral composition, atmosphere gas composition, and air flow and pressure, as well as the composition, the temperature and the flow of the nutrient solution. This method paper describes the following phases of realization: 1) the definition of plant requirements; 2) the design of the two modules; 3) the development of the control system for the atmospheric sub-system.
1 Introduction
Human exploration beyond Low Earth Orbit (LEO) will require specific technologies to regenerate resources, while recycling the waste generated by the crew, and to exploit the in situ resources, to overcome the need of continuous resupplying from Earth, and to prevent pollution to extra-terrestrial bodies. Bioregenerative Life Support Systems (BLSSs) are artificial ecosystems in which appropriately selected organisms are assembled in consecutive steps of recycling, to reconvert the crew waste into oxygen, potable water, and edible biomass, developed to allow autonomous human long-term habitation in space (Hendrickx and Mergeay, 2007). Specifically, BLSSs consist of producers (higher plants and algae), consumers (humans and animals) and decomposers (microorganisms), as natural terrestrial ecosystems, able to recycle and regenerate air, water, food, and other essential substances needed for human survival, ultimately providing Earth-like comfortable environments (Liu et al., 2021). They are realized as modular systems including interconnecting compartments which host the above-mentioned organisms and enable different specific functions in a closed regenerative loop (Wheeler, 2010; Guo et al., 2017).
Higher plants are the most promising biological regenerators in BLSSs for space, as they regenerate air through the photosynthetic CO2 assimilation and O2 emission, to recover purified water through the transpiration, and to recycle waste products through the mineral nutrition, while providing fresh food for the crew diet (Hendrickx and Mergeay, 2007), and health and psychological benefit to the astronauts (Cahill and Hardiman, 2020; Heer et al., 2020). However, to perform these functions, plants need optimal environmental conditions for the growth. This requires the knowledge of their response to the different cultivation factors (e.g. controlled environment, hydroponic systems) and space factors (e.g., altered gravity, ionizing radiation) (De Pascale et al., 2021), as well as the design of specific agricultural systems (Wheeler, 2017). To this purpose, the creation of growth chambers that automatically control the technical and environmental parameters is crucial to study the plant performance. The goal is to define the conditions (e.g. light intensity and spectrum, CO2 concentration, temperature, relative humidity) to optimize the growth and yield of candidate crops and the nutrient and nutraceutical value of plant food. Several review papers detail fully controlled plant chambers, developed for both ground demonstration and space flight experiments, and the needs for their improvement (Zabel et al., 2016; Wheeler, 2017; Liu et al., 2021).
Relevant efforts in developing modules for Earth and space applications are made by the European Space Agency (ESA), within the framework of the programme Micro-Ecological Life-Support System Alternative (MELiSSA) (MELiSSA foundation, 2022). The goal of the programme is to conceive an artificial ecosystem, inspired by the reconversion cycle of organic matter in natural lake ecosystems, founded on higher plants-, algae- and microorganisms-based technologies for resource regeneration for long-duration missions in space (Mergeay et al., 1988). The driving element of MELiSSA is the recovering of edible biomass, water and O2 from organic waste (faeces, urine, CO2 and minerals), using light as an energy source to promote photosynthesis (Hendrickx et al., 2006).
The MELiSSA cycle is a loop of five interconnected compartments, each with a specific biotransformation task, colonized by thermophilic anaerobic bacteria, photo-heterotrophic bacteria, nitrifying bacteria, photosynthetic organisms, and the crew as both the first producer (of waste) and the final user (of products) (Lasseur et al., 2010). The complete cycle is demonstrated in the MELiSSA Pilot Plant (MPP), a laboratory operating at the University Autònoma of Barcelona (Spain), dedicated to test the closed-loop at a pilot-scale in terrestrial conditions (Gòdia et al., 2004). In the MPP, compartment sizing provides the total oxygen and 20–40% of the food required by one human (Peiro et al., 2020). Within the loop, the Higher Plant Chamber (HPC) is a compartment designed to cultivate plants under fully controlled conditions. The HPC aims at regenerating air and water through photosynthesis and transpiration respectively, as well as produce fresh food for human consumption (Dixon et al., 2017). However, it does not allow the precise characterization of plant physiology in terms of rate of O2, CO2 and water absorption and production. Nonetheless it is not suited for computing separately the mass balances in the root and aerial zones, required for modelling each compartment (Favreau et al., 2005; Waters et al., 2005).
To address these limitations, the Plant Characterization Unit (PCU) was realized in 2019 at the Laboratory of Crop research for Space of the University of Naples Federico II (Department of Agricultural Sciences, Portici, Naples) (Figure 1), within the MELiSSA project PlAnt Characterization unit for closed life support system—engineering, MANufacturing and testing (PaCMAN). The PaCMAN project involves 5 partners: University of Naples Federico II (Naples, Italy), ODYS S.r.l. (Milan, Italy), EnginSoft S.p.A. (Bergamo, Italy), NTNU Centre for Interdisciplinary Research in Space—CIRiS (Trondheim, Norway), Hosokawa Micron Ltd. (England).
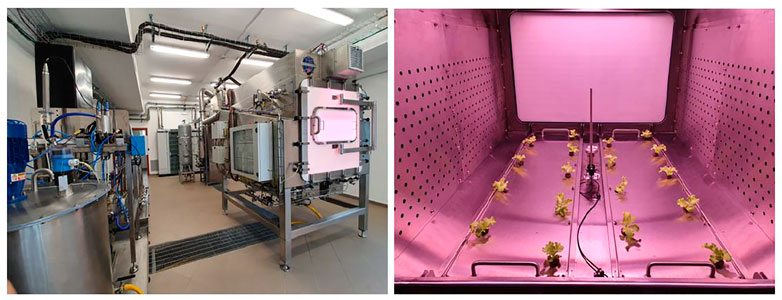
FIGURE 1. Plant Characterization Unit (PCU) realized at the Laboratory of Crop research for Space of the University of Naples Federico II (Department of Agricultural Sciences, Portici Naples) within the ESA—MELiSSA project PlAnt Characterization unit for closed life support system—engineering, MANufacturing and testing (PaCMAN). Panoramic view of the laboratory and internal view of the chamber during a test on lettuce plants.
The PCU is conceived as a research facility for extensive scientific investigations on food production, air revitalization and water purification, in the view of the integration of the higher plant compartment in BLSSs. Specifically, it allows testing of multiple crop growth scenarios under different conditions in terms of environmental and cultural variables (temperature, relative humidity, light intensity and spectral composition, air flow, pressure and gas composition, nutrient solution). The chamber is not intended for a large food production, while it offers the possibility to finely measure growth parameters (i.e. O2 evolution, CO2 absorption, edible biomass production, plant tissue nutritional and nutraceutical properties), and to determine the mass balance in both the rhizosphere (hydroponic module) and the aerial zone (atmospheric module), since the two zones are separate and leakage proof. This will allow data to be collected to develop mechanistic models for plant growth and also to validate theoretically developed models (Boscheri et al., 2012; Poulet et al., 2020).
This paper describes the design of the chamber, based on the plant requirements and the scientific purpose, and the development of the control system and algorithms of the PCU atmospheric sub-system, as well as the main results of environmental control in a life test on a lettuce crop. Data on growth (biomass accumulation and plant biometric parameters), plant physiology related results (gas exchange, mass balance), and food quantity and quality (yield and nutritional and nutraceutical composition) will be reported on a different article.
2 Materials and Methods
2.1 Criteria for Plant Requirements Definition
In closed growth chambers for ground-based experiments, the control of environmental and cultivation parameters is essential to characterize the required inputs (energy, water, nutrients, CO2, and O2) and the subsequent outputs (water from transpiration, O2 from photosynthesis, CO2 from respiration, waste). Such parameters are required to model the cultivation system functioning. Accordingly, the following environmental parameters were considered for monitoring and control in the PCU atmospheric module: air temperature (T), relative air humidity (RH), light duration, intensity, and spectrum, and air composition.
Considering the diversity of plant needs, growth requirements were distinguished according to different crop types, hence different reference ranges were proposed for leafy vegetables (e.g., lettuce, kale, spinach), root and tuber vegetables (e.g., potato, carrot), and fruits vegetables (e.g., tomato, soybean), as shown in Table 1.
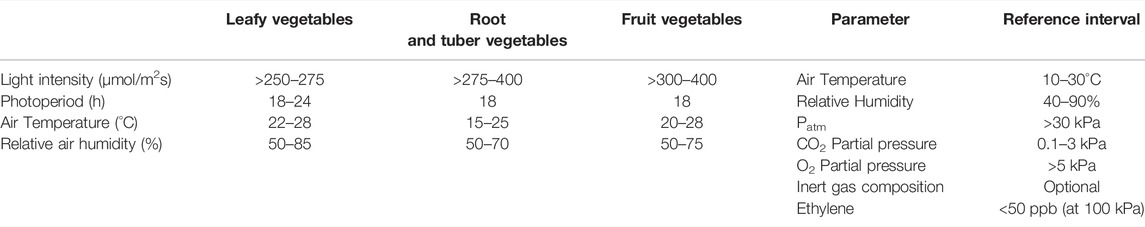
TABLE 1. Plant growth requirements in terms of environmental parameters for the different crop types (left panel), and Reference intervals for environmental parameters for plant cultivation in controlled environment at the NASA’s Biomass Production Chamber (right panel) (Wheeler et al., 1996a).
PCU validation required plant life tests and the species selection involved several crops, each with specific scientific interest for technical and/or nutritional and nutraceutical reasons., Plant requirements were developed accordingly to the following crops selection:
• lettuce (Lactuca sativa L.), as leafy vegetable;
• potato (Solanum tuberosum L.), as tuber plant;
• tomato (Solanum lycopersicum L.) and soybean (Glycine max L. Merr.), as fruit vegetables.
A literature review was performed to collect information on plant characteristics and optimal environmental conditions for these crops (Table 2) and possible additional crops to be included in future experiments.
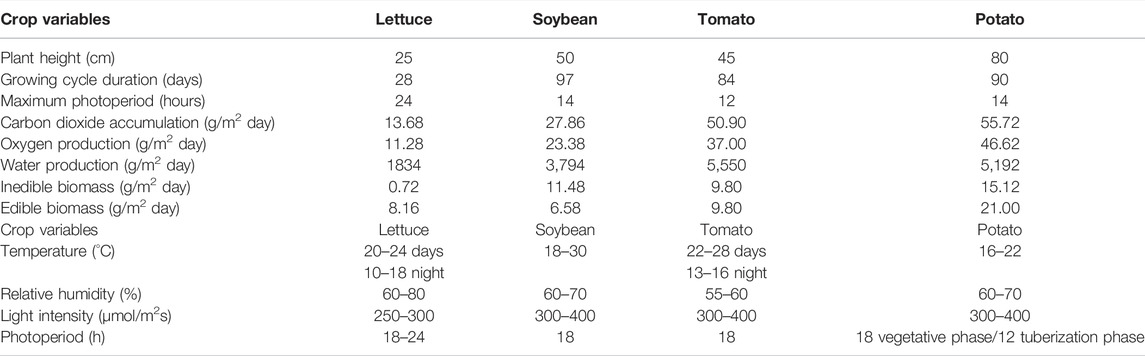
TABLE 2. Main characteristics of the four crops proposed as candidates for PCU life tests (left panel; data elaborated from literature on plant cultivation in controlled environment for Bioregenerative Life Support Systems), and optimal ranges of air temperature, relative air humidity, and light intensity and photoperiod for the crops suggested to validate the PCU design (right panel).
2.2 PCU System Design
The PCU was designed by EnginSoft (Bergamo, Italy) in collaboration with Hosokawa Micron Ltd. (Runcorn, Cheshire, United Kingdom), and engineered as a combination of two sub-systems (Figure 1). The atmospheric module provides the air circulation in the growth chamber, while controlling and monitoring the environmental parameters and air quality. The hydroponic module recirculates the nutrient solution (NS), while controlling its pH and ions composition and concentration. Particular attention was paid to ensuring homogeneous environmental conditions, in both the root and the areal zones.
The PCU has a cultivation area of dimensions 1.5 × 1.2 × 1.2 m (L×W×H). The hydroponic system consists of 2 gullies, each of which can accommodate 9 plants (thus 18 plants in total) at the density of 10 plants m−2.
Two centrifugal blowers provide air recirculation. An air velocity sensor measures the airflow in the heating, ventilation, and air conditioning (HVAC) vertical pipe. From the side plenums, the air is distributed in the chamber through perforated plates and is recovered again at the top through perforated plates (Figure 2).
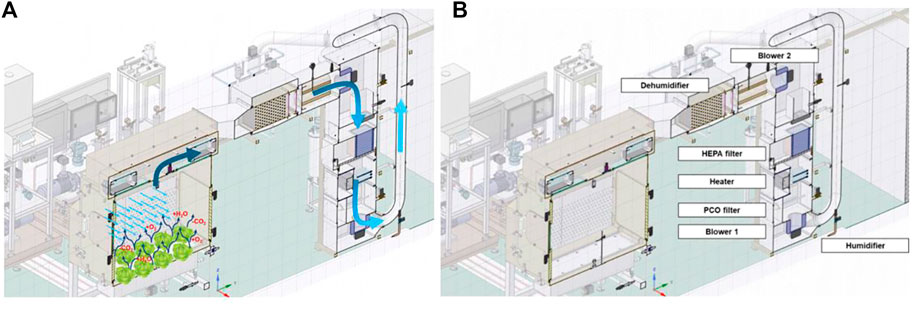
FIGURE 2. Schematic view of the atmospheric system of the PCU: particular of the air flow from the plant chamber to the HVAC (A) and of the components position (B).
The design of the PCU addressed several engineering challenges and specific techniques were implemented to meet the low leak rate required for the mass balance calculation. For instance, various phenomena produce pressure changes, such as external weather conditions, and temperature changes in the chamber simulating day and nights cycles. Therefore, the pressure inside the chamber must be continuously controlled, to limit the gradients between the internal and external environment. For this reason, an active pressure compensation system was developed. A compressor extracts air if pressure must be reduced and stores it in a tank. When pressure must be increased to the stored air is re-injected opening valve V125 (Figure 3). In addition, particular care was paid to the design of the connections among components. For example, inflatable seals are used to achieve airtight door closure.
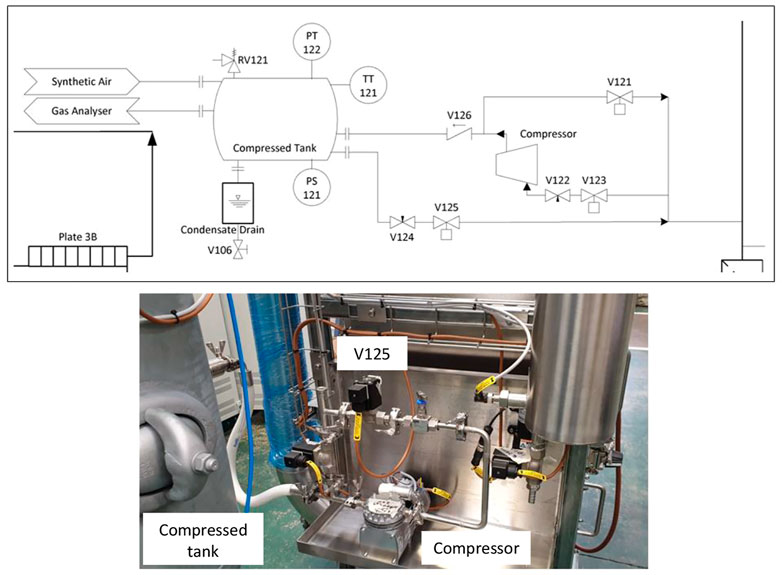
FIGURE 3. Schematic view and picture of the pressure compensation system implemented in the PCU. The compressor extracts air from the chamber if the internal pressure must be reduced and stores it in the compressed tank, while when the pressure has to be increased the air stored in the compressed tank is re-injected by opening valve V125.
Air relative humidity and air temperature were controlled based on RH and T sensor measurements in the chamber and a dedicated dehumidifier and heater (Figure 2B). The dehumidifier reduces excess air humidity, and the heater reaches proper T in the chamber. In addition, a nozzle sprays water when RH is low. Two additional RH/T sensors are placed in the chamber and in the air distribution pipe, and an additional thermistor is located downstream the dehumidifier. A stainless-steel tank collects the generated condensate.
Lighting is provided by two dimmerable light emitting diodes (LED) lamps (full spectrum blue, green, red and far red panel) and a dedicated fan removes generated heat.
An O2/CO2 gas analyzer measures the gas composition, and CO2 concentration is controlled by the injection of pure CO2 until reaching the desired level. The flow is measured by a mass flow transmitter allowing the calculation of the cumulated CO2 volume injected. During standard activity of the chamber the O2 concentration is monitored, and when a threshold value is reached, an aeration procedure is activated. This consists in opening two valves connecting the chamber with the external environment, until the O2 falls below a user-defined threshold and the mass balance computation is reinitialized. In addition, O2 injection can be foreseen in some advanced working mode. The flow is measured by a mass flow transmitter, allowing the calculation of the cumulated O2 volume injected. A HEPA Filter and a PCO (Photo-Catalytic Oxidation) filter are used to trap contaminants.
The hydroponic loop includes a 300 L main stirred tank manufactured in stainless steel (316-L), and the distribution piping composed of two lines that supply the NS flow to the two gullies through four branches each. Two pressure transmitters measure the liquid level in the gullies and a flow transmitter measures the NS total flow. The liquid level and the recirculating flow rate were controlled by means of three control valves one on each inlet line and one on the return line, an irrigation pump and a return pump.
The recirculating NS includes a system to remove contaminants, consisting in three membranes with different pore-size to remove microorganisms and suspended particles bigger than 0.2 microns.
An advanced nutrient delivery system gives the possibility to control the NS composition by dosing 8 stock solutions for a total of 10 side tanks, each equipped with a peristaltic pump and a scale to compute the dosed volume. This system gives a high flexibility in defining the NS recipe, and it is supported by state-of-the-art sensors. Electrical conductivity (EC), pH and temperature are controlled as standard parameters. In addition, dissolved O2, dissolved CO2 and NO3−, NH4+, Ca2+, K+, Na+, Cl−, Mg2+, HPO42− concentrations are monitored to gain further understanding on root uptake phenomena. The pH and EC of the recirculating NS were measured by pH sensors and EC sensors, respectively. The pH control is performed according to the desired set point through the addition of acid (0.5 M HNO3) or base (0.5 M KOH) that are stored in two dedicated 5-L polypropylene tanks. Two concentrated salt solutions (Stock A and B) are stored in dedicated 10-L polypropylene tanks and injected into the loop at a final concentration corresponding to the EC set point.
2.3 Atmospheric Control System
This section details the design of the control system for the PCU, carried out by ODYS Srl (Milan, Italy). To guarantee an optimal operation of the chamber here developed, the control software must manage all the aspects of the atmospheric and the hydroponic subunits. Nonetheless, their tight coordination must be guaranteed, to meet system-wide objectives involving aerial and hydroponic variables, such as pressure gradients. The controller must enable the operation of the system according to user-defined specifications, which are based on the requirements of the cultivated crops and the specific test plans.
The complexity of the above-mentioned tasks does not allow an exhaustive description of the whole control system, therefore in this paper we focus on the main atmospheric components, whose primary objective is to guarantee homogeneous and fully controlled environmental conditions in terms of air circulation, pressure, air composition, T, and RH.
2.3.1 Control System Overview
The control and monitoring functionalities are provided by two separate software products, a real-time controller, and a Graphical User Interface (GUI). Both applications have been developed in Python programming language, which guarantees code portability, faster turnarounds, and seamless functionality extensions, all being crucial features for prototypes development.
The real time controller runs on a Unix embedded platform. At the fastest rate, it executes the most critical tasks such as the monitoring of all the variables that are linked to a possible fault and/or alarm of the PCU, and the communication with the GUI. The atmospheric and hydroponic control loops run at slower sampling rates, the faster being 5 s. Given the different timescales of the variables at hand in the entire system, the sensors’ reading as well as the actuations are implemented on several independent control rings. Data logging is provided as well by the real-time controller.
The GUI is a desktop application that can operate the system remotely. It enables real-time inspection of all the monitored values, as well as the current state of every manipulated variable. The configuration of each control task can be modified in real-time, such as set points or manual commands. The changes in the configurations can also be scheduled, enabling an effective planning of all the different phases of the experiment, according to the specific needs of the crop.
Research and scientific data acquisition are the main objectives of the PCU, therefore experiment flexibility, safety and easy extension of testing capabilities are of utmost concern. To this end almost every control loop, besides the most critical ones such as the pressure regulation system, allow for different operating regimes. The OFF mode disables any active controller of a specific task, as well as its alarm management. Only the measures from the sensors, if any, are collected while operating in this mode, and every actuator is in its default position. The manual mode consists in disabling the feedback routines of a specific control task, while allowing the operator to manually operate from the GUI all the actuators. Finally, the automatic mode is the one where the feedback algorithms of a control task are active. Given the complexity of the system, and the possibility of having the control loops in different combinations of operating modes, the PCU requires a very reliable handling of dangerous situations, as well as feedback controllers that are robust against unmatched disturbances, which are mainly caused by crops growing and operations in manual mode.
2.3.2 Model-free Controllers
The PCU is a medium-scale process, where many tasks consist in controlling Multi-Input Multi-Output (MIMO) systems, some of which are interacting with each other and must be coordinated for achieving process-wide goals. Moreover, different time-responses coexist especially in the coordination layer given the different nature of the variables. This challenge has been tackled with a hierarchical multilayer system, whose control actions are performed by several regulators working at different timescales. Advanced model-based control algorithms, among which we cite Model Predictive Control (MPC) (Rawlings et al., 2017), are a natural answer to the challenges posed by such control requirements and architecture. However, deriving control oriented mathematical models is time consuming and not flexible in a prototyping stage, making it preferable to exploit model-free controllers. Therefore, for the coordination layer we have opted for a state machine, whereas the low-level controllers rely on Proportional Integral Derivative (PID) regulators, bang-bang control, and the possible combinations of those.
PID controllers are implemented in parallel form, with anti-windup action for taking care of the nonlinearities introduced by actuators saturation, which is very frequent in valves control. Let
where
In the next we discuss the design of the crucial atmospheric controllers. It is worth noticing that many minor tasks are involved in the atmospheric system even though they are not described in detail in this article. Among them, we cite the day/night cycle scheduling, with the regulation of light intensity and spectrum, the air filtering, and the photocatalytic oxidation for removing bio and non-biological contaminations.
2.3.3 Air Velocity Control
The automatic control of the air velocity is crucial in the PCU, because if an adequate flow rate of air is not guaranteed then it is not possible to effectively control T, RH, and air composition in the growth chamber. Nonetheless a correct air flow is crucial to guarantee heterogeneous conditions to all the plants. The objective of the control is to manipulate the rotational speed of two blowers, namely blower 1 and blower 2, such that the air flow inside the chamber is regulated to a defined set-point, which can be dynamic during the experiment. Blower 1 is located before the chamber, with the aim of overtaking pressure losses due to the chamber distribution unit and the dehumidification system, whereas blower 2 is placed downstream the chamber, to overtake pressure losses in the remaining elements of the HVAC unit.
In order to coordinate the two actuators, blower 1 is controlled in open-loop as a function of the flow rate set point. In the specific, let
where
2.3.4 Pressure Control
The objective of this function is to limit the differential pressure between the chamber and the external environment, thus reducing potential gas leakage, while simultaneously maintaining an overpressure to prevent any air intake from outside.
The PCU is equipped with a synthetic air cylinder controlled by an on-off valve to increase the pressure in the system, and a compressor to extract air from the system and thus decreasing the pressure. The compressor is a binary actuator as well. The controller regulates the pressure upstream blower 2, indicated as
2.3.5 Air Composition
In order to allow accurate measurement of plant gas-exchange, O2 and CO2 concentrations of the closed atmosphere in the chamber must be monitored and controlled. Under nominal conditions, the O2 concentration is monitored continuously, and when the threshold value of
The O2 injection is therefore achieved by actuating a proportional valve
with
A single PID (
Given the mono-directional control and the fact that it is continuously operating, a hysteresis method is built around
2.3.6 Air T and RH Control
The objective of this function is to regulate the temperature
The system is equipped with a heating coil, a cooling coil, and a humidifier. The heater and the de-humidifier normalized proportional control actions are indicated by
Let
On the other hand, the humidifier
3 Results and Discussion
3.1 Plant Requirements
The literature review performed to collect information on plant cultivation in a controlled environment provided useful data to define the optimal environmental parameters for the selected crops. Table 1 shows the reference ranges adopted in NASA’s plant cultivation experiments for BLSSs, performed in the Biomass Production Chamber (BPC) at Kennedy Space Center, consisting of a 20 m2 growing area within a 113 m3 closed growth chamber (Wheeler et al., 1996a). Extensive testing of crop responses to air T and RH, photoperiod, light intensity and spectral composition was conducted in the BPC as a part of the NASA CELSS (Controlled Ecological Life Support) program (Wheeler, 2017). The overall focus of these studies was to define the optimal environmental conditions able to boost the growth and yield of selected candidate species for space missions (Wheeler et al., 2003). The growth chamber was decommissioned in 1998 after nearly 10 years of continuous operation, and many of the results of the crop tests were reported in the literature, including biomass yield and gas exchange (CO2 removal and O2 production) (Wheeler 1992; 1996b), and radiation use efficiency (Wheeler et al., 2008). Table 2 shows the reference values recorded in the BPC regarding some main biometric, physiological, and productive characteristics of four of the species selected for the PCU life tests (lettuce, soybean, tomato, potato).
The main plant requirements for the atmospheric module of the PCU involved monitoring and controlling air T, RH, and lighting conditions. In the specific, the required performance of the lighting system was analyzed in terms of photoperiod, light intensity and spectral composition, in order to provide different lighting durations, up to continuous lighting, to test the possibility of improving plant biomass yield as well as oxygen production in the PCU. The light intensity was dimmable, to adapt the radiation level to the needs of different crops, as well as to optimize the light use efficiency. In addition, the light radiation was homogeneously distributed to achieve a maximum fluctuation of 40 μmol m−2 s−1 at the canopy level for different plant positions. Finally, the spectral composition (red:blue ratio, red:far-red ratio, blue:green ratio, etc.) was customizable (Table 3), to influence the crop-specific response in terms of plant physiology (leaf gas exchange analysis) and morphogenesis (stem elongation, plant size) (Paradiso and Proietti, 2021). Based on the ranges of optimal values reported in the literature for the selected crops (Langhans and Tibbitts, 1997; Anderson et al., 2018, Favreau et al., 2005; Wheeler et al., 1996a, 1996b, 2003, 2008), and considering the possibility of including potential crops for future experiments, the ranges of each environmental parameter to be ensured in the PCU were determined (Table 2).
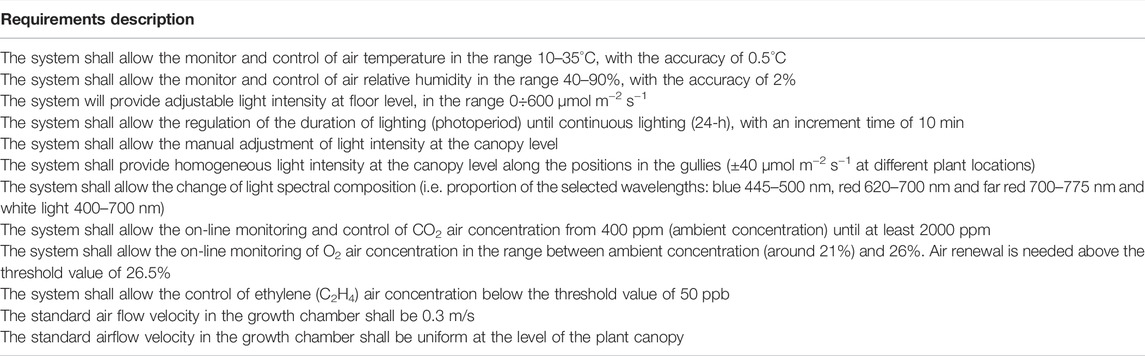
TABLE 3. Requirements considered for the design of the atmospheric module of the PCU.
Finally, another key aspect of closed growth chamber is the control of airflow velocity and homogeneity. Previous ESA work (ACSA project) conducted in the HPC of the MELiSSA Pilot Plant showed that increased uniformity of airflow velocity significantly improved the homogeneity of biomass distribution throughout the growth chamber (Peiro et al., 2020). In the specific, under inhomogeneous air velocity conditions, the unbalanced airflow configuration negatively affected the homogeneity of plant growth, resulting in adverse environmental conditions in the different modules of the growth chamber, responsible for plant bolting, leaf rot and increased inedible biomass. Therefore, referring to the values found by Peiro et al. (2020), the airflow velocity in the PCU was set to an average of 0.3 m s−1, trying to ensure optimal airflow uniformity.
The overview of the main requirements considered for the design of the PCU is summarized in Table 3.
Lettuce cultivar ‘Grand Rapids’ was the genotype selected for the first PCU life test. The test was conducted following the plan and protocol of a previuos ESA work (ACSA project) conducted at the MPP in 2017 (Peiro et al., 2020). The followed approach allowed to compare past data obtained during the ACSA project with the results of the present life test, thus having a reference PCU performance evaluation. Specifically, lettuce crop was grown in the PCU with conditions as close as possible to the ones of ACSA test. Those include genetic material, seedling production, climatic conditions, nutrient solution composition and concentration, cycle length and phenological stages (Peiro et al., 2020). Lettuce plants in the PCU was grown according to a light/dark regime of 16/8 h with an intensity of 420 ± 40 μmol m−2 s−1, while air T and RH was set at 26/20°C and 50/70%, respectively. The experiment was carried out with a CO2 concentration set at 1,000 ppm, while the harvesting of all the plants was performed at 28 days after transplanting.
3.2 Control System Validation
The performance of the atmospheric control system was evaluated on specific maneuvers designed to stress the challenge of the algorithms. For each controller, particular attention was devoted to tracking performance, limits satisfaction and actuation effort. Air T, RH, and CO2 controls are common in other BLSS projects, at least in the most recent ones (Zabel et al., 2016), but discussions on the control strategies, and details about algorithm performance are an added value to the current state-of-the-art research.
Figure 4 shows the air velocity control. The test scenario was a cold start, meaning a system startup from rest position, followed by a series of step changes in the air velocity set-point, commanded by the user. The transient of the cold start maneuver clearly shows the benefit of the incremental constraints on the velocity reference. The rise time for a step of
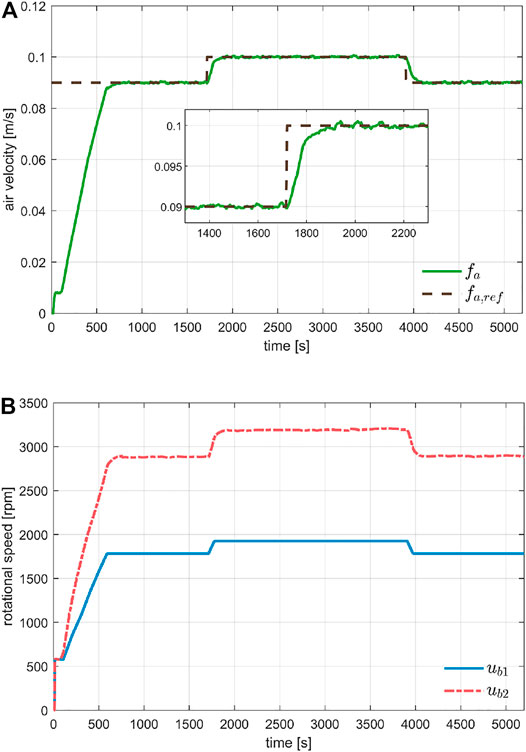
FIGURE 4. Evaluation of air velocity control during system startup and sudden changes of the set-point. Plot (A) shows the tracking performance under different step changes, while Plot (B) the commanded rotational speed for the two blowers.
Figure 5 shows the pressure upstream blower 1, which was controlled by the bang-bang controller with hysteresis described in Section 2.3.4. The reference value for the overpressure was set to
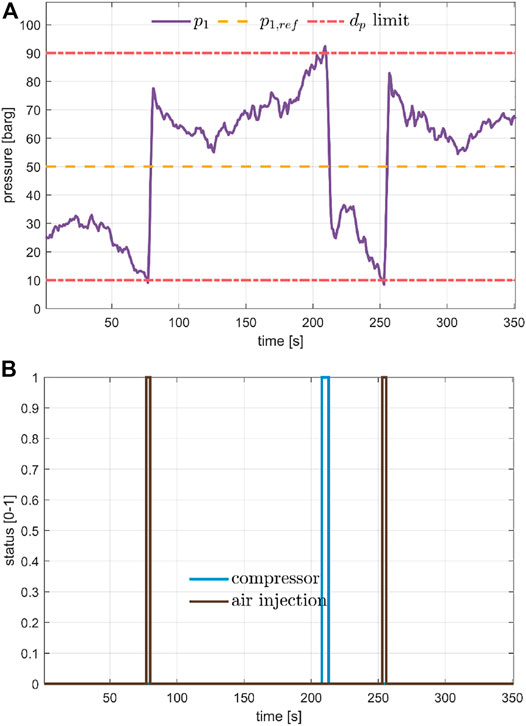
FIGURE 5. Pressure control keeping the pressure upstream blower 1 inside the design constraint, plot (A) by switching ON and OFF the air injection and the compressor for air removal, shown in plot (B).
For the air composition we evaluated both O2 and CO2 concentrations. The O2 control is mostly passive, as oxygen enrichment was not provided in this first life test. The control behaviour for an O2 injection event was collected in Figure 6. The figure details the tracking performance for different concentration set-points. It was worth noticing that, as described in Section 2.3.5, the injection of O2 is limited by the pressure limits, given the high impact on its dynamics. Indeed, the bottom plot shows the measure of
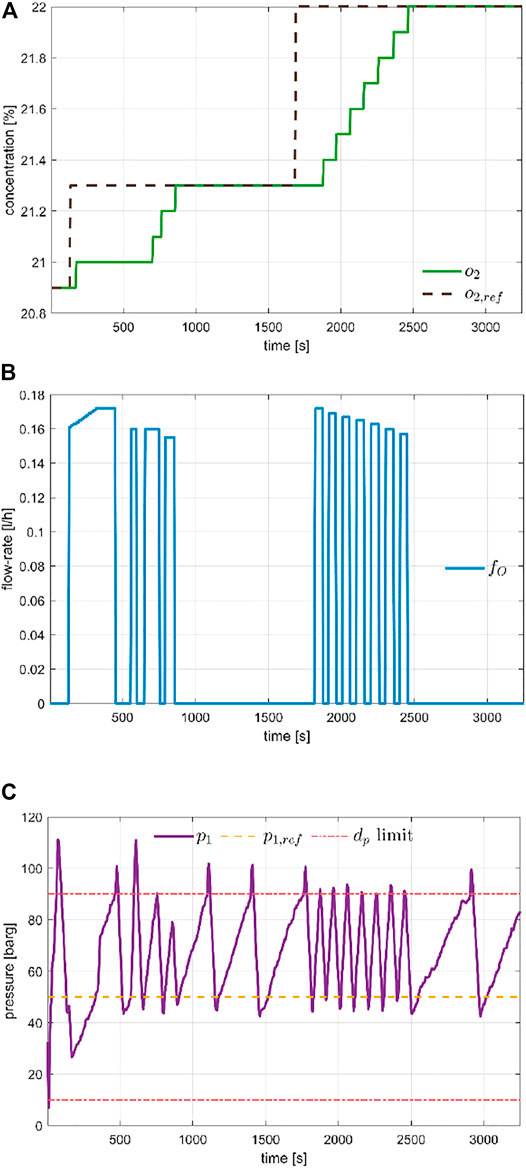
FIGURE 6. Evaluation of O2 recovery control, for different set-point values. Plot (A) shows the tracking performance, Plot (B) the actuation valve position and Plot (C) the simultaneous control of the chamber pressure that limits the O2 injection.
The regulation of the CO2 concentration is depicted in Figure 7 which collects the detail of a day-night cycle, specifically for the second day of the experiment. The objective was to show the controlled flow rate of the CO2 injection while the CO2 concentration must be maintained around the
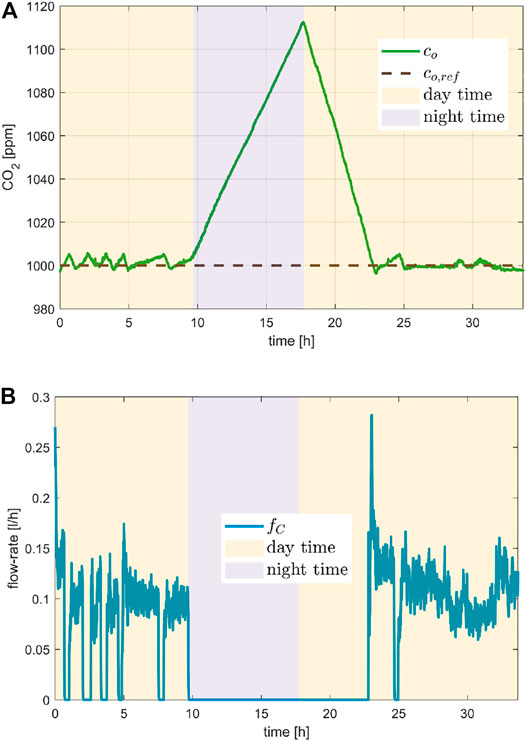
FIGURE 7. CO2 control performance evaluated in a day/night cycle at the second day of the experiment. Plot (A) shows the tracking of the CO2 set-point and plot (B) the flow rate of the injected CO2.
Lastly, Figure 8 shows the regulation of air T and RH in the growth chamber. The plots in the left column detail the 1st day of the experiment, the ones on the right the 27th day. The aim was to compare the performance at the beginning and at the end of the experiment, thus showing the impact of the plants on the tracking performance. Both air T and RH set-points underwent the typical step changes on the switch between day and night. As expected, the humidifier was mostly used at the beginning of the experiment. It must be pointed out that T and RH dynamics are a MIMO system that was inherently hard to control with coupled PIDs. As it was evident, the performance when plant transpiration was very low was much worse than that obtained at the end of the experiment, suggesting the need to develop more advanced control algorithms. Indeed, the control achievements were found to be sufficient to conduct a first complete life test, but the wide range of operating conditions for air T, RH, and air flow rate, as well as the impact of the lights and crops could be handled optimally only with a model-based controller.
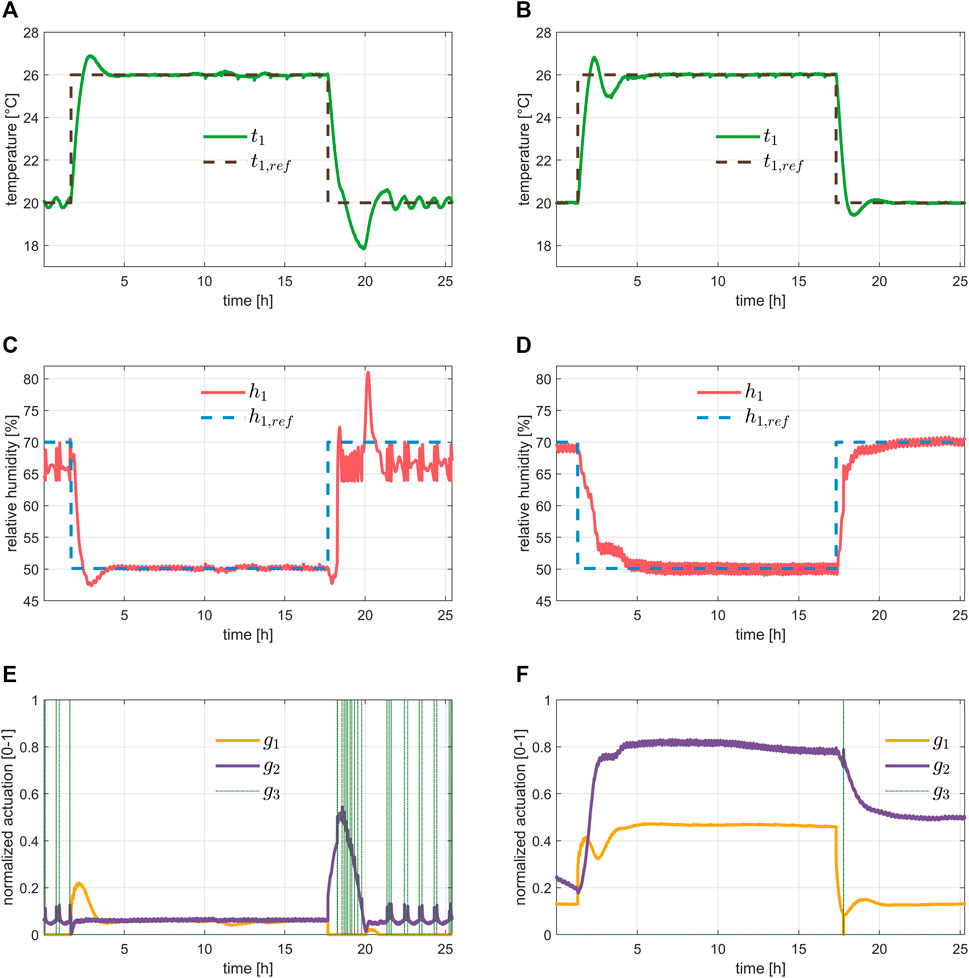
FIGURE 8. Evaluation of temperature and relative humidity control for different set-points, typical of a day/night cycle. The left column shows the results during the first day of the experiment described in Section 3.1, while the second column shows the results during the last day. From top to bottom we have: the tracking performance of the temperature in plots (A,B), the tracking performance of the relative humidity in plots (C,D), and the input commands, namely the heater, dehumidifier, and humidifier in plots (E,F).
Based on these results, MPC is a potential candidate for developing a robust and accurate predictive controller, and we foresee a future review of some control strategies to have more consistent dynamics over the entire operating range and possible disturbances. A modelling activity is foreseen to derive control-oriented models of plants’ behaviour, necessary for accurate predictive control systems (Hu et al., 2008; Poulet et al., 2020).
3.3 Leak Rate Computation
The life test reported in this paper proved the capability of the system to collect the data required for mass balances computation. At the 21st day, the system was aerated due to the high O2 concentration accumulated which could pose a safety risk. The air was renewed and mass balance computation reinitialized. Consequently, the total mass balance was computed for the first 20 days and for the following 6 days (Table 4). In addition, mass balance was computed daily in order to estimate the leak rate (Table 5). The calculation considers corrective factors due to atmospheric pressure, system pressure and temperature variations. To minimize the temperature corrective factor, the daily mass balances were computed when the temperature was in controlled and in stable conditions. For simplicity, the 22:00 of each day has been selected.
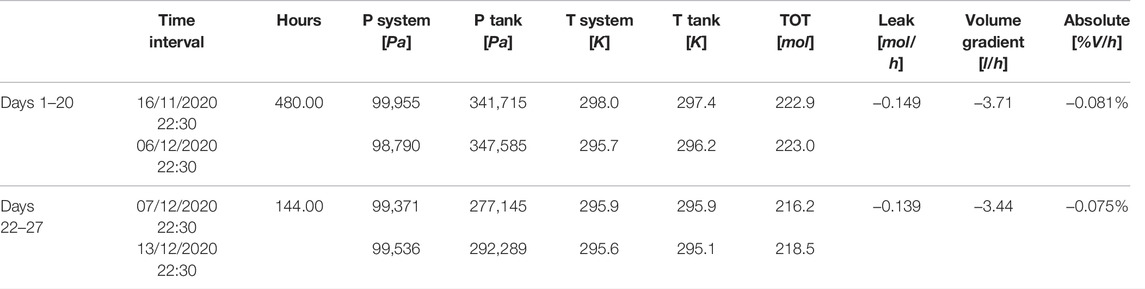
TABLE 4. Total mass balance computation in terms of moles and % of volume during the 27 days life test on lettuce in the PCU.
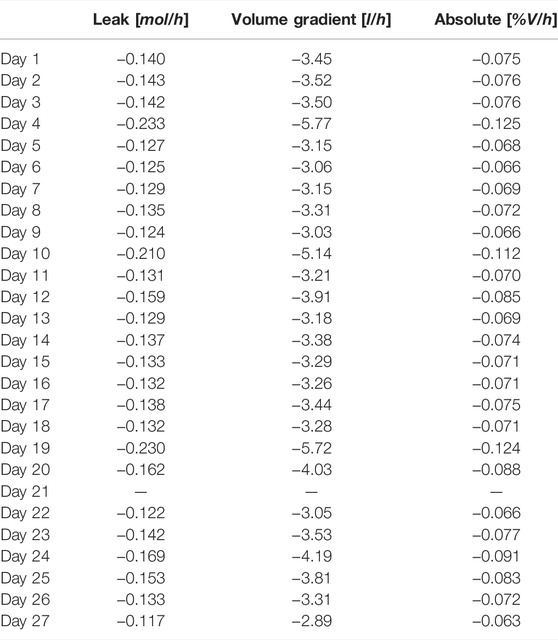
TABLE 5. Daily mass balance computation in terms of % of volume per hour in the 27 days life test on lettuce in the PCU.
The results show a good system tightness, comparable with the preliminary tests and, more importantly, stable along the life test (Figure 9). The average leak rate for the first 20 days is 0.081 and 0.075% for the following 6 days. In addition, mass balance was computed also daily (Figure 9).
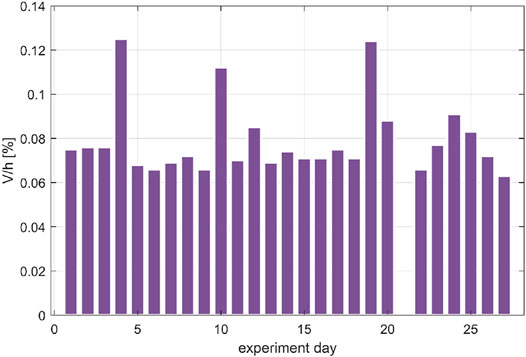
FIGURE 9. Air leakage evaluation in terms of percentage of volume per hour in the 27 days life test on lettuce in the PCU (during day 21 an aeration was performed, thus the leakage is not reported).
In conclusion, the research scope of the PCU implies the need to measure variables of interest for the mechanistic modeling of the higher plant compartment. Functional and life tests performed on the atmospheric module demonstrated the efficiency of both the design and the realization of this sub-system. The controller was proven to finely regulate environmental parameters and to collect precisely data, in a efficiently sealed growth chamber., The performance assessment shows that the PCU is suitable for investigations aiming at modelling the higher plant compartment of BLSSs.
Data Availability Statement
The original contributions presented in the study are included in the article/Supplementary Material, further inquiries can be directed to the corresponding author.
Author Contributions
SP and LB conceived the project. GC, AP, RP and CQ contributed to the realization of the project activities, performed the plant life test and wrote the first draft of the paper. LB, SP and YR revised the final version. All the authors contributed to writing the manuscript in equal part.
Funding
Funding was provided by the European Space Agency (ESA) through the MELiSSA project PlAnt Characterization unit for closed life support system—engineering, MANufacturing and testing (PaCMAN).
Conflict of Interest
Author GC is employed by ODYS S.r.l. (Milan, Italy) and authors CQ and LB are employed by EnginSoft S.p.A. (Bergamo, Italy).
The remaining authors declare that the research was conducted in the absence of any commercial or financial relationships that could be construed as a potential conflict of interest.
Publisher’s Note
All claims expressed in this article are solely those of the authors and do not necessarily represent those of their affiliated organizations, or those of the publisher, the editors and the reviewers. Any product that may be evaluated in this article, or claim that may be made by its manufacturer, is not guaranteed or endorsed by the publisher.
Acknowledgments
The Authors acknowledge all the partners of the PaCMAN project, the ESA staff of the MELiSSA programme and the support of the MELiSSA foundation (https://www.melissafoundation.org/).
Supplementary Material
The Supplementary Material for this article can be found online at: https://www.frontiersin.org/articles/10.3389/fspas.2022.820752/full#supplementary-material
References
Anderson, M. S., Ewert, M. K., and Keener, J. F. (2018). Life Support Baseline Values and Assumptions Document. Houston, TX: NASA JSC. NASA/TP-2015-218570.
Boscheri, G., Kacira, M., Patterson, L., Giacomelli, G., Sadler, P., Furfaro, R., et al. (2012). Modified Energy cascade Model Adapted for a Multicrop Lunar Greenhouse Prototype. Adv. Space Res. 50 (7), 941–951. doi:10.1016/j.asr.2012.05.025
Cahill, T., and Hardiman, G. (2020). Nutritional Challenges and Countermeasures for Space Travel. Nutr. Bull. 45 (1), 98–105. doi:10.1111/nbu.12422
De Pascale, S., Arena, C., Aronne, G., De Micco, V., Pannico, A., Paradiso, R., et al. (2021). Biology and Crop Production in Space Environments: Challenges and Opportunities. Life Sci. Space Res. 29, 30–37. doi:10.1016/j.lssr.2021.02.005
Dixon, M., Stasiak, M., Rondeau, T., and Graham, T. (2017). Advanced Life Support Research and Technology Transfer at the university of Guelph. Open Agric. 2 (1), 139–147. doi:10.1515/opag-2017-0013
Favreau, M., Ordonez, L., Rodriguez, A., and Waters, G. (2005). “Application of Non-rectangular Hyperbola Model to the Lettuce and Beet Crops,” in Proceedings of the G. 05ICES-23, 35th ICES (Rome. doi:10.4271/2005-01-2823
Gòdia, F., Albiol, J., Pérez, J., Creus, N., Cabello, F., Montràs, A., et al. (2004). The MELISSA Pilot Plant Facility as an Integration Test-Bed for Advanced Life Support Systems. Adv. Space Res. 34, 1483–1493. doi:10.1016/j.asr.2003.08.038
Guo, S. S., Mao, R. X., Zhang, L. L., Tang, Y. K., and Li, Y. H. (2017). Progress and prospect of Research on Controlled Ecological Life Support Technique. Reach 6, 1–10. doi:10.1016/j.reach.2017.06.002
Haeuplik-Meusburger, S., Paterson, C., Schubert, D., and Zabel, P. (2014). Greenhouses and Their Humanizing Synergies. Acta Astronautica 96, 138–150. doi:10.1016/j.actaastro.2013.11.031
Heer, M., Baecker, N., Smith, S. M., and Zwart, S. R. (2020). “Nutritional Countermeasures for Spaceflight-Related Stress,” in Stress Challenges and Immunity in Space (Cham: Springer), 593–616. doi:10.1007/978-3-030-16996-1_33
Hendrickx, L., De Wever, H., Hermans, V., Mastroleo, F., Morin, N., Wilmotte, A., et al. (2006). Microbial Ecology of the Closed Artificial Ecosystem MELiSSA (Micro-ecological Life Support System Alternative): Reinventing and Compartmentalizing the Earth's Food and Oxygen Regeneration System for Long-Haul Space Exploration Missions. Res. Microbiol. 157 (1), 77–86. doi:10.1016/j.resmic.2005.06.014
Hendrickx, L., and Mergeay, M. (2007). From the Deep Sea to the Stars: Human Life Support through Minimal Communities. Curr. Opin. Microbiol. 10, 231–237. doi:10.1016/j.mib.2007.05.007
Hu, D., Liu, H., Yang, C., and Hu, E. (2008). The Design and Optimization for Light-Algae Bioreactor Controller Based on Artificial Neural Network-Model Predictive Control, Acta Astronautica 63, 7-10, 1067–1075. doi:10.1016/j.actaastro.2008.02.008
Langhans, R. W., and Tibbitts, T. W. (1997). Plant Growth Chamber Handbook. Ames, Iowa: Iowa Agricultural and Home Economics Experiment Station.
Lasseur, C., Brunet, J. D., De Weever, H., Dixon, M., Dussap, C. G., Godia, F., et al. (2010). MELiSSA: the European Project of Closed Life Support System. Gravitat. Space Res. 23, 3–12.
Liu, H., Yao, Z., Fu, Y., and Feng, J. (2021). Review of Research into Bioregenerative Life Support System(s) Which Can Support Humans Living in Space. Life Sci. Space Res. 31, 113–120. in press. doi:10.1016/j.lssr.2021.09.003
MELiSSA foundation (2022). Melissafoundation. Available at: https://www.melissafoundation.org (Accessed March 23, 2022).
Mergeay, M., Verstraete, W., Dubertret, G., Lefort-Tran, M., Chipaux, C., and Binot, R. A. (1988). “MELiSSA A Micro-organisms-based Model for ‘CELSS’ Development,” in Proceedings at the 3rd European Symposium on Space Thermal Control Life Support Systems Noordwijk (Piscataway, NJ.
Paradiso, R., and Proietti, S. (2021). Light-Quality Manipulation to Control Plant Growth and Photomorphogenesis in Greenhouse Horticulture: The State of the Art and the Opportunities of Modern LED Systems. J. Plant Growth Regul. 41, 742–780. doi:10.1007/s00344-021-10337-y
Peiro, E., Pannico, A., Colleoni, S. G., Bucchieri, L., Rouphael, Y., De Pascale, S., et al. (2020). Air Distribution in a Fully-Closed Higher Plant Growth Chamber Impacts Crop Performance of Hydroponically-Grown Lettuce. Front. Plant Sci. 11, 537. Article 537. doi:10.3389/fpls.2020.00537
Poulet, L., Dussap, C.-G., and Fontaine, J.-P. (2020). Development of a Mechanistic Model of Leaf Surface Gas Exchange Coupling Mass and Energy Balances for Life-Support Systems Applications. Acta Astronautica 175, 517–530. doi:10.1016/j.actaastro.2020.03.048
Rawlings, J. B., Mayne, D. Q., and Diehl, M. M. (2017). Model Predictive Control: Theory, Computation, and Design. Madison, WI: Nob Hill Publishing, LCC.
Waters, G., Zheng, Y., Gidzinski, D., and Dixon, M. (2005). “Empirical Relationships between Light Intensity and Crop Net Carbon Exchange Rate at the Leaf and Full Canopy Scale: Towards the Integration of A Higher Plant Chamber,” in The MELiSSA Loop’. 05ICES-290, 35th ICES (Guelph, Ontario, Canada: University of Guelph).
Wheeler, R. M. (2017). Agriculture for Space: People and Places Paving the Way. Open Agric. 2, 14–32. doi:10.1515/opag-2017-0002
Wheeler, R. M. (1992). Gas-exchange Measurements Using a Large, Closed Plant Growth Chamber. HortSci 27, 777–780. doi:10.21273/hortsci.27.7.777
Wheeler, R. M., Mackowiak, C. L., Sager, J. C., Knott, W. M., and Berry, W. L. (1996b). Proximate Composition of CELSS Crops Grown in NASA's Biomass Production Chamber. Adv. Space Res. 18, 43–47. doi:10.1016/0273-1177(95)00860-h
Wheeler, R. M., Mackowiak, C. L., Stutte, G. S., Yorio, N. C., Ruffe, L. M., Sager, J. C., et al. (2003). Crop Production for Advanced Life Support Systems. Observations from the Kennedy Space Center’ Breadboard Project. NASA Tech. Mem. 211184, 58.
Wheeler, R. M., Mackowiak, C. L., Stutte, G. W., Sager, J. C., Yorio, N. C., Ruffe, L. M., et al. (1996a). NASA's Biomass Production Chamber: A Testbed for Bioregenerative Life Support Studies. Adv. Space Res. 18, 215–224. doi:10.1016/0273-1177(95)00880-n
Wheeler, R. M., Mackowiak, C. L., Stutte, G. W., Yorio, N. C., Ruffe, L. M., Sager, J. C., et al. (2008). Crop Productivities and Radiation Use Efficiencies for Bioregenerative Life Support. Adv. Space Res. 41, 706–713. doi:10.1016/j.asr.2007.06.059
Wheeler, R. M. (2010). Plants for Human Life Support in Space: from Myers to Mars. Gravitat. Space Res. 23, 25–35.
Keywords: controlled environment, Lactuca sativa L., air composition control, thermal control, air tightness, hydroponics, closed growth chamber, BLSS
Citation: Pannico A, Cimini G, Quadri C, Paradiso R, Bucchieri L, Rouphael Y and De Pascale S (2022) A Plant Characterization Unit for Closed Life Support: Hardware and Control Design for Atmospheric Systems. Front. Astron. Space Sci. 9:820752. doi: 10.3389/fspas.2022.820752
Received: 23 November 2021; Accepted: 23 March 2022;
Published: 14 April 2022.
Edited by:
Lucie Poulet, UMR6602 Institut Pascal (IP), FranceReviewed by:
Christine Escobar, Space Lab Technologies, LLC, United StatesAranzazu Manzano Pérez, Spanish National Research Council (CSIC), Spain
Copyright © 2022 Pannico, Cimini, Quadri, Paradiso, Bucchieri, Rouphael and De Pascale. This is an open-access article distributed under the terms of the Creative Commons Attribution License (CC BY). The use, distribution or reproduction in other forums is permitted, provided the original author(s) and the copyright owner(s) are credited and that the original publication in this journal is cited, in accordance with accepted academic practice. No use, distribution or reproduction is permitted which does not comply with these terms.
*Correspondence: Roberta Paradiso, rparadis@unina.it