Flowing Gas Experiments Reveal Mechanistic Details of Interfacial Reactions on a Molecular Level at Knudsen Flow Conditions
 Riccardo Iannarelli1
  Christian Ludwig
 Michel J. Rossi
- 1École Polytechnique Fédérale de Lausanne (EPFL), Risk Prevention, EPFL VPO-SE OHS-PR, Lausanne, Switzerland
- 2Paul Scherrer Institute (PSI), ENE LBK CPM, Villigen, Switzerland
- 3École Polytechnique Fédérale de Lausanne (EPFL), ENAC IIE GR-LUD, Lausanne, Switzerland
Knudsen flow experiments and its interpretation in terms of adsorption/desorption kinetics as well as quantitative uptake on substrates of interest is presented together with the description of critical design parameters of the Knudsen Flow Reactor (KFR). Hitherto focused almost exclusively on the uptake phase exposing a virgin substrate to interacting gases, we now extend the experiment and its interpretation to the desorption phase at ambient temperature. We present analytical expressions for different experimental situations in terms of adsorption (ka), desorption (kd) and effusion (ke) rate constants. The measurement of kd leads to surface residence times (1/kd) obtained under the same experimental conditions as the uptake (ka) that results in the determination of the Langmuir equilibrium constant KL = ka/kd. We emphasize the interaction of semivolatile organic probe gases and small polar molecules with amorphous carbon and mineral dust materials at ambient temperatures. The latter leads to a molecular characterization scheme based on the use of up to ten different reactive probe gases. After saturation of the uptake of each probe gas this results in a reactivity map of the interface. Several examples are used to underline the broad applicability of the technique such as the silver/air (Ag) interface and the reactivity of TiO2 materials towards uptake of CO2 and CH3OH. Following characterization of several types of amorphous carbon a model incorporating several structural elements in agreement with the reactive gas titration is proposed. For instance, an interface that is at the same time weakly basic and strongly reducing is composed of pyrones and hydroquinones whose simultaneous occurrence leads to stable free radicals that may play a role in atmospheric chemistry (EPFR). The question is raised what makes an interface hydrophobic in terms of surface functional groups when interacting with small polar molecules such as H2O(D2O), HCl, NO2 and NH2OH. Multidiagnostic studies of heterogeneous reactions are enabled using stirred-flow reactors (SRF) that are a logical extension of the KFR approach thus relaxing the Knudsen flow requirements. Previous work using SRF on low-temperature substrates such as H2O ices is highlighted that may be of interest to the exoplanetary and space sciences community.
Introduction
The rate law of a reaction gives a powerful hint to mechanistic details of the rate determining step in a complex reaction. Therefore, the study of the chemical kinetics of a reaction is a powerful inroad to discover the mechanism of a reaction that static methods of investigation are unable to deliver (Benson, 1960; Benson 1976; Laidler, 1987). Flowing gas experiments are especially useful in the study of rate processes because they directly measure reaction or flow rates in contrast to static reactor studies where concentrations represent the canonical variable that are not directly related to rates. This article presents in some detail the principles and some applications of the Knudsen Flow Reactor (KFR) applied to chemical kinetics, that is to the measurement of the rates of chemical reactions. The precursor technique itself, embodied as Knudsen Effusion Mass Spectrometry (KEMS, Booth et al., 2009) has been successfully applied to high temperature thermodynamics as far as the vapor pressure of refractive materials and its associated decomposition reactions are concerned (Hildenbrand, 1970). The technique consists of sampling a small fraction of vapor in equilibrium with its solid phase from a small hole in a static reaction vessel and analyzing the effusive molecular beam using mass spectrometric (MS) methods. S.W. Benson realized the potential usefulness of the technique for chemical kinetics and applied it at first to the measurement of the decomposition (pyrolysis) rate constants of gas phase species. He and his coworkers published a landmark article on the utility of the KFR in kinetic applications of a wide range of reactions spanning the whole gamut of homogeneous (gas) and heterogeneous (multiphase) reactions, energy transfer reactions and kinetics of processes of atomic and molecular intermediates. These authors called it Very Low-Pressure Pyrolysis (VLPP) in order to emphasize the molecular flow regime (Golden et al., 1973). Mass spectrometric analysis was based at first on residual gas detection in a single detection chamber, later on it was extended to molecular beam sampling in a differentially pumped two-chamber vacuum system coupled to phase sensitive detection by mechanically chopping the molecular beam and recovering the modulated fraction of the MS signal using lock-in detection (Stein et al., 1976). This modification was critical and represented a substantial improvement in the detection, especially of transients such as free radicals that were generated at high temperatures. The modulated molecular beam phase-sensitive detection has remained state-of-the-art in chemical kinetics up until today. Lock-in detection enabled the direct identification of free radicals and the measurement of reactions of free radicals in pyrolysis and later in laser-based techniques of free radical generation in Very Low-Pressure Pyrolysis (Golden et al., 1973; Golden et al., 1981).
The emphasis of this report is placed on the measurement of multiphase chemical kinetics where gases interact with a condensed phase such as a solid or liquid of low vapor pressure in contrast to studies of homogeneous gas phase reactions. In what follows we will briefly mention similar work being performed in other laboratories using molecular-beam modulated phase-sensitive MS detection because this analyzing technique based on a line-of-sight detection of stable or transient molecules offers a straightforward interpretation of the acquired MS signals without interference from collisions with the walls prior to detection. It is as if we could “see” directly into the reaction vessel before the effusing molecules are hitting the vessel walls of the detection chamber, that is before they may adsorb or react before detection. This aspect of direct line-of-sight detection becomes essential for atomic and molecular transient species such as atoms and free radicals as well as for vibrationally or (metastable) electronically excited species. Kinetic studies monitored by residual gas analysis in contrast to phase-sensitive detection proposed here suffer from the uncertainty whether or not interaction with the vessel walls of the MS detection chamber may affect the measurement of the kinetics resulting from the interaction taking place in the KFR (Underwood et al., 2000; Usher et al., 2002). Therefore, we will preferentially present KFR studies making use of state-of-the-art detection methods that naturally also offer residual gas detection if wanted when using the total MS signal rather than the modulated portion. Phase sensitive detection always offers both modes of evaluating the MS signal, that is using either the total MS signal (residual gas mode) or the modulated portion (lock-in detection).
Among the research groups actively performing measurements of interfacial kinetics is the one headed by B.J. Finlayson-Pitts at UC Irvine where uptake studies of n-butylamine, NH3 and amines are interacting with solid dicarboxylic acids (Fairhurst et al., 2017a; Fairhurst et al., 2017). The new wrinkle is, apart from the expression of the uptake kinetics in terms of the uptake probability, a study of the reaction products which are stable molten salt ionic liquids when n-butylamine is used as a base in the presence of an odd carbon chain dicarboxylic acid such as malonic acid (C3). A research group that performed numerous detailed and careful uptake studies using a KFR in the past is headed by J.N. Crowley of the Max Planck Institute of Chemistry in Mainz, Germany. Examples are the decomposition of O3 on Saharan dust (Hanisch and Crowley, 2003b), the heterogeneous reactivity of NO and HNO3 on mineral dust in the presence of ozone (Hanisch and Crowley, 2003a) and the heterogeneous reactivity of N2O5 on mineral dust (Wagner et al., 2008). The last citation is an interesting and carefully performed comparative study between the Mainz KFR and an aerosol flow tube study highlighting the difficulties in working with aerosol in an atmospheric pressure flow tube. The following instrument is an all stainless-steel variant put together by members of the Physical Chemistry Department of the University of Essen in the Zellner research group. The topics vary between the study of the heterogeneous reaction of HNO3 on mineral dust and γ-Al2O3 substrates (Seisel et al., 2004a), the kinetics of the interaction of water vapor with mineral dust and soot surfaces at ambient temperatures (Seisel et al., 2004) and a study on the kinetics of the uptake of SO2 on mineral oxides using in part pulsed admission in order to avoid saturation of the sample by limiting the quantity of SO2 admitted by dispensing it in a short pulse from a pulsed solenoid valve (Seisel et al., 2006). The equipment was moved to Leipzig some 10 years ago to the Leibniz Institute of Tropospheric Research (TROPOS) after the dissolution of the Essen group due to retirement of the director. There is a copy of the Lausanne instrument located at RCAST (Research Center for Advanced Science and Technology) of the University of Tokyo built by M. Mochida under the supervision of H. Akimoto used to examine the chemistry of Cl2 reacting with sea salt and proxies thereof at ambient temperature (Mochida et al., 1998). At last there is the group of M.S. Salgado at the University of Castilla La Mancha (UCLM) who is running a KFR equipped with a quadrupole MS coupled to an additional special quadrupole filter, thus increasing the signal-to-noise ratio. They have published a paper on the chemical composition and heterogeneous reactivity of soot generated in the combustion of diesel and GTL (Gas-to-Liquid) fuels and amorphous carbon Printex U with NO2 and CF3COOH gases (Tapia et al., 2018). The work of Booth et al. (2009) on Knudsen Effusion Mass Spectrometry (KEMS) for vapor pressure measurements of low volatility organics will be discussed below along with the work of (Dang et al., 2019).
From the above presentation it is clear that the KFR is not a piece of equipment with specific dimensions or general design. The embodiment of a KFR follows a design controlled by the research question at hand. This is the reason that we will discuss different designs below together with their purpose and expected performance. Many studies using the KFR have been undertaken in a context of atmospheric research. Incidentally, often the absolute pressures inside a KFR are of the same magnitude within a decade or so compared to conditions in the planetary atmosphere or inside a combustion chamber. Moreover, we place the emphasis on quantitative aspects rather than on qualitative findings in order to address the needs for input to atmospheric numerical models. The characterization of the condensed phase, solid or liquid, is therefore an absolute necessity before a quantitative conclusion on the significance of achieved kinetic or thermodynamic results for a specific experimental situation may be attempted. We will first present the underpinnings of the KFR in terms of fundamental gas-kinetic parameters after which we will turn to the presentation of more technical aspects regarding the detection system as well as the whole gamut of different designs of KFR’s. The section on the working principle of the measurement contains analytical expressions as a function of the reaction mechanism and highlights the determination of desorption lifetimes of adsorbed organic and inorganic probe gases. This section presents a novel aspect of the measurement technique as it takes full advantage of the information content that the method has to offer: Both uptake and desorption take place within the gas lifetime within a specific KFR and conceal information on both the rate constants for adsorption and desorption. Additional examples round off the excursion into the experimental realm, and the section on stirred-flow reactors opens up an additional and in some respects, complementary aspect of flow reactors, namely the multidiagnostic feature of multiphase reactions in which two phases are monitored simultaneously.
A final remark concerns the choice of the examples for illustrative purposes as the present publication is not an exhaustive review article on KFR’s. For many of the examples we have chosen newer and/or unpublished results to make the reading interesting to the research community. Many of the results dealing with adsorption/desorption of organics and inorganic probe gases will be published shortly in a systematic way laying into the open all pertinent results (Iannarelli et al., 2021; Iannarelli et al., 2021a).
Theoretical Underpinnings of Knudsen Flow Reactors: Molecular Flow Regime
The nature of the flowing gas experiment is to admit a measured flow of pure probe gas from a higher stagnation pressure, typically 10 Torr or so, inside a vacuum line into a vessel of defined geometry, usually spherical, cylindrical or a combination thereof, having a precisely machined exit orifice leading into a pumped detection chamber at typically 10−8 to 10−7 Torr background pressure without flowing gas in order to enable mass spectrometric detection. The purpose of the flowing gas experiment is to operate in the molecular flow regime where the mean free path λ is significantly larger than a characteristic length parameter of the flow reactor according to Equation 1 (Dushman, 1962):
where N, V and d are the total number of molecules in volume V of vessel of molecular diameter d, respectively. Alternatively, d may be viewed as the diameter for the hard sphere collisional cross section of molecule M in the gas phase. The characteristic length parameter of a cylindrical reactor vessel may be taken as its diameter or a multiple of its exit orifice diameter. Historically, the condition for molecular flow in which the gas molecules act independently from each other may be described as the Knudsen condition expressed in Equation 2:
Originally, Knudsen had suggested the factor of ten in Equation 2 (Dushman, 1962), however, extensive experience over the years has shown that molecular flow conditions are guaranteed at a factor of three using the diameter Ø of the exit orifice as the length parameter. An equivalent way of saying would be that molecules effusing out of the flow reactor vessel should not experience collisions while crossing the orifice plane, thus escaping and being pumped away at the given pressure. The consequence of the large mean free path of the average molecule in the reaction vessel is the predominance of gas-wall collisions at the expense of gas-gas collisions that seldom occur depending on the total pressure inside the vessel. A given reaction vessel may therefore be characterized by the collision number Zw which is the number of wall collisions a molecule experiences during its lifetime in the reaction vessel given in Equation 3:
where Av and Ah are the total surface areas of the internal wall and the escape orifice, respectively. An important gas kinetic parameter is the collision frequency ω in s−1 of the average molecule which is given in Equation 4 and represents Zw normalized to the gas residence time tr in seconds of the average molecule. The gas lifetime tr corresponds to the inverse of the rate constant of effusion ke in agreement with the unimolecular rate law for gas effusion under molecular flow conditions and is given in Equation 4:
The expression in Equation 5 may be understood in terms of the frequency of collision of the average molecule with the hypothetical area of the escape aperture which leads to irreversible loss and therefore to escape out of the reactor. Consistent with that the ratio ω/ke is equal to Zw. In contrast to effusion under laminar (viscous) flow conditions ke depends on the inverse of the square root of the molecular mass and is a central rate parameter in flowing gas experiments. An important remark concerns the wall collision frequency ω which only depends on the geometry of the reaction vessel or the surface-to-volume ratio but not on the size of the aperture as shown in Equation 5. On the other hand, the different aperture sizes are reflected in the collision numbers Zw such that the label for a specific aperture size is the wall collision number because all choices have the same gas-wall collision frequency ω. The reason for a specific choice of the escape rate constant is the reaction rate of the investigated reaction: large rates of reaction require a small gas residence time, thus a large orifice size, and vice versa. As will be discussed below, the size of ke is the yardstick to which a chosen heterogeneous reaction will be compared, hence its importance as a controlling parameter of a KFR.
A last remark concerns the relationship between the concentration in the KFR and the flow parameter expressed as the total flow rate of molecules into the KFR (Fi) in molecule s−1 or its normalized variant Ri = Fi/V in molecule s−1 cm−3 Eq. 6. Establishes the relationship between concentration of molecule M ([M] in molecule cm−3) and the flow rate Fi:
The flow rate is the canonical or natural variable in a flow system in contrast to static or closed reactor systems where the use of concentrations is the natural variable. As a consequence mass spectrometers such as quadrupole mass filters that measure ion currents or proportional voltages are the natural choice for detection systems of flowing gas experiments in contrast to optical or fluorescence measurements whose response is from a given volume and hence measure concentration.
In conclusion, a brief comparison between the features of a Knudsen flow reactor (KFR) and a coated wall (fast) laminar flow tube (CWFT) as far as its utility for measuring heterogeneous chemical reactions is instructive. The latter is a well- and widely known method of choice for measuring interfacial or heterogeneous chemical kinetics. The comparison between the two experimental techniques is summarized in the following, whereby the first part refers to KFR, the second to CWFT: 1) molecular flow regime of pure probe gas in the mTorr regime vs. laminar (viscous) flow of a mixture of carrier gas (He) and the probe gas at a total pressure of 1 Torr or so; 2) no or very few gas-gas collisions depending on the total pressure vs. no or very few gas-wall collisions owing to slow rate-determining diffusion towards the vessel walls; 3) dominant gas-wall collisions vs. dominant gas-gas collisions; 4) gas residence time is in the range 0.1–10 s (1/ke) vs. 50–100 ms at a linear gas-flow velocity of 10–20 m s−1; 5) the gas residence time tr = 1/ke depends on mass vs. independent on mass of molecule; 6) each surface element of the KFR experiences the same number of collisions regardless of position and extent of reaction vs. a reaction-induced concentration gradient in the flowing gas that sometimes defies quantitative interpretation of reactive parameters.
The Detection System of a Knudsen Flow Reactor
Mass spectrometry (MS) is the universal detector for continuous monitoring of reactant loss and product formation in heterogeneous chemical reactions observed using the KFR technique. Moreover, the use of a quadrupole mass filter is ideally suited for steady-state flows, but may also follow pulsed valve experiments provided the mass spectrometer has enough sensitivity to follow MS signal changes on the time scale of a few milliseconds which most of the instruments equipped with a secondary electron multiplier (SEM) have. As indicated above, the continuous or slowly changing flow across the KFR in the course of monitoring gas uptake and desorption from a condensed phase substrate (solid or liquid) is ideally matched by the continuous signal detecting scheme of quadrupole mass filters. Even though the total pressures for achieving molecular flow conditions in operating KFR’s are small, in the range of 5 mTorr (1.6 × 10¹⁴ molecule cm−3 at 300 K) and below, mass spectrometers require operating pressures in the few 10−7 Torr range in order to achieve good signal-to-noise ratios. In the present application this means that we have to reduce the total pressure in the KFR by 4 orders of magnitude or more in order to enable the use of a mass spectrometric detector downstream. This goal is achieved by differentially pumping the outflow of the KFR in two pumping stages displayed in Figure 1A which schematically shows an overview of the different elements of the experimental set-up.
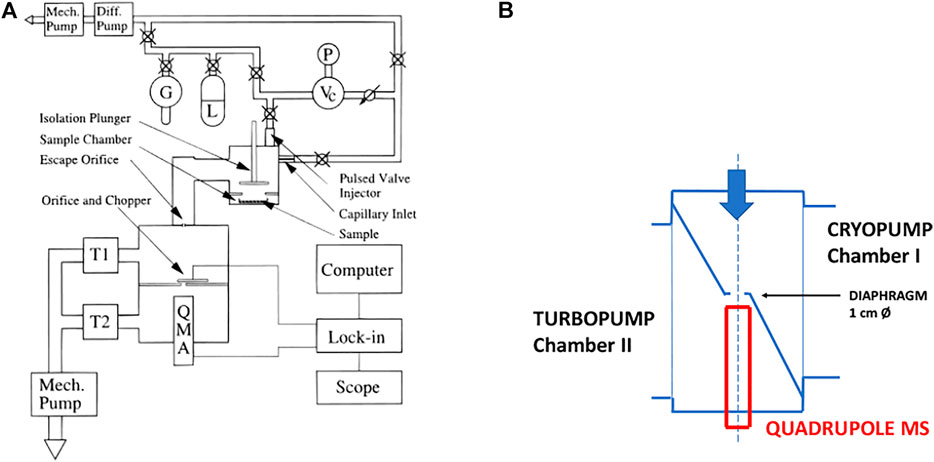
FIGURE 1. (A) (left): Schematic ensemble view of KFR flowing gas experiment for measurement of heterogeneous reactions (Fenter et al., 1994). G gas sample, L liquid sample, P pressure gauge, Vc calibrated volume, T1 Cryopump (nominal 10″ intake flange), T2 Turbopump (nominal 6″ or 8″ intake flange). Both pumps have a gate valve mounted between the respective chambers and the pump. In contrast to what is shown in the Figure the mechanical chopper is mounted on top of the QMA in the lower vacuum chamber. (B) (right): Actual structure of cylindrical pumping chamber of KFR with axis in the middle (broken line) enabling the mounting of two large intake area flanges and minimizing the distance between the upper opening of the detection chamber and the inlet orifice of the cross-beam ion source of the QMA.
The KFR is displayed in Figure 1A in the center sitting on top of a differentially-pumped vacuum system consisting of two chambers, the upper pumped by a nominal 10” Cryopump (DN 200CF inlet flange), the second (lower) chamber by a nominal 6” (DN 100CF inlet flange) or 8” (DN 160CF inlet flange) turbopump that houses the mass spectrometer (Balzers/Pfeiffer QMG 421, 1–500 amu range) in either vertical (shown in Figure 1A) or horizontal position. Line of sight is established between the exit orifice of the KFR, the diaphragm (10 mm Ø, adjustable using inserts) connecting the upper and lower vacuum chamber and the inlet orifice to the ionization region of the quadrupole mass analyzer (QMA). We note that for simplicity reasons both nominal 10” and 6” pneumatic gate valves separating the corresponding pumps from the vacuum chambers are not explicitly drawn in Figure 1A. A thermal molecular beam is formed at the exit orifice of the KFR (Dushman, 1962; Ross, 1966), crosses the upper vacuum chamber and finally hits the entrance orifice of the ionizer of the QMA mounted in the lower vacuum chamber (electron-impact, 70–100 eV electron energy, cross-beam geometry). The thermal molecular beam is chopped by a rotating four-sector chopper mounted in the lower vacuum chamber and usually running at approximately 80 Hz. The modulated MS signal is demodulated using a lock-in amplifier (Stanford Research SR 850) and is fed into a PC-based signal acquisition software (LabView v. 13 revision 475 from 2013) and displayed/processed using the program suite IGOR (Wavetek Inc.). In addition, the Quadrupole Mass Analyzer (QMA) is surrounded by a hollow Torus reservoir vessel that may be filled with liquid N2 when using the vertical position of the QMA (shown in Figure 1A). It will decrease the background level of gas at high flow rates through cryopumping in the second vacuum chamber and will improve the signal-to-noise (S/N) ratio by up to a factor of 5 (Torus not shown in Figure 1A).
The data files consist of several data columns in an alphanumeric file format (type.txt) corresponding to the observables the user wants to collect that may be imported into various data application programs that will handle long data files of typically up to 60′000 points or 15′000 s at a data acquisition frequency of 4 Hz (variable). We highly recommend using LIA values for quantitative determinations of uptake and desorption yields as well as for kinetic quantities such as uptake and steady-state rate constants. In some cases a critical comparison of ELM and LIA data can be quite useful as demonstrated in Supplementary Appendix A1.
The spread of a thermal molecular beam is such that its intensity as a function of distance r from the source goes as 1/r2 such that preserving a minimal distance from the source becomes an imperative for good experimental performance. On the other hand, high- and ultra-high vacuum pumps do not tolerate a decrease of the area of the intake flange without loss of pumping speed. This means that any decrease in the area of the inlet flange to the pump (turbopumps, cryopumps, sorption pumps, etc.) is accompanied by a loss of pumping speed keV (see above). We have therefore chosen the configuration displayed in Figure 1B in order to minimize the distance between the exit orifice of the KFR and the orifice of the ionizer of the QMA of the cylindrical vacuum chamber on one hand, and on the other hand preserve the large area of the inlet flanges without loss of pumping speed. Please note the fact that the actual detailed design follows Figure 1B rather than Figure 1A which is to be understood only as a schematic representation of the vacuum chamber.
An important element of the measurement chain is the all-glass grease-free inlet vacuum line fully equipped with Teflon stopcocks connected either through a capillary, needle valve (fine metering valve) or pulsed solenoid-driven valve as flow controlling devices to deliver the gas stream to the KFR. The stagnation pressure in the vacuum line is typically 10 Torr measured using a 10 Torr full scale Baratron capacitance manometer. The flow rate Fi into the KFR is routinely measured by recording the pressure drop within a calibrated volume (typically 50 cm3) as a function of time. The two most important measurement parameters that have to be known for the evaluation of the MS data are both ke as well as Fi. Rate constants for uptake of gases, be it a chemical reaction or physical adsorption, are seldom unimolecular such that the rate law must be studied in most cases for accurate and mechanistic measurements. Only in rare cases of first-order kinetics of interfacial chemical reactions will the derived rate constant be strictly independent of pressure or concentration.
Embodiments of Knudsen Flow Reactors
The design of the KFR that we have routinely used over the last 25 years for measuring the heterogeneous kinetics and uptake of gases on condensed phase substrates is shown schematically in Figure 2. It is a two-chamber four-aperture flow reactor operated in the molecular flow regime and qualifies as a Knudsen flow reactor (KFR). The lower chamber (sample chamber, SC) contains the sample while the upper (reference chamber) maintains the gas flow when the sample is isolated from the gas flow. The idea behind this two-chamber concept is to perform the experiments with substrate “on” and “off” by lifting and lowering the gas-tight plunger, thus effectively sealing and exposing the substrate to the gas flow and performing the uptake experiment as a relative rate measurement. The seal is afforded through an elastomeric O-ring (Viton Fluoroelastomer) and a screw cap exerting pressure on the seal to such an extent that the upper (reference) chamber of the KFR continues to run even when the lower (sample compartment) is vented to 1 atm of pressure. The leak-tightness is an operational advantage when changing the condensed phase sample during an experimental series without halting the flow of gas into the KFR or avoiding the change of the instrumental settings. Owing to the fact that the plunger is lifted and lowered often during an uptake experiment the feedthrough sealing the atmosphere from the pressure inside the KFR is differentially pumped in order to avoid air rushing into the KFR while moving the plunger. This arrangement guarantees a minimum of perturbation (caused mostly by air inrush) inside the KFR while moving the lid covering the sample compartment or actuating the plunger.
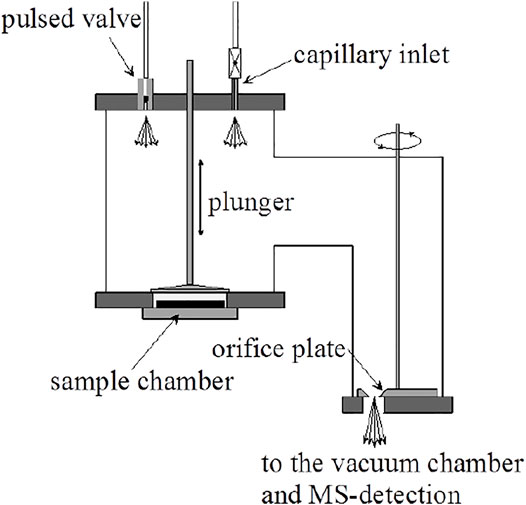
FIGURE 2. Essential Construction Elements of the two-chamber Knudsen flow reactor (KFR) suitable for multiphase reactions and molecular beam-modulated quadrupole mass spectrometric detection (MBMS).
The second noteworthy feature is the ability to change the gas lifetime in situ by turning the orifice plate in order change the molecular beam-forming orifice also without interrupting the experimental operations. The orifice plate contains four apertures, for instance 1, 4, 8 and 14 mm as nominal diameters, all of which keep the geometrical alignment with the 1 cm orifice separating the upper and lower vacuum chamber and the entrance to the ionization volume of the QMA cross-beam ion source by fixing the position of the plate using a stainless steel or Teflon pin locked into an opening in the base-plate of the KFR. It is very important to choose a stable and rigid mechanical arrangement in order to ensure reproducible geometrical alignments in the interest of identical MS signals even when coming back to a former exit orifice. An important remark concerns the sealing of the plate with the stainless-steel base of the reactor as we want to make sure that all gas molecules only leave the KFR through the hole. To that extent the back face of the aperture plate is sealed with a thin (0.5 mm thickness) Viton sheet glued using TorrSeal (Varian Inc.) in order to establish a gas-tight seal between the back side of the orifice plate and its base. However, the aperture changing rod is not sealed by a differentially pumped seal as is the SC such that changing of the orifice during operation must be exercised with due care.
Tables 1, 2 display the salient parameters necessary to obtain quantitative results when operating the KFR. Most important of all, the values of ke for the different apertures must be experimentally measured by one of the following methods: 1) real-time measurement of the gas decay inside the KFR using the flow of a non-reactive and non-sticky gas such as N2, O2, Ar, SF6, CH4, N2O, etc. One may use either the MS intensity at a characteristic mass (parent or fragment) or measure the pressure directly by attaching for instance a 1 Torr full scale Baratron whose measurement range conveniently reaches down to the values of interest (mTorr). After having established a constant flow of the calibration gas the flow is suddenly turned off, and the decay of the proxy MS signal or the absolute pressure is followed as a function of time until effusion is complete. The slope of the ln (natural logarithm) of the pressure or proxy MS signal as a function of time directly yields ke for the different apertures; 2) same as 1) but use a pulsed solenoid valve as a source for a gas pulse of defined and sufficiently short duration; 3) measure the steady state pressure inside the KFR as a function of the flow rate Fi using the pressure drop within a calibrated volume for different flow rates. A plot of the recorded pressure or concentration of molecules vs. the normalized flow rate Fi/V = Ri results in straight lines whose slope is equal to ke for that orifice according to Equation 6. In conclusion, the measurement of ke and its frequent verification is crucial to the application of the KFR because the relative measurement of SC on and off discussed above only yields relative ratios of MS signals that will ultimately enable the measurement of absolute rates using ke.
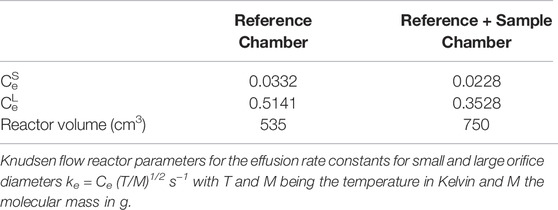
TABLE 1. Parameters for the all-Pyrex two-aperture Knudsen flow reactor used from 1991 to 1993 displayed in Figure 3A.
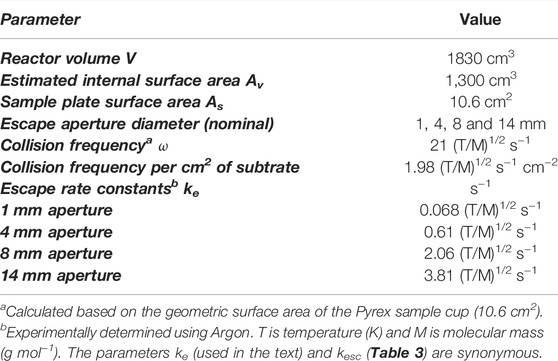
TABLE 2. Parameters of the four aperture Knudsen flow reactor used most recently (since 1994).
A comparison of the features of the KFR discussed above (Figure 2) with its direct precursor (Tabor et al., 1994) displayed in Figure 3 is illuminating. Two critical features will be mentioned: 1) the volume filling of SC and, 2) the disagreement between predicted and measured values of ke. Both points have had consequences on the design of the latest version of the two-chamber four aperture KFR in use today when applied to interfacial reactions (Figure 2). We believe our measured values to be correct as we have verified them using different calibration gases of different molecular weight.
1) Figure 3B displays the volume filling of the sample compartment by an Ar flow of 8.0 × 10¹⁵ molecule s−1 in the nominal 1 mm orifice KFR (see Table 1 for relevant parameters). Given ke for Ar in the 1 mm Ø aperture of 0.0624 s−1 we may see the filling taking approximately 50 s or three half-lives when we open the SC compartment at 0 s (Figure 3B). Conversely, after sealing SC and halting the Ar flow at 100 s we open SC by lifting the plunger and obtain that same filling curve reflected as positive emission trace taking place on the same time scale when we observe the emptying process of SC from 100 to 150 s. The decrease in the MS signal amplitude as well as the amplitude upon emptying SC in the emission phase of the experiment reflect the fractional SC volume which is approximately one third of the total volume (Figure 3B). This large parasitic effect may be minimized by redesigning SC making it a much smaller fraction of the total volume. For the KFR in present use we have a volume of SC of roughly 100 cm3 which represents 5.4% of the total volume, indeed a small value.
2) The second point is more subtle, albeit more important as far as consequences go. It has to do with the discrepancy between the calculated and measured values for ke displayed in Table 1. For NO2 probe gas we obtain the values ke = 0.389 and 3.50 s−1 for the nominal 1 and 3 mm Ø exit orifices from Table 1, respectively. However, Tabor et al. (1994) report values of ke = 0.0581 and 0.910 s−1, a factor of 6.7 and 3.9 smaller than calculated from the nominal values for the 1 and 3 mm Ø values, a very large disagreement. In the present case the Clausing factor correction is small because of the large radius to length ratio of the “tube” opening or borehole (Dushman, 1962, pg. 90–100). We think that the disagreement has to do with the less than ideal geometry of the exit orifices as the inset of Figure 3A shows. Both apertures are “hidden” from free gas flow in the bottom of a cup, more so for the small aperture than for the large one. This has taught us a lesson that the small-scale geometry of a hole, as trivial as it may sound, may have far-reaching consequences. The reason for this slow-down of gas effusion has to do with blocking the population of collisions at a large angle of incidence, so-called glancing collisions, with the hole such that this population is prohibited from reaching the hole based on line-of-sight because the hole is not visible at a glancing angle. The effect is larger for the small exit orifice because it is obstructed by the support structure and by the depth of the cup at whose apex it is located. This conclusion has led us to design the four-aperture orifice plate (Figure 2) accordingly. However, the problem somewhat persists even there for the 1 mm exit orifice.
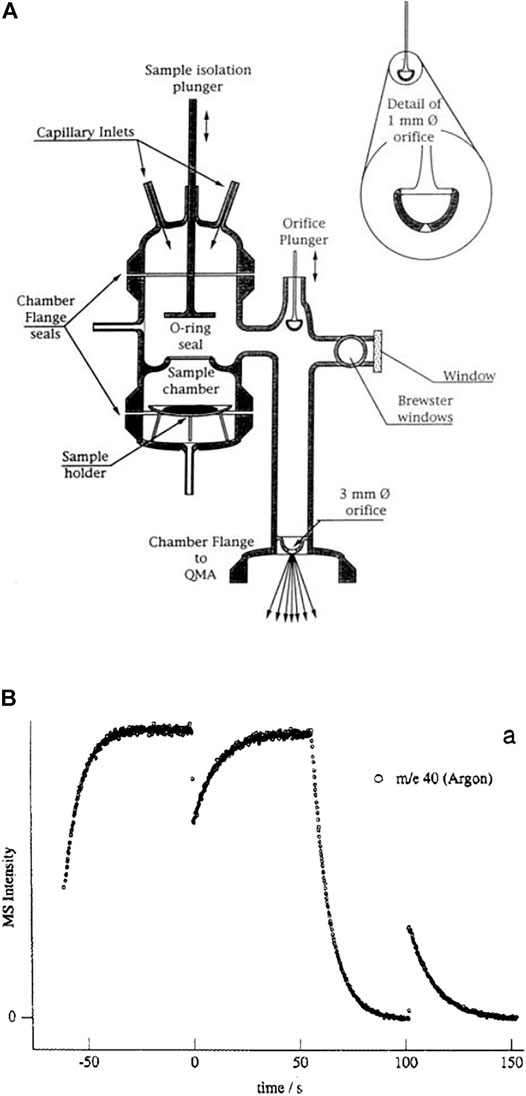
FIGURE 3. (A) All-Pyrex Knudsen flow reactor whose characteristic data are displayed in Table 1. The nominal 1 mm diameter orifice fits into the hemispherical glass counterseal (Rotulex ground glass joint) of the base of the flow reactor whose aperture diameter is 3 mm wide. The hemispherical insert with the 1 mm orifice hole is attached to the transfer rod (plunger) that lowers or raises the part using three thin glass rods fused to the transfer rod (Tabor et al., 1994). (B). Transient pressure of Ar at a flow rate of 8.0 × 10¹⁵ molecules s−1 in the 1 mm diameter all-Pyrex orifice reactor displayed in Figure 3A (Tabor et al., 1994).
The rate equation for the filling/emptying MS trace of the experiment displayed in Figure 3B is given in Equation 7 which leads to the integrated concentration-time relation in Equation 8 as follows:
Where M(t) is the molecular concentration (molecule cm−3) at time t, Vu and V are the reference volume and the total volume with VSC being the volume of the sample compartment SC. At t = 0 we have M(0) = (Vu/V)Mss. Mss is the steady state concentration given by Equation 6 as Fi/ke V with Fi as the measured flow rate Fi (molecule s−1) and keV as the volumetric pumping rate in cm3 s−1. The observation in Figure 3B is in agreement with the fact that there is a “break”, that is an instantaneous decrease of MS signal intensity at t = 0 owing to very rapid dilution of the KFR at t = 0 upon opening SC and recovery of the original Mss level with a time constant given by ke. The emptying of SC occurs with ke as a function of time upon release of Ar from the sealed SC in the aftermath of lifting the plunger at 100 s (Figure 3B).
The analogous expression for a slightly more complex situation, namely competitive chemical reaction/physisorption (kr) as a loss of M in competition with escape from the KFR is given in Equation 9 whose integration leads to the concentration M as a function of time given in Equation 10:
Here M0 and Mss are given by M0 = M(t = 0) = M0 (Vu/V) and Mss = M0ke/(kr + ke) · M0 (Vu/V) corresponds to the concentration immediately after opening the SC and ensuing fast thermal diffusion and mixing that occurs on a much shorter time scale than the kinetic processes in the KFR given by the magnitude of ke. The skill of the experimenter is to make a judicious choice of which ke value to choose from that is best adapted to the time scale of interest and given by the process intended to be studied.
KFR’s come in all shapes and sizes depending on the intended application. Figure 4 shows a small but typical fraction of the designs that we have used over the years on some specific applications. The KFR to the upper left of Figure 4 is optimized for IR-multiphoton dissociation of a suitable precursor molecule to free radicals and atoms using a high-power TEA CO2 laser. Taking CF3I we have generated •CF3 free radicals and ground state I• atoms in the (2P3/2) state in the aftermath of a high power pulse (Rossi et al., 1979a). The upper right of Figure 4 exhibits an all-quartz KFR used to study pyrolysis reactions of closed shell (stable) molecules up to 1330 K, the melting point of fused quartz (Golden et al., 1973). It is a three-aperture single chamber prototypical KFR that was cumbersome to use. A more robust, simpler and user-friendly follow-up design of an all-quartz reactor has been successfully used in both pyrolysis as well as studies of high temperature metathesis reactions (Rossi et al., 1979a) and is displayed in the lower right of Figure 4. The lower left of Figure 4 exhibits an all-stainless-steel KFR designed to place a Si wafer at its top and study its surface chemistry with free radicals and atoms (Robertson et al., 1988) of interest to the semiconductor industry at its time.
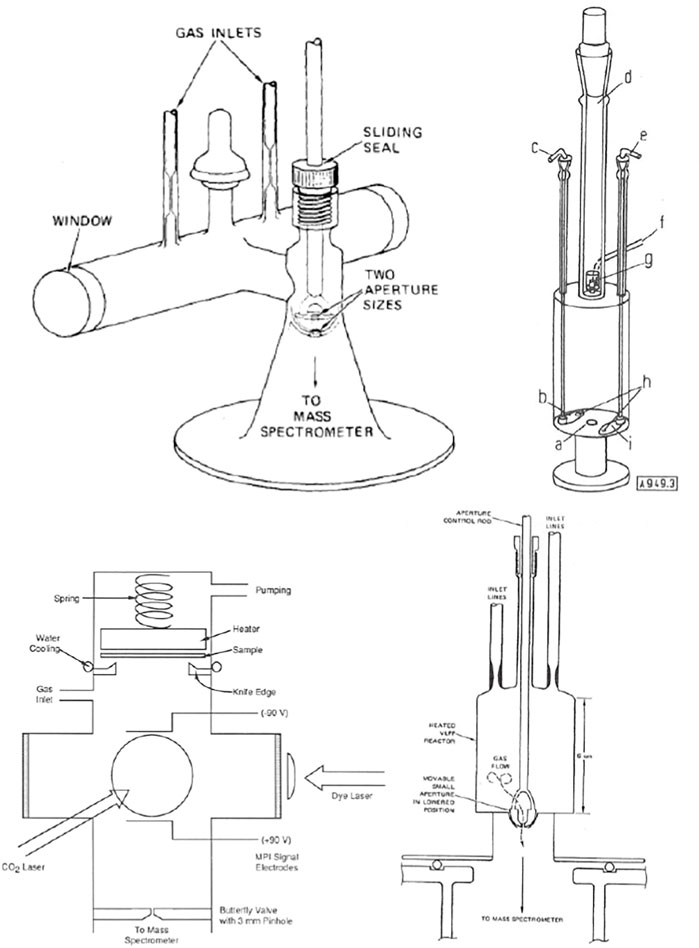
FIGURE 4. Four different embodiments of KFR’s: Upper Left: Perspective drawing of the two-aperture VLPϕ (Very Low-Pressure Photolysis) reactor fitted with KCl windows used in IR multiphoton-generated free radicals work. The ID of the irradiation tube is 2.0 cm, the optical pathlength is 20.5 cm, and the total volume is 105 cm3 (Rossi et al., 1979a); Upper Right: Triple aperture quartz reactor system; a hole (1 cm Ø), b aperture plate (3.3 cm Ø); c 3.3 cm aperture plate manipulator; d removable section with ground joint; e 1 mm aperture plate manipulator; f gas inlet tube; g device for heating of solids and pyrolysis of emerging gases; h aperture plates may be independently moved to cover 1 cm exit orifice; i aperture plate (1 mm Ø) (Golden et al., 1973); Lower Left: All-stainless steel KFR equipped for studying the interface of Si wafers located on top and interacting with atoms and free radicals, the latter generated by IR multiphoton decomposition using a TEA CO2-laser and monitored by Resonance-Enhanced Multiphoton Ionization (REMPI) using a tunable dye laser. The in situ detection of the transient free radicals and atoms is enabled by circular electrodes biased by plus or minus 90V from a battery pack (Robertson et al., 1988); Lower Right: Quartz VLPP Reactor for the study of high temperature homogeneous gas reactions of 133.5 cm3 volume, ω = 4,982 (T/M)1/2 and nominal 1 and 3 mm exit orifice diameters.
In addition to its different shapes given in Figure 4 the volumes of KFR’s strongly differ, ranging from 5 ml of all-quartz single chamber single aperture reactors to 2000 ml for the use in multiphase systems aiming at the study of heterogeneous chemical kinetics (Figure 2 and Table 2). This variability of KFR designs notwithstanding the collision frequency does not vary over a large range because it is difficult to change the surface-to-volume ratios over a large range for similar macroscopic reaction vessels unless one goes to drastically different scales or introduces additional internal surfaces such as fans. This latter proposal, however, bears the risk of uncharacterized and/or undetected surface reactions of used reactive gases such that the choice of a suitable reactor for a specific application remains more an art than a rational choice.
A last remark concerns the most important parameter in chemical kinetics, namely the temperature. Although this review mostly presents recent studies undertaken at ambient temperature a significant fraction of work performed using the KFR has been done at low temperatures in the range 170–220 K on ices in view of applications involving Polar Stratospheric Clouds (PSC). The high temperature support based on heat cartridges as published reaches temperatures up to 300°C. For higher temperatures classical designs have to be implemented using single chamber designs (Rossi et al., 1979b). The necessary technical details for low-temperature and high temperature supports have been presented in the literature (Caloz et al., 1997) and will be omitted here because the designs are still in use until today. Suffice it to say that the SC is configured as a controlled-temperature element for high or low temperature at the exclusion of the reference part of the KFR which remains at ambient temperature. Transpiration phenomena need therefore be taken into account when using the high- or low temperature support because the measurement of the pressure for the flow rate measurement is performed at ambient temperature (Dushman, 1962, pg.58–60).
The Measurement Principle for Heterogeneous Chemical Reactions: Uptake and Desorption Kinetics
Figure 5 presents a typical case of uptake of a gas onto Arizona Test Dust Coarse (ATD C) (Iannarelli et al., 2022b). Specifically, the left panel represents the initial uptake of pipol acetate (cis-3-hexene-1-ol acetate) monitored at 67 amu. It took some 30 min in order to achieve a constant flow rate of pipol acetate at Fi = 3.0 × 10¹⁵ molecule s−1 corresponding to 1.7 V lock-in amplifier (LIA) signal owing to the small stagnation pressure of this semivolatile liquid. At 8,000 pts. equal to 33 min after the start of the data acquisition the gas flow was exposed to 100.4 mg of ATD C spread out over the sample cup of 10.6 cm2 area with BET surface area of 10.8 m2/g (Gregg and Singh, 1982) by lifting the plunger. The LIA MS signal immediately decreases from I0 to I as a function of time and starts to increase gradually after a few seconds to the original signal level I0. At 13′000 pts (54 min) the sample compartment (SC) is isolated from the gas flow and the LIA signal level equals the original value of I0 within the MS signal random noise, that is I(t) = I0. The minimum MS signal value observed right after opening enables the determination of the initial rate constant k0 for adsorption of pipol acetate onto the ATD C substrate. We note in passing that we do not expect a significant refilling effect owing to the fact that the SC is only 5.4% of the total volume. We assume that the rate constant for adsorption obeys a rate law first order in gas phase concentration M and establish the flow balance for determination of k0 in Equation 11:
where the term ke Mss is equal to the flow out of the KFR or F0/V. The balance of positive and negative contributions to the flow enables the determination of k0 given in Equation 12 using the verified proportionality between the MS signal at m/e = 67 amu and F0(t):
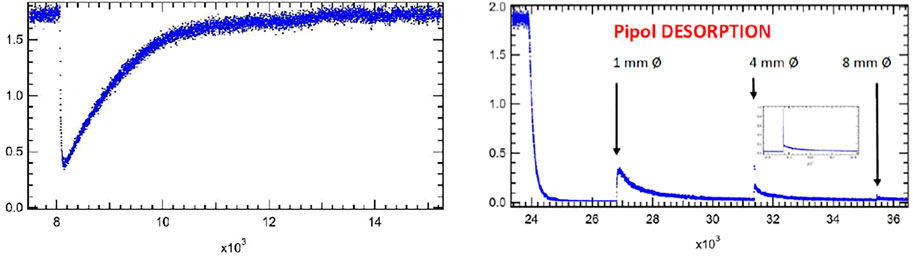
FIGURE 5. Adsorption and desorption traces for pipol acetate (cis-3-hexene-1-ol acetate) and ATD Coarse (100.4 mg, 10.8 m2/g) (FS90/91). Uptake phase: Fi = 3.0 × 10¹⁵ molecule s−1, 1 mm Ø exit orifice, MS detection at e/m = 67 amu, integral of the blue MS trace corresponds to 100% of a monolayer or 2.9 × 10¹⁴ molecules cm−2. SC closed at 16′300 pts. Computer fit for desorption phase at 1 mm Ø resulted in kd = 7.0 × 10⁻⁴ s−1 with ka = 1.2 s−1 and ke = 0.0988 s−1 with a recovery of 13.4% representing 3.8 × 10¹³ molecules cm−2.
Taking ke from Table 2 at 300 K and 142 g/mol we arrive at ke = 0.0988 s−1 and k0 = 1.06 s−1. The value of k0 may be used to derive an uptake probability per collision of M with ATD C using ω = 3.13 × 10⁴ s−1 for the BET surface or 30.5 s−1 for 10.6 cm2, the geometric surface area of the sample holder (cup). This leads to γ0 = 1.05 × 10⁻⁵ and 1.1 × 10⁻², the latter of which merely represents an upper limiting value because the ATD C sample was not evenly spread out over the whole geometric surface area of the sample holder. It is plausible to express the initial uptake probability γ0 in terms of geometric surface area which is the projection of the real surface to a 2-dimensional plane. The reason is simply because the gas does not have sufficient time to “explore” or collide with all adsorption sites given by the BET surface at short reaction times of a few seconds so that we have to content ourselves with an upper limit to γ0 based on the data given in Figure 5.
Figure 5 presents the loss of pipol acetate in the presence of ATD C until complete saturation at the used pressure in the KFR. Taking the integral between I0 and I during uptake to saturation corresponds to a loss of 2.9 × 10¹⁴ molecule cm−2 when taking the BET surface present in the SC. Owing to the long time interval of 21 min between opening and closing the SC we reckon that the gas had sufficient time to “explore” or collide with all active sites given by the total BET surface area. Setting this loss to a molecular perspective we divide the above value by the number of molecules making up a molecular monolayer. Eq. 13 provides an estimate in terms of an upper limit to the coverage ns in molecule cm−2 of pipol acetate using the ambient temperature density of the liquid ρ/g cm−3:
With MW = 142 g mol−1 for pipol acetate. Using this number the coverage is calculated to be 118.4% of a monolayer which we consider to be roughly 100% considering the associated uncertainties of Equation 13.
The uptake experiment continues with performing various tests not discussed here in detail and finally leads to the desorption phase by halting the flow of gas after isolating the saturated sample by sealing the SC from the reference part of the KFR. The right panel of Figure 5 displays this phase of the experiment at 24′000 pts. when the gas flow was halted and I0 monitored at m/e = 67 amu returned to the baseline. The SC was opened at 27′000 pts. using the 1 mm Ø orifice which was accompanied by a modest peak decaying over time. At 31′400 pts. the aperture was changed to 4 mm Ø orifice, and another change took place to the 8 mm Ø orifice performed at 35′400 pts., each time accompanied by a small gas burst that decayed with time. The integrals under these decaying LIA signals were added together and resulted in 13.4% of the uptake signal that we have identified with spontaneous desorption of pipol acetate from ATD C at ambient temperature. The insert in the right panel of Figure 5 shows an expansion of the LIA signal when changing the exit orifice from 1 to 4 mm Ø and displays a high amplitude fast decaying peak as well as a following slower decaying peak after the fast decay. This is related to the adjustment of the concentration from a high value in all of the 1 mm exit orifice KFR upon change to the 4 mm exit orifice KFR and corresponds in a way to the inverse of the gas-filling upon opening an empty SC at a flowing gas (see Figure 3B at 100 s). The sharp peak therefore is due to the adjustment of the gas concentration, whereas the slow-decaying LIA signal stems from desorption of gas off the solid substrate. This experiment (FS90) was halted at 43′000 pts. because we were running out of LIA signal which means that the desorption rate was smaller than the noise level of the detection.
In order to find out how many adsorbed molecules of pipol acetate are being desorbed at ambient temperature we pumped the sample overnight (approximately 15 h) at the largest pumping rate by switching to 14 mm Ø orifice and thereby desorbed an unknown amount of adsorbed pipol acetate molecules that were not recorded directly because of low rates of desorption. At the end of the pumping sequence we repeated the uptake measurement next morning and obtained an uptake upon readsorption of 24.7% of the original uptake. Had there been no more desorption during overnight pumping we should have detected 13.4% of readsorption the next morning, instead, we have observed 24.7% of uptake on the pumped ATD C sample. This effective “back-titration” means that 100–24.7 = 75.3% of all adsorbed pipol acetate molecules stayed adsorbed on the substrate upon spontaneous desorption at ambient temperature after 15 h of pumping. On the other hand, 100–13.4 = 86.6% of adsorbed pipol molecules remain on the substrate after short term spontaneous desorption. Overnight pumping removes an additional 24.7–13.4 = 11.3% of molecules. Of course, one could always accelerate the rate of desorption by heating the sample in a controlled manner.
In comparison to the original uptake rate constant of k0 = 1.06 s−1 the kinetics of the pipol acetate readsorption on the sample whose remaining coverage was 75.3% led to a measured adsorption rate constant of k0 = 0.33 s−1 corresponding t0 γ0 = 3.4 × 10⁻⁵ and 3.5 × 10⁻² based on the BET and geometric surface, respectively. Based on the 25% free adsorption sites remaining after extensive pumping one would expect a decrease of a factor of 4 of k0 to 0.265 s−1 which is remarkably good agreement with the measured one of 0.33 s−1. The best fit of the desorption kinetics is obtained at k0 = 1.2 s−1 which precisely yields a predicted value of 1.2/4 = 0.30 s−1 which is a self-consistent result.
The upper panel of Figure 6 displays the desorption phase of pipol adsorbed on an ATD C substrate that is saturated to 100% of a monolayer from previous adsorption discussed above. The rate law for the complex kinetic system in Figure 6 is given in Equation 14 with the notion of the added boundary condition that we start the modeling with a 100% saturated surface. In this case 100% (complete) saturation coincides with the notion of the presence of a “coherent” molecular monolayer. Other cases with different organic semivolatiles such as menthol or applinate adsorbed on ATD C correspond to partial monolayers where saturation is complete at a fraction of a molecular monolayer, such as 11 and 25%, respectively (Iannarelli et al., 2022b). The first, second and third term on the right-hand side of Equation 14 corresponds to the desorption, adsorption and effusion rate in differential form. It is possible to integrate this rate law in closed analytical form as a function of time, but not as a function of coverage, and is given in Equation 15. Although Equations 14, 15 contain three parameters (ka, kd, ke), ke is known from calibration of the KFR and ka is known from the experimental measurement in the previous adsorption phase. Therefore, the problem of measuring the kinetics of desorption boils down to a one-parameter fit of kd in case ka is sufficiently well-known, or to a two-parameter fit in case ka is either not measured accurately enough (see below) or has changed in view of changing coverage. Equation 15 consists of a complex expression resulting in the number of molecules of M in the gas
phase as the volume integrated value N(t) relative to Nmax. The surface integrated value of the coverage at saturation for the sample as a whole is consistent with the whole BET surface and is set to 100%. The upper panel of Figure 6 displays the one parameter fit of kd with the following results: ke = 0.0988 s−1, ka = 1.2 s−1 and kd = 7.0 × 10⁻⁴ s−1 corresponding to a surface residence or (1/e) lifetime of 1,430 s or 23.8 min. The fit exhibited in the upper panel of Figure 6 is excellent in our view and confirms the validity of the Langmuir ansatz used in the rate law, Equation 14, also because the fit is quite sensitive to the values of kd. We would like to stress at this point that the decays of the MS signals for the various KFR’s depending on the exit orifice are not first-order decays, that is semilogarithmic plots of decay rates are highly non-linear whose initial tangents correspond to rate coefficients larger by factors of 10–50 compared to kd established by fitting the integrated rate law, Equation 15.
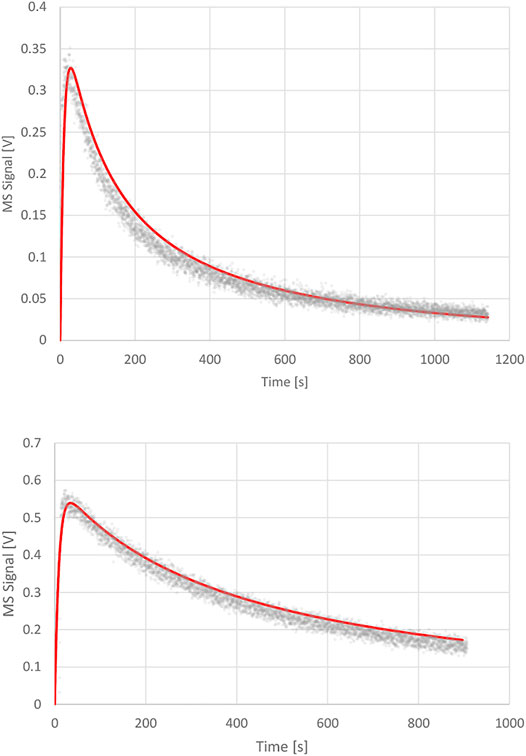
FIGURE 6. Upper Panel: Desorption experiment (FS 90/91) pipol acetate + ATD Coarse, 1 mm Ø orifice KFR, kinetic parameters: ke (pipol acetate) = 0.0988 s−1, ka = 1.2 s−1, kd = 7.0 × 10⁻⁴ s−1; Lower Panel: Desorption experiment (S101 PAC + TFA) trifluoroacetic acid (TFA) + Processed Amorphous Carbon (PAC), 1 mm Ø orifice KFR, kinetic parameters: ke (TFA) = 0.114 s−1, ka = 2.3 s−1; kd = 1.2 × 10⁻⁴ s−1.
It is quite important to realize that during the desorption phase there are lots of molecular events in terms of desorption and readsorption steps owing to the sizable partial pressure inside the KFR during desorption. A molecule just desorbed has the choice of effusing if hitting the surface area of the exit orifice, or it can readsorb and wait for the next randomly occurring desorption event. This is distinctly different from desorption into ultra-high vacuum where readsorption is highly improbable owing to exceedingly low partial pressures. This dependence of the desorption of M in a KFR brings with it some complexity at retrieving the rate constants, but offers the chance to measure both ka and kd at the same time under identical experimental conditions. The ratio ka/kd is a thermodynamic (Langmuir) equilibrium constant that thermochemically characterizes the gas-substrate interaction from a fundamental point of view. Langmuir equilibrium constants as a function of temperature reveal the adsorption/desorption thermochemistry in terms of enthalpy and entropy of adsorption and are thus the gateway to a deeper molecular understanding of molecular interaction between gases and the condensed phase.
A second example of uptake with ensuing desorption phase is shown in Figure 7 that deals with uptake of trifluoro acetic acid (TFA or CF3COOH) on a sample of Processed Amorphous Carbon (PAC) of high surface area (1,580 m2/g) (Mirghaffari et al., 2021). TFA is a strong gas phase acid that interacts heterogeneously with both strong and weak basic functional groups of PAC such that at saturation of uptake the loss of TFA in molecules equals the accessible or interfacial basic functional groups of PAC. We have repeatedly used this surface titration technique in order to characterize different surface functional groups on solid materials of interest from a molecular point of view (Setyan et al., 2009; 2010). At 9′400 points of the uptake experiment of TFA (S101 displayed in the left panel of Figure 7) in the 1 mm Ø exit orifice KFR the MS signal at m/e = 69 plunges almost to zero upon opening of the SC at an inlet flow rate Fi = 1.36 × 10¹⁵ molecule s−1, and gradually rises again owing to saturation of the uptake. The SC is closed at 22′700 points or 55.4 min reaching subsequently the I0 level we started with. The small decrease of I0 owing to loss of stagnation pressure in the inlet vacuum line notwithstanding, we note a (quasi-) steady-state uptake corresponding to kss = 1.2 × 10⁻² s−1 that lingers on for many opening and closing cycles not shown in the experimental sequence. However, the steady-state value kss gradually decreases over time which is the reason we call this small rate constant quasi-steady-state. The evaluation of the initial uptake rate constant k0 is associated with a large uncertainty in this case owing to the fact that the MS signal intensity almost drops to zero at 9′400 points. Nevertheless, we measure k0 = 4.3 ± 2 s−1 as first-order uptake (loss) rate constant corresponding to an uptake probability γ0 = 1.77 × 10⁻⁵ based on the BET total area. The quasi-steady state rate constant kss is two orders of magnitude lower compared to k0 which is the reason that we attribute it to mass transport into the bulk of the high surface area PAC. It is therefore the time scale of the uptake that identifies the interaction as an adsorption to the interface, in contrast any process taking longer must be associated either to mass transport of the gas into the bulk or to a slow chemical conversion taking place either at the interface or in the bulk of the material.
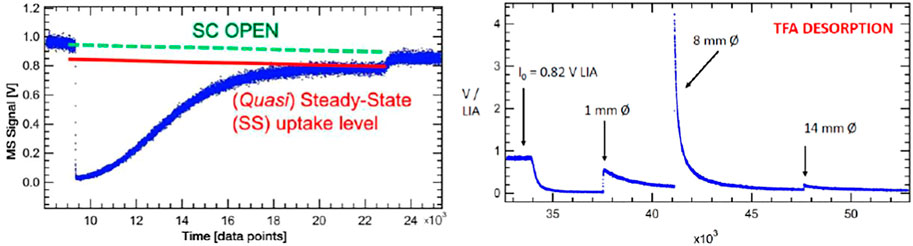
FIGURE 7. Adsorption and desorption traces for trifluoroacetic acid monitored at m/e = 69 amu at Fi = 1.36 × 10¹⁵ molecule s−1 reacting with 4.8 mg Processed Amorphous Carbon (PAC) of 1,580 m2/g BET surface (S101). Uptake phase: integral of the blue MS trace and the red line corresponds to 5.35% of a monolayer or a total of 1.4 × 10¹⁸ molecules with a steady-state rate constant of 1.2 × 10⁻² s−1. SC closed at 22′700 pts. The recovered TFA fraction from the desorption amounts to 1.3 × 10¹⁸ molecules or 92.9% of the quantity taken up. Computer fit for the 1 mm Ø exit orifice KFR results in kd = 1.2 × 10⁻⁴ s−1 with ka = 2.3 s−1, ke = 0.114 s−1 (See Figure 6, lower panel).
The integral is evaluated between the red line and the blue uptake curve of Figure 7 and addresses only the “irreversible” fraction of the uptake according to Equation 16 leading to an acid-base complex (salt) excluding the steady-state contribution (kss) visible at the end of uptake between 20′000 and 23′000 pts:
This integral corresponds to 1.4 × 10¹⁸ molecules of CF3COOH lost at the specified flow rate Fi above and represents 5.35% of a monolayer of TFA on a geometric surface. Turning to the right panel of Figure 7 one sees the traces of the MS signal for the desorption phase with the three peaks associated to the 1, 8 and 14 mm Ø exit orifice whose sum is equal to 1.3 × 10¹⁸ molecules desorbed. The average desorption yield of four uptake/desorption experiments results in 88.7% recovery which indicates a relatively short surface lifetime of this trifluoroacetate salt. Curve fitting of the 1 mm Ø exit orifice following Equation 15 is displayed in the lower panel of Figure 6 and yields kd = 1.2 × 10⁻⁴ s−1 using ka = 2.3 s−1 and ke = 0.114 s−1 that corresponds to a surface lifetime of 139 min or roughly 2 h. Our choice of ka for best fit is within the error limits of the measurement referred to above. The full paper on the interaction of organics on mineral dust materials (Bentonite, Kaolinite LO, ATD C (oarse), Saharan Dust and Saharan Sand) will be published in the near future (Iannarelli et al., 2022b) as well as the titration of the same substrates by several small probe gases (Iannarelli et al., 2022a).
The interaction of small polar molecules on substrates of amorphous carbon, soot and mineral dust substrates is of special interest as it centers on the molecular potential between lipophilic or hydrophobic materials and polar probe gases. The attributes “lipophilic” and “hydrophobic” as well as its opposite term “hydrophilic” are qualitative terms that do not quantitatively grasp the affinities between the interaction partners except for the measurement of contact angles. This measurement, for instance using the sessile drop technique, only describes the interaction on a macroscopic scale between a liquid droplet and its substrate. Furthermore, it addresses only the interaction of the condensed phase with the given substrate but leaves the question of the interaction of physisorbing gases unanswered. It is plausible to classify the PAC substrate as hydrophobic when H2O is the probe gas. But what about mineral dust surfaces with its oxidized interface? It is our on-going intent to perform experiments with a decisively molecular view by exploring the multiphase interaction between polar gases such as H2O or NO2 vapor and solid substrates of interest, also because H2O vapor is not the most unimportant polar gas of the planetary atmosphere.
We therefore have studied the heterogeneous interaction of H2O, HCl and NO2 on PAC and of H2O(D2O) on the clay material Bentonite (mainly consisting of Montmorillonite clay) and ATD-Coarse with the question in mind whether mineral substrates such as clays or ATD are hydrophilic or hydrophobic materials and how this qualifier expresses itself on a molecular scale. Table 3 displays the results of a few selected experiments. Taking experiment S71 of Table 3 water saturates PAC (4.5 mg sample) at 0.29% of a molecular monolayer or 1.76 × 10¹² molecule cm−2, a very small value in keeping with the qualitative notion of a hydrophobic surface. At a flow rate of H2O of Fi = 7.5 × 10¹⁵ molecule s−1 we measure a modest initial rate constant k0 for uptake of 0.21 s−1 in the 1 mm Ø orifice KFR. However, in the desorption phase ka must be increased by a factor of 70 in order to obtain an acceptable fit to the desorption experiment (1 mm Ø). Duplicate experiments, for instance experiment S131 displayed in Table 3, replicates the behavior of ka at a flow rate Fi = 4.12 × 10¹⁵ molecule s−1. As expected, the uptake is modest as shown in the insert of Figure 8 and led to k0 = 0.118 s−1. The desorption phase of H2O is shown in Figure 8: Here a value of ka larger than a factor of 130 compared to k0 was found in order to obtain an acceptable fit to the desorption rate of H2O. The reason for this discrepancy seems clear: the initial uptake phase of H2O vapor takes place on a dry and clean surface when the SC is opened and is quantified by the uptake probability under “γ DRY” in Table 3. Once it is saturated, the initial desorption after opening the SC takes place in the presence of a water-saturated substrate whose coverage is admittedly quite small, on the order of a fraction of a percent of a monolayer which is quantified by “γ WET”. The uptake probability of H2O interacting with already adsorbed water is much larger than with the remainder of the PAC surface, and this fact is expressed by the acceleration factor ka/k0.
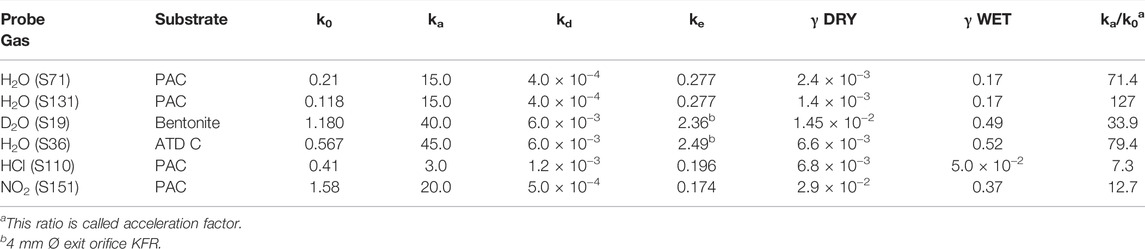
TABLE 3. Desorption rate constants kd observed for small polar molecules for 1 mm Ø exit orifice KFR.
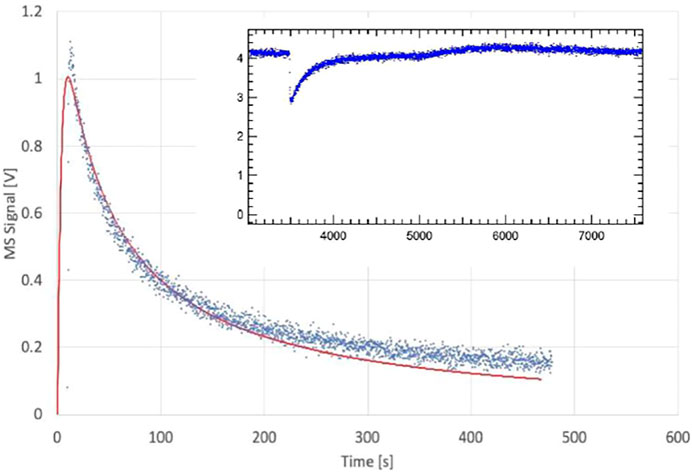
FIGURE 8. Desorption of H2O monitored at m/e = 18 amu from 4.5 mg sample of previously saturated PAC (S131), uptake on clean PAC in 1 mm Ø orifice KFR shown in the insert (ordinate in V LIA), SC closed at 6,300 pts.; Fi = 4.12 × 10¹⁵ molecule s−1, k0 = 0.12 s−1; desorption parameters are kd = 4.0 × 10⁻⁴ s−1, ke = 0.277 s−1, ka = 15 s−1. Insert shows corresponding H2O uptake phase (see text).
The surprise lies in the magnitude of this effect taking place at a saturated H2O coverage of less than a percent. The water saturation on the clay mineral Bentonite and ATD-C is significantly larger, namely 10.6 and 11.7% of a monolayer compared to 0.29% for PAC. The recovery of H2O by desorption from H2O-saturated Bentonite and ATD Coarse is 31.8 and 77.5% of the adsorbed quantity of H2O, respectively. Here the acceleration factor is of the same order of magnitude as for PAC, namely 34 and 80 for Bentonite and ATD-C, respectively. Owing to the large H2O-retention by Bentonite we had to resort to taking D2O as a probe gas. Incidentally, the uptake probability for the adsorption of water vapor on adsorbed H2O is on the order of 0.5 for the solid mineral dust materials compared to PAC that is approximately 0.2 to be found in the column labeled “γ WET”. This is intuitively plausible owing to the increase of H2O coverage at saturation in going from PAC to mineral dust because H2O vapor has an increased probability of colliding with adsorbed H2O in the latter case for a coverage of 12% for mineral dust compared to 0.3% of a monolayer for PAC. Although these high values of ka for H2O interacting with hydrophobic substrates are not measured directly, they are expected for values of the H2O accommodation coefficient on a water surface (Crowley et al., 2010).
The acceleration factor for adsorption to PAC decreases in going from H2O to NH2OH, HCl and NO2, of which the latter two may be found as examples listed in Table 3. HCl interacting with PAC (experiment S110, 5.1 mg) saturates at 0.44% of a monolayer akin to H2O (see above) at a flow rate Fi = 5.46 × 10¹⁵ molecule s−1. In contrast, NO2 (experiment S151, 5.8 mg) adsorbs on PAC up to 3.7% of a monolayer at saturation at a flow rate Fi = 4.05 × 10¹⁵ molecule s−1 which leads over to larger, albeit polar molecules that do not show an acceleration factor and result in ka = k0 within the measurement uncertainty (up to a factor of 2). These larger polar molecules include trimethylamine (TFA), trifluoroacetic acid (TFA) and thiophene (C4H4S), all molecules whose recovery through desorption was significant and which resulted in excellent fits under the condition ka = k0. We need to alert the reader that the uptake probabilities given in Table 3 are lower limiting values because they have been derived using the geometric surface area of the sample cup. It is likely that the true uptake probability may be larger because in many cases the sample did not cover the sample cup completely in view of the small sample masses used.
We emphasize the following two aspects of the adsorption properties of small polar molecules discovered through the fitting of the desorption traces of the adsorbed molecules:
1) The classical formalism of Langmuir adsorption/desorption kinetics (Adamson (1976); Laidler (1987)) works only in part because the kinetics is not proportional only to the number of free sites on the substrate surface because the rate of adsorption and desorption also depends on the amount adsorbed as a function of time. A way to think about adsorption would be that H2O builds up nanodroplets or nanometric water clusters on a small fraction of a percent of the surface. The larger the mass of these droplets, the faster the rate of adsorption akin to an autocatalytic process. At the same time the rate of desorption also increases owing to mass/surface accretion that speeds up evaporation until both rates are equal and saturation is reached. The adsorption starts with a slow rate of adsorption and ends with a fast one whereas initial desorption starts with a fast desorption and slows down owing to mass/surface erosion of the water clusters through evaporation and subsequent pumping. This is in stark contrast to large polar species whose adsorption and desorption rates only depend on the number of occupied and free surface adsorption sites such as TFA, TMA and thiophene mentioned above and therefore follow Langmuir kinetics. An alternative view would be to consider the hard sphere collision cross section which would increase from 3.8 Å to 32.1 or 42.5 Å for the adsorption rate constant for experiments S71 and S131, respectively (Mirghaffari et al., 2021).
2) This concept may have important consequences in atmospheric sciences and would allow one to understand the fundamental process of ice nucleus (IN) formation and formation and growth of aviation condensation trails in the wake of a jet engine during a short amount of time when supersaturation is still large and temperature low before dilution (Fahey and Schumann, 1999). This accelerated mode of condensation may also play a role in condensation freezing during growth of IN under atmospheric conditions.
Additional Examples
In this section we will briefly introduce three additional examples of flowing gas experiments to the already presented above in order to get an impression of the capabilities and breadth of application of the KFR regarding the studies of the molecular composition of the condensed phase interface in terms of (re)active surface functional groups that are the gateways to chemical and catalytic activities. These examples include: 1) Surface titration of the interface of various types of amorphous carbon with the goal of the elucidation of structural elements of combustion soot, PAC and synthetic amorphous carbons; 2) The study of elemental Ag/air interfaces and its oxidative stability and reactivity, and 3) the interaction of CO2 with anatase TiO2.
a) The elemental composition of amorphous carbon and flame or combustion soot is mostly carbon with a few weight % of O and H as well as other even less abundant elements such as N, S and alkali, earth alkali and other metallic and non-metallic elements. However, the bulk composition does not reflect the composition of the interface that represents the gateway to the reactivity and sometimes catalytic activity of these materials. It therefore behooves us to study the molecular composition of that interface in terms of surface functional groups of these complex materials that may react with gases and/or liquids as a gateway to chemical reactivity of these materials. Over the past few years we have developed a titration method that systematically “interrogates” these functional groups at the molecular interface by letting a reactive or non-reactive gas interact with the material in question, thereby measuring both the uptake of the probe gas as well its uptake kinetics in terms of reaction or adsorption probability per collision, so-called uptake coefficients γ. We have published several papers in the literature on diverse solid materials using a standard set of probe gases in order to enable meaningful comparison (Setyan et al., 2009; Setyan et al., 2010; Mirghaffari et al., 2021).
What matters is the abundance of the functional group as well as its kinetics of disappearance or saturation regardless of its molecular speciation, and not the attribution to different molecules making up the interface. In other words, we are just interested in a reactivity map of the interface, but not in the molecular speciation of the interface. The identity of the probe gas will then reveal the reactive nature of the surface functional group. We are using the KFR as a tool to differentiate between the bulk and the interface as the functional groups “visible” from the gas phase promptly react in tens of seconds or minutes whereas the bulk reacts slower on a time scale longer by two to four orders of magnitude owing to slow mass-transport across the interface into the bulk.
In this section we will concentrate on a few types of amorphous carbon and pose the question whether or not the response of the interface to certain reactive gases enables a semiquantitative understanding of the structure and chemical make-up of the interface. It usually is a challenging task to investigate the chemical nature and reactivity of the interface of active, elemental or black carbon or whatever it is being called depending on the way one produces it (hydrocarbon combustion, hydrocarbon pyrolysis, electrical discharge, etc.). Supplementary Appendix A8 summarily presents the different reactive gases and their target surface functional groups at the interface of the carbonaceous materials. It presents a list of probe gases we have used in the recent past. Both NO2 and O3 are oxidizers and react with oxidizable compounds thereby returning to a lower oxidation state such as O2 and NO. However, O3 is a strong oxidizer compared to NO2 and will therefore react with every oxidizable functional group, weak and strong, whereas NO2 will only oxidize strongly reducing functional groups only, it being a weaker oxidant in comparison with O3. Applied to amorphous carbon conjugated (poly)hydroquinones (see Supplementary Appendix A8, first line in Table) will react with both O3 and NO2 whereas weaker reducing (oxidizable) groups will only react with O3 and not with NO2. That same bracketing technique may also be applied to acidic probe gases reacting with basic surface functional groups. Supplementary Appendix A8 presents a pair of acidic probe gases on its second line, namely CF3COOH (TFA) and HCl. The former is a stronger acid in the gas phase than HCl because the anion (trifluoroacetate) forms a stabilized resonance where the negative charge is equally distributed on both O atoms whereas for HCl the negative charge of the conjugated anion is located entirely on the Cl atom. Therefore, TFA will react both with weak and strong acidic surface functions whereas HCl will exclusively react with strong bases. A note in passing is the reversed sequence of acidities in solution for TFA and HCl compared to the gas phase because of solvent effects. We think that for the present studies gas phase properties are relevant owing to the absence of stabilizing solvents in vacuum.
Supplementary Appendix A8 also displays other probe gases for oxidized reactive and acidic surface functional groups such as the strongly reducing compound NH2OH (hydroxylamine, HA) and strongly basic trimethylamine (TMA) as well as other sulfur-bearing compounds. Hydroxylamine is both a strong reducing agent but also binds to surface hydroxyl groups of mineral dust materials such as Bentonite, Kaolinite, ATD C(oarse), Saharan Dust (aeolian deposit on the Cap Verde islands) and Saharan Sand (Ergg Chebbi, western Morocco). The recovery rate of adsorbed HA by spontaneous desorption at ambient temperature varies between 10 and 30% whereas it is typically 10% on commercially available TiO2 P25. We propose a stable structural model for a 5-membered ring structure with the surface - OH•••HA complex displayed in the second row of Supplementary Appendix A8. It is based both on its bonding through the HA lone pair as well as undergoing hydrogen bonding of the OH group of HA with the acceptor OH group of the surface functional group. However, at this point we cannot be sure of the branching ratio between reducing properties and hydrogen-bonding abilities of HA on the interface of interest. At this point we make the assumption that HA will predominantly bond to surface hydroxyl groups in a reversible reaction because all quantitative results obtained so far indicate a high surface coverage of HA coupled to fast adsorption kinetics (high γ values) albeit never exceeding 100% or so coverage. The fast reaction corresponds to a physisorption of HA on surface hydroxyl groups whereas the alternative oxidation reaction of HA and the concomitant reduction of a surface functional group would be expected to be slower in view of the sequential many electron transfer mechanism.
In the following we will concentrate on the four listed probe gases of Table 4 examining the oxidative and basic character of the functional groups of amorphous carbon. It displays seven entries corresponding to seven different carbonaceous substrates whose sources are given in the footnotes of Table 4. We will at first focus on the orange-colored fields corresponding to O3 and NO2 probe gases interacting with HVO, Diesel and CFCMS carbon by noting that the coverage by surface functional groups reacting with O3 and NO2 are similar within experimental uncertainty. This means that the three carbonaceous materials in question have strongly reducing surface functionalities because the difference between the weakly and strongly oxidizing probe gas is vanishing. We note in passing that both HVO- (corresponding to combustion of Biodiesel fuel) and Diesel-powered vehicles have a significantly higher coverage in strongly reducing surface functionalities compared to the synthetic material CFCMS. For the remaining four carbon materials the coverage of strongly reducing surface functional groups is markedly lower than the sum of strongly and weakly reducing functional groups because of a marked occurrence of weakly reducing surface functional groups. We now associate the strongly reducing groups to hydroquinone-type OH groups attached to large polycyclic aromatic hydrocarbons that make up a large fraction of combustion aerosols or soot particles (Bockhorn, 1994). Equation 17 presents a simplified example for the oxidation of a simple conjugated hydroquinone analog to its quinonoid product based on the oxidation of the parent p-hydroquinone to 1,4 benzoquinone:
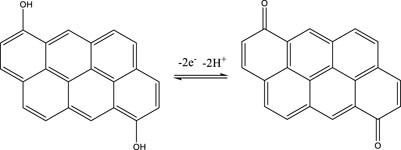
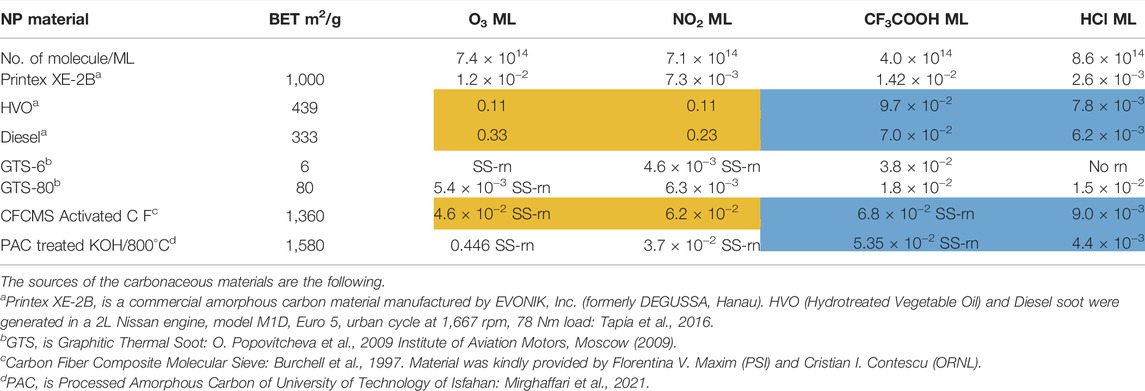
TABLE 4. Partial titration results on some amorphous carbon types using O3, NO2 as oxidizing and CF3COOH, HCl as acidic probe gases for the composition of the interface in terms of reducing (oxidizable) and basic surface functional groups in units of monolayers (ML).
In the structure of Equation 17 both hydroxyl groups are connected by a network of sp2-hybridized conjugated double bonds that enable the electronic interaction between both OH groups. For that reason not all pairwise positions of OH groups of a hydroquinone analog (lefthand side of Equation 17) lead to a stable (ground state) quinonoid (righthand side of Equation 17) by oxidation. The intervening double bonds making this reaction system a conjugated network between two OH groups has topological requirements that favors certain positions of OH groups that will lead to stable oxidation products. Non-favorable relative positions of OH groups on the periphery of a PAH lead to biradicals that represent excited states of the reaction system. Supplementary Appendix A3 provides some examples of stable quinonoid structures. However, it is likely that product PAH compounds originating from combustion or other sources correspond to polyhydroxy-substituted PAH’s in which case thermochemistry will select any combination of two substituted OH groups leading to a stable quinonoid structure. In addition, the coverages for HA and NO2 probe gases are correlated and track each other for carbonaceous substrates although the coverages for HA are significantly larger on an absolute basis compared to the coverage of surface groups for NO2 probe gas. This is an expected result as HA probes all OH surface groups, whereas NO2 only probes the pairs of OH surface groups that lead to stable quinonoid oxidation products.
We will now continue to discuss the coverages on carbonaceous materials listed in Table 4 using TFA and HCl probe gases. As briefly discussed above, the comparison between the coverages of surface functional groups probed by TFA and HCl results in quantifying the coverage of the sum of all basic, that is weakly and strongly basic, vs. the strongly basic surface sites, respectively. The average ratio of weakly to strongly basic sites is 9.9 for HVO, Diesel, CFCMS and PAC samples (shaded in blue) vs. 2.3 for Printex XE-2B and GTS-80. Our subset of strongly reducing substrates discussed above, i.e. HVO, Diesel and CFCMS therefore belong to the kind of amorphous carbon that is weakly basic. PAC is also weakly basic, but has in contrast to our selected subset not a sufficiently high number of strongly reducing surface functional groups.
We now have to attempt to propose a structure belonging to a parent PAH that is consistent with the experimental finding of a weakly basic surface functional group. Böhm et al. (1964) have proposed pyrones as weakly basic hydrocarbon compounds only consisting of C, O and H that are formed on the surface of carbonaceous materials under certain reaction conditions. Equation 18 displays the weakly basic character of a simple 1,4-pyrone in which the oxygen of the carbonyl group is the basic site:
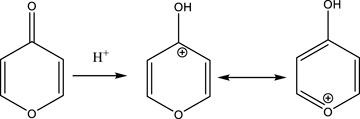
The basicity of both 1,2- and 1,4 pyrones stems from the fact that the positive charge upon protonation is delocalized over three reaction centers, namely carbons 1, 3 and 5 which stabilized the protonated form and makes the molecule basic for proton adsorption. The canonical form to the right of Equation 18 with the formal positive charge on the ether oxygen is a shortcut to indicate that the charges may also be localized on the π-electronic carbon centers in positions 3 and 5 resulting in partial charges on the π molecular orbital on carbon centers 1, 3 and 5. Similar to the situation with the hydroxyl/carbonyl groups discussed above a network of interposed conjugated double bonds enables the electronic interaction between the ether oxygen and the carbonyl group in a large frame PAH whose possible structures are exemplified in Supplementary Appendix A4. The first two structures, Pa and Pb displayed in Supplementary Appendix A4 correspond to 1,4- and 1,2-pyrone whose protonated forms are called pyrylium ions. Both conjugated hydroquinones and conjugated pyrones being part of a large PAH are consistent with the experimental observations of both the strongly reducing and weakly basic character of surface functional groups. The question is whether or not both concepts, namely quinonoid and pyronic structures may be realized in one polyfunctional molecule such as a large frame substituted PAH.
Scheme 1 exemplifies such a superposition of two different, yet related molecules in the basic PAH frame of coronene. The positional pattern of the two hydroxyl groups has been chosen to lead to a stable quinonoid PAH whereas one is less constrained by the position of the peripheral O atom.
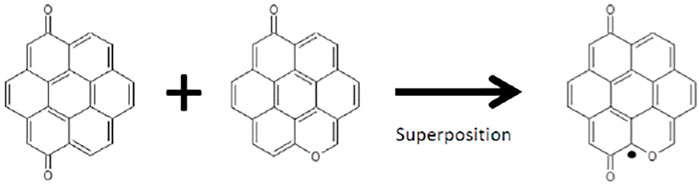
SCHEME 1. Combination of a conjugated quinone and pyrone to a multifunctional coronene resulting in a stabilized free radical.
To our surprise the superposition of both a conjugated quinonoid and a pyronic structure leads to a free radical whose free electron is moving around certain positions of the large PAH by conjugation. Owing to the delocalization of the free electron over certain positions of the large PAH the free radical electron density is smeared out over the non-bonding molecular orbital and is expected to make it kinetically inert and thermodynamically stable. Such free radicals are persistent, even under atmospheric conditions, and are called Environmentally Persistent Free Radicals (EPFR) that have been observed in Diesel and gasoline-emitted soot particles, woodsmoke, cigarette tar, combustion residues of many synthetic plastics such as PET, and other high temperature processed materials (Valavanidis et al., 2008). The spin densities per g of material are in the range of 1015 to 1017 spins/g and may be observed by electron paramagnetic resonance methods (Valavanidis et al., 2008). In practice, such polyfunctional PAH’s are decorated with a number of substituents that may interact electronically in the plane of the large PAH.
In conclusion, it is particularly gratifying that we are stumbling onto a potentially important environmentally active class of molecules (EPFR) while searching for an interpretation of experimental results together with a proposed structural model. The above concept may be extended in general to any large PAH that will have the properties of both weakly basic and strongly reducing surface functional groups as long as the molecule has an even number of properly positioned OH groups and an uneven number of ether oxygen atoms somewhere on the periphery of the PAH located at the molecular interface of a solid or condensed phase sample.
b) The study of elemental Ag nanoparticle (NP)/air interfaces.
Silver is a noble metal, but ever since it has been known that its surface has bactericidal properties in the oxidizing planetary atmosphere interest therein has been keen in this material from a public health point of view (Clement and Jarrett., 1994). Questions have been posed as to the extent of Ag surface oxidation in an oxidant atmosphere or the relative acidity/basicity of its oxides and/or hydroxyl surface functional groups (Equation 19). The Ag (+I) oxide may engage in hydrolysis according to Equation 20:
Silver oxides are interesting because they are stable under atmospheric conditions whereas the oxides of Au and Cu are unstable and metastable, respectively. This is valid for the bulk phase, whereas the properties of the oxides at the interface are largely unknown except for some UHV studies. Thermodynamically, the conversion of Ag2O to AgCl using HCl as the probe gas is driven by the formation of H2O according to Equation 21 with the following reaction enthalpy (Wagman et al., 1982):
Figure 9 displays examples of HCl uptake thought to react with AgOH or Ag2O as well as oxidation of deeper layers of elemental Ag0 using O3 that has been found to go on indefinitely and that has been followed through to about 10 molecular monolayers (Figure 9, lower left panel). The origin of the silver nanoparticles (Ag NP) is given at the end of Supplementary Appendix A6 together with a detailed account of experimental results of which the following conclusions are given.
1) HCl, NO2 and TMA reach coverages of 77, 24 and 21% of a monolayer, respectively.
2) HCl interaction presumably involves the formation of AgCl according to: {AgOH} + HCl → {AgCl} + H2O where the species in curved brackets correspond to surface-bound species (Figure 9, upper left panel).
3) NO2 is thought to oxidize elemental silver at the interface: 2 {Ag} + NO2 → {Ag2O} + NO. In contrast to O3 as an oxidizer the reaction with NO2 comes to saturation, whereas oxidation by ozone goes on unabatedly showing no signs of saturation (Figure 9, lower left panel). Deeper layers of the solid sample are therefore reactively attacked by O3 in contrast to NO2.
4) However, there is an additional yet unknown reaction of NO2 at a HCl-saturated silver interface. A rough quantitative estimate is the following: uptake of NO2 on virgin Ag takes 1.7 (in units of 1014 molecule cm−2) whereas the Ag substrate consumes 7.6 once 6.5 {AgOH} have been converted to {AgCl} using HCl. It seems that NO2 consumption is activated by HCl.
5) TMA titration results indicate that 13% of the surface OH groups are strongly acidic.
6) Both O3 and NO2 oxidize the Ag NP interface at a rate ratio of approximately 1,000 (see column γss of Table in Supplementary Appendix A6) based on the loss of both reactants. However, O3 is also lost in an autocatalytic manner at the Ag NP interface whose component increases with O3 pressure. However, the branching ratio between the pathway leading to autocatalytic destruction of O3 and the reactive oxidation channel is still unknown.
7) HCl and NO2 uptake are irreversible on the time scale of the present experiments: no desorption of neither HCl nor NO2 has been observed.
8) The uptake of HCl after oxidation by ozone amounts to approximately ten monolayers after roughly 45 min exposure to O3 at FiO3 = 7.4 × 10¹⁵ molec s−1 with no signs of slowing down thereafter (Figure 9, lower left panel). The build-up of Ag (+I) may be followed by titration using HCl and will depend on the length of oxidation by O3. The conversion of the oxide to the surface chloride is displayed in Figure 9, upper right panel.
9) After titration of Ag (+I) sites using HCl the uptake of NO2 is enhanced roughly fourfold compared to initial NO2 uptake (s30 vs. s11 in Supplementary Appendix A6). Conversely, HCl uptake continues to some extent after NO2 uptake on a Ag NP sample previously saturated with HCl (s10-s12; s31-s33 in Supplementary Appendix A6). An additional observation is that γss for s32 is increased by a factor of two indicating a faster rate for uptake of NO2 for a sample “activated” by HCl.
10) In contrast to NO2 or HCl (see above), saturation of reactive surface sites by TMA leads to modest deactivation of both HCl and NO2 uptake (s40-s42 in Supplementary Appendix A6).
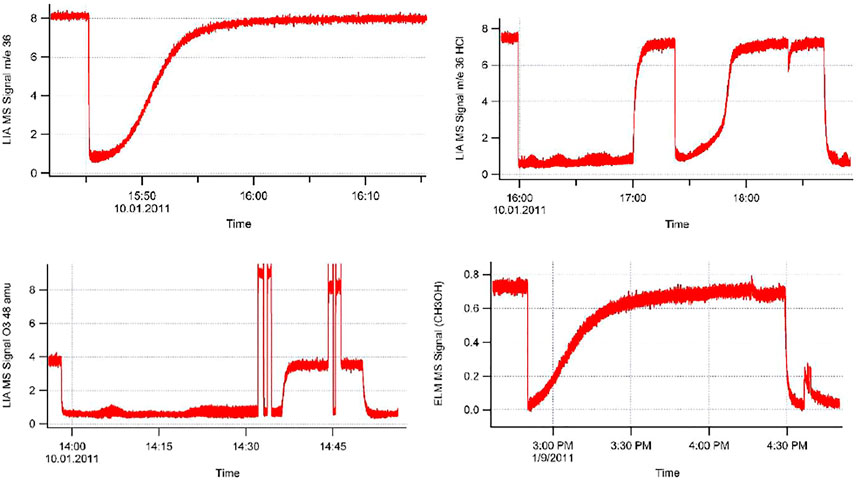
FIGURE 9. Examples of raw uptake data of Ag Nanoparticles (BET surface area = 5.52 m2/g) and CH3OH on TiO2 Hombikat (undoped): opening and closing the SC is self-explanatory. Upper left: Probe for OH-groups on Ag0 using HCl at m/e = 36 amu on a virgin sample, 1 mm Ø orifice, SC at 16:09 h; Upper right: HCl probe for OH-groups after oxidation of Ag0 nanoparticles using O3, three uptake episodes are shown, 1 mm Ø orifice. Lower left: oxidation of Ag NP’s by O3 on long time scale: 10 ML’s at Fi = 7.35 × 10¹⁵ molecule s−1 in 4 mm Ø orifice KFR. Uptake goes on indefinitely. At approximately 14:32 and 14:44 p.m. the LIA signal was changed temporarily to m/e = 32 amu in order to observe O2 level with O3 on and off, respectively. Lower right: CH3OH uptake monitored at m/e = 31 amu on 6.85 mg TiO2 Hombikat (undoped, s8 in Supplementary Appendix A7) in 1 mm Ø orifice KFR. SC closed at 3:58 p.m. At 4:40 p.m. spontaneous desorption is observed upon opening SC. Nota bene: total ELM rather than LIA MS signal (in red) recorded here.
This example only comprises four samples of Ag NP’s and 13 distinct uptake experiments (Supplementary Appendix A6). Although substantially more experiments may be needed for definitive answers it nevertheless displays the versatility and power of flowing gas experiments to extract valuable information regarding the composition of a potentially interesting interface in a timely and straightforward manner.
c) The interaction of CO2 and CH3OH with TiO2.
In the same spirit of section (b) above we briefly present the interaction of probe gases CO2 and CH3OH on a solid substrate of interest in many catalytic studies, namely TiO2 that is commercially available in large quantities, both as a carrier or support for metal(oxide) catalysts as well as an oxidation catalyst in its own right. CO2 was chosen as a probe gas to sound for acidic surface OH-groups in view of likely bicarbonate formation (Equation 22) and CH3OH is a convenient precursor for catalytic fuel synthesis. In a complex catalytic mechanism adsorption is always the first step for a successful use of a gas-substrate pair of reactants as far as an industrial application is concerned.
The CO2 flow rate has been chosen to reach a partial pressure of 2mTorr compared to 333 mTorr present in the atmosphere. Supplementary Appendix A7 shows the detailed results in the 1 mm Ø orifice KFR for both CO2 and CH3OH uptake on TiO2, both commercially available products TiO2 P25 from Evonik Inc (total surface by BET = 50 ± 15 m2/g), a widely used standard material as well as HOMBIKAT from Sachtleben Chemie (total surface by BET = 289 m2/g), a photocatalytically active TiO2 pigment for the protection of building facades (self-cleaning surfaces). In addition, the latter was impregnated with 1 and 1.5% Cu w/w in the form of CuO. TiO2 P25 adsorbs 0.26 vs. 0.55% (average of three uptake experiments) of a molecular monolayer of CO2 at saturation (1 ML of CO2 equals 7.7 × 10¹⁴ molecule cm−2 of CO2 using the solid density of CO2 of 1.562 g/cm3) for the HOMBIKAT material. In contrast, that quantity increases to 2.21 and 2.47%, thus roughly a factor of 4–4.5, for the 1 and 1.5% Cu-impregnated TiO2 pigment relative to the untreated HOMBIKAT pigment. After pumping of an untreated HOMBIKAT pigment for 20 h a second uptake of CO2 yields a 53 and 5.3% uptake for untreated and 1.5% Cu-doped HOMBIKAT pigment. Therefore, the Cu-doped material binds the CO2 more strongly than the untreated pigment material HOMBIKAT. Cu-doping also accelerates the initial uptake kinetics to γ0 = 10−2 compared to 10−3 or lower for HOMBIKAT. This indicates stronger bonding of CO2 to the Cu-doped compared to the undoped material. In addition, a steady-state uptake coefficient γss on the order of 10−5 has been observed that is larger for the undoped vs. the Cu-doped material (Supplementary Appendix A7, s3 vs. s5).
Finally, CH3OH uptake of both TiO2 P25 and HOMBIKAT corresponds to 64.4 and 59.4% of a molecular monolayer at saturation, respectively (1 ML of CH3OH is estimated at 6.06 × 10¹⁴ molecule cm−2 at a methanol density of 0.792 g cm−3). This is approximately a factor of 100 and 250 larger than for CO2 adsorbing on HOMBIKAT and TiO2 P25, respectively. It is apparent that the difference between the two pigments primarily comes from the difference for CO2 rather than for CH3OH adsorption. A small fraction of adsorbed CH3OH spontaneously desorbs to the extent of approximately 5% of the adsorption yield and is therefore reversible to some extent (see Supplementary Appendix A7 s8 and Figure 9, lower right panel). No runs have been performed for Cu-doped HOMBIKAT pigment. All experiments have been done using the 1 mm Ø orifice KFR. HOMBIKAT adsorbs more CH3OH by mass by a factor of six compared to TiO2 P25 owing to the difference of the BET total areas. In contrast to CO2 adsorption the initial uptake coefficients γ0 are large for CH3OH.
Stirred-Flow Reactors: Relaxed Molecular Flow Conditions
The interpretation of a chemical mechanism is greatly enhanced when you have the opportunity to observe the behavior of an additional chemical species or kinetic transient in multidiagnostic experiments. Two examples of past multidiagnostic experiments are 1) the laser-induced (excited) fluorescence (LIF) based observation of both NO2 and NO in addition to its respective MS detection in the presence of amorphous carbon that allowed unambiguous proof for the formation of NO as a primary product (Tabor et al., 1994) and 2) the Resonance-Enhanced Multiphoton Ionization (REMPI) detection of NO2 (Karagulian and Rossi, 2007) allowing simultaneous detection of NO, NO2 and NO3 free radicals in the presence of soot. However, what is of crucial importance for multiphase chemistry is to have a diagnostic each for the gas as well as for the condensed phase. We have thought long and hard how best to implement this concept to a KFR and came to the conclusion to change the KFR to a stirred-flow reactor (SRF). This change of approach made us sacrifice molecular beam sampling while keeping the advantage of rapid stirring through thermal diffusion at low pressure. In this way we were giving up the very low-pressure requirement expressed as the Knudsen flow condition (Equation 2). We thus have combined gas phase monitoring using residual gas mass spectrometry on one hand, and on the other introduced either a calibrated quartz crystal microbalance (QCMB) for ice studies (Delval and Rossi, 2004) or FTIR-based spectroscopy in transmission across a coated Si window for general purpose low temperature studies of binary ice condensates (Iannarelli and Rossi, 2014). As a note aside we have performed a good fraction of our recent cryogenic work using the SFR approach because of the dual diagnostic capability that enabled simultaneous observation of the gas and condensed phase changes. Examples are changing flow rates vs. optical densities in the IR spectral region that are proportional to concentration of the absorber.
The collisional environment of a KFR and SFR are quite different such that we will consider a numerical example taking O2 and the geometric dimensions of the SFR referred to in Table 5. Equation 23 relates the 3-dimensional displacement l through thermal diffusion to the residence time tr and the reference diffusion coefficient D0 = 0.176 cm2 s−1 atm for O2:
with tr defined in Equation 5 we obtain tr = 0.265 s with <c> = 4.45 × 104 cm s−1 at T = 300 K, V = 2,300 cm3 and Ah = 0.78 cm2, the latter corresponding to a 1.0 cm Ø orifice. Acknowledging the linear reciprocal pressure dependence of D using D(P) = D0 (P0/P) we obtain 7.0 × 10⁻⁴ atm or 0.532 Torr following Equation 23 with P0 = 1 atm. This pressure is certainly a lower limit because a pressure of 532 mTorr in a vessel of the used geometric dimension is in the transition regime up from the molecular flow regime which has the effect of decreasing ke or increasing tr. This limiting pressure ensures that the traveled distance is equal to or larger than the vessel dimension on the order of l which means that the average molecule collides with the vessel wall. The mean free path is calculated according to Equation 1 and results in λ = 0.108 mm with the measured collisional cross section d of 3.5 Å and the equivalence at T = 300 K: 1 Torr is equal to 3.21 × 10¹⁶ molecule cm−3. The number of collisions for a displacement of l = 20 cm is therefore 20/0.0108 = 1850 at the given pressure of 532 mTorr. Under molecular flow conditions in a KFR this number would be 3 × 20 = 60 collisions under the constraint of Equation 2 taking 3 collisions per cm (λ = 3 Ø) with an assumed diameter of 1.0 cm Ø for the exit orifice. Under these conditions (λ = 3 cm) the calculated pressure from Equation 1 becomes 6.12 × 10¹³ molecule cm−3 or 1.9 × 10⁻³ Torr or approximately 2 mTorr. In comparison to the SRF the KRF pressure is lower by approximately a factor of 300.
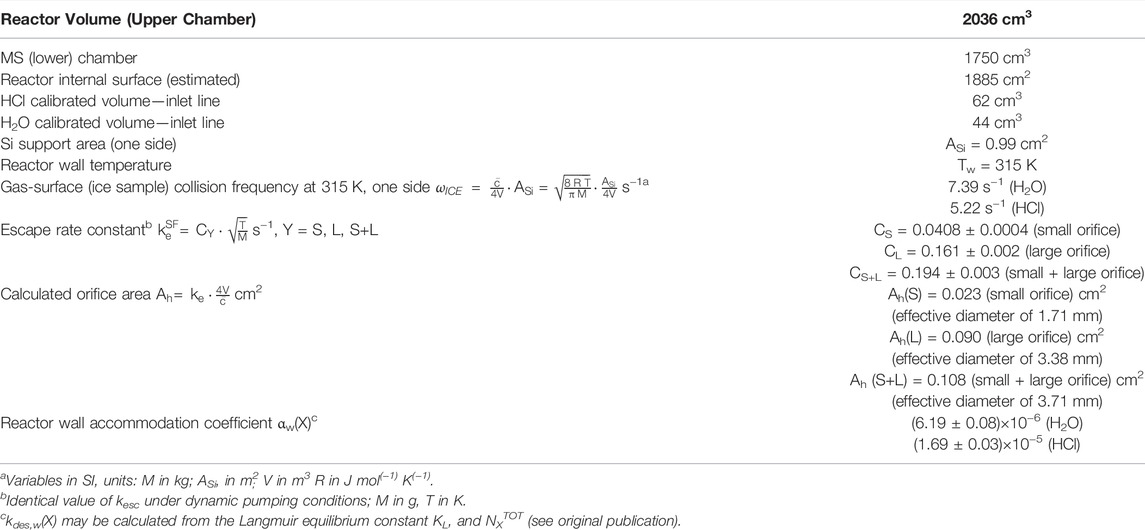
TABLE 5. Relevant parameters for SFR (Iannarelli and Rossi, 2014).
There are a few uncertainties in the above estimate, especially when we consider Equation 24 giving a fundamental definition of the diffusion coefficient D0 from first principles:
which results in D = 80.1 cm2 s−1. This has to be compared to D = D0 (760/0.532) = 251.4 cm2 s−1. This difference amounts to a factor of 3.14 which would increase the required pressure of 532 mTorr somewhat together with a decrease and increase of ke and tr, respectively. As alluded to above the collisional environment in the SFR is significantly different from the KFR, mainly because of the number of gas-gas collisions of a molecule headed to the vessel wall, however, diffusional mixing is still fast despite the 1850 collisions it takes to span the distance of l cm compared to the 60 collisions in the KFR of the same dimension. This factor of 30 in the number of collisions leads to a certain increase of the importance of gas-gas collisions, but preserves the feasibility of multidiagnostic experiments as shown in Figure 10 (Delval and Rossi, 2004; Iannarelli and Rossi, 2014).
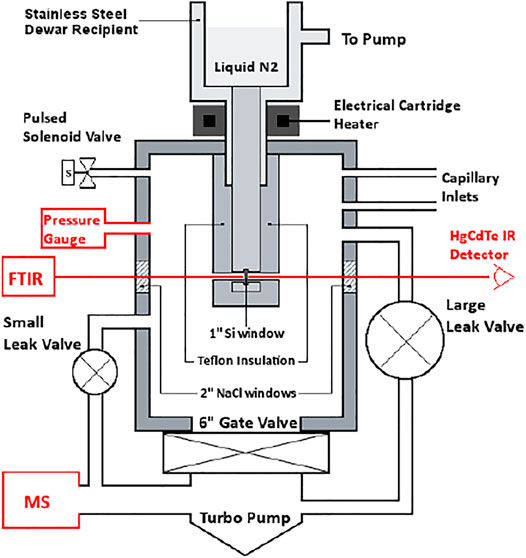
FIGURE 10. Schematic drawing of stirred-flow reactor (SFR) with two escape orifices equipped with FTIR transmission across a temperature-regulated 1″ Ø Silicon window in a multidiagnostic arrangement (FTIR absorption of solid substrate film, MS residual gas detection, 1 Torr full scale Baratron pressure gauge). The transmission windows for the IR radiation are 2″ Ø NaCl windows. Inlets are either continuous flow across capillaries, fine needle valve or pulsed solenoid valve for short gas puffs.
As briefly discussed above the quartz crystal microbalance (QCMB, see Delval and Rossi, 2004) and the FTIR transmission of thin solid films of water ice, pure and doped with HCl and HNO3 (Iannarelli and Rossi, 2014), have greatly advanced cryogenic experiments owing to the simultaneous observation of the gas and condensed phase under identical experimental conditions. Table 5 displays the relevant parameters for the SFR that is configured as a three-aperture reactor consisting of two exit valves. Upon opening the large 6″ gate valve the reactor may be used as a High Vacuum chamber that enables evaporation experiments at a constant regulated temperature under conditions of excluding readsorption processes. The reason lies in the very large pumping rate across the large access flange (DN 100CF, nominal 6”) leading to working pressures in the 10−8 to 10−6 Torr range depending on the temperature of the film. In this way we are able to simulate UHV experiments dealing with thermal desorption coupled to MS monitoring or perform rapid pumping of the cryogenic deposit. The practical regulated temperature range of the cryogenic support was verified from 90 to 230 K with the limit at the high end given by the rate of evaporation of ice starting to become uncomfortably high at T > 230 K considering that the practical thickness of the H2O ice films must be between 0.5 and 2 microns because the absorption of H2O films saturates beyond this thickness owing to the large optical density of ice films in the mid-IR range (5,000–720 cm−1). It is not the goal of the present report to delve into the presentation of specific results regarding work performed using the SFR. Instead, we present a synopsis of results from the literature and our own work both from the KFR and SFR of the rate of adsorption of H2O on ice in Figure 11 in order to give an idea of the diversity of results on the rate of adsorption and/or mass accommodation coefficient of this important reaction taking it as an example.
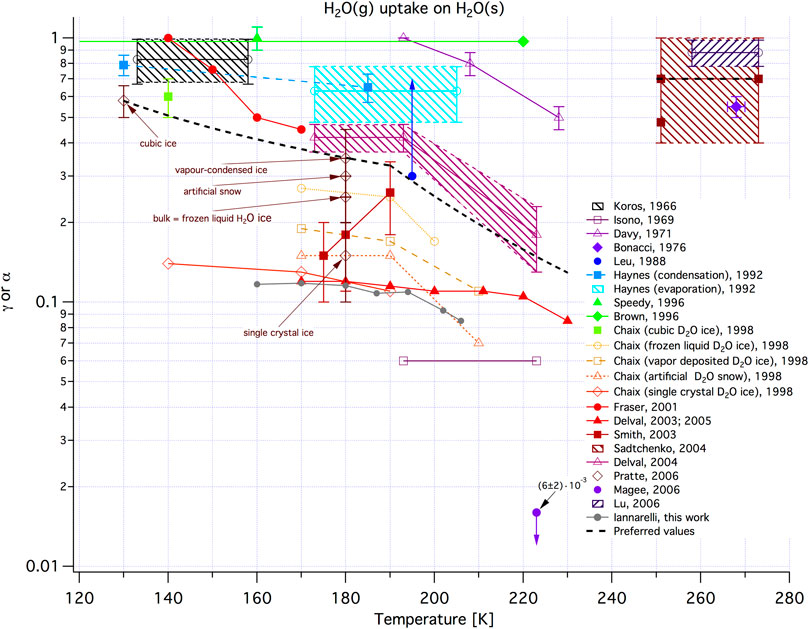
FIGURE 11. Synopsis of the uptake (γ) and/or mass accommodation coefficients (α) for H2O(D2O) vapor on H2O ice. No data on supercooled H2O as substrate are included (taken from PhD thesis of R. Iannarelli, accepted by ETHZ in 2014 as thesis no. 21791. In the legend the corresponding referred publication is Iannarelli and Rossi, 2014).
Figure 11 presents results from many different types of experiments including flowing gas experiments. At 180 K the results of the latter diverge by a factor of three, depending on the type of ice whose surface was found to be quite dynamic. At 220 K the spread among all experiments covers two and a half orders of magnitude in uptake probability. Moreover, there seems to be a data gap in the range 220–250 K: after a decreasing trend from 130 to 220 K the uptake probability jumps up to values close to unity. The decreasing trend of γ(α) displayed in Figure 11 in the range 120–220 K may have to do with the gradual onset of a change in chemical mechanism. Routine assumption is that ka is a first order rate constant, however, detailed molecular modeling points to a bimolecular component of gas uptake onto ice substrates which gains in importance with increasing partial pressure in agreement when temperature increases or when the ice surface becomes more dynamic (Flückiger and Rossi, 2003). This question will have to be settled in the future before we go on studying more complex ices. Moreover, it is interesting to consider the values in column 7 (WET case) of Table 3 for H2O/D2O desorbing from both PAC, Bentonite and ATD Coarse that are quite high and approach unity, thus supporting the data on ice substrates of Figure 11. In conclusion it may be said that the possible temperature variability of the rate of adsorption of H2O on ice as a function of temperature is of the same magnitude as the variability of the type of substrate. It thus underlines the importance of serious and in-depth characterization of the ice substrate before each uptake/adsorption experiment of H2O vapor as well as considering the dynamic nature of the ice surface during the uptake experiment. A final remark on the quantitative use of the QCMB in regards to its use as a monitor of progress of surface chemistry should be made at this point (Delval and Rossi, 2018). The mass accretion on the QCMB is followed by a decrease in oscillation frequency of a scissoring vibrational motion of the AT-10 cut quartz crystal. The device is routinely used in materials science for crystalline and metallic materials deposited onto the quartz crystal along with factory calibrations of many investigated materials to facilitate quantitative use. However, in the present application the deposited molecules such as H2O, HCl and HNO3 are only physisorbed onto the low temperature quartz crystal that makes independent calibration using the calibrated MS monitor mandatory. This is another advantage of multidiagnostic detection because it offers the possibility of obtaining quantitative data by cross-calibration of detection techniques. The situation is similar when using FTIR thin film absorption in transmission or grazing incidence.
Conclusion and Outlook
In terms of the design of a KFR adapted to the study of multiphase chemistry in terms of uptake and desorption phases we would like to stress two instrumental parameters, namely 1) the SC must be as small as possible to reduce the filling transient to a minimum, and 2) the geometry of the exit orifice must not be recessed as represented in Figure 3A (insert). The chamfered edge of the hole should face the high-vacuum and NOT the reactor, unlike the schematic drawing of Booth et al. (2009). A carefully optimized design of a KFR will obviate uncertainties in the interpretation of results.
The measurement of kd under the same experimental conditions as ka leads to the Langmuir equilibrium constant KL that defines the affinity of the probe gas towards the substrate interface. For the first time this opens up the possibility to derive the thermochemistry of multiphase chemical systems involving complex interfaces. The temperature dependence of KL will establish enthalpies and entropies of adsorption together with kinetic parameters such as the energy of activation of ka and kd as well as the corresponding Arrhenius A factors because the present technique yields the separated temperature dependence of both adsorption and desorption and thus ensures thermochemical closure of adsorption/desorption on a specific substrate material (Benson, 1976).
Regarding the interaction of small polar molecules such as H2O, HCl, NO2 and NH2OH with an interface of complex composition we conclude the following: for a potential quantitative measure of the hydrophobic character of an interface from a molecular point of view we retain two essential features: 1) the substrate interface in question has a very low (PAC, fractional coverage of less than one %) to low (mineral dust proxies, fractional coverage of 10–12%) number of adsorption sites per cm2; 2) the acceleration factor ka/k0 must be large which means that there is a large difference between the adsorption on a “dry” vs. “wet” interface. Instead of a smooth coherent adsorbate layer we obtain in this case a layer with nano clustered adsorbates randomly distributed on the interface whose numbers remain constant but whose particle volumes grow with exposure to the probe gas.
The measurement of mass transport parameters is also possible using a probe gas exploring the interface of a powdery substance. In this context a measurement of the binary diffusion coefficient of HCl and HBr in ice at low temperatures using ClONO2 as a titrant for the abundance of HCl adsorbed on ice may be noted as an example for the application of KFR (Aguzzi et al., 2003). Taking a slightly different approach Supplementary Appendix A9 shows two examples for D2O and NH2OH diffusion into Bentonite powder at ambient temperature. Both experimental MS signal curves show an interrupted uptake of the probe gas, and instead of resuming at the signal level suggested by the horizontal red arrow the actual MS signal is lower than expected. The conclusion is that the uptake has changed during sample isolation by freeing up interfacial adsorption sites for the probe gas by diffusion of adsorbed material into the bulk of the substrate. Upon opening the SC these “extra” (or regenerated) surface sites lead to a faster adsorption compared to when the uptake experiment was interrupted. This behavior has been observed for many gas-substrate combinations over the years and depends on the competition between mass transport and probability of uptake at the interface which also is a function of sample presentation and morphology. It is clear that in certain situations like fast mass transport and low uptake probability (or rate constant) the measurement of the uptake to complete saturation becomes more uncertain.
A last remark concerns work on the measurement of the equilibrium vapor pressure of semivolatile substances using the Knudsen effusion mass spectrometry “KEMS” technique (Booth et al., 2009; Dang et al., 2019) in which the authors try to take a shortcut by measuring the effusion rate of semivolatiles at low temperature using just one orifice size. Unlike the high temperature effusion mass spectrometry of refractive materials discussed previously (Hildenbrand, 1968) the situation in Dang et al. (2019) is very different because ke represents a large perturbation of the equilibrium (ke >> kd) in view of the small rate of evaporation/desorption. In contrast ke << kd in the high temperature case with the rate-determining step being ke whereas in the Dang et al. case kd is the rate-determining step in which case Dang et al. measure a steady-state evaporation rate far from equilibrium. Here we make the tacit assumption that ka does not greatly vary with temperature which has been found to be true in general because the activation energies of adsorption processes are small (Benson, 1960). In this case a minimum of three independent data sets obtained from three different exit orifice sizes would lead to the true equilibrium constant. One needs two independent data sets for the two unknowns, ka and kd, and the third data set is redundant in order to check for self-consistency of the kinetic data. Moreover, these authors use data that differ by more than an order of magnitude in equilibrium vapor pressure for validation of their approach (Booth et al., 2009) which is certainly not ideal. In addition, it has been found more than 50 years ago that the KEMS method was flawed and/or impractical for measuring low vapor pressures (Biddiscombe and Martin, 1958). In summary, it becomes clear that a lucid evaluation of the measurement strategy based on a complete understanding of the expected kinetics has to precede the measurement in the laboratory.
Data Availability Statement
The original contributions presented in the study are included in the article/Supplementary Material, further inquiries can be directed to the corresponding author.
Author Contributions
RI contributed to experiments and modeling, CL contributed to conception and discussion, MR contributed to conception, modeling and experiments.
Funding
Open access funding provided by Swiss Federal Institute of Technology Lausanne.
Conflict of Interest
The authors declare that the research was conducted in the absence of any commercial or financial relationships that could be construed as a potential conflict of interest.
Publisher’s Note
All claims expressed in this article are solely those of the authors and do not necessarily represent those of their affiliated organizations, or those of the publisher, the editors and the reviewers. Any product that may be evaluated in this article, or claim that may be made by its manufacturer, is not guaranteed or endorsed by the publisher.
Acknowledgments
Special thanks go to Stanford University Associate professor David M. Golden for his contagious enthusiasm, thoughtful guidance as well as fruitful and productive scientific discussion over the last 5 decades who introduced me to VLPP (Very Low-Pressure Pyrolysis) and always kept a keen interest in the development of the field as well as in innovative applications. I am also indebted to my former colleagues from the Chemical Physics Lab at SRI International (in alphabetical order), namely Alan Baldwin, John Barker, Chris Becker, Mike Coggiola, Phil Cosby, David Crosley, Don Eckstrom, Peter Helm, Karan Lewis, Don Lorents, Ripu Malhotra, Don F. McMillen, Jim Peterson, David S. Ross, Tom Slanger, Greg Smith, Maggie Tolbert, Paula Trevor, and many others for stimulating and exciting collaborative efforts. We would also like to address our sincere thanks to Eya Damergi-Nicodème for her interest and her support regarding some illustrations.
Supplementary Material
The Supplementary Material for this article can be found online at: https://www.frontiersin.org/articles/10.3389/fspas.2022.891177/full#supplementary-material
Abbreviations
ATD C(oarse) Arizona Test Dust Coarse fraction; CFCMS Carbon Fiber Composite Molecular Sieve; CWFT Coated-Wall Flow Tube; BET Brunauer–Emmett–Teller adsorption isotherm; ELM Total Electrometer MS Signal; EPFR Environmentally Persistent Free Radical; FTIR Fourier Transform IR spectrometer; GTL Gas-To-Liquid (fuels); GTS-80, GTS-6 Graphite Thermal Soot; HA Hydroxyl Amine NH2OH; HOMBIKAT TiO2 is TiO2 pigment Cu2+ doped (impregnated) Sachtleben Chemie; HVO Hydrotreated Vegetable Oil; IN Ice Nuclei or Ice Nucleation; KEMS Knudsen Effusion Mass Spectrometry; KFR Knudsen Flow Reactor; LIA Lock-In Amplifier; MS Mass Spectrometry or mass spectrometric; PAC Processed Amorphous Carbon; Printex U, Printex XE-2B Amorphous Carbon Products (DEGUSSA, Evonics Inc., Hanau); PSC Polar Stratospheric Clouds; QCMB Quartz Crystal Micro Balance; QMA Quadrupole Mass Analyzer; RCAST Research Center f. Advanced Science & Technology (U Tokyo); REMPI Resonance-Enhanced Multiphoton Ionization; SC Sample Compartment; SEM Secondary Electron Multiplier; SFR Stirred Flow Reactor; TEA Transversely Excited Atmospheric CO2 laser; TFA TriFluoroAcetic Acid CF3COOH; TMA TriMethyl Amine N(CH3)3; TROPOS Leibniz Institute of Tropospheric Research (Leipzig, Germany); UCLM University of Castilla La Mancha (Ciudad Real, Spain); VLPP Very Low-Pressure Pyrolysis.
References
Adamson, A. W. (1976). Physical Chemistry of Surfaces. Third edition. New York Chichester Brisbane Toronto: John Wiley and SonsWiley-Interscience Publication.
Aguzzi, A., Flückiger, B., and Rossi, M. J. (2003). The Nature of the Interface and the Diffusion Coefficient of HCl/ice and HBr/ice in the Temperature Range 190–205 K. Phys. Chem. Chem. Phys. 5, 4157–4169. doi:10.1039/b308422c
Benson, S. W. (1960). The Foundations of Chemical Kinetics. New York-Toronto-London: McGraw-Hill Book Company, Inc.
Benson, S. W. (1976). Thermochemical Kinetics: Methods for the Estimation of Thermochemical Data and Rate Parameters. second edition. New York London Sydney Toronto: Wiley-Interscience Publication, John Wiley and Sons.
Biddiscombe, D. P., and Martin, J. F. (1958). Vapour Pressures of Phenol and the Cresols. Trans. Faraday Soc. 54, 1316–1322. doi:10.1039/tf9585401316
Böhm, H. P., Diehl, E., Heck, W., and Sappok, R. (1964). Surface Oxides of Carbon. Angew. Chem. IE 3, 669–677.
Bockhorn, H. (1994). “Soot Formation in Combustion, Mechanisms and Models,” in Springer Series in Chemical Physics. Editor H. Bockhorn (New York: Springer Verlag Berlin Heidelberg), 59.
Bonacci, J. C., Myers, A. L., Nongbri, G., and Eagleton, L. C. (1976). The Evaporation and Condensation Coefficient of Water, Ice and Carbon Tetrachloride. Chem. Eng. Sci. 31, 609–617. doi:10.1016/0009-2509(76)87001-7
Booth, A. M., Markus, T., McFiggans, G., Percival, C. J., Mcgillen, M. R., and Topping, D. O. (2009). Design and Construction of a Simple Knudsen Effusion Mass Spectrometer (KEMS) System for Vapour Pressure Measurements of Low Volatility Organics. Atmos. Meas. Tech. 2, 355–361. doi:10.5194/amt-2-355-2009
Brown, D. E., George, S. M., Huang, C., Wong, E. K. L., Rider, K. B., Smith, R. S., et al. (1996). H2O Condensation Coefficient and Refractive Index for Vapor-Deposited Ice from Molecular Beam and Optical Interference Measurements. J. Phys. Chem. 100, 4988–4995. doi:10.1021/jp952547j
Burchell, T. D., Judkins, R. R., Rogers, M. R., and Williams, A. M. (1997). A Novel Process and Material for the Separation of Carbon Dioxide and Hydrogen Sulfide Gas Mixtures. Carbon 35, 1279–1294. doi:10.1016/s0008-6223(97)00077-8
Caloz, F., Fenter, F. F., Tabor, K. D., and Rossi, M. J. (1997). Paper I: Design and Construction of a Knudsen-Cell Reactor for the Study of Heterogeneous Reactions over the Temperature Range 130–750 K: Performances and Limitations. Rev. Sci. Instrum. 68, 3172–3179. doi:10.1063/1.1148263
Chaix, L., van den Bergh, H., and Rossi, M. J. (1998). Real-Time Kinetic Measurements of the Condensation and Evaporation of D2O Molecules on Ice at 140 K < T < 220 K. J. Phys. Chem. A 102, 10300–10309. doi:10.1021/jp983050n
Clement, J. L., and Jarrett, P. S. (1994). Antibacterial Silver. Metal-Based Drugs 1, 467–482. doi:10.1155/mbd.1994.467
Crowley, J. N., Ammann, M., Cox, R. A., Hynes, R. G., Jenkin, M. E., Mellouki, A., et al. (2010). Evaluated Kinetic and Photochemical Data for Atmospheric Chemistry: Volume V – Heterogeneous Reactions on Solid Substrates. Atmos. Chem. Phys. 10, 9059–9223. doi:10.5194/acp-10-9059-2010
Dang, C., Bannan, T., Shelley, P., Priestley, M., Worrall, S. D., Waters, J., et al. (2019). The Effect of Structure and Isomerism on the Vapor Pressures of Organic Molecules and its Potential Atmospheric Relevance. Aerosol Sci. Technol. 53, 1040–1055. doi:10.1080/02786826.2019.1628177
Davy, J. G., and Somorjai, G. A. (1971). Studies of the Vaporization Mechanism of Ice Single Crystals. J. Chem. Phys. 55, 3624–3636. doi:10.1063/1.1676638
Delval, C., and Rossi, M. J. (2004). The Kinetics of Condensation and Evaporation of H2O from Pure Ice in the Range 173–223 K: a Quartz Crystal Microbalance Study. Phys. Chem. Chem. Phys. 6, 46654676–4676. doi:10.1039/b409995h
Delval, C., and Rossi, M. J. (2005). Influence of Monolayer Amounts of HNO3 on the Evaporation Rate of H2O over Ice in the Range 179 to 208 K: A Quartz Crystal Microbalance Study. J. Phys. Chem. A 109, 7151–7165. doi:10.1021/jp0505072
Delval, C., and Rossi, M. J. (2018). The Influence of HCl on the Evaporation Rates of H<sub>2</sub>O over Water Ice in the Range 188 to 210 K at Small Average Concentrations. Atmos. Chem. Phys. 18, 15903–15919. doi:10.5194/acp-18-15903-2018
Delval, C., Fluckiger, B., and Rossi, M. J. (2003). The Rate of Water Vapor Evaporation from Ice Substrates in the Presence of HCl and HBr: Implications for the Lifetime of Atmospheric Ice Particles. Atmos. Chem. Phys. 3, 1131–1145. doi:10.5194/acp-3-1131-2003
Dushman, S. (1962). Scientific Foundations of Vacuum Technique. second edition. New York London: John Wiley & Sons. pg. 20-25 (thermal molecular beams); pg. 90-100 (Clausing factor).
Fahey, D. W., and Schumann, U. (1999). in Chapter 3, Aviation-Produced Aerosols and Cloudiness, Aviation and the Global Atmosphere, A Special Report of IPCC Working Groups I and III. Editors J. Penner, D.H. Lister, D.J. Griggs, D.J. Dokken, and M. McFarland (Cambridge University Press).
Fairhurst, M. C., Ezell, M. J., and Finlayson-Pitts, B. J. (2017). Knudsen Cell Studies of the Uptake of Gaseous Ammonia and Amines onto C3-C7 Solid Dicarboxylic Acids. Phys. Chem. Chem. Phys. 19, 26296–26309. doi:10.1039/c7cp05252a
Fairhurst, M. C., Ezell, M. J., Kidd, C., Lakey, P. S. J., Shiraiwa, M., and Finlayson-Pitts, B. J. (2017a). Kinetics, Mechanisms and Ionic Liquids in the Uptake of N-Butylamine onto Low Molecular Weight Dicarboxylic Acids. Phys. Chem. Chem. Phys. 19, 4827–4839. doi:10.1039/c6cp08663b
Fenter, F. F., Caloz, F., and Rossi, M. J. (1994). Kinetics of Nitric Acid Uptake by Salt. J. Phys. Chem. 98, 9801–9810. doi:10.1021/j100090a014
Fenter, F. F., Caloz, F., and Rossi, M. J. (1997). Paper II: Simulation of Flow Conditions in Low-Pressure Flow Reactors (Knudsen Cells) Using a Monte Carlo Technique. Rev. Sci. Instrum. 68, 3180–3186. doi:10.1063/1.1148264
Flückiger, B., and Rossi, M. J. (2003). Common Precursor Mechanism for the Heterogeneous Reaction of D2O, HCl, HBr, and HOBr with Water Ice in the Range 170-230 K: Mass Accommodation Coefficients on Ice. J. Phys. Chem. A 107, 4103–4115. doi:10.1021/jp021956u
Fraser, H. J., Collings, M. P., McCoustra, M. R. S., and Williams, D. A. (2001). Thermal Desorption of Water Ice in the Interstellar Medium. Mon. Notices R. Astron. Soc. 327, 1165–1172. doi:10.1046/j.1365-8711.2001.04835.x
Golden, D. M., Spokes, G. N., and Benson, S. W. (1973). Very Low-Pressure Pyrolysis (VLPP); A Versatile Kinetic Tool. Angew. Chem. Int. Ed. Engl. 12, 534–546. doi:10.1002/anie.197305341
Golden, D. M., Rossi, M. J., Baldwin, A. C., and Barker, J. R. (1981). Infrared Multiphoton Decomposition: Photochemistry and Photophysics. Acc. Chem. Res. 14, 56–62. doi:10.1021/ar00062a005
Gregg, S. J., and Singh, K. S. W. (1982). Adsorption, Surface Area and Porosity. second edition. London San Diego New York Boston Sydney Tokyo Toronto: Academic Press, Harcourt Brace & Company, Publishers.
Hanisch, F., and Crowley, J. N. (2003a). Heterogeneous Reactivity of NO and HNO3 on Mineral Dust in the Presence of Ozone. Phys. Chem. Chem. Phys. 5, 883–887. doi:10.1039/b211503d
Hanisch, F., and Crowley, J. N. (2003b). Ozone Decomposition on Saharan Dust: an Experimental Investigation. Atmos. Chem. Phys. 3, 119–130. doi:10.5194/acp-3-119-2003
Haynes, D. R., Tro, N. J., and George, S. M. (1992). Condensation and Evaporation of Water on Ice Surfaces. J. Phys. Chem. 96, 8502–8509. doi:10.1021/j100200a055
Hildenbrand, D. L. (1968). Dissociation Energies and Chemical Bonding in the Alkaline-Earth Chlorides from Mass Spectrometric Studies. J. Chem. Phys. 48, 3657–3665. doi:10.1063/1.1669666
Iannarelli, R., and Rossi, M. J. (2014). H2O and HCl Trace Gas Kinetics on Crystalline HCl Hydrates and Amorphous HCl/H2O in the Range 170 to 205 K: the HCl/H2O Phase Diagram Revisited. Atmos. Chem. Phys. 14, 5183–5204. doi:10.5194/acp-14-5183-2014
Isono, K., and Iwai, K. (1969). Growth Mode of Ice Crystals in Air at Low Pressure. Nature 223, 1149–1150. doi:10.1038/2231149a0
Karagulian, F., and Rossi, M. J. (2007). Heterogeneous Chemistry of the NO3 Free Radical and N2O5 on Decane Flame Soot at Ambient Temperature: Reaction Products and Kinetics. J. Phys. Chem. A 111, 1914–1926. doi:10.1021/jp0670891
Koros, R. M., Deckers, J. M., Andres, R. P., and Boudart, M. (1966). The Sticking Probability of Water on Ice. Chem. Eng. Sci. 21, 941–950. doi:10.1016/0009-2509(66)85088-1
Lu, H., McCartney, S. A., Chonde, M., Smyla, D., and Sadtchenko, V. (2006). Fast Thermal Desorption Spectroscopy Study of Morphology and Vaporization Kinetics of Polycrystalline Ice Films. J. Chem. Phys. 125, 044709. doi:10.1063/1.2212395
Magee, N., Moyle, A. M., and Lamb, D. (2006). Experimental Determination of the Deposition Coefficient of Small Cirrus-Like Ice Crystals Near −50°C. Geophys. Res. Lett. 33, L17813. doi:10.1029/2006gl026665
Mirghaffari, N., Iannarelli, R., Ludwig, C., and Rossi, M. J. (2021). Coexistence of Reactive Functional Groups at the Interface of a Powdered Activated Amorphous Carbon: A Molecular View. Mol. Phys. 119 (17-18), e1966110. doi:10.1080/00268976.2021.1966110
Mochida, M., Hirokawa, J., Kajii, Y., and Akimoto, H. (1998). Heterogeneous Reactions of Cl2 with Sea Salts at Ambient Temperature: Implications for Halogen Exchange in the Atmosphere. Geophys. Res. Lett. 25, 3927–3930. doi:10.1029/1998gl900100
Popovicheva, O. B., Kireeva, E. D., Shonija, N. K., and Khokhlova, T. D. (2009). Water Interaction with Laboratory-Simulated Fossil Fuel Combustin Particles. J. Phys. Chem. A 113, 10503–10511. doi:10.1021/jp905522s
Pratte, P., van den Bergh, H., and Rossi, M. J. (2006). The Kinetics of H2O Vapor Condensation and Evaporation on Different Types of Ice in the Range 130-210 K. J. Phys. Chem. A 110, 3042–3058. doi:10.1021/jp053974s
Robertson, R. M., Golden, D. M., and Rossi, M. J. (1988). Reaction Probability for the Spontaneous Etching of Silicon by CF3 Free Radicals. J. Vac. Sci. Technol. B 6, 1632–1640. doi:10.1116/1.584421
Ross, J. (1966). Molecular Beams, Volume 10 of Advances in Chemical Physics. New York-London-Sydney: Interscience Publishers John Wiley & Sons.
Rossi, M. J., Barker, J. R., and Golden, D. M. (1979a). Infrared Multiphoton Generation of Radicals: A New Technique for Obtaining Absolute Rate Constants. Application to Reactions of CF3. J. Chem. Phys. 71, 3722–3727. doi:10.1063/1.438828
Rossi, M., King, K. D., and Golden, D. M. (1979b). The Equilibrium Constant and Rate Constant for Allyl Recombination in the Gas Phase. J. Am. Chem. Soc. 101, 1223–1230. doi:10.1021/ja00499a029
Sadtchenko, V., Brindza, M., Chonde, M., Palmore, B., and Eom, R. (2004). The Vaporization Rate of Ice at Temperatures Near its Melting Point. J. Chem. Phys. 121, 11980–11992. doi:10.1063/1.1817820
Sauvain, J.-J., and Rossi, M. J. (2016). Quantitative Aspects of the Interfacial Catalytic Oxidation of Dithiothreitol by Dissolved Oxygen in the Presence of Carbon Nanoparticles. Environ. Sci. Technol. 50, 996–1004. doi:10.1021/acs.est.5b04958
Seisel, S., Lian, Y., Keil, T., Trukhin, M. E., and Zellner, R. (2004). Kinetics of the Interaction of Water Vapour with Mineral Dust and Soot Surfaces at T = 298 K. Phys. Chem. Chem. Phys. 6, 1926–1932. doi:10.1039/b314568a
Seisel, S., Börensen, C., Vogt, R., and Zellner, R. (2004a). The Heterogeneous Reaction of HNO3 on Mineral Dust and γ-alumina Surfaces: a Combined Knudsen Cell and DRIFTS Study. Phys. Chem. Chem. Phys. 6, 5498–5508. doi:10.1039/b410793d
Seisel, S., Keil, T., Lian, Y., and Zellner, R. (2006). Kinetics of the Uptake of SO2 on Mineral Oxides: Improved Initial Uptake Coefficients at 298 K from Pulsed Knudsen Cell Experiments. Int. J. Chem. Kinet. 38, 242–249. doi:10.1002/kin.20148
Setyan, A., Sauvain, J.-J., and Rossi, M. J. (2009). The Use of Heterogeneous Chemistry for the Characterization of Functional Groups at the Gas/particle Interface of Soot and TiO2 Nanoparticles. Phys. Chem. Chem. Phys. 11, 6205–6217. doi:10.1039/b902509j
Setyan, A., Sauvain, J. J., Guillemin, M., Riediker, M., Demirdjian, B., and Rossi, M. J. (2010). Probing Functional Groups at the Gas–Aerosol Interface Using Heterogeneous Titration Reactions: A Tool for Predicting Aerosol Health Effects? ChemPhysChem 11, 3823–3835. doi:10.1002/cphc.201000490
Smith, J. A., Livingston, F. E., and George, S. M. (2003). Isothermal Desorption Kinetics of Crystalline H2O, H218O, and D2O Ice Multilayers. J. Phys. Chem. B 107, 3871–3877. doi:10.1021/jp022503s
Speedy, R. J., Debenedetti, P. G., Smith, R. S., Huang, C., and Kay, B. D. (1976). The Evaporation Rate, Free Energy, and Entropy of Amorphous Water at 150 K. J. Chem. Phys. 105, 240–244.
Stein, S., Benson, S. W., and Golden, D. M. (1976). Very Low-Pressure Pyrolysis (VLPP) of Hydrazine, Ethanol, and Formic Acid on Fused Silica. J. Catal. 44, 429–438. doi:10.1016/0021-9517(76)90420-6
Tabor, K., Gutzwiller, L., and Rossi, M. J. (1994). Heterogeneous Chemical Kinetics of NO2 on Amorphous Carbon at Ambient Temperature. J. Phys. Chem. 98, 6172–6186. doi:10.1021/j100075a021
Tapia, A., Salgado, M. S., Martín, M. P., Lapuerta, M., Rodríguez-Fernández, J., Rossi, M. J., et al. (2016). Molecular Characterization of the Gas-Particle Interface of Soot from Diesel Engine Using a Titration Method. Environ. Sci. Technol. 50, 2946–2955. doi:10.1021/acs.est.5b05531
Tapia, A., Salgado, S., Martín, P., Villanueva, F., García-Contreras, R., and Cabañas, B. (2018). Chemical Composition and Heterogeneous Reactivity of Soot Generated in the Combustion of Diesel and GTL (Gas-to-Liquid) Fuels and Amorphous Carbon Printex U with NO2 and CF3COOH Gases. Atmos. Environ. 177, 214–221. doi:10.1016/j.atmosenv.2018.01.028
Underwood, G. M., Li, P., Usher, C. R., and Grassian, V. H. (2000). Determining Accurate Kinetic Parameters of Potentially Important Heterogeneous Atmospheric Reactions on Solid Particle Surfaces with a Knudsen Cell Reactor. J. Phys. Chem. A 104, 819–829. doi:10.1021/jp9930292
Usher, C. R., Al-Hosney, H., Carlos-Cuellar, S., and Grassian, V. H. (2002). A Laboratory Study of the Heterogeneous Uptake and Oxidation of Sulfur Dioxide on Mineral Dust Particles. J.-Geophys.-Res. 107, 164713–164721. doi:10.1029/2002JD002051
Valavanidis, A., Iliopoulos, N., Gotsis, G., and Fiotakis, K. (2008). Persistent Free Radicals, Heavy Metals and PAHs Generated in Particulate Soot Emissions and Residue Ash from Controlled Combustion of Common Types of Plastic. J. Hazard. Mater. 156, 277–284. doi:10.1016/j.jhazmat.2007.12.019
Wagman, D. D., Evans, W. H., Parker, V. B., Schumm, R. H., Halow, I., Bailey, S. M., et al. (1982). The NBS Tables of Chemical Thermodynamic Properties. Selected Values for Inorganic and C1 and C2 Organic Substances in SI Units. J. Phys. Chem. Ref. Data 11 (Suppl. No. 2).
Wagner, C., Hanisch, F., Holmes, N., de Coninck, H., Schuster, G., and Crowley, J. N. (2008). The Interaction of N2O5 with Mineral Dust: Aerosol Flow Tube and Knudsen Reactor Studies. Atmos. Chem. Phys. 8, 91–109. doi:10.5194/acp-8-91-2008
Glossary
ATD C(oarse) Arizona Test Dust Coarse fraction
BET Brunauer-Emmett-Teller adsorption isotherm
CFCMS Carbon Fiber Composite Molecular Sieve
CWFT Coated-Wall Flow Tube
ELM Total Electrometer MS Signal
EPFR Environmentally Persistent Free Radical
FTIR Fourier Transform IR spectrometer
GTL Gas-To-Liquid (fuels)
GTS-80, GTS-6 Graphite Thermal Soot
HA Hydroxyl Amine NH2OH
HOMBIKAT TiO2 TiO2 pigment Cu2+ doped (impregnated) Sachtleben Chemie
HVO Hydrotreated Vegetable Oil
IN Ice Nuclei or Ice Nucleation
KEMS Knudsen Effusion Mass Spectrometry
KFR Knudsen Flow Reactor
LIA Lock-In Amplifier
MS Mass Spectrometry or mass spectrometric
PAC Processed Amorphous Carbon
Printex U, Printex XE-2B Amorphous Carbon Products (DEGUSSA, Evonics Inc., Hanau)
PSC Polar Stratospheric Clouds
QCMB Quartz Crystal Micro Balance
QMA Quadrupole Mass Analyzer
RCAST Research Center f. Advanced Science & Technology (U Tokyo)
REMPI Resonance-Enhanced Multiphoton Ionization
SC Sample Compartment
SEM Secondary Electron Multiplier
SFR Stirred Flow Reactor
TEA Transversely Excited Atmospheric CO2 laser
TFA TriFluoroAcetic Acid CF3COOH
TMA TriMethyl Amine N(CH3)3
TROPOS Leibniz Institute of Tropospheric Research (Leipzig, Germany)
UCLM University of Castilla La Mancha (Ciudad Real, Spain)
VLPP Very Low-Pressure
Keywords: KFR, chemical kinetics, heterogeneous chemistry, reaction mechanism, mineral dust, amorphous carbon
Citation: Iannarelli R, Ludwig C and Rossi MJ (2022) Flowing Gas Experiments Reveal Mechanistic Details of Interfacial Reactions on a Molecular Level at Knudsen Flow Conditions. Front. Astron. Space Sci. 9:891177. doi: 10.3389/fspas.2022.891177
Received: 07 March 2022; Accepted: 29 April 2022;
Published: 23 June 2022.
Edited by:
Alexander Rosu-Finsen, University College London, United KingdomReviewed by:
Denis Petitprez, Université de Lille, FranceMartin Robert Stewart McCoustra, Heriot-Watt University, United Kingdom
Copyright © 2022 Iannarelli, Ludwig and Rossi. This is an open-access article distributed under the terms of the Creative Commons Attribution License (CC BY). The use, distribution or reproduction in other forums is permitted, provided the original author(s) and the copyright owner(s) are credited and that the original publication in this journal is cited, in accordance with accepted academic practice. No use, distribution or reproduction is permitted which does not comply with these terms.
*Correspondence: Michel J. Rossi, michel.rossi@epfl.ch