The Tian Ma 65-m Telescope Automatic Early Warning System
 Shang-Guan Wei-Hua
 Zhao Rong-Bing1*
 - 1Shanghai Astronomical Observatory, Chinese Academy of Sciences, Shanghai, China
- 2University of Chinese Academy of Sciences, Beijing, China
- 3Xi’an University of Posts and Telecommunications, Xi’an, China
The Tian Ma Radio Telescope (TMRT), which is mainly used for deep space exploration and radio astronomy observations, is the largest fully steerable radio telescope in Asia. For promoting the automation of the telescope, an automatic early warning system is designed and implemented. The system can conveniently aggregate heterogeneous sensor data, make use of established strategies to implement an alert system, and send real-time alarms through multiple channels, which is helpful to promote unmanned operation. In addition, we adopt DevOps (a compound of development (Dev) and operations (Ops) which means end-to-end automation in software development and delivery) to simplify the development, upgrading, and maintenance of the telescope automatic early warning system.
1 Introduction
The Tian Ma Radio Telescope (TMRT) in Shanghai has a primary reflector of 65 m diameter with a shaped Cassegrain configuration. It has advanced equipment such as an active surface control system, an 8-band low-noise receiver system covering 1–50 GHz, VLBI high-speed data acquisition systems, and high-stability hydrogen atomic clocks. It is available for deep space exploration tasks such as orbit determination, for radio astronomy single-dish and Very Long Baseline Interferometry (VLBI) observations, and for geodetic VLBI observations. The TMRT has already achieved many of its engineering goals and, as a result, has provided many world-class scientific results. First, the TMRT, as a powerful unit of the Chinese VLBI Network (CVN), has undertaken many deep space exploration tasks, such as VLBI observations in the Chang’e-3 orbit determination (Liu et al., 2015). Second, the TMRT conducts many astronomical observations for scientific research purposes. Its operating frequency range covers many important astronomical spectrum lines, such as NH3, CCS, and HC3N (Xie J et al., 2021; Zhang et al., 2021). Pulsars are also important targets of the TMRT, such as the comprehensive pulse profile study of 71 pulsars (Zhao R.-S et al., 2019). Third, the TMRT also carries out many geodetic VLBI observations. For example, the TMRT, as one component of the International VLBI Service for Geodesy and Astrometry (IVS) network stations, participated in six IVS sessions in 2019 and 2020 (Xie B et al., 2021).
To meet the above mentioned scientific and engineering goals, the TMRT has been operating for almost 24 h a day. Manpower on 24-h shifts is a direct way to monitor the operation of the TMRT, but with the progress of science and technology, more and more stations have researched and applied remote and autonomous operations and status monitoring (Neidhardt, 2017). More remote control software are also being developed for telescopes, such as Client Graphics User Interface Library Tools (CGLT), E-control, and Jmonan (Neidhardt et al., 2010; Ruztort et al., 2012; Zhao D et al., 2019). The remote and autonomous control software is also applied to the TMRT.
The Tian Ma 65-m Telescope Automatic Early Warning System (TAEWS) can provide a safety guarantee for the TMRT during autonomous operations through real-time operational status early warning detection for the TMRT. Currently, we have placed some sensors in different locations of the telescope. The TAEWS aggregates these heterogeneous sensor data and then detects in real time whether the TMRT is operating beyond the preset alarm values. It uses push notifications and alert notifications will be sent through multiple channels in case of abnormalities. Engineers can also download historical data from the system after the event to analyze the cause of the error in the TMRT.
Next, we will introduce the four parts of the TAEWS: Section 2) The monitoring items of the TMRT; Section 3) Aggregation of heterogeneous data; Section 4) Data visualization, detection and alarm; Section 5) Application of DevOps (a compound of development (Dev), and operations (Ops) meaning end-to-end automation in software development and delivery) in the system.
2 The Monitoring Items of the TMRT
At present, the monitoring items supported by the system mainly include motor current detection, antenna rotation detection, bearing stress detection, and antenna mechanical structure problem detection. As shown in Figure 1, sensors, which include vibration sensors, temperature sensors, stress sensors, and ranging sensors, are distributed in different locations on the antenna. Each of them will be described next.
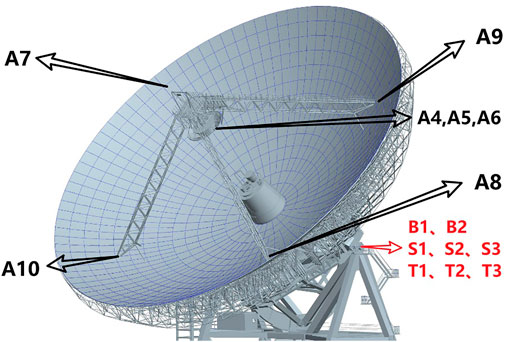
FIGURE 1. Figure shows the model diagram of the TMRT. The black text “A” marks the vibration sensor position, the red “B” marks the range sensor position, the red “S” marks the stress sensor position, the red “T” marks the temperature sensor position. And the numbers are their numbers, such as “A1” means vibration sensor number 1.
The TMRT weighs about 2,700 tons and the weight of its reflector is mainly borne by bearings. As shown in Figure 1, stress sensors, temperature sensors, and distance sensors are added to the bearing end. These sensors detect stress changes in the reflector to the bearing. The TMRT has eight azimuth (AZ) rotation motors and four elevation axis rotation motors. The rotation of the antenna is driven by a motor, which detects changes in motor current when the motor is driving to determine if there is any abnormal resistance during operation. Each motor of the TMRT is equipped with at least one current sensor. Besides this, the rotation speed and acceleration of the AZ and pitch axes can also be detected. When observing at higher frequencies, the vibration caused by the servo drive systems will be significant, so we have placed vibration sensors at the primary reflector, sub-reflector, and feeder (Brandt, 2000). We can detect whether there is any problem with the mechanical structure of the antenna and if the servo control is normal.
To enable an early warning for the above-mentioned detection items (sensors), we have designed the TAEWS. The structure diagram of this system is shown in Figure 2. As shown in the structure diagram, the TAEWS is divided into three parts: the environment, the services, and the user interface. We deploy the services part on the Docker Engine1 (environment part), which facilitates our development using DevOps. The details of DevOps will be introduced in Section 5. The services in the structure diagram include Data Sampler, Influxdb2, Telegraf3, Grafana4, Grafana-Images-Renderer5, Portainer6, and source code management software.
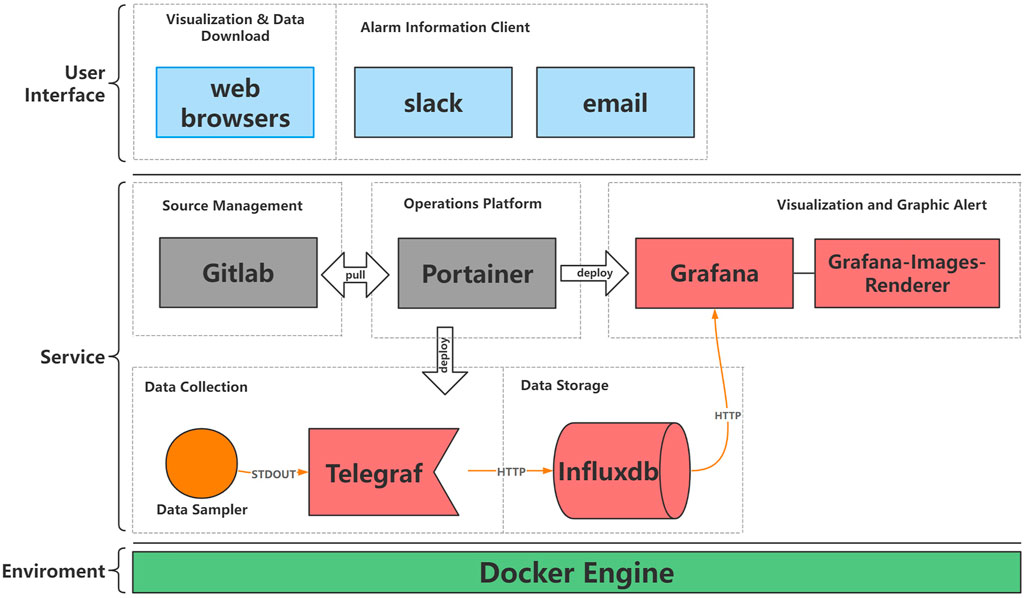
FIGURE 2. Figure shows that the architecture of the TAEWS is divided into three parts: environment, services, and user interface. All services of the TAEWS are deployed on the Docker Engine. Services mainly include Data Sampler, Telegraf, Influxdb, Grafana, Grafana-Images-Renderer, Portainer, and GitLab. Data Sampler and Telegraf are used for data collection, Influxdb for the time-series database, Portainer for container deployment, GitLab for source code management, Grafana and Grafana Render for visualization and graphic alert. User interfaces include web browsers, Slack, and email. Users can access visualization pages through browsers and push alerts through email, Slack, etc.
Data Sampler is used to collect data from the sensor software and hardware and print it out on the system console in a comma separated value (CSV) format.
Influxdb is a time-series database for storing sensor data. The use of a time-series database will also optimize our storage of time-stamped sensor data.
Telegraf is used to store Data Sampler output sensor data to the Influxdb database and to keep the Data Sampler service running. For example, when the sensor network is disconnected, the Data Sampler may crash and exit. But the Telegraf will restart the Data Sampler by timed attempts, and we set the time interval to 1 min. So, after the sensor network is restored, the Data Sampler will also be restored after 1 minute.
Grafana provides visualization, monitoring, and alerting capabilities primarily for data in Influxdb. We have designed panels to visualize the values of the sensors on the TMRT, as detailed in Section 4.
Grafana-Images-Renderer is used to help Grafana improve the alert messages by replacing the values in the alert emails with screenshots of the visualization panels. The pictures of the visualization panel will be more useful for engineers and observers to understand the situation than the alarm values.
Portainer is the service management platform of the TAEWS. As a service management tool, Portainer makes it convenient to deploy services, create services, edit service configurations, and view service status.
GitLab7 is used to manage service orchestration code and the data sampler code, and to implement DevOps. More details are provided in Section 5.
The main TAEWS user interfaces are through Slack8, email, and a web browser. Engineers and observers can receive alert messages from Grafana via Slack and email. They have cross-platform access to real-time graphs of sensor data on Grafana via a web browser.
3 Aggregation of Heterogeneous Data
Next, we need to aggregate the data from these sensors. Each sensor is equipped with a Data Sampler, a Telegraf, and an Influxdb service called the Telegraf-Influxdb data stream. The Telegraf-Influxdb data stream structure is used to implement persistent sensor data collection: the Data Sampler collects sensor data and prints it to Telegraf in CSV format, and Telegraf writes the collected data to Influxdb. The data transfer differences of the heterogeneous sensors are solved by different Data Samplers. Since the Telegraf-Influxdb data stream structure is based on Telegraf and Influxdb, only the Data Sampler is programmed.
First, the communication interface, data sampling rate, and data format of heterogeneous sensors may be different. Some manufacturers of sensors on the TMRT have customized communication interface standards specific to their sensors, which may require us to use the manufacturer’s software, protocols, development languages, or dependency packages. For example, the bearing sensors on the TMRT use a customized Modbus protocol that cannot be communicated with directly by existing open-source tools. The data storage format of the vibration sensor REFTEK130 on the TMRT is PAS. The python library ObsPy (Beyreuther et al., 2010) and the commercial software of Reftek Systems Inc. are the only tools found that can decode the PAS format.
Transferring data to Telegraf via a standard output stream is a convenient way to solve the problem. First, the Data Sampler outputs data to the system in CSV format. Second, Telegraf calls the Data Sampler program through a child process and gathers the system output stream from the child process. Since the programming language can be printed, there are many programming language options for The Data Sampler. This helps to cope with sensor hardware and software interfaces from various vendors compared to a single programming language. And because Telegraf can cache data and maintain the data sampler, the data sampler basically just converts the data transferred from the sensor hardware or software into CSV format and prints it to the system console.
Second, since telescope anomaly monitoring is still under research, we need to ensure that the system is scalable, i.e., that it is compatible with adding new detections but also with removing the old ones. Therefore, we make each sensor’s Data Sampler and Telegraf into a container, which makes the Data Sampler highly cohesive with the sensor, and coupling with the database is resolved through Telegraf. The data collection container is connected to the database, ensuring that there is no dependency between Data Samplers.
4 Data Visualization, Detection, and Alerts
The user interface of Grafana allows for customized visual charts, customized alert rules, and customized message channels. Figure 3 shows some graphs we designed. For example (E) in Figure 3 is used to visualize the AZ acceleration of the TMRT. The maximum and minimum values of the AZ acceleration are shown at the bottom of the graph. While sensor data is continuously recorded through the Telegraf-Influxdb data stream structure, Grafana can provide real-time visualization capabilities and real-time alerting capabilities for telescope status. For example, we visualize the elevation angle of the antenna, and then set the alert rule to notify the TMRT observer when the antenna elevation angle is below 20° for 10 min.
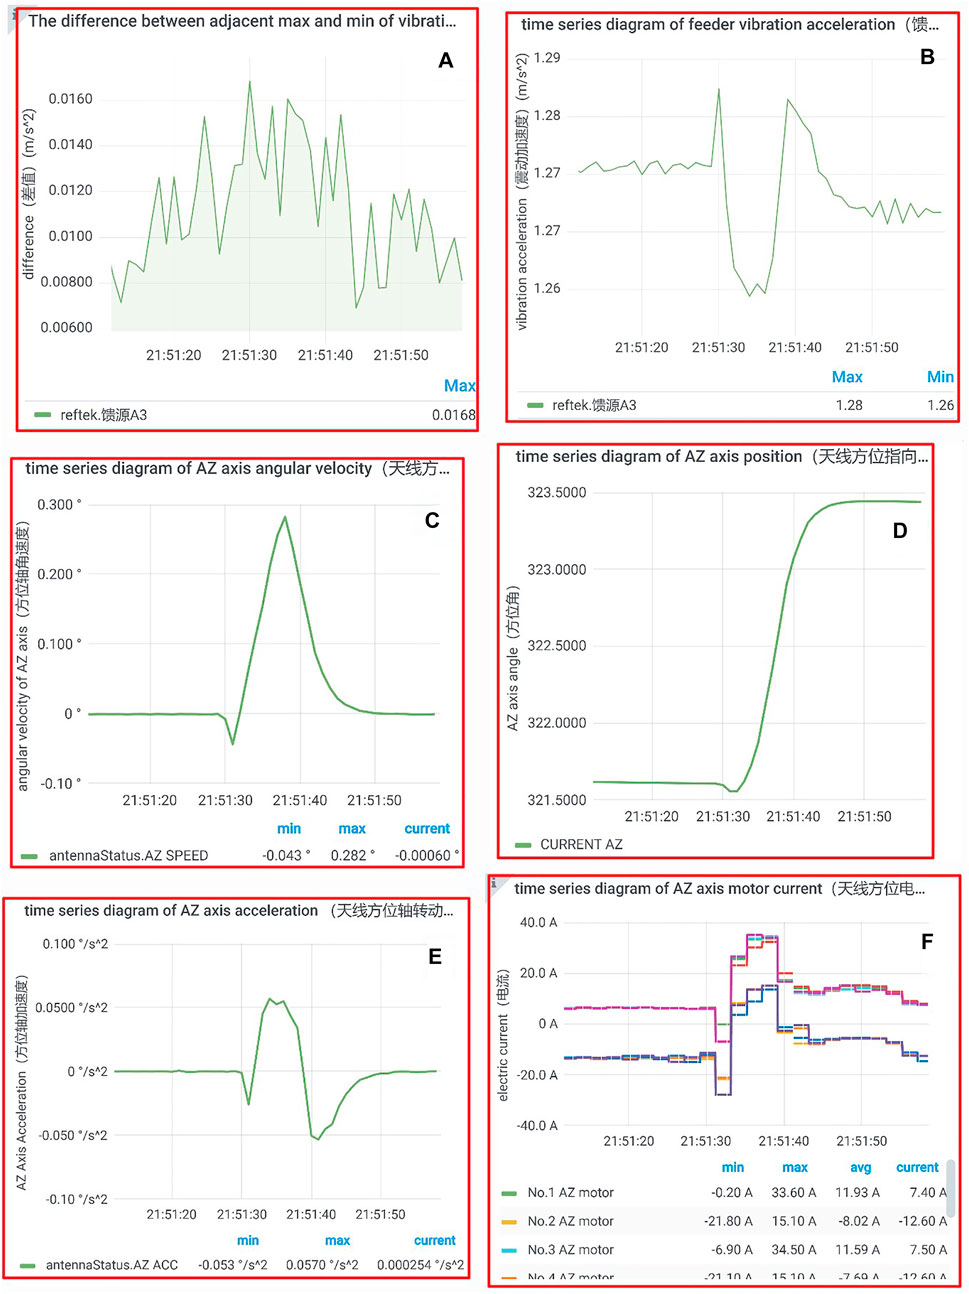
FIGURE 3. This is a visualization page in TAEWS. (A) is the difference between adjacent max and min of vibration acceleration, (B) is the time-series diagram of feeder vibration acceleration, (C) is the time-series diagram of AZ axis angular velocity, (D) is the time-series diagram of AZ axis position, (E) is the time-series diagram of AZ axis acceleration, (F) is the time-series diagram of AZ axis motor current.
In Figure 3, we can see that the values include antenna rotation speed, antenna pointing position, antenna rotation acceleration, antenna motor current, antenna bearing stress, and antenna vibration acceleration. Changing the step size to adjust the time interval at which the data is displayed makes it easier to understand long-term changes and short-term changes in the data. Note that the minimum time interval of the data displayed by the Grafana is limited by the sampling rate of the data print from the data sampler. Grafana also supports downloading data directly from charts.
If an alarm occurs, a red alarm line will appear on its chart, as shown in Figure 4. At present, the alarm of TMRT mainly uses simple and complex threshold values to set a reasonable interval for necessary data items for real-time monitoring. When the value exceeds the interval, the system will alert the message. The simple thresholds are set based on unprocessed data. For example, through the experience of daily maintenance, we set the upper limit of the AZ voltage value as 70A, and when the voltage exceeds the range, abnormal marks will appear, as shown in Figure 4. The complex thresholds are set by performing some simple operations on the data. For example, the threshold for vibration monitoring is the adjacent difference and standard deviation of normalized vibration data. The mail alert, shown in Figure 5, is a practical example of adjacent differences.
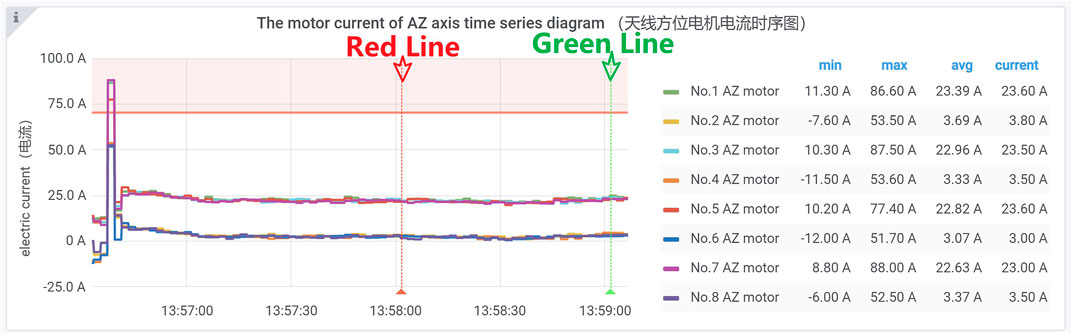
FIGURE 4. This is a sample timing diagram for an antenna AZ motor current alarm. In the figure, the motor current curve has broken through the red alarm area above, and then Grafana will mark 13:58:00 with a red line, which shows that there was a voltage anomaly within 2 minutes. The green line at 13:59:00 shows that the abnormality did not appear after the time point marked by the red line.
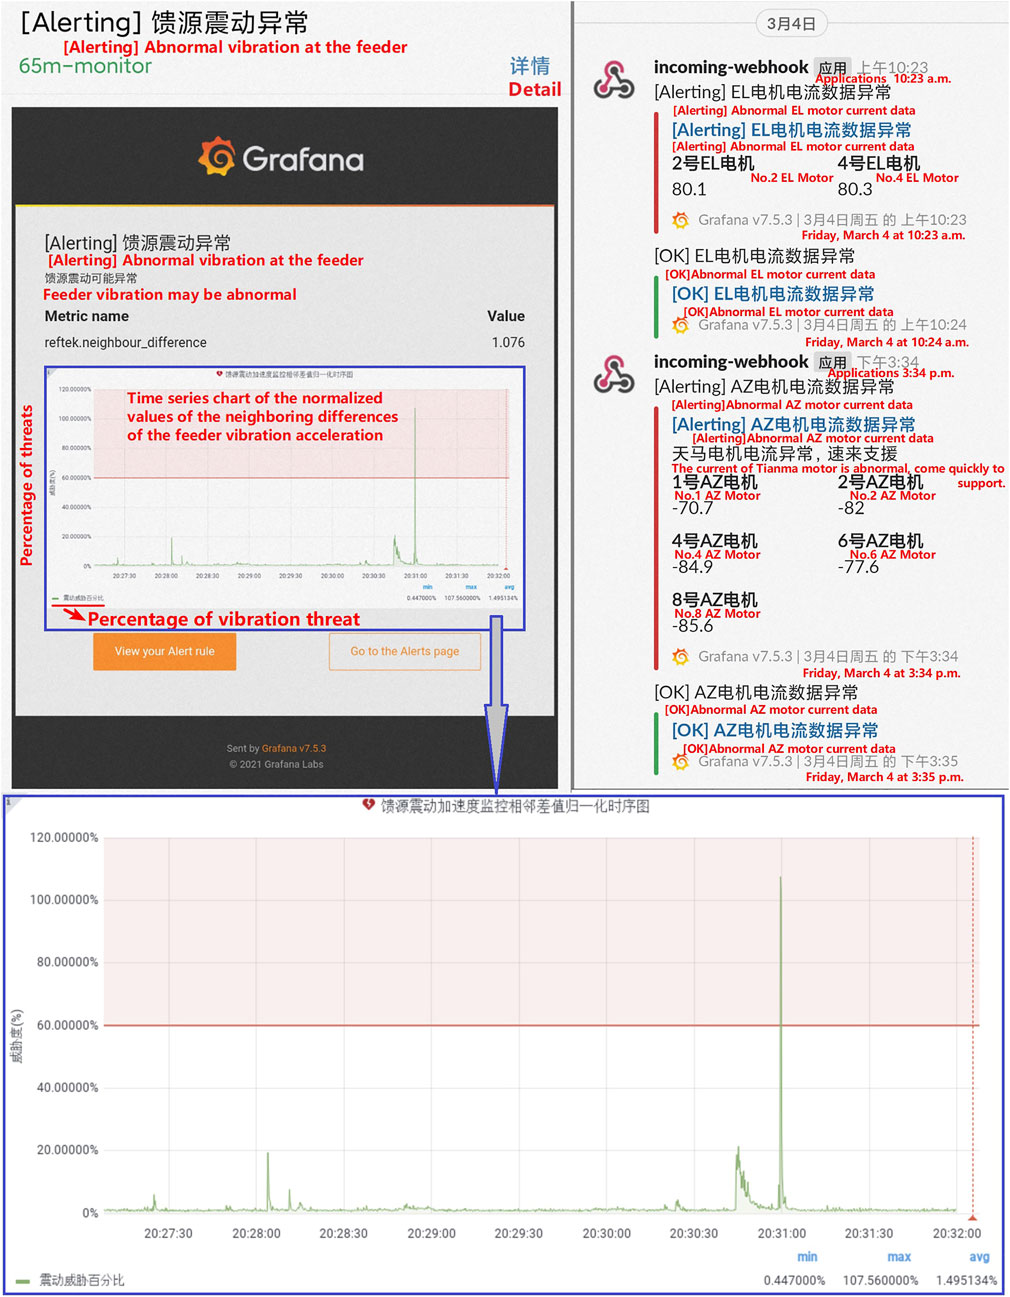
FIGURE 5. This is a screenshot of the system alert push message. The top-left part is the email message interface, which includes alert values, alert items, value charts, and some alert messages. The bottom half of the figure, which is marked ‘C’, is a chart detailing the data for this alert. The top-right part is the message interface on the Slack app, which includes alert values, alert items, and some alert messages. The marker “A” and marker “B” are examples of TMRT alerts.
As shown in Figure 5, if an alert subscription is set, a push message will be sent through Slack and email. First, a time-series graph is added to the email alert message. The original alert email message has only anomalous data values, which is what the email section in Figure 5 looks like without the time-series graph in the blue box. The Grafana-Images-Renderer service is used to draw Grafana graphs and export them as PNG format images, which Grafana then uses to draw time-series data charts to add to the emails. Next, in order for the time-series graph to show the situation before and after the occurrence of the alarm, we postpone the alarm time backward with an acceptable delay. As in Figure 5, the values that exceed the red alert area are located 1 min before.
5 DevOps in TAEWS
DevOps speeds the delivery of higher quality software by combining and automating the work of software development and IT operations teams. As shown in Figure 6, We apply the DevOps method to development in the Docker environment to further improve the speed of software iteration and the convenience of service deployment.
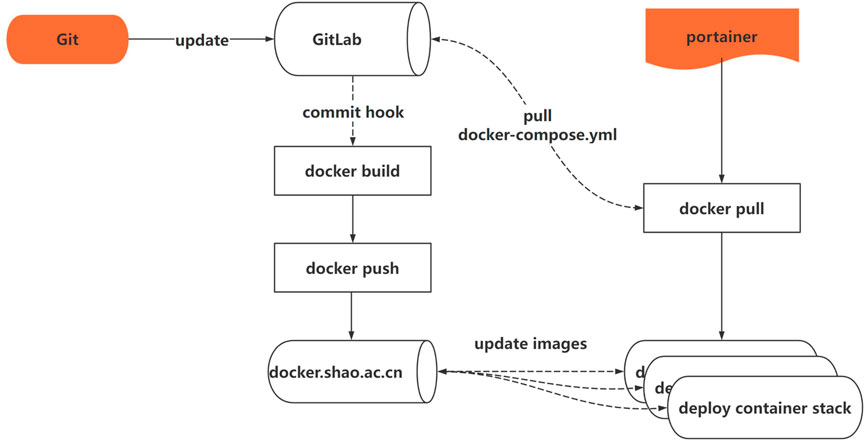
FIGURE 6. We use Git to update code to the source code management platform such as GitLab, then the platform performs container building, container pushing, and so on through hooks. Later, Portainer automatically pulls the latest service image through the container registry.
During the development of TAEWS, GitLab manages two types of projects. The first type is the Data Sampler code. The Data Sampler projects include the dockerfile code used to build containers. When the code is submitted to the code management platform, the Data Sampler container is automatically built and submitted to shao. docker.ac.cn, a private container image repository on the intranet. The second type is the TAEWS container orchestration code. This code is mainly the “docker-compose.yml” file and some environment variable files. The environment variable files record the environment variable settings needed for each service. For example, the name of the database such as “vibration_data”. The “docker-compose.yml” file is used for the Portainer to deploy containers. For example, the Grafana container maps port 3,000 inside the container to port 80 on the host. The Portainer automatically pulls the required images from docker. shao.ac.cn and deploys the TAEWS on the Docker engine. These approaches enable the continuous integration of the system, which facilitates the development of the system.
In addition to using the Portainer to create and deploy services, we also use the Portainer to complete the maintenance of the services. In Figure 7, we can clearly see the port status, creation time, and running state of each container. The Quick Actions allow the user to debug and monitor services. For example, we check the current CPU usage of the container image repository, as in part A of Figure 7. We may also need to open the container’s terminal to execute some commands. For example, part B of Figure 7 to see if the name configuration of the database is normal.
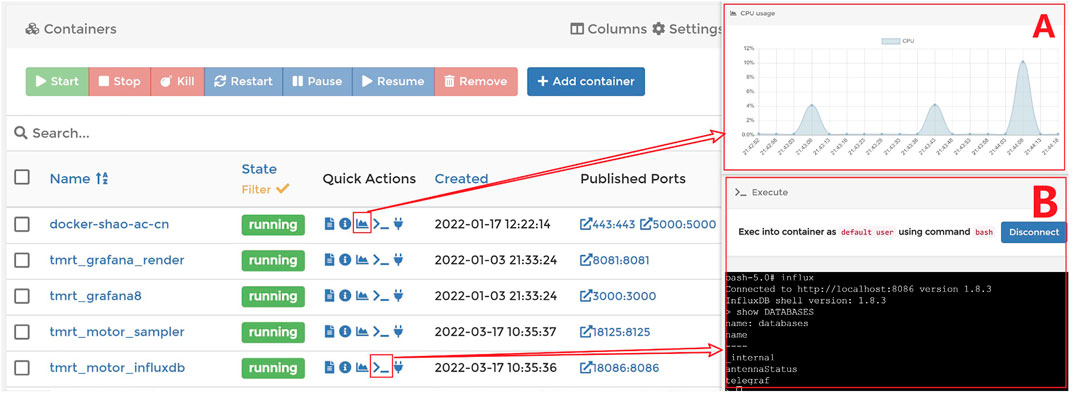
FIGURE 7. This is an example of using the Portainer to manage the TAEWS system. The information of all the services, such as current running status, creation time, and port occupancy, is clearly visible on the page, and operations such as logging, terminal, and status view are available in the Quick Actions column.
6 Conclusion
As an automatic and real-time early warning detection system for the TMRT, the TAEWS achieves the abnormal condition detection of electromechanical current, antenna rotation, bearing stress, and antenna mechanical structure. It implements persistent storage of heterogeneous sensor data, monitoring of threshold rules for the sensor data, and notification of exception messages. We also briefly describe the containerization and DevOps applications of this system, describing the ability to iterate quickly with a small amount of coding. In the future, with the increase of detection items and the improvement of anomaly detection methods, the automatic warning system of the TMRT will be gradually improved.
Data Availability Statement
The original contributions presented in the study are included in the article/Supplementary Material; further inquiries can be directed to the corresponding author.
Author Contributions
SW-H: conceptualization, methodology, software, project administration, investigation, formal analysis, validation, and writing—original draft; ZR-B: conceptualization, funding acquisition, resources, supervision, and writing—review and editing; ZD: software and writing—original draft; and ZC-Y: visualization and investigation.
Funding
This work was supported by the National SKA Program of China, No. 2020SKA0120104.
Conflict of Interest
The authors declare that the research was conducted in the absence of any commercial or financial relationships that could be construed as a potential conflict of interest.
Publisher’s Note
All claims expressed in this article are solely those of the authors and do not necessarily represent those of their affiliated organizations, or those of the publisher, the editors, and the reviewers. Any product that may be evaluated in this article, or claim that may be made by its manufacturer, is not guaranteed or endorsed by the publisher.
Footnotes
1Docker Inc. (2020). Docker Engine overview. https://docs.docker.com/engine/[Accessed 29 May 2022].
2InfluxData. (2022). InfluxDB. https://github.com/influxdata/influxdb [Accessed 29 May 2022].
3InfluxData. (2022). Telegraf. https://github.com/influxdata/telegraf [Accessed 29 May 2022].
4Grafana Labs. (2022). Grafana. https://github.com/grafana/grafana [Accessed 29 May 2022].
5Grafana Labs. (2022). grafana-image-renderer. https://github.com/grafana/grafana-image-renderer [Accessed 29 May 2022].
6Portainer.io. (2022). Portainer. https://github.com/portainer/portainer [Accessed 29 May 2022].
7GitLab B.V. (2021). GitLab. https://gitlab.com/gitlab-org/gitlab [Accessed 29 May 2022].
8Slack Technologies, LLC, Salesforce. (2022). Where Work Happens. https://slack.com/[Accessed 29 May 2022].
References
Beyreuther, M., Barsch, R., Krischer, L., Megies, T., Behr, Y., and Wassermann, J. (2010). ObsPy: A Python Toolbox for Seismology. Seismol. Res. Lett. 81 (3), 530–533. doi:10.1785/gssrl.81.3.530
Brandt, J. J. (2000). “Controlling the Green Bank Telescope,” in Advanced Telescope and Instrumentation Control Software. Advanced Telescope and Instrumentation Control Software, Proc (Munich, Germany: SPIE 4009), 96–108. doi:10.1117/12.388381
Liu, Q., Li, P., Zheng, X., Wu, Y., and He, Q. (2015). Analysis of VLBI Observation for Tianma Radio Telescope in Chang'E-3 Orbit Determination. Sci. Sin.-Phys. Mech. Astron. 45 (3), 039501. doi:10.1360/sspma2014-00323
Neidhardt, A., Ettl, M., Rottmann, H., Plotz, C., Muhlbauer, M., Hase, H., et al. (2010). “E-Control: First Public Release of Remote Control Software for VLBI Telescopes,” in International VLBI Service for Geodesy and Astrometry 2010 General Meeting Proceedings, 8 Jun. 2021, 439–443. Available at: http://ivscc.gsfc.nasa.gov/publications/gm2010/neidhardt2.pdf.
Neidhardt, A. N. J. (2017). “Applied Computer Science for GGOS Observatories,” in Applied Computer Science for GGOS Observatories: Communication, Coordination and Automation of Future Geodetic Infrastructures (Cham: Springer International Publishing (Springer Textbooks in Earth Sciences, Geography and Environment), 1–12. doi:10.1007/978-3-319-40139-3
Ruztort, C., Hase, H., Zapata, O., and Pedreros Bustos, F. (2012). “Remote Control and Monitoring of VLBI Experiments by Smartphones,” in International VLBI Service for Geodesy and Astrometry 2012 General Meeting Proceedings, 8 Jun. 2021, 286–290. Available at: http://ivscc.gsfc.nasa.gov/publications/gm2012/Herrera.pdf.
Xia, B., Liu, Q., and Shen, Z. (2021). Shanghai Station Report for 2019-2020. [online] Available at: https://ivscc.gsfc.nasa.gov/publications/br2019+2020/nsshao.pdf (Accessed Jun 8, 2022).
Xie, J., Fuller, G. A., Li, D., Chen, L., Ren, Z., Wu, J., et al. (2021). The TMRT K Band Observations towards 26 Infrared Dark Clouds: NH3, CCS, and HC3N. Sci. China Phys. Mech. Astron. 64 (7), 279511. doi:10.1007/s11433-021-1695-0
Zhang, C., Wu, Y., Liu, X.-C., Tang, M., Li, D., Esimbek, J., et al. (2021). Carbon-chain Molecule Survey toward Four Low-Mass Molecular Outflow Sources. A&A 648, A83. doi:10.1051/0004-6361/202039110
Zhao, D., Zhao, R., Jiang, Y., Li, J., Liu, C., and Zhang, H. (2019). “The 13-Meter Radio Telescope Monitor and Control Software,” in Advances in Computational Science and Computing. Editors N. Xiong, Z. Xiao, Z. Tong, J. Du, L. Wang, and M. Li (Cham: Springer International Publishing (Advances in Intelligent Systems and Computing), 37–44. doi:10.1007/978-3-030-02116-0_5
Keywords: TMRT, automation, real-time alarms, DevOps, automatic early-warning system
Citation: Wei-Hua S-G, Rong-Bing Z, Dong Z and Chu Yuan Z (2022) The Tian Ma 65-m Telescope Automatic Early Warning System. Front. Astron. Space Sci. 9:896040. doi: 10.3389/fspas.2022.896040
Received: 14 March 2022; Accepted: 23 June 2022;
Published: 22 August 2022.
Edited by:
Frederic Victor Hessman, Georg-August-Universität Göttingen, GermanyReviewed by:
Aletha De Witt, Hartebeesthoek Radio Astronomy Observatory (HartRAO), South AfricaTim-Oliver Husser, University of Göttingen, Germany
Copyright © 2022 Wei-Hua, Rong-Bing, Dong and Chu Yuan. This is an open-access article distributed under the terms of the Creative Commons Attribution License (CC BY). The use, distribution or reproduction in other forums is permitted, provided the original author(s) and the copyright owner(s) are credited and that the original publication in this journal is cited, in accordance with accepted academic practice. No use, distribution or reproduction is permitted which does not comply with these terms.
*Correspondence: Zhao Rong-Bing, zhaorb@shao.ac.cn