 L. A. Da Silva1,2*
 J Shi1
 L. C. A. Resende1,2O. V. Agapitov3
 L. R. Alves2I. S. Batista2
 C. Arras4
 L. E. Vieira2
 V. Deggeroni2
 J. P. Marchezi1,2C. Wang1
 J. Moro1,2
 A. Inostroza2H. Li1
 C. Medeiros2F. R. Cardoso5P. Jauer1,2M. V. Alves2
 S. S. Chen2Z. Liu1
 C. M. Denardini2W. Gonzalez1,2
- 1State Key Laboratory of Space Weather, National Space Science Center, Chinese Academy of Sciences, Beijing, China
- 2National Institute for Space Research—INPE, São José dos Campos, Brazil
- 3University of California, Berkeley—UCB—Space Sciences Laboratory, Berkeley, CA, United States
- 4German Research Centre for Geosciences—GFZ, Potsdam, Germany
- 5University of São Paulo—USP, Lorena School of Engineering (EEL), São Paulo, Brazil
The dynamics of the electron population in the Earth’s radiation belts affect the upper atmosphere’s ionization level through the low-energy Electron Precipitation (EP). The impact of low-energy EP on the high-latitude ionosphere has been well explained since the 1960’s decade. Conversely, it is still not well understood for the region of the South American Magnetic Anomaly (SAMA). In this study, we present the results of analysis of the strong geomagnetic storm associated with the Interplanetary Coronal Mass Ejection (May 27-28, 2017). The atypical auroral sporadic E layers (Esa) over SAMA are observed in concomitance with the hiss and magnetosonic wave activities in the inner radiation belt. The wave-particle interaction effects have been estimated, and the dynamic mechanisms that caused the low-energy EP over SAMA were investigated. We suggested that the enhancement in pitch angle scattering driven by hiss waves result in the low-energy EP (≥10 keV) into the atmosphere over SAMA. The impact of these precipitations on the ionization rate at the altitude range from 100 to 120 km can generate the Esa layer in this peculiar region. In contrast, we suggested that the low-energy EP (≤1 keV) causes the maximum ionization rate close to 150 km altitude, contributing to the Esa layer occurrence in these altitudes.
Key points
• Pitch angle scattering driven by hiss waves could cause the electron precipitation ≥ 0.5 keV over the SAMA.
• Electron precipitation ≤ 10 keV is the main ingredient to generate Esa layer detected close to 100-120 km over SAMA.
• Electron precipitation ≤ 1 keV is the main ingredient to generate Esa layer detected close to 150 km over SAMA.
Introduction
Coupling between the solar wind structures and the Earth’s magnetosphere can affect the upper atmosphere’s ionization through charged particle precipitation. The high-latitude dynamic after the low-energy Electron Precipitation (EP) has been well understood since the 1960’s decade. Rees (1963) and Cai and Ma (2007) found that the low-energy EP (≥1 keV) can cause maximum ionization at altitudes below 150 km. These charged particles can be an essential source to generate the auroral-type sporadic E layer (Esa) at high latitudes (Whitehead, 1970). Nath et al. (1980) suggested that low-energy EP is usually the major cause for the generation of such a layer, once the modified wind shear mechanism is important under low-energy EP conditions only.
The Esa layer over the South American Magnetic Anomaly (SAMA) has been observed since the 1970’s, in which the theoretical discussions regarding the inner radiation belt dynamic were suggested as the main mechanisms responsible for the low-energy EP over this region (Batista and Abdu, 1977). SAMA is a weak magnetic field region that results from the geomagnetic field’s geometric configuration (Pinto and Gonzalez, 1989) and has pronounced departures in its symmetry. This peculiar region presents the trapped particle mirror points considerably lowered in altitude compared to other areas around the Earth (Roederer, 1967).
The dynamic mechanisms in the inner radiation belt are crucial to understanding the mechanisms responsible for the low-energy EP over the SAMA (Paulikas, 1975; Batista and Abdu, 1977; Pinto and Gonzalez, 1989; Nishino et al., 2006). Therefore, observing the magnetospheric wave activities inside the inner radiation belt and slot region allows us to understand the physical processes that cause these atypical layers over the SAMA, as Gonzalez et al. (1987) suggested. In this context, the plasma waves can be detected, such as the hiss (Meredith et al., 2004) and magnetosonic (Boardsen et al., 2016) waves. The plasmaspheric hiss waves are regarded as Extremely Low Frequency (ELF) whistler-mode emission (20 Hz - few kHz) (Meredith et al., 2004; Cao et al., 2005). The fast magnetosonic (MS) waves are typically detected between the proton gyrofrequency (fcp) and the lower hybrid resonance frequency (fLHR) (e.g., Russell et al., 1969; Ma et al., 2013).
The lightning-generated whistlers could also play an important role in electron precipitation from the Earth’s inner radiation belt and slot region (see, e.g., Inan et al., 1989, Green et al., 2005; Green et al., 2020). Generally, the lightning-generated wave power could be mixed into the high frequency (>∼ 2 kHz) portion of plasmaspheric hiss in the observation (Meredith et al., 2007). However, they are distinguishable using the wave polarization properties observations and could affect the electrons at lower energies than hiss (Green et al., 2020).
The pitch angle scattering is the main dynamic mechanism responsible for the EP driven by hiss waves (Lyons et al., 1972; Abel and Thorne 1998). On the other hand, the MS wave-particle interaction can result in EP in the atmosphere through the bounce resonance mechanism (Chen et al., 2015; Maldonado et al., 2016; Maldonado and Chen, 2018), Landau resonance mechanism (Li et al., 2014; Bortnik et al., 2015; Ma et al., 2016), and transit-time scattering mechanism (Bortnik and Thorne, 2010; Lei et al., 2017).
This work proposes to study the inner radiation belt/slot dynamic during the low-energy EP into the ionized atmosphere. The confirmation of the low-energy EP occurrence is through the Esa layer’s signatures in two digital ionosondes installed close to the SAMA region. Then, the main physical processes responsible for this Esa layers’ generation over SAMA are determined for the first time, using in situ satellite measurements in the inner radiation belt and an empirical model of the atmospheric ionization. Finally, the dynamic mechanisms responsible for the extra atmosphere’s ionization over the SAMA region are identified, leading to a better understanding of the magnetosphere-ionosphere coupling, and answering many open questions, as follows below:
1. Why the auroral-type sporadic E layer is detected over the SAMA region (outside the auroral region)?
2. What are the magnetosphere waves and the main dynamic mechanism that cause the electron precipitation over the SAMA region?
3. What energy levels of electrons precipitate over the SAMA region?
4. What energy levels of electrons can generate the Esa layers close to 100-120 km over SAMA?
5. What energy levels of electrons can generate the Esa layers close to 150 km over SAMA?
Approach
We aim to investigate the low-energy EP (tens of keV) in the ionosphere over the SAMA. For this purpose, we use space and ground-based observations recorded over several decades. However, we have constraints on how we can proceed in this investigation. For example, we need simultaneous observations of the solar wind, the magnetosphere, and ionospheric conditions. Additionally, it would be simpler to investigate periods in which the low-energy EP effects would be easily distinguishable from the background patterns. In this work, we select an event to study the signatures in the inner radiation belt that are associated with the ionosphere.
Assuming that low-energy EP occurs during geomagnetic storm conditions, it is reasonable in the first moment to search for signatures in the ionosphere during intense geomagnetic storms. As defined by Gonzalez et al. (1994), intense geomagnetic storms are usually related to the transit of interplanetary counterparts of coronal mass ejections (ICMEs) through Earth’s orbit. In this way, we identify the candidate events in the ICME events catalog compiled by Cane & Richardson (2003) and Richardson & Cane (2010). Currently, the event list is available at http://www.srl.caltech.edu/ACE/ASC/DATA/level3/icmetable2.htm.
This work investigates the solar wind structure employing parameters measured by instruments onboard the Advanced Composition Explorer (ACE) satellite, which provided the solar wind parameters at the L1 Lagrangian point since 1997 (Stone et al., 1998). Specifically, we use observations from the Magnetic Field Experiment (MAG) and Solar Wind Electron, Proton, and Alpha Monitor (SWEPAM).
On the other hand, we need to identify a signature of the low-energy EP in the ionosphere appropriate for this study. The Esa layer is a suitable signature for such investigation as low-energy EP is associated with these sporadic E layers in the auroral region. Here, we use the data collected by Digisondes installed in Cachoeira Paulista, Brazil (22.7°S, 45.0°W, dip: -35°, L = 1.13), from the Embrace Network (Denardini et al., 2016), and installed in Santa Maria, Brazil (29.7°S, 53.8°W, dip: -37°, L = 1.16) from the China-Brazil Joint Laboratory for Space Weather (Moro et al., 2019) to monitor the occurrence of Esa layer over the SAMA region. The ionograms are graphs of virtual height versus frequency, which provide the ionospheric profile, and from which the ionospheric parameters, including the sporadic-E layer types, can be obtained. These graphs are obtained from the ionosondes, a radar that transmits radio waves continuously into the ionosphere ranging from 1 to 30 MHz and 5/10 min of time resolution (Reinisch et al., 2009). It is important to mention that virtual heights are calculated based on the time interval between pulse transmission and echo received through the antennas (Reinisch et al., 1997).
The Van Allen Probes Mission (VAP), which was designed to investigate the dynamics of the Earth’s radiation belts, has been providing observations of low-energy electron flux and the wave activity for approximately 7 years since its launch on 12 August 2012 (Mauk et al., 2013). The proton flux contamination in the Magnetic Electron Ion Spectrometer (MagEIS - Blake et al., 2013) data of the Van Allen Probes has been removed (Claudepierre et al., 2015), providing the low-energy electrons trapped without contamination. In contrast, the low-energy electrons precipitated over SAMA are still challenging to measure due to the strong proton contamination (e.g., Rodger et al., 2013; Andersson et al., 2014). In this way, we analyze and discuss the low-energy electrons in the inner radiation belt/slot as well as the plasma waves. The plasma waves, such as hiss waves (Meredith et al., 2004), can interact with these electrons through the pitch angle scattering mechanism to cause EP to the atmosphere. In contrast, the MS waves (Ma et al., 2013) can interact with these electrons through bounce resonance, Landau resonance, or transit-time scattering mechanisms to cause EP to the atmosphere. Furthermore, an empirical model (Fang et al., 2010) is used to estimate the atmospheric ionization rate (100–150 km) and confirm the role of the low-energy EP in the Esa layer generation over this peculiar region.
The hiss and MS wave power spectral densities are estimated using observations from the Electric and Magnetic Field Instrument Suite and Integrated Science (EMFISIS) instrument (Kletzing et al., 2013). We infer the total electron density from the data measured by the Electric Field and Waves (EFW) instrument (Wygant et al., 2013) and the frequency ratio of electron plasma oscillation to electron cyclotron gyration (fpe/fce) from the EMFISIS instrument. We compute the Wave Normal Angle (WNA), ellipticity, and planarity based on the singular value decomposition method (Santolík et al., 2003). For this, we use data from the waveform receiver (WFR) integrated into EMFISIS.
Based on these constraints, we selected one ICME event observed on May 27-28, 2017, which is concomitant to an intense geomagnetic storm and the occurrence of the Esa layer over SAMA. For these analyses, we consider that the geomagnetic storm evolves in different phases related to the structure of the ICME.
Interplanetary medium conditions and geomagnetic storm
The scenery of this study occurred under the influence of an ICME, which can drive a geomagnetic storm (Gonzalez et al., 1999; Echer et al., 2008; Richardson and Cane, 2012), and deposit energy in the magnetosphere (Ponomarev et al., 2006). An ICME reached the L1 Lagrangian point at 15:30 UT on 27 May 2017, in which the solar wind speed (Figure 1A) and the proton density (Figure 1B) abruptly increased, from ∼ 290 to 365 km/s and from ∼ 7 to 30 proton/cm3, respectively. These abrupt increases occurred concomitantly with the signature of the storm’s sudden commencement (SC-P) (first vertical dashed red line) observed in the SYM-H (Figure 1F). This SC-P (SYM-H positive) persists until ∼ 23:00 UT on May 27, and the maximum positive value is ∼ +60 nT. By component (Figure 1C red line) fluctuates between -10 nT and +12 nT during the SC-P. The Bz component (Figure 1D blue line) is southward oriented, and the AE index (Figure 1E) oscillates below 500 nT, except at ∼ 23:00 UT when it reached ∼ 500 nT.
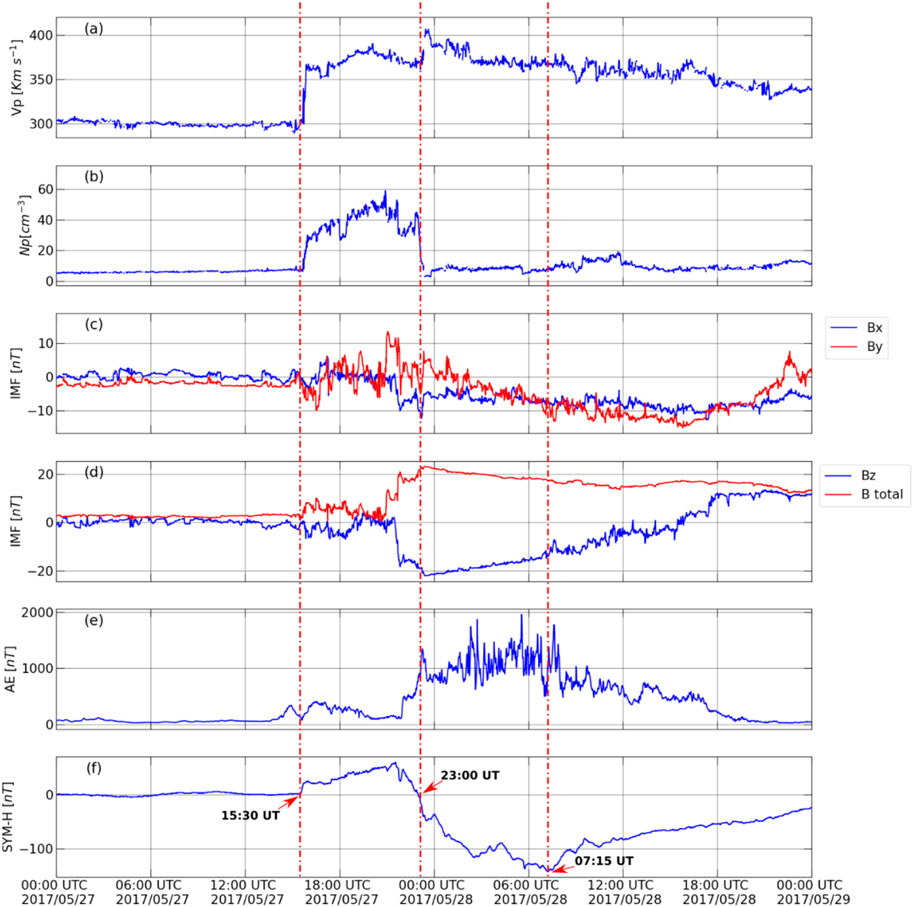
FIGURE 1. (A) Solar wind speed (Vp); (B) density (Np); (C) Interplanetary Magnetic Field (IMF) Bx (red) and By (blue) components; (D) IMF intensity (Bt) and Bz component, in red and blue colors, respectively; (E) AE Index; (F) Symmetric disturbance index (SYM-H). The Vp, Np, Bt, Bz, Bx and By are obtained by ACE satellite in the Lagrangian L1 point. AE and SYM-H geomagnetic indices are obtained at OMNI database: High Resolution OMNI (5-min averaged). The vertical dashed red lines refer to the onset time of the geomagnetic storm’s phases.
The storm’s main phase (M-P) started at ∼ 23:00 UT on May 27 (the second vertical dashed red line), in which the SYM-H (Figure 1F) values crossed zero, and it persisted decreasing until 07:15 UT on May 28. During this M-P, the proton density (Figure 1B) decreases significantly (<10 proton/cm−3), Bz component (Figure 1D red line) reached ∼ -20 nT, and the AE index (Figure 1E) reached a maximum value of approximately 1,600 nT at ∼ 02:00 UT and 05:30 UT on May 28, persisting above ∼ 1,000 nT on average. The storm’s recovery phase (R-P) started at ∼ 07:15 UT on May 28 (the third vertical dashed red line), in which the SYM-H (Figure 1F) began to increase. The AE index (Figure 1E) reached ∼ 1700 nT at ∼ 07:30 UT on May 28.
Inner radiation belt dynamic and low-energy EP over SAMA
The energy deposited in the inner magnetosphere, under the influence of this ICME, is considerably strong (Ponomarev et al., 2006). This energy can generate magnetospheric waves in a wide range of frequencies (e.g., Da Silva et al., 2021), especially during the geomagnetic storm’s phases. The magnetospheric waves can interact with the electron and can cause particle precipitation to the atmosphere. The electron particle precipitation can be observed over both the auroral and SAMA regions. Precisely, over the SAMA region, the low-energy EP (tens to hundreds keV) arising from the inner radiation belt can be estimated through the measurements of the X-rays emission, as observed by Pinto and Gonzalez (1989); Pinto et al. (1989) and Kuznetsov, (2007).
Due to trapped particle mirror points being considerably lowered in altitude as they drift through the SAMA (Roederer, 1967), this region is significantly contaminated by the protons. It implies the difficulty of measuring the electron flux in the inner radiation belt and the electron precipitation (e.g., Rodger et al., 2013; Andersson et al., 2014). However, the background contamination of the electron flux measurements from MagEIS was removed (Claudepierre et al., 2015) and is used here to discuss the low-energy electron flux variability in the inner radiation belt and their possible relationship with the plasma waves. Consequently, the main physical processes responsible for launching the electron particles in the loss cone over this region are identified.
Plasma wave activities and low-energy electron flux variability during the geomagnetic storm’s phases
The plasma waves, such as the plasmaspheric hiss and magnetosonic waves can be detected in the inner radiation belt. This region can be coincident with the plasmasphere region and will be identified by the total electron density. The total electron density is a fundamental parameter of plasma; here specifically, it is used to map regions of the magnetosphere, such as the plasmasphere. This parameter is estimated through the higher-frequency measurements obtained from the EMFISIS instrument onboard Van Allen Probes, which is able to measure a single electric field component of waves in the frequency range of 10–500 kHz. These higher-frequency measurements allow the determination of the total electron density at the spacecraft, which can be inferred from the upper hybrid resonance frequency fUH. The upper hybrid resonance frequency is defined as
The plasmaspheric hiss waves, regarded as Extremely Low Frequency (ELF) whistler-mode emission (20 Hz to a few kHz) (Meredith et al., 2004; Cao et al., 2005), are commonly observed over a broad spatial region in the plasmasphere or plasmaspheric plumes. The MS waves are typically detected between the proton gyrofrequency (fcp) and the fLHR (e.g., Russell et al., 1969; Ma et al., 2013). These waves can play an essential role in the loss process of energetic electrons in the inner magnetosphere, being able to cause electron precipitation (Li J. et al., 2019; Yahnin et al., 2019). Thus, analyzing the global spatiotemporal evolution of these waves’ intensities during the geomagnetic storm’s phases is important to identify the main dynamic mechanisms responsible for launching the electron particles in the loss cone, which can result in particle precipitation over SAMA. For that, we use the spectrograms of the magnetic field from the EMFISIS instrument onboard the Van Allen Probes to detect the plasma wave activities, considering the periods when the Van Allen Probes orbit was next to the perigee (∼ L < 3.5).
Figure 2 presents the electron densities, the spectrograms of the magnetic field and fLHR obtained from the EMFISIS instrument onboard Van Allen Probes A (panels a and b) and B (panels c and d). The electron density is a fundamental parameter of plasma obtained from plasma wave measurements made onboard Van Allen Probes (Kurth et al., 2015). In accordance with the literature, the plasmasphere is considered the innermost region of the magnetosphere. It is formed by a thermal plasma cloud encircling the Earth, in which their electron density varies between ∼10–104 electrons/cm3. In contrast, the outside of the plasmasphere is formed by hot plasma, where the electron density changes abruptly to tenuous density (∼1 electron/cm3). Thereby, the boundary that separates the low-density plasma region from the high-density plasma region is called plasmapause, which is represented by the variation of the ratio between the maximum and minimum electron density, as widely used in previous studies (e.g., Guo et al., 2021; Thomas et al., 2021; Zhelavskaya et al., 2016; Liu et al., 2015; Lemaire et al., 1998). The determination of the plasmapause allows the identification of the plasmaspheric waves. On the other hand, the fLHR identifies the MS wave activities. The time duration of Figure 2 (15:00 UT on May 27 to 15:00 UT on May 28) includes the storm’s sudden commencement, main, and recovery phase.
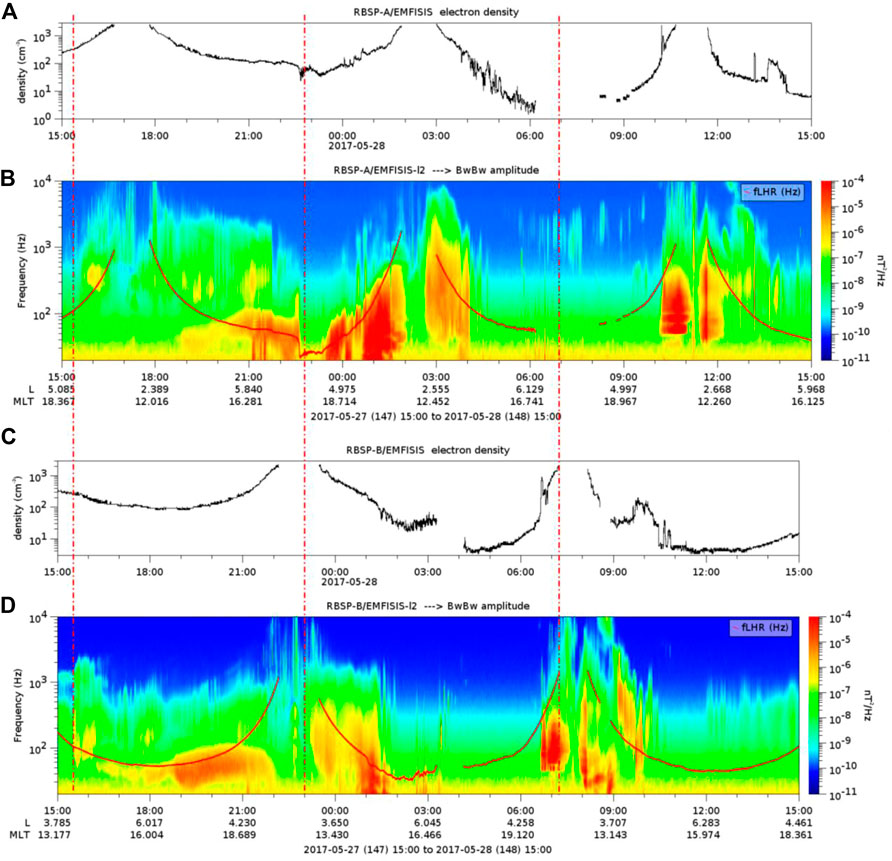
FIGURE 2. Electron density from Van Allen Probe A (A) and B (C), and frequency-time spectrogram of magnetic spectral density from Van Allen Probe A (B) and B (D). The red line represents the lower hybrid resonance frequency (fLHR). The electron densities and fLHR are obtained from the EMFISIS instrument. The geomagnetic storm period analyzed here is approximately 2 hours before the sudden commencement phase and about 8 hours after the beginning of the recovery phase. The vertical dashed red lines refer to the onset time of the geomagnetic storm’s phases.
The Van Allen probe A (RBSP-A) presented three periods at the perigee, while the Van Allen probe B (RBSP-B) presented two periods:
The RBSP-A periods:
1) The first period (15:00UT - 19:00UT on May 27) refers to the storm’s sudden commencement phase (SC-P).
2) The second period (00:00UT - 04:00UT on May 28) is referent to the storm’s main phase (M-P).
3) The third period (09:00UT - 13:00UT on May 28) is referent to the storm’s recovery phase (R-P).
The RBSP-B periods:
1) The first period (21:00UT on May 27 and 01:00UT on May 28) occurred during the storm’s sudden commencement phase and storm’s main phase (SC-M-P);
2) The second period (06:00UT - 10:00UT on May 28) occurred during the storm’s recovery phase (R-P).
The spectrogram of the magnetic field observed in Figure 2 (panel b - RBSP-A) during the SC-P suggests the presence of the plasmaspheric hiss waves at ∼ 16:00 UT and from 18:00 UT below the plasmapause (panel a). The spectrogram also shows the discrete MS waves around 19:00 UT, observed below fLHR. During the M-P (panel b - RBSP-A), the power spectral density suggests the presence of the plasmaspheric wave activities during all-time analyzed (00:00UT - 04:00UT on May 28), in which the power spectral is considerably strong compared with the SC-P period, and below fLHR. During the R-P (panel b- RBSP-A), the plasma wave activities are observed again, below the plasmasphere (panel a) and the fLHR during all-time analyzed (09:00UT - 13:00UT on May 28). The plasmapause is apparently compressed during the R-P (panel a - RBSP-A) compared with the SC-P and M-P periods. This result was already expected due to the plasmapause being located closer to the Earth when it is under the influence of high geomagnetic activity (see Chappell et al., 1970; Goldstein, 2006; Pierrard et al., 2008).
The spectrogram of the magnetic field observed in Figure 2 (panel d - RBSP-B) during the SC-M-P suggests the signatures of the plasmaspheric wave activities within the inner radiation belt. These plasmaspheric wave activities are observed during SC-P confined below 200 Hz, while during the M-P, these waves are observed below 700 Hz. During the R-P, the behavior of the plasmasphere is similar to the period measured by the RBSP-A (09:00UT - 13:00UT on May 28), in which the plasmapause is apparently compressed (panel c) compared with the SC-M-P period.
The low-energy electron flux (32–70 keV) within the radiation belts (Figure 3) is presented here, with more detail during the R-P (bottom panel), in which the plasmapause is apparently compressed compared with the SC-M-P period (top panel). The seed population increased considerably during the R-P, compared with the SC-M-P. Before 06:50 UT, an electron flux increase is observed above 38 keV. In contrast, two electron flux decreases are observed, the first is close to 7:00 UT reaching the electrons below 45 keV, and the second is observed close to 7:15 UT reaching the electrons above 45 keV. After the perigee time (after 8:00 UT), the electron flux increase is persistent for more than 1 h and 30 min in all the range of energy presented. The plasmapause approached the Earth (L≈1.8) during the R-P, as observed in Figure 2D after 06:00 UT on May 28 (black line) and in Figure 4A at the beginning of the chorus wave activities. This strong geomagnetic activity may produce a favorable plasma regime, as observed through the measurements of the seed population (tens keV, Figure 3) after the initial geomagnetic storm phase, which may contribute to the rapid scattering of electrons (Meredith et al., 2004; Ma et al., 2016b; Agapitov et al., 2019). Therefore, it is crucial to investigate the plasma waves and seed particles’ lifetime during this period.
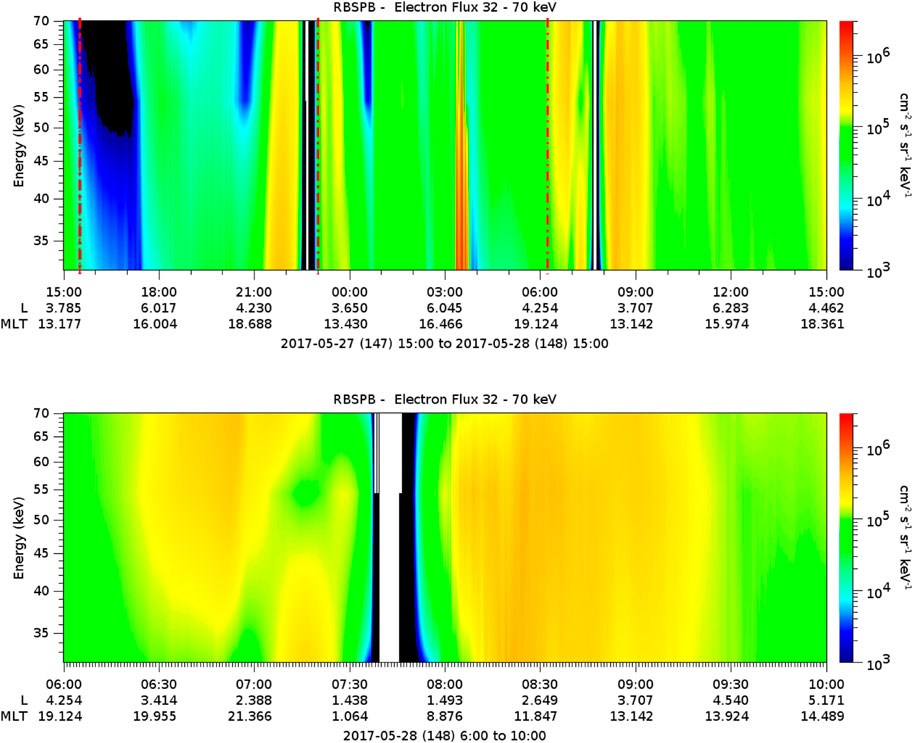
FIGURE 3. Low-energy electron flux (32–70 keV) from Van Allen Probe B during the geomagnetic storm time (top) and R-P time (bottom). The start time of the geomagnetic storm is considered here as approximately 2 hours before the sudden commencement phase and it ends approximately 8 hours after the beginning of the recovery phase. The low-energy electron flux is obtained from MagEIS instrument onboard Van Allen Probe (B). This decontaminated data is available for this period only from Van Allen Probe (B). The vertical dashed red lines refer to the onset time of the geomagnetic storm’s phases.
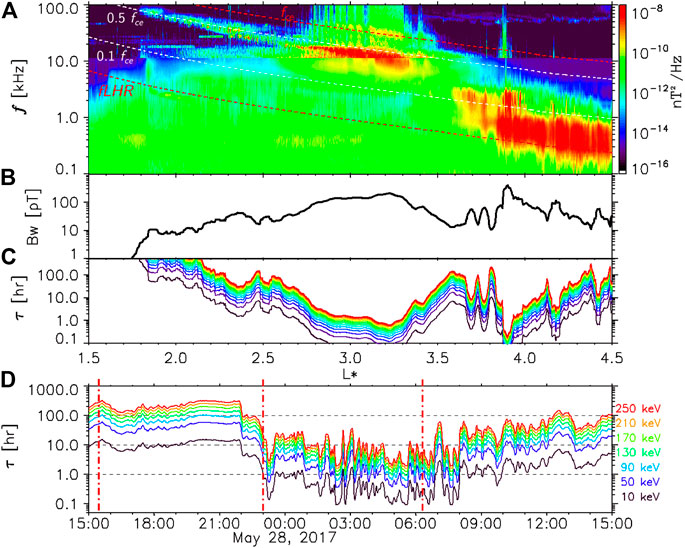
FIGURE 4. (A) Dynamic spectrum of chorus wave magnetic field from Van Allen Probe B, obtained from EMFISIS on 2017-05-28 (08:00-09:30UT) below 10 kHz and HFR (electric field was recalculated into magnetic field magnitude under the approximation of field aligned propagation) above 10 kHz. (B) Chorus waves amplitude, Bw (pT). (C) Time scale for electron (10-1,000 keV) quasi-linear scattering by lower band chorus waves, τ = 1/Daa. (D) The 10-250 keV electron lifetime (τ) dynamics at L* = 2.5 during the time interval from Figure 2 (electron energies are color coded). Electron cyclotron frequency fce and lower hybrid frequency fLHR are indicated by the red curves, 0.5 fce and 0.1 fce are indicated by the white curves. The vertical dashed red lines refer to the onset time of the geomagnetic storm’s phases.
Figure 4 shows the chorus wave activities at extremely low L* in usual chorus frequency bands 0.1-0.45 fce and 0.55-0.9 fce that reach up to 80 kHz. The dynamic spectrum of chorus wave magnetic field is calculated combining from EFI and HFR Van Allen Probe B measurements during geomagnetic storm R-P on 28 May 2017. Figure 4 shows that the lower band chorus waves had maximum time-averaged amplitudes of ∼100-140 pT (while the statistical model from Agapitov et al., 2018, gives ∼90 pT) at L* = 3, where the fpe/fce ratio was ∼2 at ∼8:30 UT (Figure not shown).
The dynamics of electron lifetime can be estimated based on the chorus model (Agapitov et al., 2015, 2018), which was extended, taking into account the cold plasma dynamics and the latitudinal distribution of wave amplitude. The results are shown in Figure 4, in which the parameters correspond to a typical quasi-linear scattering time scale 1/Daa (30 keV) ∼0.4 ± 0.1 h at L* = 3 (versus ∼6 ± 0.2 h using the statistical model from (Agapitov et al., 2019)) and ∼2 h at L* = 2.3 presumably causing intensive precipitations of 10-30 keV electrons to the ionosphere.
The dynamics of electron lifetime can be based on the hiss model (Agapitov et al., 2020), in which this new model version considers the low-energy electron levels (10-250 keV) and the latitudinal distribution from L* = 2.5. Thereby, the fpe/fce is considerably low (∼2), as expected (e.g., Albert et al., 2016; Watt et al., 2019). The main results are presented in Figure 4, in which the 10-250 keV electron lifetime (τ) dynamics at L* = 2.5 driven by plasmaspheric hiss waves are shown during the time interval from Figure 2. The electron energies are color coded. The quasi-linear scattering time scale 1/Daa (10 keV) is below 1 h from 23:00 UT on May 27 to 10:00 UT on May 28, coinciding with the M-P and R-P geomagnetic storm. It means that the plasmaspheric hiss waves confined at L* = 2.5 presumably cause intensive precipitations of 10 keV electrons to the ionosphere.
Plasma wave activities during the conjunctions between the Van Allen Probes and the ionosonde stations over SAMA
The plasmaspheric hiss waves have been measured at low latitude within the inner radiation belt (L = ∼ 1-2) since the 70s decade (Tsurutani et al., 1975). These waves can trigger the dynamic mechanisms for the EP over the SAMA region, as suggested by Gonzalez et al. (1987). Therefore, planarity and ellipticity are used to identify the plasmaspheric waves in the inner radiation belt. Once, the planarity and ellipticity allow for classifying the degree of magnetic field polarization in the polarization plane and the ellipticity of the magnetic field polarization (Hartley et al., 2018).
The ionosonde measurements can indirectly infer the occurrences of the low-energy EP through the signature of the auroral type sporadic E layer (Esa) in this peculiar region. The ellipticity and planarity are calculated only during the conjunctions between the Van Allen Probes and the ionosonde stations over Brazil. Table 1 shows the occurrences of the three conjunctions during the entire period analyzed. The first and third conjunctions are observed between VAP-A and the ionosonde stations during the M-P and R-P, respectively. In contrast, the conjunction between VAP-B and the ionosonde stations is observed only during the R-P.
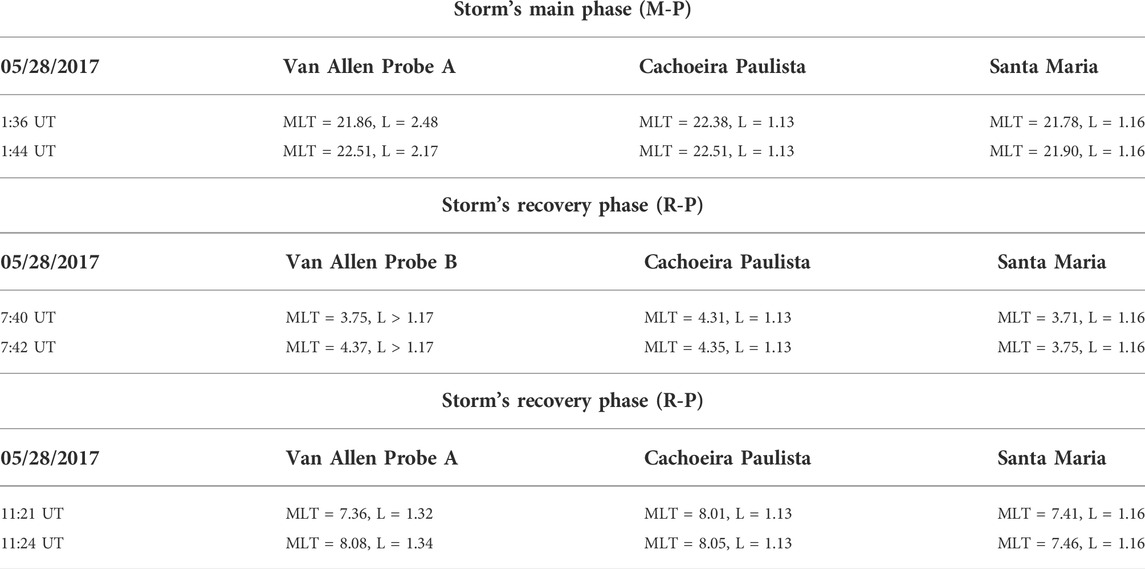
TABLE 1. The Magnetic Local Time (MLT) and L values of the VAP-A/B and the ionosonde stations during the conjunctions. The conjunctions were observed only during the storm’s main and recovery phases.
Figure 5 presents the frequency-time spectrogram of the magnetic field (a), ellipticity (b), planarity (c) and total electron density (d) during the first (left panels), second (right panels), and third (bottom panels) conjunctions. The fLHR (white line) are presented in panels (a). The plasma density and wave polarization properties are used to distinguish the different types of the plasmaspheric waves (e.g., Li et al., 2015; Li W. et al., 2019).
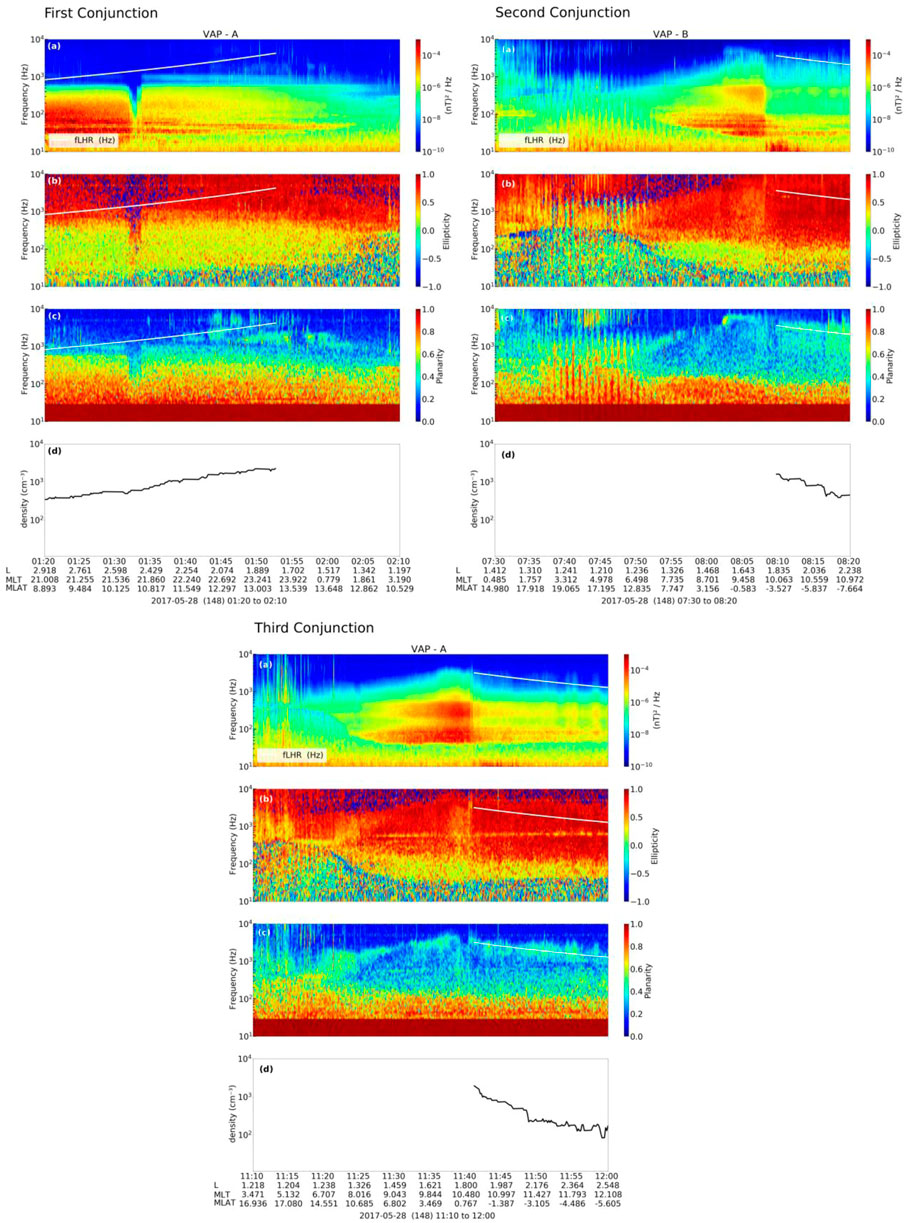
FIGURE 5. (A) The frequency-time spectrogram of the magnetic field; (B) ellipticity; (C) planarity and (D) the total electron density during the first (left panels), second (right panels) and third (bottom panels) conjunctions. The lower hybrid resonance frequency (fLHR) (white line) are presented in panels (A–C). The ellipticity and planarity are calculated through the singular value decomposition method (Santolík et al., 2003). The fLHR and frequency-time spectrogram of magnetic field are obtained from EMFISIS instrument and the electron density is inferred from the data of EFW instrument. The EFW and EMFISIS instruments are onboard the VAP.
Figure 5 (left panels) shows the plasma waves during the first conjunction period (VAP-A, 01:20-02:10 UT), which occurs during the storm M-P. The MS wave activities are observed almost the entire time. They are detected inside the plasmasphere and below fLHR (e.g., Laakso et al., 1990; Santolík et al., 2002). Their ellipticity is ∼ - 0.2 and planarity ≥ 0.8. It means that their propagation is highly oblique related to ambient magnetic field direction and linearly polarized (e.g., Horne et al., 2007; Ma et al., 2016). Figure 5 (right panels) shows the plasma waves during the second conjunction period (VAP-B, 07:30-08:20 UT), which occurs during the storm R-P. The hiss waves are observed approximately before 07:38 UT and from 07:46 UT, with ellipticity ≥ 0.5 and planarity ≥ 0.2 (e.g., Li et al., 2015). The MS waves are detected from 07:53 UT, and their polarization ellipticity is concentrated between ± 0.2 and planarity ≥ 0.8. Figure 5 (bottom panels) shows plasma waves during the third conjunction period (VAP-A, 11:10-12:00 UT), which occurs during the storm R-P again. The plasma wave activities are very similar to the waves detected during the second conjunction. The hiss waves are observed from 11:23 UT, with ellipticity ≥ 0.5 and planarity ≥ 0.2 (e.g., Li et al., 2015), and the MS waves presented the ellipticity ∼ - 0.2 and planarity ≥ 0.8.
Figure 6 (top and bottom panels) show the spatial distribution of the electron density in two dimensions for L values 1.5, 2, 3, 4, and 5 using a dipolar model of Earth’s magnetic field lines in the Solar Magnetic coordinate (SM) for plane YZ and XY, respectively. The total electron density measurements are obtained from the EMFISIS instrument onboard the Van Allen Probes A (conjunction 1 and 3) and B (conjunction 2), and the periods are limited by the availability of the EMFISIS data (See Supplementary Figure S1 –in Supporting Information).
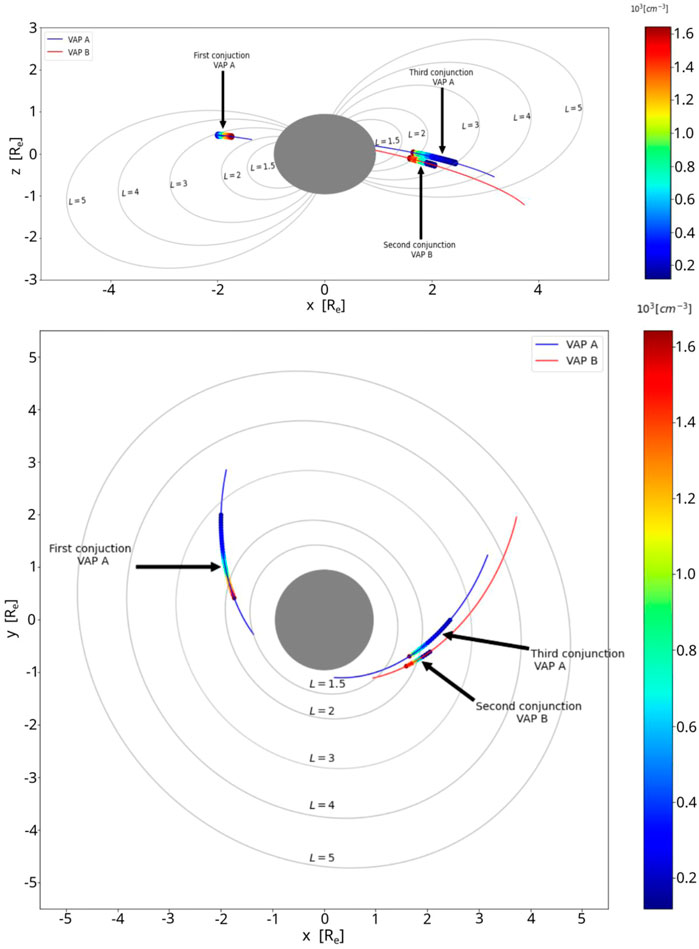
FIGURE 6. Spatial distribution in two dimensions of electron density for L values 1.5, 2, 3, 4, and 5 using a dipolar model of Earth’s magnetic field lines in the Solar Magnetic coordinate (SM) for plane YZ (top panel) and XY (bottom panel). The total electron density measurements were obtained from the EMFISIS instrument onboard the Van Allen Probes A (blue lines) and B (red lines). The color bar is the total electron density value.
Observe in Figure 6 (top and bottom panels) that SAMA L-shells correspond to approximately 1 ≤ L ≤ 2 (inner radiation belt) and the auroral oval is located about 3 ≤ L ≤ 6 (outer radiation belt). Additionally, the dynamic location of the plasmapause shows its preferential position within the inner radiation belt and slot region (L < 3) during these three conjunctions periods. It means that the plasma waves detected within the plasmasphere are confined at L < 3, which may have resonantly interacted with the low-energy electrons to cause the EP to the SAMA region (lower latitude region).
The ionosonde stations used in this study are located over the SAMA region, specifically in the low-middle latitude (20° < geomagnetic latitude < 50°). Therefore, the dynamic mechanisms responsible for the Es layers generally are associated with both the vertical shear in the horizontal tidal wind (Haldoupis, 2012) and the low-energy EP (Batista and Abdu, 1977). The Es layers associated with the vertical shear in the horizontal tidal wind are normally classified into the flat (Esf), high (Esh), cusp (Esc), and low (Esl) types, while the Es layers associated with the low-energy EP is observed in the ionograms as traces of range spreading echoes, named Esa layer (e.g., Moro et al., 2022; Kirkwood and Nilsson, 2000; Piggott and Rawer, 1978). They are commonly detected in the auroral regions produced by the auroral particle ionization (Nikolaeva et al., 2021) from the outer radiation belt (Blum et al., 2013) and peculiarly over the SAMA region due the low-energy EP from the inner radiation belt (Batista and Abdu 1977; Gonzalez et al., 1987; Moro et al., 2022).
Figure 7 shows the ionograms over Cachoeira Paulista during the first (top panels), second (middle panels), and third (bottom panels) conjunctions. The Figure 7 (top panels) shows the ionograms considering the first conjunction period (01:36 UT and 01:44 UT), which occurs during the M-P. A flat trace is observed in the ionogram at 01:30 UT (short period) at around 120 km. This Es layer’s type is classified as Esf (Haldoupis, 2012). The ionograms show the absence of the Esa layers in all the analyzed time, which means the absence of the low-energy EP effect over Cachoeira Paulista during the M-P. Supplementary Figure S2 (top panels) presents the absence of the Es layers in Santa Maria during the analyzed time. It is important to highlight that only the magnetosonic wave activities are detected during this conjunction within the inner radiation belt (Figure 5 - left panels).
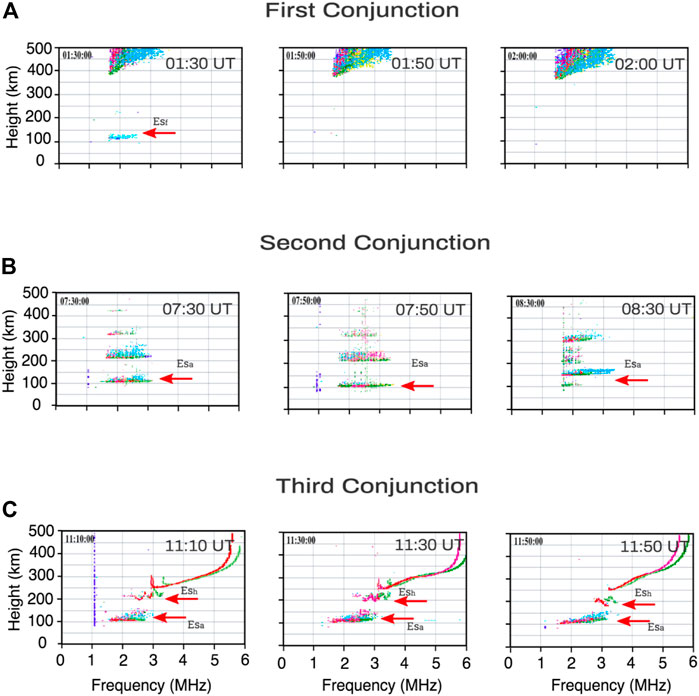
FIGURE 7. Ionograms from Digisonde located at Cachoeira Paulista station during the first (A), second (B) and third (C) conjunctions. The red arrows show the Es layers presence. The color code in these ionograms represents the echo direction of the signal received. Red shades denote O-polarization, and green shades indicate X-polarization. The blue points are used for the echoes in the North/East directions, and yellow shades are used for the South/West. More details can be found at https://giro.uml.edu/ionogram-data.html.
The middle panels of Figure 7 show the ionograms considering the second conjunction period (07:40 UT and 07:42 UT), which occurs during the R-P (night time). A spread and diffuse trace is observed in the ionograms that performed a downward movement reacheing 100–150 km. This Es layer’s characteristic type is classified as Esa layer (Moro et al., 2022; Resende et al., 2013; Kirkwood and Nilsson, 2000) and could be associated with the low-energy EP from the inner radiation belt (Batista and Abdu, 1977). Supplementary Figure S2 (middle panels) presents similar signatures in the ionograms registered in Santa Maria, which exhibit the Esa layers characteristics during the analyzed time. The hiss and MS wave activities were detected in the inner radiation belt (Figure 5 - right panels) during this second conjunction. The hiss waves are considered in the literature as important to cause the low-energy EP over the SAMA region during the R-P (Gonzalez et al., 1987). Thereby, it is crucial to investigate the dynamic mechanisms responsible for the low-energy EP driven by these waves, as described in.
Finally, Figure 7 (bottom panels) shows the ionograms from the Cachoeira Paulista station considering the third conjunction period (11:21 UT and 11:24 UT), which also occurs during the R-P (daytime). A trace discontinued in height with the E-region trace is observed in the ionograms, which descends with time, becoming a trace with a relatively symmetrical cusp at the peak of the E-region electron density (above 150 km). This signature in the ionograms is evidence of the Esh layer over SAMA during the R-P that could be associated with the strong wind shear. On the other hand, the weak spread and diffuse trace observed between 100 and 150 km exhibit very clear Esa layers characteristics. Furthermore, the E region appears strong, suggesting that the E region conductivity increased due to the particle precipitation (Santos et al., 2016). Supplementary Figure S2 (bottom panels) presents similar signatures in the ionograms registered in Santa Maria station, which shows the presence of the Esh layer and a weak spread and diffuse traces during the entire analyzed time that can be classified as Esa layer. Although the Esa layer is usually observed during the night hours (Hunsucker and Owren, 1962), and this third conjunction occurs in the morning (around 08:30 LT), the evidences shown in the ionograms of the two stations give us the confidence to classify the layers as Esa. Moreover, the plasma wave activities within the inner radiation belt during the third conjunction are very similar to the second conjunction. Considering all these points, it is crucial to investigate the dynamic mechanisms responsible for the low-energy EP driven by these waves which will be done in the next sections.
Dynamic mechanisms responsible for the low-energy EP over SAMA during the second conjunction
According to the conjunctions observed during the M-P and R-P (Table 1) and the Esa layer detected in the ionosonde stations over the SAMA region (Figure 7), the coincidences between the Esa layer’s signature and the conjunctions were observed during R-P, in the second and third conjunctions. Figure 8 highlights the second conjunction with the VAP-B orbit (white dotted line) and the Southern Hemisphere footprint (white dashed line) of May 28, and the ionosonde stations (red stars). The VAP-B orbit and their footprint are obtained at https://sscweb.gsfc.nasa.gov/cgi-bin/Locator.cgi. The magnetic equator (red line) and the global magnetic field (color’s scale) obtained with International Geomagnetic Reference Field (IGRF-13th generation) (Alken et al., 2021) are also presented in Figure 8, in which the ionosonde stations are localized in the center of the SAMA region (22,000 nT isoline). The third conjunction with the VAP-A orbit and the Southern Hemisphere footprint of May 28, and the ionosonde stations are presented in Supplementary Figure S3.
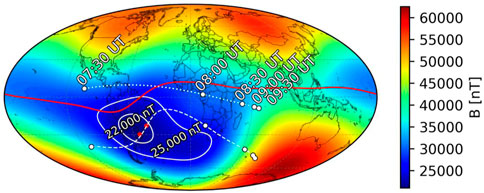
FIGURE 8. Global magnetic field (color’s scale) and magnetic equator (red line) in 150 km altitude, VAP-B orbit (white dotted line) and their footprint (white dashed line) on 28 May 2017 (07:30–09:30 UT), Santa Maria and Cachoeira Paulista stations (red stars) and the central region of the SAMA (white iso-intensity lines with 22,000 nT).
The plasma waves, such as hiss and MS waves are detected during this second conjunctions (Figure 5 - right panels), and the Wave Normal Angle (WNA) is calculated through the singular value decomposition method (Santolík et al., 2003) to discuss the dynamic mechanisms responsible for the low-energy electron precipitation over the SAMA region. Hiss waves are widely distributed in the radial distance and magnetic local time (MLT) and can cause precipitation of electrons from tens of keV to a few MeV to the atmosphere through pitch angle scattering mechanism (Meredith et al., 2006, 2007). Pitch angle scattering is a resonant mechanism between the electrons and magnetospheric waves, in which the first adiabatic invariant (μ), that depends on the particle’s pitch angle and its energy, is violated (e.g., Baumjohann and Treumann, 2012; Hartley and Denton, 2014). Conversely, the MS wave activities are mainly confined to the geomagnetic equator and propagate perpendicular to the background magnetic field. The MS waves can scatter the electrons from high pitch angles (close to 90°) to intermediate pitch angles (Xiao et al., 2015) due to the resonance conditions. Shklyar and Matsumoto (2009) showed two resonance conditions for electrons, named cyclotron resonance and Landau resonance, respectively:
where
Figure 9 presents the frequency-time spectrogram of magnetic field (panel a), WNA (panel b), frequency ratio fpe/fce (panel c - blue line), and total electron density inferred from the upper hybrid resonance line (panel c - black line). The fLHR (yellow line) are presented in panel a. During the plasmaspheric hiss wave activities (from 08:08 UT) is observed WNA ≤ 40°, as also observed by Li et al. (2015). Unlike hiss waves, the propagation of MS waves is highly oblique related to ambient magnetic field direction and linearly polarized (Horne et al., 2007; Ma et al., 2016), i.e., WNA ≥ 70° from 07:56 UT.
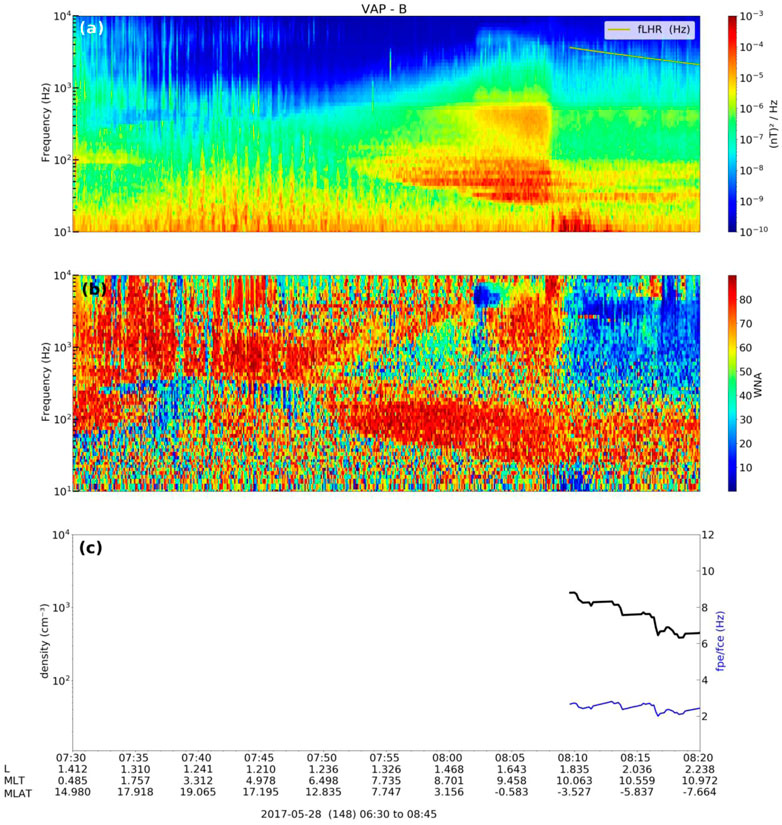
FIGURE 9. (A) the frequency-time spectrogram of magnetic field; (B) WNA; (C) frequency ratio fpe/fce (blue line) and the total electron density (black line). The lower hybrid resonance frequency (fLHR) (yellow line) is presented in the panel a. The fpe/fce, fLHR and frequency-time spectrogram of magnetic field are obtained from EMFISIS instrument and the electron density is obtained from EFW instrument. WNA is calculated through the singular value decomposition method (Santolík et al., 2003), in which the waveform receiver (WFR) data obtained from EMFISIS instrument is used. The EFW and EMFISIS instruments are onboard the VAP-B.
The frequency ratio fpe/fce (panel c—blue line) presents low values ∼ 2 – 3 from ∼ 08:08 UT, as expected when the plasmapause is located at L∼1.8 (see Albert et al., 2016; Watt et al., 2019). The resonant energy for whistler mode waves propagating parallel to the ambient magnetic field interacting with keV electrons is a function of the electron gyrofrequency (
Accordingly, the resonant energy is a function of the ambient plasma density and magnetic field strength, and by further calculation it can be shown that it increases following the decrease of fpe/fce ratio. Thus, the low values of the frequency ratio (fpe/fce) can be efficient for scattering loss of electrons (hundreds of keV) driven by MS waves (see Lei et al., 2017). However, we are interested in low-energy EP (tens of keV) because this energy range can generate the Esa layers over SAMA (Batista and Abdu, 1977). Thereby, the results presented here suggest that the hiss waves may cause the scattering loss of electrons (tens of keV) over this region. Additionally, it is essential to highlight the results observed in Figure 4 (panel d), especially during the second conjunction, in which the quasi-linear scattering time scale 1/Daa (10 keV) is below 1 h, presumably causing intensive precipitations of 10 keV electrons to the ionosphere over the SAMA region.
Atmospheric ionization over SAMA (100–150 km) induced by low-energy EP
An empirical model with a new parameterization of ionization in the atmosphere by the isotropically precipitating electrons (100 eV–1 MeV) (Fang et al., 2010) is used here to estimate the atmospheric ionization over SAMA during the second and third conjunctions induced by low-energy EP. To compute the atmospheric ionization, we assume that the incident particles (differential number flux, cm−2 s−1 keV−1) have a Maxwellian distribution defined by the function:
where the free parameters are total energy flux (
where k is the Boltzmann constant, T is the atmospheric temperature, m is the average molecular weight, g is the acceleration due to the gravity and z is vertical location.
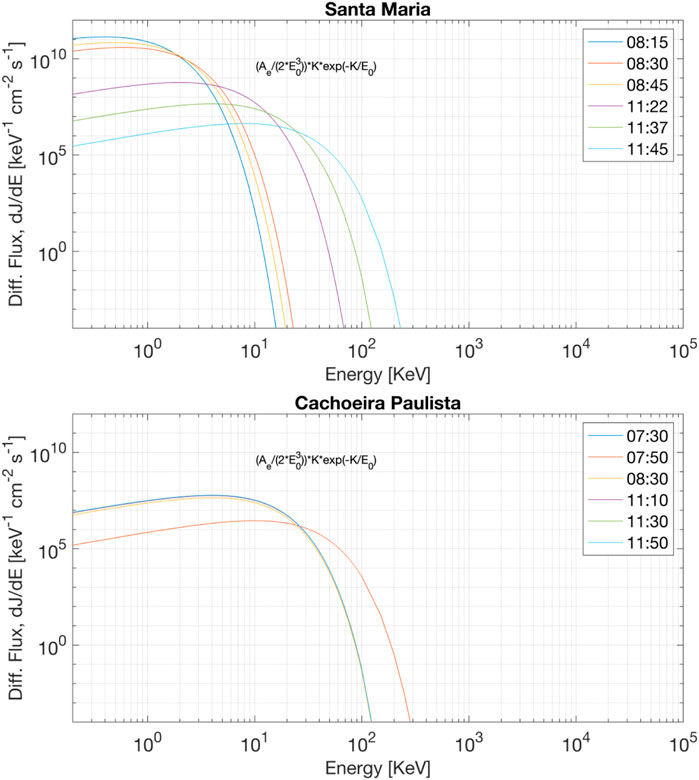
FIGURE 10. Total incident energy of electrons (100 eV—hundreds of keV) for Santa Maria (top) and Cachoeira Paulista (bottom) stations, considering the second and third conjunctions. The height scale H (km) is calculated to Santa Maria and Cachoeira Paulista during the three conjunctions (See Figure 15).
The ionization model data (Fang et al., 2010) also estimates the plasma frequency (MHz) altitude profile. First, it is considered that the time variation of electronic density (
Figures 11, 12 present the ionization rate altitude profiles (panels a, d, g), ionization rate altitude integrated between 100 eV and 100 keV (panels b, e, h), and the plasma modeled frequency (MHz) altitude profile (panels c, f, i) during the second conjunction. Figures 11, 12 are referring to Santa Maria and Cachoeira Paulista stations, respectively. Profiles of the ionization rate for four different energy levels of the electrons (0.5 keV (blue line), 1.0 keV (red line), 5.0 keV (green line), and 10 keV (magenta line)) are given in Figures 11, 12, panels a,d,g. At both ionosonde stations, the ionization rate peaks between 100–200 km altitude for all different energy levels, while the maximum of the low-energy electrons between 0.5–1.0 keV is generally located at higher altitudes compared to the low-energy electrons between 5.0–10.0 keV. The altitude integrated ionization rate (panels b, e, h) provides the energy amount deposited in the 100 km ≤ altitude ≤ 200 km. The Esa layer density due the electron precipitation can be identified in panels (c), (f), and (i), which were estimated through the calculation of the modeled plasma frequency in (MHz). The ionization rate observed in Figures 11, 12 suggests the occurrences of the low-energy EP (0.5–10 keV) over the SAMA region during the Esa layer generation, as expected the low-energy EP (≥10 keV) occurred due to pitch angle scattering driven by plasmaspheric hiss waves discussed in previous sections. Although the previous studies of hiss waves have been focused on the scattering of electrons of 10 keV - 1 MeV energies, the recent studies (Li J. et al., 2019; Khazanov and Ma 2021) have shown that the hiss waves also can scatter electrons of energies below several keV down to the energies of tens of eV. The Esa layer which occurs in Santa Maria is considerably higher than the Esa layer in Cachoeira Paulista. This behavior can be attributed to the low ionization rate due to the low-energy EP = 5 and 10 keV in Santa Maria. Therefore, we suggest that the low-energy EP ≤ 1 keV is the main ingredient to generate Esa layer detected close to 150 km altitude in Santa Maria, while the low-energy EP ≤ 10 keV is the main ingredient to generate Esa layer detected close to 100-120 km altitude in Cachoeira Paulista.
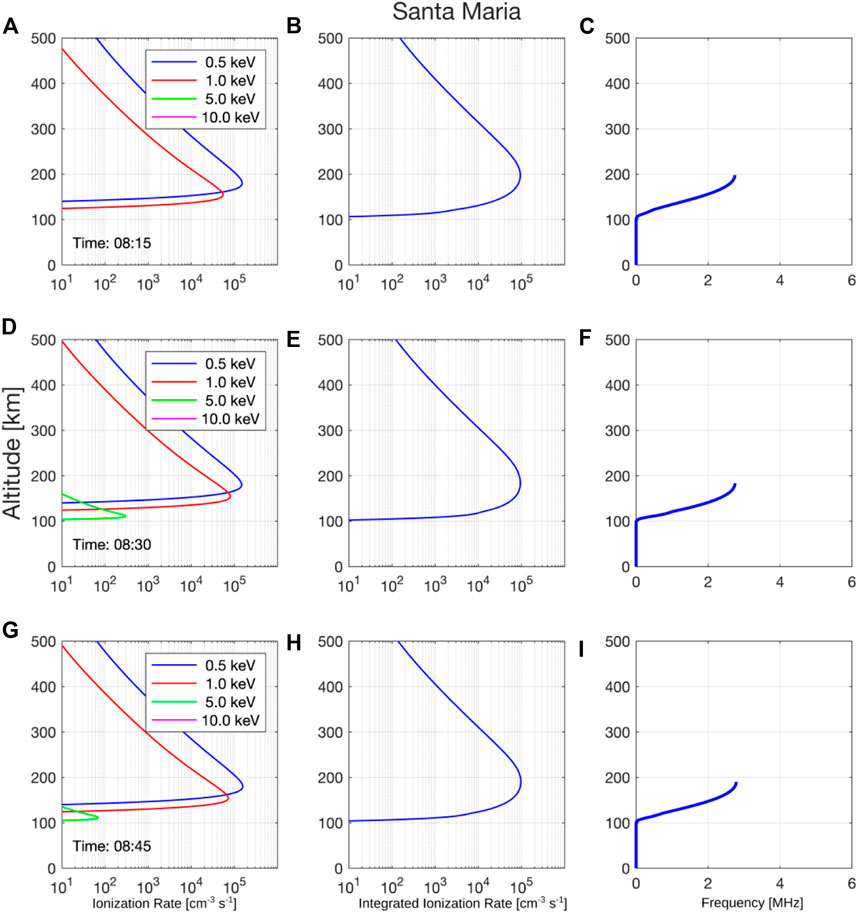
FIGURE 11. Ionization rate altitude profiles panels (A,D,G), ionization rate altitude integrated panels (B,E,H) and frequency range altitude panels (C,F,I) considering the second conjunction for Santa Maria station. The total incident energy of electrons is presented in Figure 10 (top panel). The ionization rate is obtained from empirical model (Fang et al., 2010) considering the total incident energy of electrons presented in Figure 10 (top panel) and the height scale presented in Figure 15 (top panel).
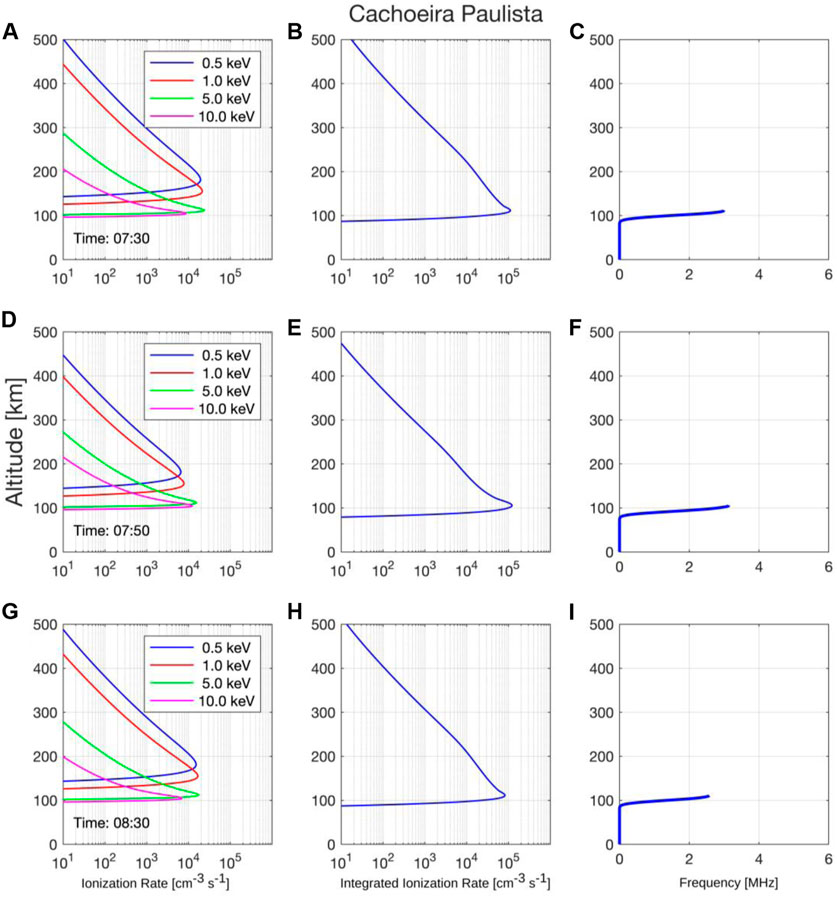
FIGURE 12. Ionization rate altitude profiles panels (A,D,G), ionization rate altitude integrated panels (B,E,H) and frequency range altitude panels (C,F,I) considering the second conjunction for Cachoeira Paulista station. The total incident energy of electrons is presented in Figure 10 (bottom panel). The ionization rate is obtained from empirical model (Fang et al., 2010) considering the total incident energy of electrons presented in Figure 10 (bottom panel) and the height scale presented in Figure 15 (bottom panel).
The ionization rate altitude profiles, ionization rate altitude integrated, and the plasma modeled frequency altitude during the third conjunction are presented in the support information, Supplementary Figure S4 (Santa Maria station) and Supplementary Figure S5 (Cachoeira Paulista station). The ionization rate observed in Supplementary Figure S4, S5 suggests the occurrences of the low-energy electron precipitation over the SAMA region during the third conjunction due to pitch angle scattering driven by plasmaspheric hiss waves.
We can estimate the free parameters (Q0, E0) by comparing these plasma frequencies (MHz) altitude profile modeled with the Esa layers presented in the ionograms, as shown in Figures 13, 14.
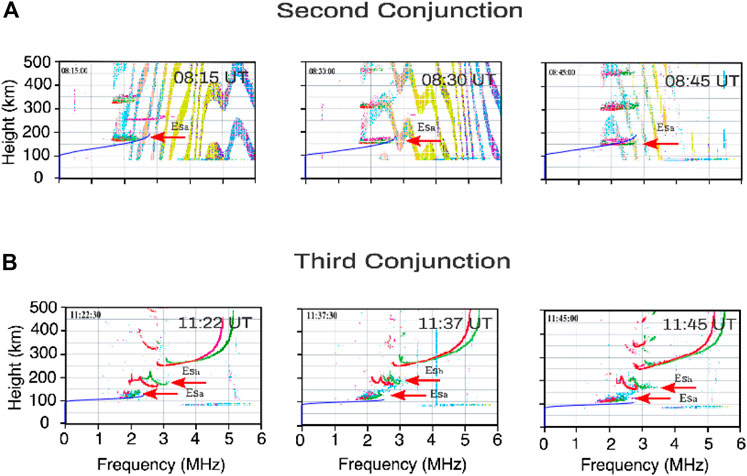
FIGURE 13. Ionograms from Digisonde located at Santa Maria during the second (A), and third (B) conjunctions. The red arrows show the Esa layer presence and the blue line is referent the plasma modeled frequency (MHz) altitude. Unfortunately, the Santa Maria ionograms present high 60 Hz interferences from the street lights used nearby the Digisonde site.
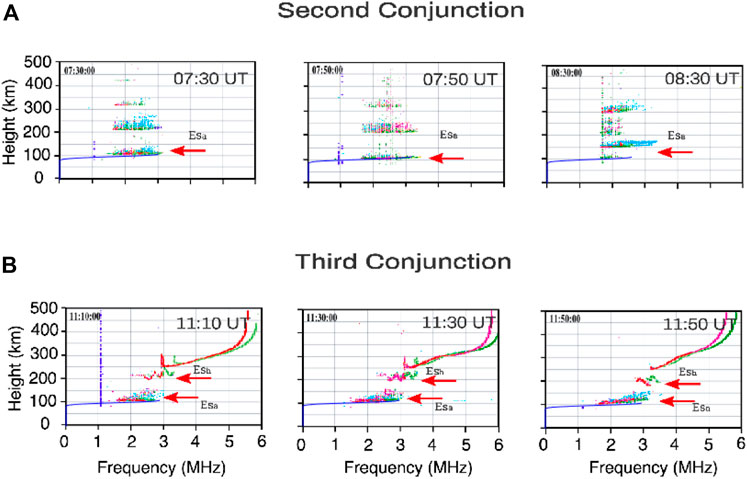
FIGURE 14. Ionograms from Digisonde located at Cachoeira Paulista during the second (A) and third (B) conjunctions. The red arrows show the Esa layer presence and the blue line is referent the plasma modeled frequency (MHz) altitude.
Finally, although the downward movement to be typical in low/mid-latitudes due to the wind shear mechanism (Resende et al., 2017), the inner radiation belt dynamic and the atmospheric ionization over SAMA are highly favorable to the occurrences of the low-energy EP during the second (Figures 13, 14 - middle panels) and third (Figures 13, 14 - bottom panels) conjunctions. It means that this atmospheric ionization over SAMA, especially in 100–150 km altitude, is very similar to the ionized atmosphere in the auroral region during the generation of the Esa layers (Whalen et al., 1971; Buchau et al., 1972; Blagoveshchensky and Borisova, 2000). Therefore, we can suggest that the low-energy EP (≤10 keV) from the inner radiation belt is the main ingredient responsible for generating the Esa layers over Cachoeira Paulista during the R-P at nighttimeFigure 15. Conversely, the low-energy EP (≤1 keV) is the main ingredient responsible for generating the Esa layers over Santa Maria during the R-P at night.
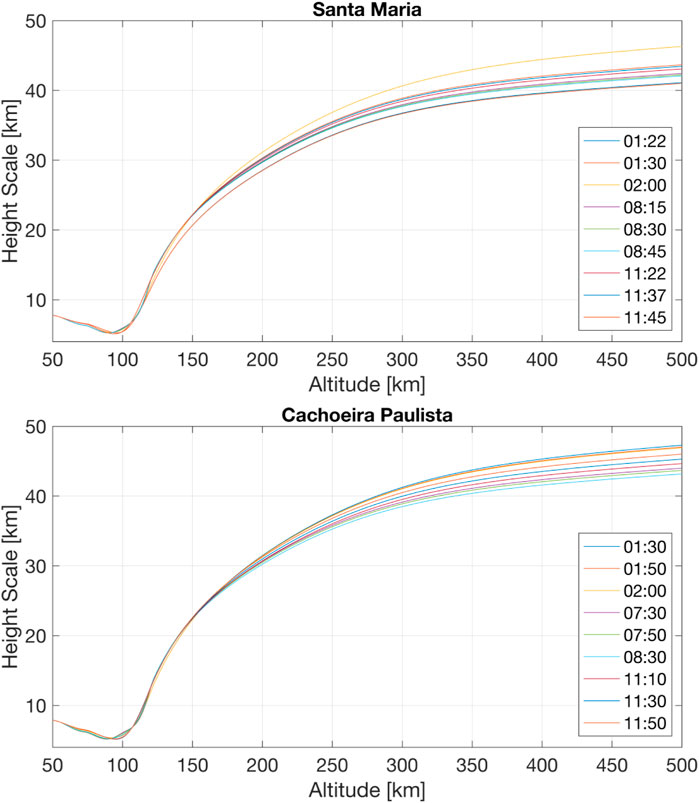
FIGURE 15. Height scale (km) for Santa Maria (top) and Cachoeira Paulista (bottom) stations, considering the three conjunctions.
Concluding remarks
The hiss wave’s power spectral density and the ambient plasma conditions as given by the low values of the frequency ratio fpe/fce, suggests the occurrences of the low-energy EP (≥10 keV) to the atmosphere during the recovery phase of a geomagnetic storm. Additionally, the modeling results (Figure 4D) show that the quasi-linear scattering time scale 1/Daa (10 keV) is below 1 h, especially during the second conjunction. It suggests that the quasi-linear scattering driven by hiss waves is one of the causes of the intensive precipitations of 10 keV electrons to the ionosphere over the SAMA region.
The estimation of the atmospheric ionization induced by low-energy EP over SAMA suggests the deposition of the electrons (≤10 keV) at altitudes 100–120 km. Therefore, we can suggest that the pitch angle scattering driven by hiss waves triggers the dynamic mechanism responsible for the low-energy electron precipitation over the SAMA region that generates and maintains the Esa layer in this low latitude during the recovery phase geomagnetic storm. Otherwise, atmospheric ionization induced by the low-energy EP over SAMA also suggests the deposition of the electrons (≤1 keV) in altitudes from 150 km, which was decisive to the Esa layer occurrence at 150 km in Santa Maria.
The techniques used here, such as the observational and modeled data analyses, contribute to explaining the coupling between the inner radiation belt and the ionized atmosphere over the SAMA region, which was not well understood before. Additionally, the signature of this atypical Esa layer in the Brazilian sites could be used as an indicator of the occurrences of the low-energy electron precipitation over SAMA once the electron detectors onboard of the low orbit satellites are contaminated with the proton flux trapped in the inner belt (e.g., Rodger et al., 2013; Andersson et al., 2014).
Data availability statement
The raw data supporting the conclusions of this article will be made available by the authors, without undue reservation.
Author contributions
LD, LR, OA, CA, and LV contributed to conception and design of the study. VD and JM organized the database. LD, VD, JM, OA, LA, FC, PJ, CM, MA and WG analyzed the Interplanetary medium conditions and magnetospheric conditions. JS, LR, IB, CA, CW, JM, SC, ZL and CD interpreted the ionospheric data. LV modeled the Atmospheric ionization over SAMA. LD wrote the first draft of the manuscript. All authors contributed to manuscript revision, read, and approved the submitted version.
Funding
This research was also supported by the National Natural Science Foundation of China (42074201 and 41674145), by the International Partnership Program of Chinese Academy of Sciences (grants 183311KYSB20200003 and 183311KYSB20200017). MA thanks CNPq/MCTIC (310900/2016-6). LV thanks CNPq/MCTIC (Grants 307404/2016-1), TED-004/2020-AEB and PO-20VB.0009. LA thanks to CNPq/MCTIC (301476/2018-7). IB thanks CNPq/MCTI, grants 405555/2018-0 and 306844/2019-2. JM would like to thank the CNPq/MCTIC (grant 429517/2018-01). SC thanks CAPES/MEC (grant 88887.362982/2019-00). CD thanks CNPq/MCTI by grants 303643/2017-0. OA was supported by NASA grants 80NNSC19K0264, 80NNSC19K0848, 80NSSC20K0218, 80NSSC22K0522, and NSF grant 1914670. Christina Arras acknowledges the support through Deutsche Forschungsgemeinschaft (DFG) within the DFG Priority Program DynamicEarth, SPP 1788.
Acknowledgments
We acknowledge the NASA Van Allen Probes, Harlan E. Spence [PI ECT; University of New Hampshire], Craig Kletzing [PI EMFISIS; University of Iowa] and John R. Wygant [PI EFW; University Minnesota] for use of data. We acknowledge the NASA ACE satellite, Edward Stone [PI ACE; Caltech]. LD, LR, JM, PJ, JM, and WG are grateful for financial support from China-Brazil Joint Laboratory for Space Weather. LD is grateful to Aaron Hendry and Rodger Craig (University of Otago) for the discussions regarding particle precipitation over SAMA using the POES satellite data. LD also thanks Graziela Belmiro (INPE) for the discussions about the outer radiation belt.
Conflict of interest
The authors declare that the research was conducted in the absence of any commercial or financial relationships that could be construed as a potential conflict of interest.
Publisher’s note
All claims expressed in this article are solely those of the authors and do not necessarily represent those of their affiliated organizations, or those of the publisher, the editors and the reviewers. Any product that may be evaluated in this article, or claim that may be made by its manufacturer, is not guaranteed or endorsed by the publisher.
Supplementary material
The Supplementary Material for this article can be found online at: https://www.frontiersin.org/articles/10.3389/fspas.2022.970308/full#supplementary-material
References
Abel, B., and Thorne, R. M. (1998). Electron scattering loss in Earth’s inner magnetosphere: 1. Dominant physical processes. J. Geophys. Res. 103 (A2), 2385–2396. doi:10.1029/97JA02919
Agapitov, O., Artemyev, A. V., Mourenas, D., Mozer, F. S., and Krasnoselskikh, V. (2015). Empirical model of lower band chorus wave distribution in the outer radiation belt. JGR. Space Phys. 120, 10425–10442. doi:10.1002/2015JA021829
Agapitov, O., Mourenas, D., Artemyev, A., Claudepierre, S. G., Hospodarsky, G., and Bonnell, J. W. (2020). Lifetimes of relativistic electrons as determined from plasmaspheric hiss scattering rates statistics: Effects of ωpe/?ce and wave frequency dependence on geomagnetic activity. Geophys. Res. Lett. 47. doi:10.1029/2020gl088052
Agapitov, O., Mourenas, D., Artemyev, A., Hospodarsky, G., and Bonnell, J. W. (2019). Time scales for electron quasi-linear diffusion by lower-band chorus waves: The effects of ωpe/?ce dependence on geomagnetic activity. Geophys. Res. Lett. 0 (0), 6178–6187. doi:10.1029/2019GL083446
Agapitov, O. V., Mourenas, D., Artemyev, A. V., Mozer, F. S., Hospodarsky, G., Bonnell, J., et al. (2018). Synthetic empirical chorus wave model from combined van allen probes and cluster statistics. JGR. Space Phys. 123 (1), 297–314. doi:10.1002/2017JA024843
Albert, J. M., Starks, M. J., Horne, R. B., Meredith, N. P., and Glauert, S. A. (2016). Quasi-linear simulations of inner radiation belt electron pitch angle and energy distributions. Geophys. Res. Lett. 43, 2381–2388. doi:10.1002/2016GL067938
Alken, P., Thébault, E., Beggan, C. D., Amit, H., Aubert, J., Baerenzung, J., et al. (2021). International geomagnetic reference field: The thirteenth generation. Earth Planets Space 73 (1), 49. doi:10.1186/s40623-020-01288-x
Andersson, M. E., Verronen, P. T., Rodger, C. J., Clilverd, M. A., and Wang, S. (2014). Longitudinal hotspots in the mesospheric OH variations due to energetic electron precipitation. Atmos. Chem. Phys. 14 (2), 1095–1105. doi:10.5194/acp-14-1095-2014
Batista, I. S., and Abdu, M. A. (1977). Magnetic storm associated delayed sporadic E enhancements in the Brazilian Geomagnetic Anomaly. J. Geophys. Res. 82 (29), 4777–4783. doi:10.1029/JA082i029p04777
Baumjohann, W., and Treumann, R. A. (2012). Basic space plasma physics: Revised edition. Basic space plasma Physics. Revised Edition. World Scientific. doi:10.1142/P850
Blagoveshchensky, D. V., and Borisova, T. D. (2000). Substorm effects of ionosphere and HF propagation. Radio Sci. 35 (5), 1165–1171. doi:10.1029/1998RS001776
Blake, J. B., Carranza, P. A., Claudepierre, S. G., Clemmons, J. H., Crain, W. R., Dotan, Y., et al. (2013). The magnetic electron ion spectrometer (MagEIS) instruments aboard the radiation belt storm probes (RBSP) spacecraft. Space Sci. Rev. 179, 383–421. doi:10.1007/s11214-013-9991-8
Blum, L. W., Schiller, Q., Li, X., Millan, R., Halford, A., and Woodger, L. (2013). New conjunctive CubeSat and balloon measurements to quantify rapid energetic electron precipitation. Geophys. Res. Lett. 40, 5833–5837. doi:10.1002/2013GL058546
Boardsen, S. A., Hospodarsky, G, B., Kletzing, C. A., Engebretson, M. J., Pfaff, R. F., Wygant, J. R., et al. (2016). Survey of the frequency dependent latitudinal distribution of the fast magnetosonic wave mode from Van Allen Probes Electric and Magnetic Field Instrument and Integrated Science waveform receiver plasma wave analysis. J. Geophys. Res. Space Phys. 121 (4), 2902–2921. doi:10.1002/2015JA021844
Bortnik, J., Thorne, R. M., Ni, B., and Li, J. (2015). Analytical approximation of transit time scattering due to magnetosonic waves. Geophys. Res. Lett. 42, 1318–1325. doi:10.1002/2014GL062710
Bortnik, J., and Thorne, R. M. (2010). Transit time scattering of energetic electrons due to equatorially confined magnetosonic waves. J. Geophys. Res. 115, A07213. doi:10.1029/2010JA015283
Buchau, J., Gasman, G. J., Pike, C. P., Wagner, R. A., and Whalen, J. A. (1972). Precipitation patterns in the Arctic ionosphere determined from ainner radiation beltorne observations. Ann. Geophys. 28, 443–453.
Cai, H.-T., and Ma, S.-Y. (2007). Initial study of inversion method for estimating energy spectra of auroral precipitating particles from ground-based is radar observations. Chin. J. Geophys. 50 (1), 12–21. doi:10.1002/cjg2.1005
Cane, H. V., and Richardson, I. G. (2003). Interplanetary coronal mass ejections in the near-Earth solar wind during 1996–2002. J. Geophys. Res. 108 (A4), 1156. doi:10.1029/2002JA009817
Cao, J. B., Liu, Z. X., Yang, J. Y., Yian, C. X., Wang, Z. G., Zhang, X. H., et al. (2005). First results of low frequency electromagnetic wave detector of TC-2/Double Star program. Ann. Geophys. 23 (8), 2803–2811. doi:10.5194/angeo-23-2803-2005
Chappell, C., Harris, K., and Sharp, G. (1970). A study of the influence of magnetic activity on the location of the plasmapause as measured by OGO 5. J. Geophys. Res. 75 (1), 50–56. doi:10.1029/JA075i001p00050
Chen, L., Maldonado, A., Bortnik, J., Thorne, R. M., Li, J., Dai, L., et al. (2015). Nonlinear bounce resonances between magnetosonic waves and equatorially mirroring electrons. JGR. Space Phys. 120 (8), 6514–6527. doi:10.1002/2015JA021174
Claudepierre, S. G., O'Brien, T. P., Blake, J. B., Fennell, J. F., Roeder, J. L., Clemmons, J. H., et al. (2015). A background correction algorithm for Van Allen Probes MagEIS electron flux measurements. JGR. Space Phys. 120, 5703–5727. doi:10.1002/2015JA021171
Da Silva, L. A., Shi, J., Alves, L. R., Sibeck, D., Souza, V. M., Marchezi, J. P., et al. (2021). Dynamic mechanisms associated with high‐energy electron flux dropout in the Earth’s outer radiation belt under the influence of a coronal mass ejection sheath region. JGR. Space Phys. 126 (1), 2020JA028492. doi:10.1029/2020JA028492
Denardini, C. M., Dasso, S., and Gonzalez-Esparza, J. A. (2016). Review on space weather in Latin America. 2. The research networks ready for space weather. Adv. Space Res. 58 (10), 1940–1959. doi:10.1016/j.asr.2016.03.013
Echer, E., Gonzalez, W. D., Tsurutani, B. T., and Gonzalez, A. L. C. (2008). Interplanetary conditions causing intense geomagnetic storms (Dst ≤ −100 nT) during solar cycle 23 (1996-2006). J. Geophys. Res. 113, A05221. doi:10.1029/2007JA012744
Fang, X., Randall, C. E., Lummerzheim, D., Wang, W., Lu, G., Solomon, S. C., et al. (2010). Parameterization of monoenergetic electron impact ionization. Geophys. Res. Lett. 37, L22106. doi:10.1029/2010GL045406
Goldstein, J. (2006). “Plasmasphere response: Tutorial and review of recent imaging results,” in Solar dynamics and its effects on the heliosphere and Earth (Springer), 203–216. doi:10.1007/978-0-387-69532-7_14
Gonzalez, W. D., Dutra, S. L. G., and Pinto, O. (1987). Middle atmospheric electrodynamic modification by particle precipitation at the South Atlantic Magnetic Anomaly. J. Atmos. Terr. Phys. 49 (4), 377–383. doi:10.1016/0021-9169(87)90032-8
Gonzalez, W. D., Joselyn, J. A., Kamide, Y., Kroehl, H. W., Rostoker, G., Tsurutani, B. T., et al. (1994). What is a geomagnetic storm? J. Geophys. Res. 99, 5771. doi:10.1029/93JA02867
Gonzalez, W. D., Tsurutani, B. T., and Clúa De Gonzalez, A. L. (1999). Interplanetary origin of geomagnetic storms. Space Sci. Rev. 88 (3–4), 529–562. doi:10.1023/a:1005160129098
Green, A., Li, W., Ma, Q., Shen, X.-C., Bortnik, J., and Hospodarsky, G. B. (2020). Properties of lightning generated whistlers based on Van Allen Probes observations and their global effects on radiation belt electron loss. Geophys. Res. Lett. 47, e2020GL089584. doi:10.1029/2020GL089584
Green, J. L., Boardsen, S., Garcia, L., Taylor, W. W., Fung, S. F., and Reinisch, B. W. (2005). On the origin of whistler mode radiation in the plasmasphere. J. Geophys. Res. 110, A03201. doi:10.1029/2004JA010495
Guo, D., Fu, S., Xiang, Z., Ni, B., Guo, Y., Feng, M., et al. (2021). Prediction of dynamic plasmapause location using a neural network. Space weather. 19. doi:10.1029/2020SW002622
Haldoupis, C. (2012). Midlatitude sporadic E. A typical paradigm of atmosphere-ionosphere coupling. Space Sci. Rev. 168, 441–461. doi:10.1007/s11214-011-9786-8
Hartley, D. P., and Denton, M. H. (2014). Solving the radiation belt riddle. Astronomy Geophys. 55 (6), 6.17–6.20. doi:10.1093/astrogeo/atu247
Hartley, D. P., Kletzing, C. A., Santolík, O., Chen, L., and Horne, R. B. (2018). Statistical properties of plasmaspheric hiss from Van Allen Probes observations. JGR. Space Phys. 123, 2605–2619. doi:10.1002/2017JA024593
Horne, R. B., Thorne, R. M., Glauert, S. A., Meredith, N. P., Pokhotelov, D., and Santolík, O. (2007). Electron acceleration in the Van Allen radiation belts by fast magnetosonic waves. Geophys. Res. Lett. 34, L17107. doi:10.1029/2007GL030267
Hunsucker, R. D., and Owren, L. (1962). Auroral sporadic-E ionization. J. Res. Natl. Bureau Standards-D. Radio Propag. 66D (5), 581. doi:10.6028/jres.066d.057
Inan, U. S., Walt, M., Voss, H. D., and Imhof, W. L. (1989). Energy spectra and pitch angle distributions of lightning-induced electron precipitation: Analysis of an event observed on the S81-1 (SEEP) satellite. J. Geophys. Res. 94, 1379–1401. doi:10.1029/ja094ia02p01379
Khazanov, G. V., and Ma, Q. (2021). Dayside low energy electron precipitation driven by hiss waves in the presence of ionospheric photoelectrons. JGR. Space Phys. 126, e2021JA030048. doi:10.1029/2021JA030048
Kirkwood, S., and Nilsson, H. (2000). High-latitude sporadic-E and other thin layers – the role of magnetospheric electric fields. Space Sci. Rev. 91, 579–613. doi:10.1023/A:1005241931650
Kletzing, C. A., Kurth, W. S., Acuna, M., MacDowall, R. J., Torbert, R. B., Averkamp, T., et al. (2013). The electric and magnetic field instrument suite and integrated science (EMFISIS) on RBSP. Space Sci. Rev. 179 (1–4), 127–181. doi:10.1007/s11214-013-9993-6
Kumluca, A., Tulunay, E., Topalii, I., and Tulunay, Y. (1999). Temporal and spatial forecasting of ionospheric critical frequency using neural networks. Radio Sci. 34 (6), 1497–1506. doi:10.1029/1999rs900070
Kurth, W. S., De Pascuale, S., Faden, J. B., Kletzing, C. A., Hospodarsky, G. B., Thaller, S., et al. (2015). Electron densities inferred from plasma wave spectra obtained by the Waves instrument on Van Allen Probes. JGR. Space Phys. 120, 904–914. doi:10.1002/2014JA020857
Kuznetsov, V. D. (2007). From the geophysical to heliophysical year: The results of the coronas-F project. Russ. J. Earth Sci. 9, 1–14. doi:10.2205/2007ES000276
Laakso, H., Junginger, H., Roux, A., Schmidt, R., and de Villedary, C. (1990). Magnetosonic waves abovefc(H+) at geostationary orbit: GEOS 2 results. J. Geophys. Res. 95, 10609. doi:10.1029/ja095ia07p10609
Lei, M., Xie, L., Li, J., Pu, Z., Fu, S., Ni, B., et al. (2017). The radiation belt electron scattering by magnetosonic wave: Dependence on Key parameters. J. Geophys. Res. Space Phys. 122 (12), 12338–12352. doi:10.1002/2016JA023801
Lemaire, J. F., Gringauz, K. I., Carpenter, D. L., and Bassolo, V. (1988). The Earth’s Plasmasphere. New York: Cambridge Univ. Press
Li, J., Ma, Q., Bortnik, J., Li, W., An, X., Reeves, G. D., et al. (2019a). Parallel acceleration of suprathermal electrons caused by whistler-mode hiss waves. Geophys. Res. Lett. 46, 12675. doi:10.1029/2019GL085562
Li, J., Ni, B., Xie, L., Pu, Z., Bortnik, J., Thorne, R. M., et al. (2014). Interactions between magnetosonic waves and radiation belt electrons: Comparisons of quasi-linear calculations with test particle simulations. Geophys. Res. Lett. 41, 4828–4834. doi:10.1002/2014GL060461
Li, W., Ma, Q., Thorne, R. M., Bortnik, J., Kletzing, C. A., Kurth, W. S., et al. (2015). Statistical properties of plasmaspheric hiss derived from Van Allen Probes data and their effects on radiation belt electron dynamics. JGR. Space Phys. 120 (5), 3393–3405. doi:10.1002/2015JA021048
Li, W., Shen, X. C., Ma, Q., Capannolo, L., Shi, R., Redmon, R. J., et al. (2019b). Quantification of energetic electron precipitation driven by plume whistler mode waves, plasmaspheric hiss, and exohiss. Geophys. Res. Lett. 46 (7), 3615–3624. doi:10.1029/2019GL082095
Liu, X., Liu, W., Cao, J. B., Fu, H. S., Yu, J., and Li, X. (2015). Dynamic plasmapause model based on THEMIS measurements. J. Geophys. Res. Space Phys. 120, 10543–10556. doi:10.1002/2015JA021801
Lyons, L. R., Thorne, R. M., and Kennel, C. F. (1972). Pitch-angle diffusion of radiation belt electrons within the plasmasphere. J. Geophys. Res. 77 (19), 3455–3474. doi:10.1029/ja077i019p03455
Ma, Q., Li, W., Thorne, R. M., and Angelopoulos, V. (2013). Global distribution of equatorial magnetosonic waves observed by THEMIS. Geophys. Res. Lett. 40 (10), 1895–1901. doi:10.1002/grl.50434
Ma, Q., Li, W., Thorne, R. M., Bortnik, J., Kletzing, C. A., Kurth, W. S., et al. (2016). Electron scattering by magnetosonic waves in the inner magnetosphere. JGR. Space Phys. 121 (1), 274–285. doi:10.1002/2015JA021992
Ma, Q., Li, W., Thorne, R. M., Bortnik, J., Reeves, G. D., Kletzing, C. A., et al. (2016b). Characteristic energy range of electron scattering due to plasmaspheric hiss. JGR. Space Phys. 121, 11,737–11,749. doi:10.1002/2016JA023311
Maldonado, A. A., Chen, L., Claudepierre, S. G., Bortnik, J., Thorne, R. M., and Spence, H. (2016). Electron butterfly distribution modulation by magnetosonic waves. Geophys. Res. Lett. 43 (7), 3051–3059. doi:10.1002/2016GL068161
Maldonado, A. A., and Chen, L. (2018). On the diffusion rates of electron bounce resonant scattering by magnetosonic waves. Geophys. Res. Lett. 45 (8), 3328–3337. doi:10.1002/2017GL076560
Malykhin, A. Y., Grigorenko, E. E., Shklyar, D. R., Panov, E. V., Le Contel, O., Avanov, L., et al. (2021). Characteristics of resonant electrons interacting with whistler waves in the nearest dipolarizing magnetotail. JGR. Space Phys. 126, e2021JA029440. doi:10.1029/2021JA029440
Mauk, B. H., Fox, N. J., Kanekal, S. G., Kessel, R. L., Sibeck, D. G., and Ukhorskiy, A. (2013). Science objectives and rationale for the radiation belt storm probes mission. Space Sci. Rev. 179 (1–4), 3–27. doi:10.1007/s11214-012-9908-y
Meredith, N. P., Horne, R. B., Clilverd, M. A., Horsfall, D., Thorne, R. M., and Anderson, R. R. (2006). Origins of plasmaspheric hiss. J. Geophys. Res. 111 (9), A09217. doi:10.1029/2006JA011707
Meredith, N. P., Horne, R. B., Glauert, S. A., and Anderson, R. R. (2007). Slot region electron loss timescales due to plasmaspheric hiss and lightning-generated whistlers. J. Geophys. Res. 112, A08214. doi:10.1029/2007JA012413
Meredith, N. P., Horne, R. B., Thorne, R. M., Summers, D., and Anderson, R. R. (2004). Substorm dependence of plasmaspheric hiss. J. Geophys. Res. 109, A06209. doi:10.1029/2004JA010387
Moro, J., Xu, J., Denardini, C. M., Resende, L. C. A., Silva, R. P., Liu, Z., et al. (2019). On the sources of the ionospheric variability in the South American magnetic anomaly during solar minimum. J. Geophys. Res. Space Phys. 124 (9), 7638–7653. doi:10.1029/2019JA026780
Moro, J., Xu, J., Denardini, C. M., Resende, L. C. A., Da Silva, L. A., Chen, S. S., et al. (2022). Different Sporadic-E (Es) layer types development during the August 2018 geomagnetic storm: Evidence of Auroral Type (Esa) over the SAMA region. J. Geophys. Res. Space Phys. 127 (2). doi:10.1029/2021JA029701
Nath, N., Steen Mikkelsen, I., and Stockflet Jørgensen, T. (1980). On the formation of high latitude Es-layers. J. Atmos. Terr. Phys. 42 (9–10), 841–852. doi:10.1016/0021-9169(80)90088-4
Nikolaeva, V., Gordeev, E., Sergienko, T., Makarova, L., and Kotikov, A. (2021). AIM-E: E-Region auroral ionosphere model. Atmosphere 12, 748. doi:10.3390/atmos12060748
Nishino, M., Makita, K., Yumoto, K., Miyoshi, Y., Schuch, N. J., and Abdu, M. A. (2006). Energetic particle precipitation in the brazilian geomagnetic anomaly during the ‘‘Bastille day storm” of july 2000. Earth Planets Space 58 (5), 607–616. doi:10.1186/bf03351958
Paulikas, G. A. (1975). Precipitation of particles at low and middle latitudes. Rev. Geophys. 13, 709–734. doi:10.1029/rg013i005p00709
Pierrard, V., Khazanov, G., Cabrera, J., and Lemaire, J. (2008). Influence of the convection electric field models on predicted plasmapause positions during magnetic storms. J. Geophys. Res. 113 (A8). doi:10.1029/2007JA012612
Piggott, W. R., and Rawer, K. (1978). U.R.S.I. Handbook of ionogram interpretation and reduction. Second edition. Boulder, Colorado: World Data Center A for Solar-Terrestrial Physics. Report UAG-23NOAA.
Pinto, O., and Gonzalez, W. D. (1989). Energetic electron precipitation at the South atlantic magnetic anomaly: a review. J. Atmos. Terr. Phys. 51 (5), 351–365. doi:10.1016/0021-9169(89)90117-7
Pinto, O., Gonzalez, W. D., and Gonzalez, A. (1989). Time variations of X Ray fluxes at the South Atlantic Magnetic Anomaly in association with a strong geomagnetic storm. J. Geophys. Res. 94, 17275–17280. doi:10.1029/ja094ia12p17275
Ponomarev, E. A., Sedykh, P. A., and Urbanovich, V. D. (2006). Bow shock as a power source for magnetospheric processes. J. Atmos. Solar-Terrestrial Phys. 68 (6), 685–690. doi:10.1016/j.jastp.2005.11.007
Rees, M. H. (1963). Auroral ionization and excitation by incident energetic electrons. Planet. Space Sci. 11 (10), 1209–1218. doi:10.1016/0032-0633(63)90252-6
Reinisch, B. W., Galkin, I. A., Khmyrov, G. M., Kozlov, A. V., Bibl, K., Lisysyan, I. A., et al. (2009). New Digisonde for research and monitoring applications. Radio Sci. 44 (1), RS0A24. doi:10.1029/2008rs004115
Reinisch, B. W., Haines, D. M., Bibl, K., Galkin, I., Huang, X., Kitrosser, D. F., et al. (1997). Ionospheric sounding in support of over-the-horizon radar. Radio Sci. 32 (4), 1681–1694. doi:10.1029/97rs00841
Resende, L. C. A., Batista, I. S., Denardini, C. M., Batista, P. P., Carrasco, A. J., Andrioli, V. F., et al. (2017). Simulations of blanketing sporadic E-layer over the Brazilian sector driven by tidal winds. J. Atmos. Solar-Terrestrial Phys. 154, 104–114. doi:10.1016/j.jastp.2016.12.012
Resende, L. C. A., Denardini, C. M., and Batista, I. S. (2013). Abnormal fb Es enhancements in equatorial Es layers during magnetic storms of solar cycle 23. J. Atmos. Solar-Terrestrial Phys. 102, 228–234. doi:10.1016/j.jastp.2013.05.020
Richardson, I. G., and Cane, H. V. (2010). Near-earth interplanetary coronal mass ejections during solar cycle 23 (1996 - 2009): Catalog and summary of properties. Sol. Phys. 264 (1), 189–237. doi:10.1007/s11207-010-9568-6
Richardson, I. G., and Cane, H. V. (2012). Solar wind drivers of geomagnetic storms during more than four solar cycles. J. Space Weather Space Clim. 2, A01. doi:10.1051/swsc/2012001
Rodger, C. J., Kavanagh, A. J., Clilverd, M. A., and Marple, S. R. (2013). Comparison between POES energetic electron precipitation observations and riometer absorptions: Implications for determining true precipitation fluxes. J. Geophys. Res. Space Phys. 118 (12), 7810–7821. doi:10.1002/2013JA019439
Roederer, J. G. (1967). On the adiabatic motion of energetic particles in a model magnetosphere. J. Geophys. Res. 72 (3), 981–992. doi:10.1029/jz072i003p00981
Russell, C. T., Holzer, R. E., and Smith, E. J. (1969). OGO 3 observations of ELF noise in the magnetosphere: 1. Spatial extent and frequency of occurrence. J. Geophys. Res. 74 (3), 755–777. doi:10.1029/ja074i003p00755
Santolík, O., Parrot, M., and Lefeuvre, F. (2003). Singular value decomposition methods for wave propagation analysis. Radio Sci. 38 (1), 1010. doi:10.1029/2000RS002523
Santolík, O., Pickett, J. S., Gurnett, D. A., Maksimovic, M., and Cornilleau-Wehrlin, N. (2002). Spatiotemporal variability and propagation of equatorial noise observed by Cluster. J. Geophys. Res. 107, SMP 43-51–SMP 43-48. doi:10.1029/2001JA009159
Santos, A. M., Abdu, M. A., Souza, J. R., Sobral, J. H. A., Batista, I. S., and Denardini, C. M. (2016). Storm time equatorial plasma bubble zonal drift reversal due to disturbance Hall electric field over the Brazilian region. J. Geophys. Res. Space Phys. 121, 5594–5612. doi:10.1002/2015JA022179
Shklyar, D., and Matsumoto, H. (2009). Oblique whistler-mode waves in the inhomogeneous magnetospheric plasma: Resonant interactions with energetic charged particles. Surv. Geophys. 30, 55–104. doi:10.1007/s10712-009-9061-7
Stone, E. C., Frandsen, A. M., Mewaldt, R. A., Christian, E. R., Margolies, D., Ormes, J. F., et al. (1998). The advanced composition explorer. Space Sci. Rev. 86 (1/4), 1–22. doi:10.1023/A:1005082526237
Thomas, N., Shiokawa, K., Miyoshi, Y., Kasahara, Y., Shinohara, I., Kumamoto, A., et al. (2021). Investigation of small scale electron density irregularities observed by the Arase and Van Allen Probes satellites inside and outside the plasmasphere. JGR. Space Phys. 126, e2020JA027917. doi:10.1029/2020JA027917
Tsurutani, B. T., Smith, E. J., and Thorne, R. M. (1975). Electromagnetic hiss and relativistic electron losses in the inner zone. J. Geophys. Res. 80, 600–607. doi:10.1029/ja080i004p00600
Watt, C. E. J., Allison, H. J., Meredith, N. P., Thompson, R. L., Bentley, S. N., Rae, I. J., et al. (2019). Variability of quasilinear diffusion coefficients for plasmaspheric hiss. J. Geophys. Res. Space Phys. 124, 8488–8506. doi:10.1029/2018JA026401
Whalen, J. A., Buchau, J., and Wagner, R. A. (1971). Airborne ionospheric and optical measurements of noontime aurora. J. Atmos. Terr. Phys. 33 (4), 661–678. doi:10.1016/0021-9169(71)90066-3
Whitehead, J. D. (1970). Production and prediction of sporadic E. Rev. Geophys. 8 (1), 65. doi:10.1029/RG008i001p00065
Wygant, J. R., Bonnell, J. W., Goetz, K., Ergun, R. E., Mozer, F. S., Bale, S. D., et al. (2013). The electric field and waves instruments on the radiation belt storm probes mission. Space Sci. Rev. 179 (1–4), 183–220. doi:10.1007/s11214-013-0013-7
Xiao, F., Yang, C., Su, Z., Zhou, Q., He, Z., He, Y., et al. (2015). Wave-driven butterfly distribution of Van Allen belt relativistic electrons. Nat. Commun. 6 (1), 8590. doi:10.1038/ncomms9590
Yahnin, A. G., Titova, E. E., Demekhov, A. G., Yahnina, T. A., Popova, T. A., Lyubchich, A., et al. (2019). Simultaneous observations of EMIC waves, ELF/VLF waves, and energetic particle precipitation during multiple compressions of the magnetosphere. Geomagn. Aeron. 59, 668–680. doi:10.1134/S0016793219060148
Yu, B., Scott, C. J., Xue, X., Yue, X., and Dou, X. (2020). Derivation of global ionospheric Sporadic E critical frequency ( fo Es) data from the amplitude variations in GPS/GNSS radio occultations. R. Soc. Open Sci. 7, 200320. doi:10.1098/rsos.200320
Zhelavskaya, I. S., Spasojevic, M., S hprits, Y. Y., and Kurth, W. S. (2016). Automated determination of electron density from electric field measurements on the Van Allen Probes spacecraftfield measurements on the Van Allen Probes spacecraft. JGR. Space Phys. 121, 4611–4625. doi:10.1002/2015JA022132
Keywords: inner radiation belt, auroral-type sporadic E-layers, South American Magnetic Anomaly, hiss waves, magnetosonic waves, wave-particle interaction, ionosphere
Citation: Da Silva LA, Shi J, Resende LCA, Agapitov OV, Alves LR, Batista IS, Arras C, Vieira LE, Deggeroni V, Marchezi JP, Wang C, Moro J, Inostroza A, Li H, Medeiros C, Cardoso FR, Jauer P, Alves MV, Chen SS, Liu Z, Denardini CM and Gonzalez W (2022) The role of the inner radiation belt dynamic in the generation of auroral-type sporadic E-layers over south American magnetic anomaly. Front. Astron. Space Sci. 9:970308. doi: 10.3389/fspas.2022.970308
Received: 15 June 2022; Accepted: 17 August 2022;
Published: 28 September 2022.
Edited by:
Jaroslav Chum, Institute of Atmospheric Physics (ASCR), CzechiaReviewed by:
David R. Shklyar, Space Research Institute (RAS), RussiaZbysek Mosna, Institute of Atmospheric Physics (ASCR), Czechia
Copyright © 2022 Da Silva, Shi, Resende, Agapitov, Alves, Batista, Arras, Vieira, Deggeroni, Marchezi, Wang, Moro, Inostroza, Li, Medeiros, Cardoso, Jauer, Alves, Chen, Liu, Denardini and Gonzalez. This is an open-access article distributed under the terms of the Creative Commons Attribution License (CC BY). The use, distribution or reproduction in other forums is permitted, provided the original author(s) and the copyright owner(s) are credited and that the original publication in this journal is cited, in accordance with accepted academic practice. No use, distribution or reproduction is permitted which does not comply with these terms.
*Correspondence: L. A. Da Silva, bGlnaWEuYWx2ZXMwMUBnbWFpbC5jb20=