MHD simulation of rapid change of photospheric magnetic field during solar eruption caused by magnetic reconnection
 Xinkai Bian1
  Chaowei Jiang1,2*
- 1Shenzhen Key Laboratory of Numerical Prediction for Space Storm, Institute of Space Science and Applied Technology, Harbin Institute of Technology, Shenzhen, China
- 2Key Laboratory of Solar Activity and Space Weather, National Space Science Center, Chinese Academy of Sciences, Beijing, China
It has been well observed that the horizontal component of the magnetic field at photosphere changes rapidly and irreversibly after solar eruptions. Specifically, the horizontal magnetic field near the polarity inversion line increases substantially, while that near the center of the magnetic polarity decreases. Such a phenomenon is considered as the dynamic feedback from the corona to the photosphere, but the underlying mechanism remains in debate. Here based on a recent magnetohydrodynamics (MHD) simulation of homologous eruptions initiated by magnetic reconnection, we analyzed the rapid changes of the horizontal magnetic field, the magnetic inclination angle, the Lorentz force and as well as the derivative variation of the horizontal magnetic field. The simulation reproduces a pattern of rapid evolution of the horizontal field during the eruptions in agreement with typical observations. Our analysis suggests the physical reasons for this phenomenon: 1) The magnetic field near the polarity inversion line becomes more horizontal after flares due to the compression of the downward outflow of flare reconnection, and accordingly the magnetic inclination angle decreases and the downward Lorentz force increases; 2) The magnetic field near the center of the magnetic polarities become more vertical mainly due to the expansion effect of the velocity divergence term, and as a result the magnetic inclination angle and the upward Lorentz force increase.
1 Introduction
Solar eruptions, such as flares, filament eruptions and coronal mass ejections (CME), are essentially the result of rapid release of free magnetic energy in the Sun’s corona (Antiochos et al., 1999; Pontin and Priest, 2022). With magnetic flux emergence and photospheric surface motions, the magnetic energy and magnetic helicity are transported from below the photosphere into the corona at a time scale of days (Berger, 1984; Wiegelmann et al., 2012), and during eruptions parts of the energy and helicity are impulsively converted into plasma heating and acceleration at time scale of a few minutes (Hirayama, 1974), mainly through magnetic reconnection that occurs when a current sheet is formed in the corona and becomes thin enough. Since the plasma density and pressure on the photosphere are far greater than those in the corona, the footpoints of the coronal magnetic field lines are assumed to be anchored on the photosphere and passively dragged by the photospheric surface motions. Therefore, in principle the variation of the photospheric magnetic field during eruptions, for which the time scale is much shorter than that of typical motions at the photosphere, should be very small. However, observations show unambiguously that through major eruptions, the horizontal magnetic field of the photosphere undergoes a fast, step-wise like irreversible change (Sudol and Harvey, 2005; Wang, 2006; Sun and Norton, 2017; Inoue et al., 2018). Such a counterintuitive phenomenon is dubbed by Aulanier (2016) as a “tail wags the dog” problem and has attracted a lot of attentions in the solar physics community.
This phenomenon was first discovered in the early 1990s, as Caltech solar group processed BBSO data (Wang, 1992; Wang et al., 1994) and concluded that the change of the horizontal magnetic field is dominant in the change of the vector of magnetic field relative to the radial magnetic field. More and more observations show that the horizontal magnetic field of the photosphere changes rapidly after the flare and CME (Pevtsov et al., 1995; Cameron and Sammis, 1999; Petrie and Sudol, 2010). In general, the line-of-sight magnetic flux on the disk-ward side of the AR decreases, while the limb-ward flux increases (Spirock et al., 2002; Wang et al., 2002; Wang and Liu, 2010; Li et al., 2011), indicating a more horizontal magnetic configuration near the polarity inversion line (PIL). The pattern is consistent with the observed darkening of the inner penumbrae and weakening of the outer penumbrae in δ-sunspots (Liu et al., 2005). Besides, the step-wise change of the horizontal component of the magnetic field often occurs before the soft X-ray (SXR) peak (Kosovichev, 2011; Cliver et al., 2012; Johnstone et al., 2012; Burtseva et al., 2015; Petrie, 2019).
Hudson et al. (2008) proposed the implosion theory to explain this rapid change: the rapid release of magnetic energy (equivalent to a reduction of magnetic pressure) in the flaring core region breaks the local Lorentz force balance, thus the downward Lorentz force will act on the photosphere and ultimately change the horizontal magnetic field of the photosphere. Li et al. (2011) calculated the horizontal magnetic field, magnetic inclination angle, and Lorentz force near PIL during an eruption and found that before the peak of the soft X-ray, the horizontal magnetic field began to increase violently, the downward Lorentz force increased rapidly, and the inclination of the magnetic field decreased sharply. These results show that the magnetic field near the PIL becomes horizontal due to strong compression, which is consistent with Hudson et al. (2008). In addition, Wang et al. (2012) analyzed the magnetic shear angle near the PIL and found that after the flare, the shear effect near the PIL was significantly enhanced. In contrast, the horizontal magnetic field near the center of the magnetic polarity is obviously weakened after the eruption. The upward Lorentz force and the rapid increase of the magnetic inclination angle indicate that the magnetic field near the center of the magnetic polarity becomes more vertical. However, since the computation of the Lorentz force is directly based on the horizontal magnetic field, it is still not clear whether the Lorentz force changes the magnetic field or Lorentz force variation is a consequence of the changes of the magnetic field.
Recently, by analysis of an MHD simulation of an solar eruption initiated by torus instability of a magnetic flux rope, Barczynski et al. (2019) pointed out that the rapid change of the photospheric field is due to the effect of flare reconnection outflow through ideal magnetic induction equation
In this paper, we attempt to explain the rapid change of the horizontal magnetic field based on our recent MHD model of homologous eruptions initiated by magnetic reconnection (Bian et al., 2022). Our analysis is developed by using directly the magnetic induction equation at the bottom boundary and by quantifying in details the different terms causing the variations of the magnetic field there. In the following, we will first show the MHD model along with the initial and boundary conditions and the analysis method in Section 2. Then the analysis and results of the regions with significant changes in the horizontal magnetic field are shown in Section 3. Finally, the summary and discussions are given in Section 4.
2 MHD model and analysis method
We analyze the rapid change of photospheric magnetic field during the flare in an MHD simulation of homologous eruptions (Bian et al., 2022). The simulation demonstrated that homologous solar eruptions can be efficiently produced by recurring formation and disruption of a coronal current sheet as driven by the continuous shearing of the same PIL within a single bipolar configuration. The initiated mechanism of these homologous solar eruption is referred to as the BASIC mechanism (Jiang et al., 2021), where BASIC is the abbreviation of the keywords, a Bipolar magnetic Arcade as sheared evolves quasi-Statically and forms Internally a Current sheet.
2.1 MHD model and the simulation
The MHD equations of the simulation is solved using DARE–MHD model (Jiang et al., 2016), which uses the conservation element and solution element (CESE) method implemented on an adaptive mesh refinement (AMR) grid (Feng et al., 2010; Jiang et al., 2010). The computational domain spans a large Cartesian box with both x and y extending [−270, 270] and z ∈ [0, 540] Mm. The photosphere is assumed to be a line-tied boundary at the bottom surface, i.e., the z = 0 plane. The full volume is resolved by a block-structured grid with AMR in which the base resolution is Δ = 2.88 Mm, and the highest resolution is Δ = 360 km which is used to capture the formation process of the current sheet and the reconnection. In our code, all the variables are specified on the grid nodes (i.e., corners of cells), and on the boundary surfaces no ghost cell is used. For instance, the photospheric magnetic field is given exactly at the bottom surface, i.e., the z = 0 surface. Since the different blocks have different resolutions, we use different timesteps on different blocks, and the timesteps are directly proportional to the refinement level. Specfically, the timesteps Δt of a block is defined as a monotonic function of the physical scale,
The simulation starts with a potential field and is continually driven by a constant, rotational flows at each magnetic polarity at the bottom surface. The rotational flow is defined as
with ψ given by
In our simulation, we directly solve the ideal magnetic induction equation
on the bottom surface, thus minimizing the numerical errors introduced by any inappropriate treatment of the boundary conditions. We solve this equation using second-order difference in space and forward difference in time. On the bottom boundary, we first compute v ×B, and then we compute the convection term ∇ × (v ×B) using central difference in the horizontal direction and one-sided second-order difference in the vertical direction since we used no ghost cell. With this setup, we can self-consistently update the horizontal magnetic field and simulate the line-tied effect on the photosphere, which is the basis for the successful implementation of the BASIC mechanism (Jiang et al., 2021).
Our simulation shows three eruptions, the onset of these eruptions time is t = 78, 123, 175, respectively (the time unit is τ = 105 s), and all eruptions are initiated by the reconnection of the core current sheet, as shown in Figure 1. When the eruption starts, the magnetic energy drops rapidly, despite the continual injection of the Poynting flux through the bottom surface, while the kinetic energy impulsively rises. The reconnection changes the sheared magnetic arcade into a magnetic flux rope from the tip of the current sheet, and makes it expand and rise rapidly, which finally leaves the computational volume. After the onset of each eruption, the current sheet will gradually rise and make the reconnection weaken. As a result, the magnetic energy release rate gradually becomes less than the rate of energy injection from the bottom surface, and the magnetic energy in the system starts to be restored until it is released in the next eruption. Obviously, each eruption does not release all of the free magnetic energy, leaving a large amount in the post-flare arcade below the erupting flux rope. Thus, a new current sheet can be more easily formed by the further shearing of this arcade than by the shearing of a potential field arcade, which is favorable for initiating the next eruption.
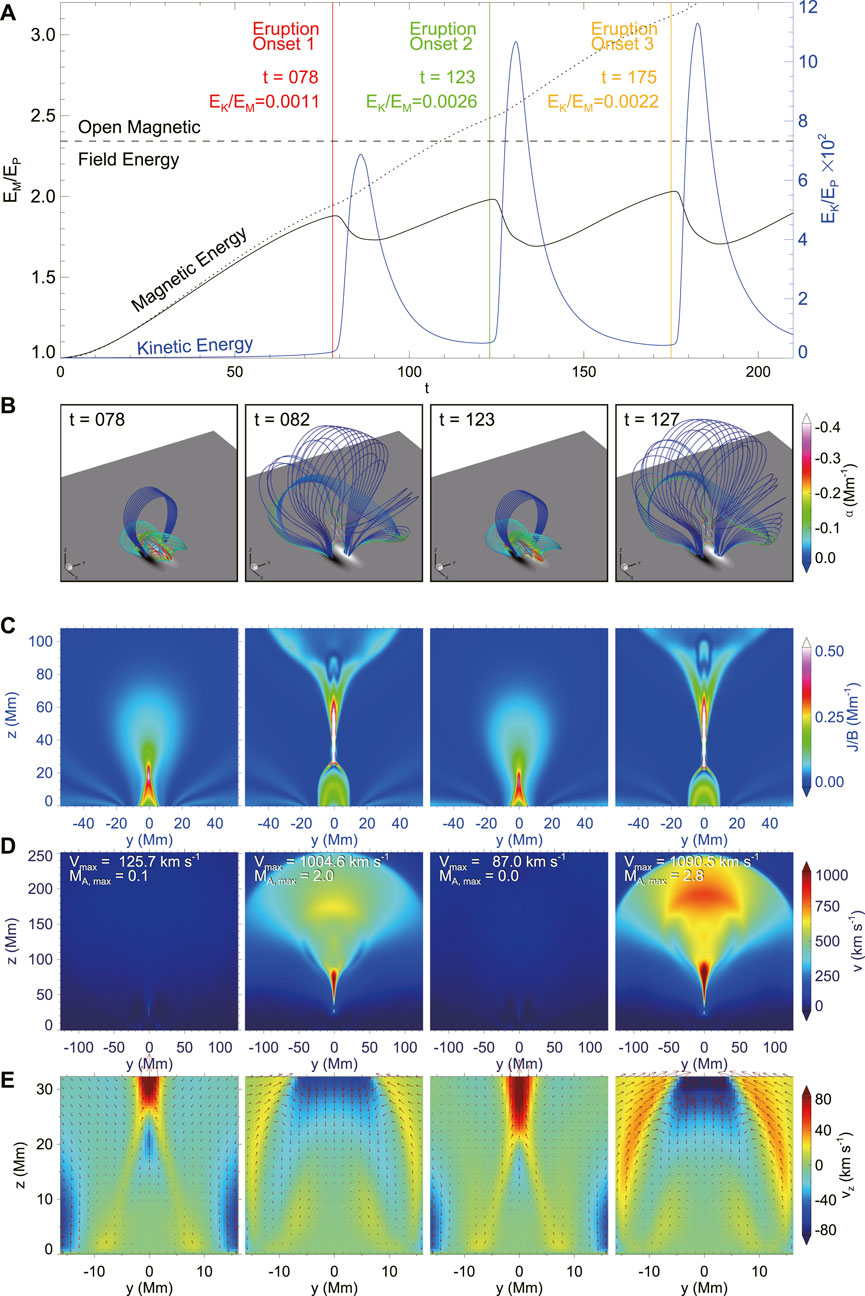
FIGURE 1. The simulation of homologous eruptions. (A), Temporal evolution of magnetic energy (black) and kinetic energy (blue) in the simulation. The red, green, and orange lines denote the onset of three different eruptions, respectively. The dotted curve shows the energy injected into the volume (that is, a time integration of total Poynting flux) from the bottom boundary through the surface flow. The horizontal dashed line denoted the value of the magnetic energy for an open force-free field with the same magnetic flux distribution on the bottom surface. (B), A 3D prospective view of magnetic field lines. The colored thick lines represent magnetic field line and the colors denote the value of a nonlinear force-free factor defined as α = J ⋅ B/B2. (C), Distribution of current density, J, normalized by magnetic field strength, B, on the vertical cross section, that is, the x = 0 slice. (D), Distribution of velocity on the central cross section, i.e., the x = 0 slice. The largest velocity and Alfv
In this simulation, we used two types of side (and top) boundary conditions according to the evolution phase. Before the onset of the first eruption (that is, t⩽76), we fixed the plasma density, temperature and velocity. The tangential components of the magnetic field are linearly extrapolated from the inner points, and the normal component is modified according to the divergence-free condition. This setting minimizes the influence of these numerical boundaries on the computation. Then in the subsequent process (t > 76), the plasma density, temperature, velocity, and the tangential components of the magnetic field are given by the zero-gradient extrapolation from the inner points, and meanwhile the normal component of the magnetic field is also modified according to the divergence-free condition. This allows the outflowing plasma and magnetic field in the volume to pass freely out of the boundaries without reflection during the eruption. For a detailed description of simulation, the readers are referred to Bian et al. (2022).
2.2 The analysis method
We focus on the relevant physical quantities and geometric characteristic related to the evolution of magnetic field at the bottom boundary in the simulation of the three homologous eruptions. In Section 3.1, we analyze the regions with significant changes in the horizontal magnetic field Bh
where i denotes the grid point, and n is the number of grids in the calculation area. Note that the magnetic inclination angle is negatively correlated with the horizontal magnetic field since Bz is not changed in our simulation and thus
Similar to what was conducted by Fisher et al. (2012), we also calculate the inward Lorentz forces Fz, and the horizontal force Fh:
where A denotes the bottom surface. We also discuss the effect of Lorentz forces on the magnetic field lines in these regions and the correlation between Fz, Fh, and Bh.
Finally and most importantly, we use the magnetic induction equation to analyze the derivative variation of the horizontal magnetic field ∂Bh/∂t and pin down the physical reason for the rapid changes of the horizontal magnetic field. By combining the derivative of the horizontal magnetic field with respect to time:
and the magnetic induction equation:
we get
The right side of the formula corresponds to −B(∇ ⋅v), (B ⋅∇)v, and −(v ⋅∇)B from top to bottom. These three terms represent the compression or expansion of the magnetic field lines, the change of magnetic field caused by the shear effect of the rotational flow, and the change of the magnetic field caused by the convection effect of the inhomogeneous distribution of magnetic field, respectively. Then we analyze the contribution of these three terms to the variation of horizontal magnetic field and show directly how the horizontal magnetic field on the photosphere changes.
3 Results
3.1 The change of the horizontal magnetic field Bh and magnetic inclination angle ϕ
First, we focus on the changes of the photosphere magnetic field before and after the homologous eruptions. As an example, Figure 2 shows the distribution of the variation of the strength of horizontal magnetic field before and after the first eruption ΔBh (the first eruption starts at t = 78 and ends at t = 88, where the time unit is τ = 105 s). As can be seen, our simulation clearly reproduces a pattern similar to typical observations; the enhanced region of the horizontal magnetic field is mainly distributed near the PIL, while the decayed region is mainly distributed at the outer parts of two main magnetic polarities. To analyze how the horizontal fields evolve with time, we select three representative areas, A, B, and C, which represent the enhanced region, the decayed region, and the quiescent region, respectively. Then we calculate Bh in different regions with the simulation.
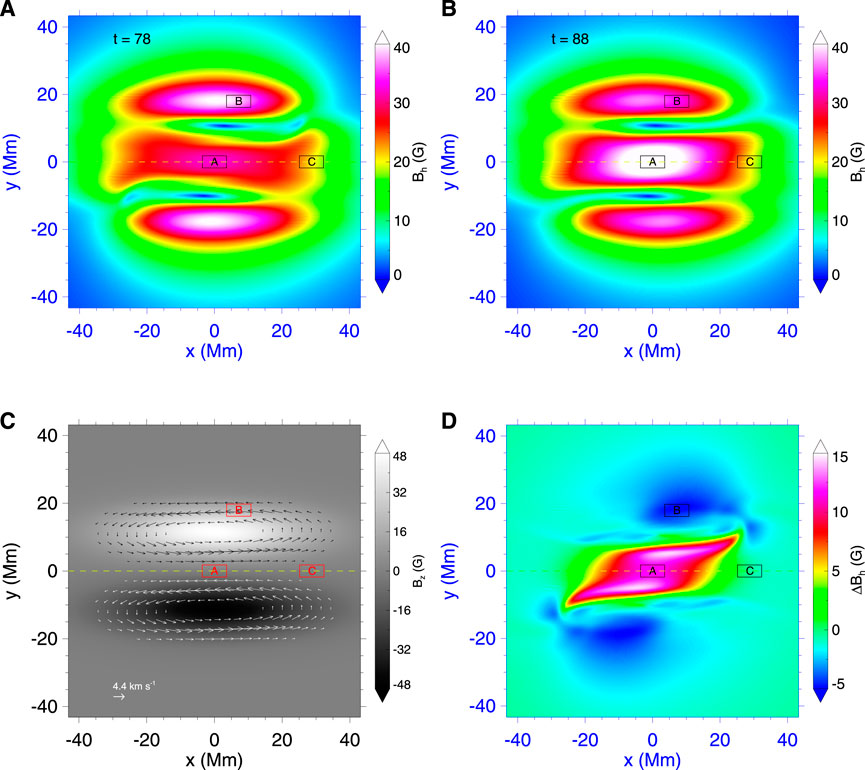
FIGURE 2. The photospheric magnetic field diagram after the first eruption in the simulation. (A), Distribution of horizontal magnetic field at t = 78. (B), Distribution of horizontal magnetic field at t = 88. (C), Contour of Bz and the rotational flow. (D), Distribution of the difference of horizontal magnetic field before and after the first eruption ΔBh(ΔBh = Bh(t = 88) − Bh(t = 78)). The yellow dotted line indicated the polarity inversion line (PIL). The rectangular boxes with centers A, B, and C denote the enhanced region, decayed region, and quiescent region, respectively.
Figure 3 shows the evolution of the average horizontal magnetic field Bh and magnetic inclination angle ϕ in different regions. To some extent, ϕ reflects the expansion or compression of magnetic field lines. In region A (i.e., the enhanced region of Bh during eruption), during the very early time from t = 0 to around 16, Bh shows a mild increase. This is because initially the field on the PIL has only a component By, and the shearing flow produces a Bx compoent (which increases Bh), while still the expansion of the field (which decreases Bh) is very small. Then with growing of expansion of the coronal field, before each eruption the horizontal magnetic field Bh shows a slow decrease from around 45 to 30 (accompanied with increase of the inclination angle ϕ) with time scale in accordance with that of the surface shearing. This is because the field near the PIL is stressed by the shearing flow and expand upward slowly in a quasi-static way (see also Figure 1B). Then, a rapid change occurs through each eruption, in which Bh increases rapidly from around 30 to 45 (and ϕ decreases rapidly) within a time scale of around 6 (corresponding to 10 min). This means the magnetic field lines closely above the PIL are squeezed to become horizontal. In region B (i.e., the decayed region), the evolution is quite opposite to that of region A. Here before each eruption Bh increases and ϕ decreases gradually, since the shearing flow is applied there (see Figure 2C) and thus strengthens the horizontal field continuously. The increase of Bh becomes slower shortly before the onset of each eruption, while through the eruption, Bh decreases rapidly and ϕ increases, which indicates the magnetic field lines rooted there expand upward rapidly during the eruption. As a comparison, the change of Bh in the quiescent region (i.e., the region C) is one order of magnitude lower than that of the enhanced and decayed regions, and such a small change mainly comes from the free outward expansion of the magnetic field lines during the eruption.
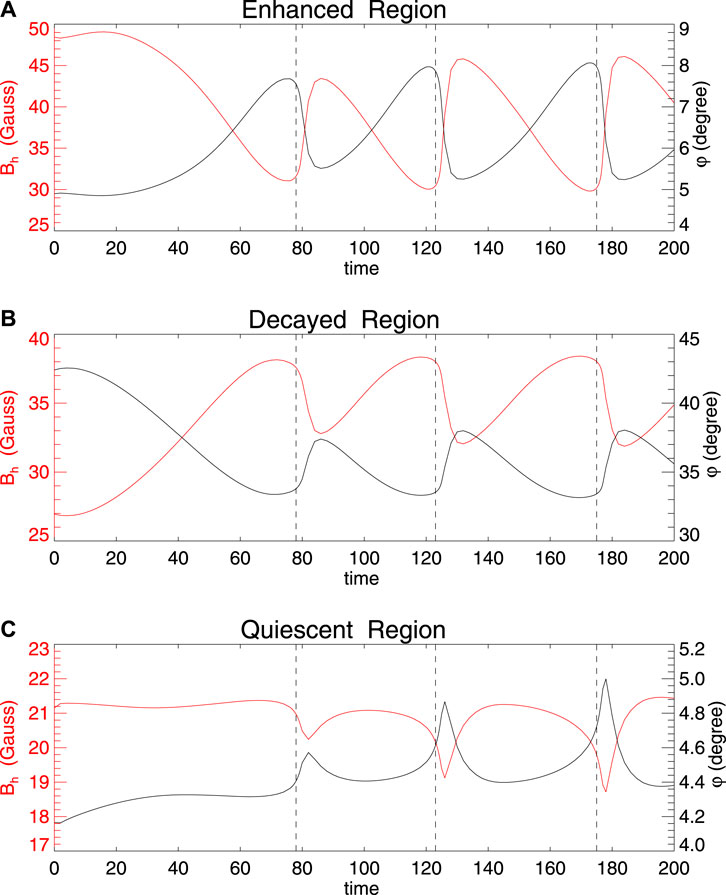
FIGURE 3. The evolution of the horizontal magnetic field and average inclination angel in the enhanced region, (A) decayed region (B) and quiescent region (C), which correspond respectively to the rectangular box of A, B and C shown in Figure 2. The black dotted line indicates the onset of three eruptions.
3.2 The change of Lorentz forces
In order to analyze the influence of reconnection outflow on the photosphere during the eruption process, we calculated the radial (or vertical) Lorentz force Fz and the horizontal Lorentz force Fh. We separately summed the value of Fz and Fh on each grid of the different regions to obtain the evolution of Lorentz force in these different regions, as shown in Figure 4. In region A, the radial Lorentz force Fz is downward overall, and before each eruption its magnitude decreases gradually but through each eruption it increases rapidly. This clearly indicates that the downward outflow generated by reconnection compresses the flare loop above the PIL, and thus the magnetic pressure increases.
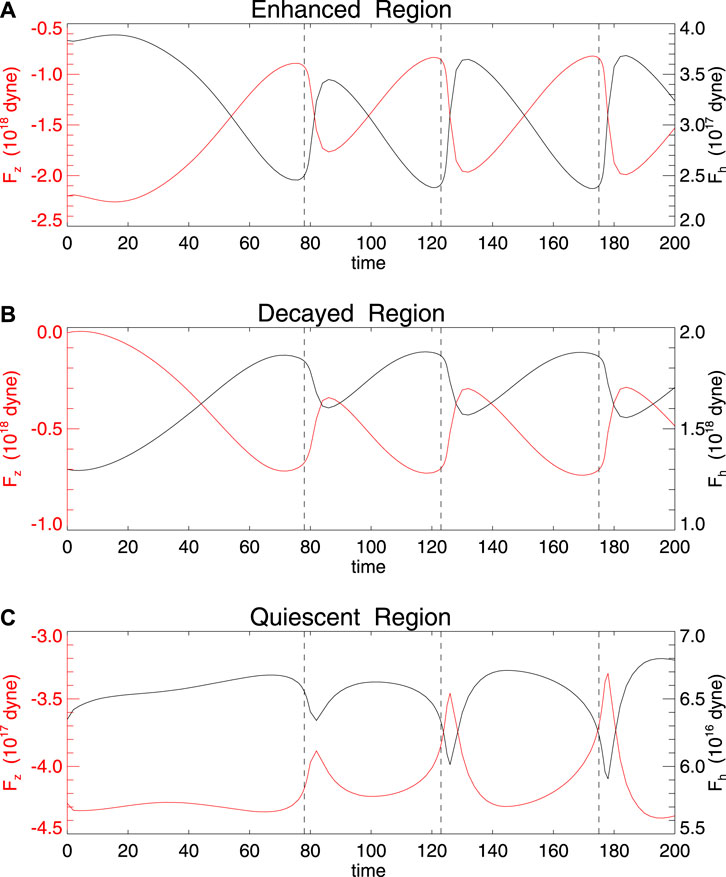
FIGURE 4. The evolution of the radial Lorentz force Fz and the horizonal Lorentz force Fh in the enhanced region (A), decayed region (B) and quiescent region (C) which correspond respectively to the rectangular box of A, B and C shown in Figure 2. The black dotted line indicates the onset of three eruptions.
In region B, the radial Lorentz force is also overall downward, and its magnitude increases gradually before the eruption but decreases rapidly through the eruption, suggesting a upward Lorentz force in action, which indicates that the magnetic field lines rooted there are accelerated to expand outward. In the quiescent region, the value of Fz is smaller than that of regions A and B by an order of magnitude, which means the reconnection core area does not have a significant impact on the outer magnetic field, and the outer magnetic field is approximately in a quasi-static evolution.
The variation of the Lorentz force is directly related to that of the Bh, since due to δBz ≪ δBh, there are approximately:
3.3 The change of the derivative variation of the horizontal magnetic field ∂Bh/∂t
In Section 3.2, we analyzed the evolution of Lorentz force and it is often interpreted that the magnetic field is changed because the effect of the Lorentz force. However, the calculation of Lorentz force is directly related to the horizonal magnetic field, thus it is still unclear why the horizontal magnetic field changes as the simulation and observations show. In this section, we analyze the change rate of horizontal magnetic field in detail by combining the photospheric plasma motion and the corresponding magnetic field line topology. We focus on one point in different regions (A, B, C shown in Figure 2), and calculate the derivative variation of the horizontal magnetic field ∂Bh/∂t according to the magnetic induction equation.
Figure 5 shows the horizontal magnetic field Bh and the derivative variation of the horizontal magnetic field ∂Bh/∂t, and all the three contribution terms in righthand side of the induction equation. As can be seen, for the point in the enhanced region (A), the rapid variation of Bh during eruption is primarily due to the first term, and more specifically, the gradient of vz in the z direction (see also Figure 1E), because the horizontal velocity in this region is negligible. This is clearly a downward compression effect of the downward outflow from the reconnection, which compresses the flare loop and makes the horizontal magnetic field enhanced. The minor contributions from the second and third terms is due to the relatively stable shape of the flare loop, small gradient of horizontal velocity and magnetic field, and no twisting of the upper magnetic field lines.
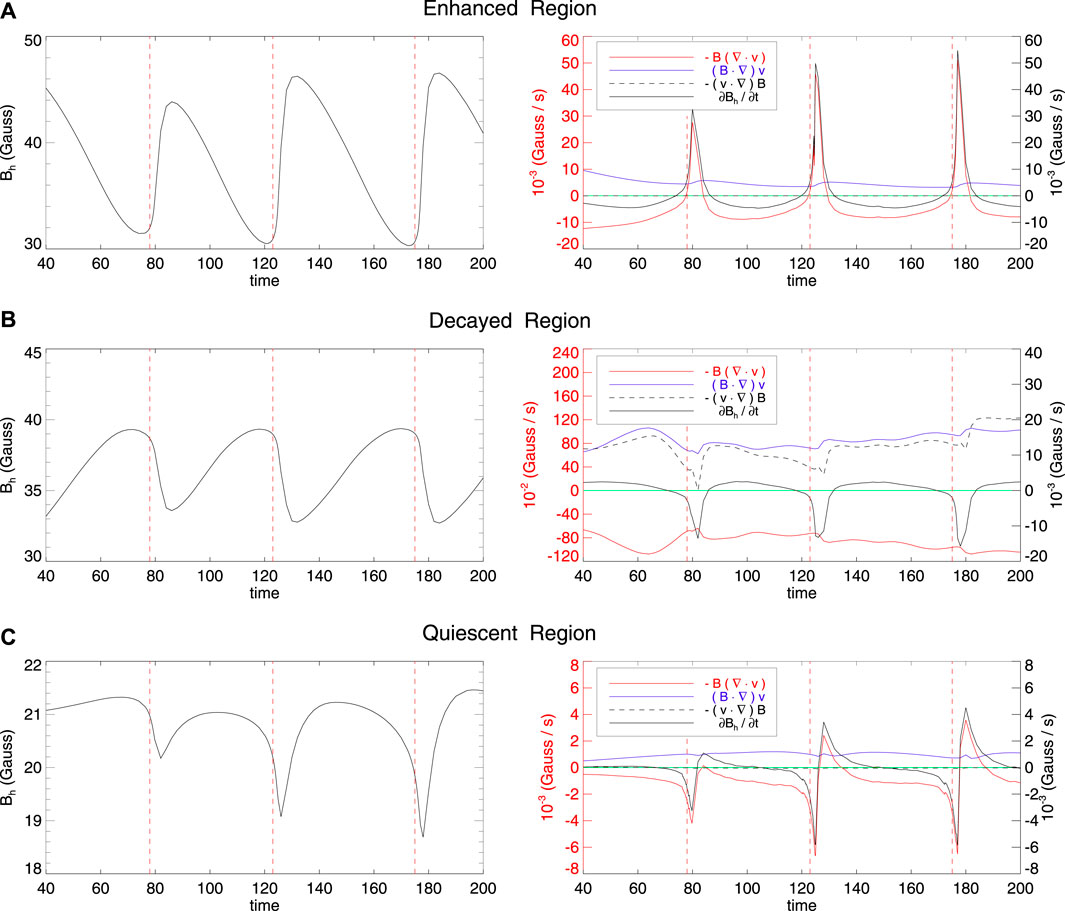
FIGURE 5. The horizonal magnetic field and its derivative variation at the center point (A, B and C, shown in Figure 2.) of different regions, which are respectively shown in panel A–C. The red dotted vertical lines on the left and right indicate the onset of three eruptions. In the right column, the black solid line, the red solid line, the blue line, the black dotted line, and the green line represent the total ∂Bh/∂t, −B(∇ ⋅v), (B ⋅∇)v, and −(v ⋅∇)B, and y = 0, respectively. The red solid line and blue line share the left y-axis, while the black solid line and dotted line share the right y-axis.
For the point in the decayed region (B), the variation of Bh is the combination of mainly the first term and the second term. During the eruption, the magnetic flux rope expands rapidly due to the upward outflow of reconnection. At the same time, due to the complex twisting of the magnetic flux rope, the horizontal velocity has a large gradient. On the whole, the effect of the first term is greater than the sum of the other two terms. Therefore, the weakening of the horizontal magnetic field is mainly due to the rapid outward expansion of the magnetic flux rope.
For the point in the quiescent region (C), the variation of Bh through eruption is much smaller than that in the enhanced region and decayed region, and this small decrease is mainly due to the expansion effect, i.e., the first term.
4 Summary
In this paper, we analyzed the rapid changes of the photospheric horizontal magnetic field associated with homologous eruptions in an MHD simulation. All these eruptions are initiated by the same BASIC mechanism in which magnetic reconnection plays the key role. The simulation reproduces a pattern of rapid evolution of the horizontal field as revealed in observed magnetograms before and after eruptive flares; the horizontal magnetic field near the PIL increases rapidly and permanently, while in part of the area of the main polarity it decreases rapidly. We also studied the physical reasons for this phenomenon and concluded that: 1) The magnetic field near the PIL after flares becomes more horizontal due to the compression of the downward reconnection outflow, and accordingly the magnetic inclination angle decreases and the downward Lorentz force increases; 2) The magnetic field lines near the center of the magnetic polarity become more vertical mainly due to the expansion effect of the velocity divergence term, and as a result the magnetic inclination angle and the upward Lorentz force increase.
Our result supports the conclusion of Barczynski et al. (2019) that the compression of the downward outflow of flare reconnection increases the horizontal magnetic field on the flare PIL. However, as compared with their work, there are several key differences. Firstly, the initiation mechanism of eruption in our model, by fast reconnection of the sheared arcade, is distinct from that in Barczynski et al. (2019), which is based on the torus instability of a pre-existing magnetic flux rope. Secondly, our model has a more self-consistent boundary condition that the simulated photospheric magnetic field is exactly specified at the bottom surface (i.e., the z = 0 plane in our model) and evolves strictly according to the magnetic induction equation, which is not fulfilled in Barczynski et al. (2019) (see Section 3 of that paper). Thirdly, based on the simulation of the homologous eruptions, we provide a full picture of how the horizontal magnetic slowly evolves in the quasi-static energizing phase before the eruption, the rapid change through the eruption as well as its restoring before the following eruption.
Due to some factors such as magnetic polarity configuration and the simplified driving flow at the bottom boundary, in our simulation, the magnetic shear angle (the angle between the magnetic field and the potential field) near the PIL reaches a large value before the eruption, and therefore the magnetic shear angle changes little after eruption. Therefore, this parameter is not discussed in detail in this paper. In addition, it is interesting that the temporal evolution evolution of the horizontal magnetic field in the simulation seems to be topologically consistent with some motion characteristics of the flare ribbons. For example, the evolution of δBh near the PIL is similar to the elongation motion of the flare ribbons, and δBh at the end of the flare ribbon is significantly enhanced, which was not noticed in previous studies. We will analyze the spatial distribution and temporal evolution of δBh and their relationship with the topology of the coronal erupting field in future study. Furthermore, a quantitative comparison of the simulation result and the data from observed magnetograms will be performed.
Data availability statement
The original contributions presented in the study are included in the article/supplementary material, further inquiries can be directed to the corresponding author.
Author contributions
CJ leads this work. XB carried out the simulation and part of the analysis. All authors contributed to the article and approved the submitted version.
Funding
This work is jointly supported by Shenzhen Science and Technology Program (Grant No. RCJC20210609104422048), Shenzhen Technology Project JCYJ20190806142609035, Shenzhen Key Laboratory Launching Project (No. ZDSYS20210702140800001), Guangdong Basic and Applied Basic Research Foundation (2023B1515040021) and National Natural Science Foundation of China (NSFC 42174200).
Acknowledgments
The computational work was carried out on TianHe-1(A), National Supercomputer Center in Tianjin, China. We are very grateful to the referees for their meaningful comments and suggestions.
Conflict of interest
The authors declare that the research was conducted in the absence of any commercial or financial relationships that could be construed as a potential conflict of interest.
Publisher’s note
All claims expressed in this article are solely those of the authors and do not necessarily represent those of their affiliated organizations, or those of the publisher, the editors and the reviewers. Any product that may be evaluated in this article, or claim that may be made by its manufacturer, is not guaranteed or endorsed by the publisher.
References
Antiochos, S. K., DeVore, C. R., and Klimchuk, J. A. (1999). A model for solar coronal mass ejections. Astrophysical J.510, 485–493. doi:10.1086/306563
Aulanier, G. (2016). Solar physics: When the tail wags the dog. Nat. Phys.12, 998–999. doi:10.1038/nphys3938
Barczynski, K., Aulanier, G., Masson, S., and Wheatland, M. S. (2019). Flare reconnection-driven magnetic field and Lorentz force variations at the Sun’s surface. Astrophysical J.877, 67. doi:10.3847/1538-4357/ab1b3d
Berger, M. A. (1984). Rigorous new limits on magnetic helicity dissipation in the solar corona. Geophys. Astrophysical Fluid Dyn.30, 79–104. doi:10.1080/03091928408210078
Bian, X., Jiang, C., Feng, X., Zuo, P., and Wang, Y. (2022). Homologous coronal mass ejections caused by recurring formation and disruption of current sheet within a sheared magnetic arcade. Astrophysical J. Lett.925, L7. doi:10.3847/2041-8213/ac4980
Burtseva, O., Martínez-Oliveros, J. C., Petrie, G. J. D., and Pevtsov, A. A. (2015). Hard X-ray emission during flares and photospheric field changes. Astrophysical J.806, 173. doi:10.1088/0004-637x/806/2/173
Cameron, R., and Sammis, I. (1999). Tangential field changes in the great flare of 1990 may 24. Astrophysical J. Lett.525, L61–L64. doi:10.1086/312328
Cliver, E. W., Petrie, G. J. D., and Ling, A. G. (2012). Abrupt changes of the photospheric magnetic field in active regions and the impulsive phase of solar flares. Astrophysical J.756, 144. doi:10.1088/0004-637x/756/2/144
Feng, X., Yang, L., Xiang, C., Wu, S. T., Zhou, Y., and Zhong, D. (2010). Three-dimensional solar wind modeling from the sun to Earth by a sip-cese mhd model with a six-component grid. Astrophysical J.723, 300–319. doi:10.1088/0004-637X/723/1/300
Fisher, G. H., Bercik, D. J., Welsch, B. T., and Hudson, H. S. (2012). Global forces in eruptive solar flares: The Lorentz force acting on the solar atmosphere and the solar interior. Sol. Phys.277, 59–76. doi:10.1007/s11207-011-9907-2
Hirayama, T. (1974). Theoretical model of flares and prominences. I: Evaporating flare model. Sol. Phys.34, 323–338. doi:10.1007/bf00153671
Hudson, H. S., Fisher, G. H., and Welsch, B. T. (2008). “Flare energy and magnetic field variations,” in Subsurface and atmospheric influences on solar activity astronomical society of the pacific conference series. Editors R. Howe, R. W. Komm, K. S. Balasubramaniam, and G. J. D. Petrie, 383, 221. Provided by the SAO/NASA astrophysics data system.
Inoue, S., Kusano, K., Büchner, J., and Skála, J. (2018). Formation and dynamics of a solar eruptive flux tube. Nat. Commun.9, 174. doi:10.1038/s41467-017-02616-8
Jiang, C., Feng, X., Liu, R., Yan, X., Hu, Q., Moore, R. L., et al. (2021). A fundamental mechanism of solar eruption initiation. Nat. Astron.5, 1126–1138. doi:10.1038/s41550-021-01414-z
Jiang, C., Feng, X., Zhang, J., and Zhong, D. (2010). Amr simulations of magnetohydrodynamic problems by the cese method in curvilinear coordinates. Sol. Phys.267, 463–491. doi:10.1007/s11207-010-9649-6
Jiang, C., Wu, S. T., Feng, X., and Hu, Q. (2016). Data-driven magnetohydrodynamic modelling of a flux-emerging active region leading to solar eruption. Nat. Commun.7, 11522. doi:10.1038/ncomms11522
Johnstone, B. M., Petrie, G. J. D., and Sudol, J. J. (2012). Abrupt longitudinal magnetic field changes and ultraviolet emissions accompanying solar flares. Astrophysical J.760, 29. doi:10.1088/0004-637x/760/1/29
Kosovichev, A. G. (2011). Helioseismic response to the X2.2 solar flare of 2011 february 15. Astrophysical J. Lett.734, L15. doi:10.1088/2041-8205/734/1/l15
Li, Y., Jing, J., Fan, Y., and Wang, H. (2011). Comparison between observation and simulation of magnetic field changes associated with flares. Astrophysical J. Lett.727, L19. doi:10.1088/2041-8205/727/1/l19
Liu, C., Deng, N., Liu, Y., Falconer, D., Goode, P. R., Denker, C., et al. (2005). Rapid change of δ spot structure associated with seven major flares. Astrophysical J.622, 722–736. doi:10.1086/427868
Liu, L., Zhou, Z., Wang, Y., Sun, X., and Wang, G. (2022). On the nature of the photospheric horizontal magnetic field increase in major solar flares. Astrophysical J. Lett.934, L33. doi:10.3847/2041-8213/ac83bf
Petrie, G. J. D. (2019). Abrupt changes in the photospheric magnetic field, Lorentz force, and magnetic shear during 15 X-class flares. Astrophysical J. Suppl.240, 11. doi:10.3847/1538-4365/aaef2f
Petrie, G. J. D., and Sudol, J. J. (2010). Abrupt longitudinal magnetic field changes in flaring active regions. Astrophysical J.724, 1218–1237. doi:10.1088/0004-637x/724/2/1218
Pevtsov, A. A., Canfield, R. C., and Metcalf, T. R. (1995). Latitudinal variation of helicity of photospheric magnetic fields. Astrophysical J. Lett.440, L109. doi:10.1086/187773
Pontin, D. I., and Priest, E. R. (2022). Magnetic reconnection: MHD theory and modelling. Living Rev. Sol. Phys.19, 1. doi:10.1007/s41116-022-00032-9
Spirock, T. J., Yurchyshyn, V. B., and Wang, H. (2002). Rapid changes in the longitudinal magnetic field related to the 2001 april 2 X20 flare. Astrophysical J.572, 1072–1076. doi:10.1086/340431
Sudol, J. J., and Harvey, J. W. (2005). Longitudinal magnetic field changes accompanying solar flares. Astrophysical J.635, 647–658. doi:10.1086/497361
Sun, X., and Norton, A. A. (2017). Super-flaring active region 12673 has one of the fastest magnetic flux emergence ever observed. Res. Notes Am. Astronomical Soc.1, 24. doi:10.3847/2515-5172/aa9be9
Wang, H. (1992). Evolution of vector magnetic fields and the August 27 1990 X-3 flare. Sol. Phys.140, 85–98. doi:10.1007/bf00148431
Wang, H., Ewell, M. W., Zirin, H., and Ai, G. (1994). Vector magnetic field changes associated with X-class flares. Astrophysical J.424, 436. doi:10.1086/173901
Wang, H., and Liu, C. (2010). Observational evidence of back reaction on the solar surface associated with coronal magnetic restructuring in solar eruptions. Astrophysical J. Lett.716, L195–L199. doi:10.1088/2041-8205/716/2/l195
Wang, H. (2006). Rapid changes of photospheric magnetic fields around flaring magnetic neutral lines. Astrophysical J.649, 490–497. doi:10.1086/506320
Wang, H., Spirock, T. J., Qiu, J., Ji, H., Yurchyshyn, V., Moon, Y.-J., et al. (2002). Rapid changes of magnetic fields associated with six X-class flares. Astrophysical J.576, 497–504. doi:10.1086/341735
Wang, S., Liu, C., and Wang, H. (2012). The relationship between the sudden change of the Lorentz force and the magnitude of associated flares. Astrophysical J. Lett.757, L5. doi:10.1088/2041-8205/757/1/L5757L
Wiegelmann, T., Thalmann, J. K., Inhester, B., Tadesse, T., Sun, X., and Hoeksema, J. T. (2012). How should one optimize nonlinear force-free coronal magnetic field extrapolations from SDO/HMI vector magnetograms?Sol. Phys.281, 37–51. doi:10.1007/s11207-012-9966-z
Yadav, R., and Kazachenko, M. D. (2022). A statistical study of magnetic field changes in the photosphere during solar flares using high-cadence vector magnetograms and their association with flare ribbons. Available at: https://arxiv.org/abs/2210.14264 (Accessed October 25, 2022).
Keywords: Sun: coronal mass ejections (CMEs), Sun: flares, Sun: magnetic fields, magnetohydrodynamics (MHD), methods: numerical
Citation: Bian X and Jiang C (2023) MHD simulation of rapid change of photospheric magnetic field during solar eruption caused by magnetic reconnection. Front. Astron. Space Sci. 10:1097672. doi: 10.3389/fspas.2023.1097672
Received: 14 November 2022; Accepted: 09 June 2023;
Published: 22 June 2023.
Edited by:
Lei Ni, Chinese Academy of Sciences (CAS), ChinaCopyright © 2023 Bian and Jiang. This is an open-access article distributed under the terms of the Creative Commons Attribution License (CC BY). The use, distribution or reproduction in other forums is permitted, provided the original author(s) and the copyright owner(s) are credited and that the original publication in this journal is cited, in accordance with accepted academic practice. No use, distribution or reproduction is permitted which does not comply with these terms.
*Correspondence: Chaowei Jiang, chaowei@hit.edu.cn