SPGCam: A specifically tailored camera for solar observations
- 1Solar Physics Group, Instituto de Astrofísica de Andalucía, Consejo Superior de Investigaciones Científicas (IAA-CSIC), Granada, Spain
- 2Spanish Space Solar Physics Consortium (S3PC), Spain
- 3Instituto de Astrofísica de Canarias (IAC), La Laguna, Spain
- 4Instituto de Microgravedad “Ignacio da Riva”, Universidad Politécnica de Madrid (IDR-UPM), Madrid, Spain
- 5National Astronomical Observatory of Japan, Mitaka, Japan
- 6Department of Industrial Engineering, University of La Laguna, San Cristóbal de La Laguna, Spain
Designing a new astronomical instrument typically challenges the available cameras on the market. In many cases, no camera can fulfill the requirements of the instrument in terms of photon budget, speed, and even interfaces with the rest of the instrument. In this situation, the only options are to either downgrade the performance of the instrument or design new cameras from scratch, provided it is possible to identify a compliant detector. The latter is the case of the SPGCams, the cameras developed to be used with the Tunable Magnetograph (TuMag) and the Sunrise Chromospheric Infrared spectroPolarimeter (SCIP) for the Sunrise iii mission. SPGCams have been designed, developed, and built entirely in-house by the Solar Physics Group (SPG) at the Instituto de Astrofísica de Andalucía (IAA-CSIC). We report here on the scientific rationale and system engineering requirements set by the two instruments that drove the development, as well as on the technical details and trade-offs used to fulfill the specifications. The cameras were fully verified before the flight, and results from the assembly and verification campaign are presented as well. SPGCams share the design, although some parametric features differentiate the visible cameras (for TuMag) and the IR ones (for SCIP). Even though they were specifically developed for the Sunrise iii mission, the robust and careful design makes them suitable for different applications in other astronomical instruments.
1 Introduction
A large fraction of astronomical information comes from photon counting. Many astronomical measurements are photometric and, hence, the paramount importance of detectors and cameras. Astronomers measure light; they do not measure temperatures, velocities, magnetic fields, and other physical quantities of heavenly bodies. These physical quantities are inferred with uncertainties which directly rely on the photometric errors. Proper detectors and cameras are, therefore, key elements in observational astronomy. Indeed, most of the current instrument designs start from the end, from the camera, in order to fulfill the scientific requirements and goals that scientists have set. Cameras must ensure the required photon budget, the required signal-to-noise ratio (S/N), the needed exposure time, and cadence to cope with the dynamical properties of the target astronomical (solar) features and with the seeing (in ground-based instruments) or spacecraft jitter (in the case of aerospace-borne instruments). They should be free of automatic cosmetic procedures that many available commercial cameras incorporate for everyday usage in civil applications. They may have special requirements about its behavior under harsh environmental conditions of temperature and pressure. They cannot afford other sources of noise than, typically, readout and photon noise. In addition to these photometric requirements, mechanical alignment and/or special tools to be adjusted in the final optical path may call for other special features.
Special attention must be paid to differential photometry. The combination of images taken asynchronously is a clear source of potential uncertainties. This is particularly true in the case of polarimetry, a singular way of differential photometry: the so-called Stokes parameters, I, Q, U, and V, which determine the polarization state of light, cannot be measured independently, although they have units of energy (i.e., photons). Rather, only linear combinations of all four can be recorded in single shots. Therefore, at least four independent measurements of these linear combinations are mandatory to retrieve the four Stokes parameters. It is easy to understand that any evolutionary change in the object or differential seeing or jitter conditions among the (at least) four measurements can corrupt the result, a well-known effect called polarization crosstalk among the Stokes parameters in the specific jargon (Lites, 1987; see also, e.g., Del Toro Iniesta, 2003). Intensity, Stokes I, can enter the measured Q, U, and V. Circular polarization of light, represented by Stokes V, can be measured as linear polarization, represented by Stokes Q and U, and vice versa. Stokes Q and U can also be intermingled.1 All this crossed contamination naturally imposes specific requirements to the cameras in instruments like TuMag (Tunable Magnetograph; Del Toro Iniesta et al., 2023) and SCIP (Sunrise Chromospheric Infrared spectroPolarimeter; Katsukawa et al., 2023) that are spectropolarimeters.
A market screening is often insufficient to find a compliant camera. Scientific needs are usually far from commercial needs (e.g., Zhang et al., 2020; Zhu et al., 2022). This has indeed been the case when starting the conceptual design of our two instruments for the Sunrise iii mission (Solanki et al., 2023). We then decided instead to screen the sensor market and, after identifying one that we could adapt to our needs, develop the cameras from scratch. Our own custom design could exploit the large commonalities between the two instruments that are indeed different, at the same time of flavoring the final versions for TuMag and SCIP. TuMag is a dual-beam, tunable imaging spectropolarimeter based on the use of liquid crystal variable retarders for the polarization modulation and a solid LiNbO3 Fabry–Pérot etalon as a spectrometer. These two main elements were also fundamental to Flare Genesis (Rust, 1994) and IMaX (Imaging Magnetograph eXperiment; Martínez Pillet et al., 2011). TuMag produces quasi-monochromatic (FWHM of 6 pm) images of the aforementioned linear combinations of the Stokes parameters. The spectral information is then obtained by scanning a spectral line and its nearby continuum at discrete samples centered at given wavelengths. It operates at visible (green) wavelengths. On the other hand, SCIP is a slit-spectrograph-based spectropolarimeter which uses a rotating waveplate for the polarization modulation and a classical spectrograph for the spectral analysis. SCIP produces spectrograms where the full spectrum is recorded in one of the directions and the other is a one-dimensional coverage of the Sun. The spatial information is then completed by scanning the Sun along a perpendicular direction to the spectrograph slit. It operates in near-infrared wavelengths.
TuMag incorporates two cameras, one for each of the two (orthogonally polarized) beams coming out from the polarization analyzer. SCIP includes three cameras: two for each of the two wavelength range arms of the instrument and a third, so-called slit-jaw camera, which images the solar light that does not enter the spectrograph that serves as a context image for the observation. The SPGCam project, then, had to comply with the requirements of the two instruments, which are summarized in Section 2 along with the selected sensor. A discussion on the behavior of sensors and the various sources of noise follows in Section 3. The results of that analysis in the case of our sensor help decide how to fill the full well of the pixels according to our requirements of the signal-to-noise ratio, which are directly associated with our polarimetric sensitivity. Then, a description of the electronic hardware follows in Section 4. The camera mechanics is described in Section 5. Section 6 summarizes the thermo-vacuum characterization of the cameras, with all the tests performed before integration into the instruments.
2 Scientific and system engineering requirements
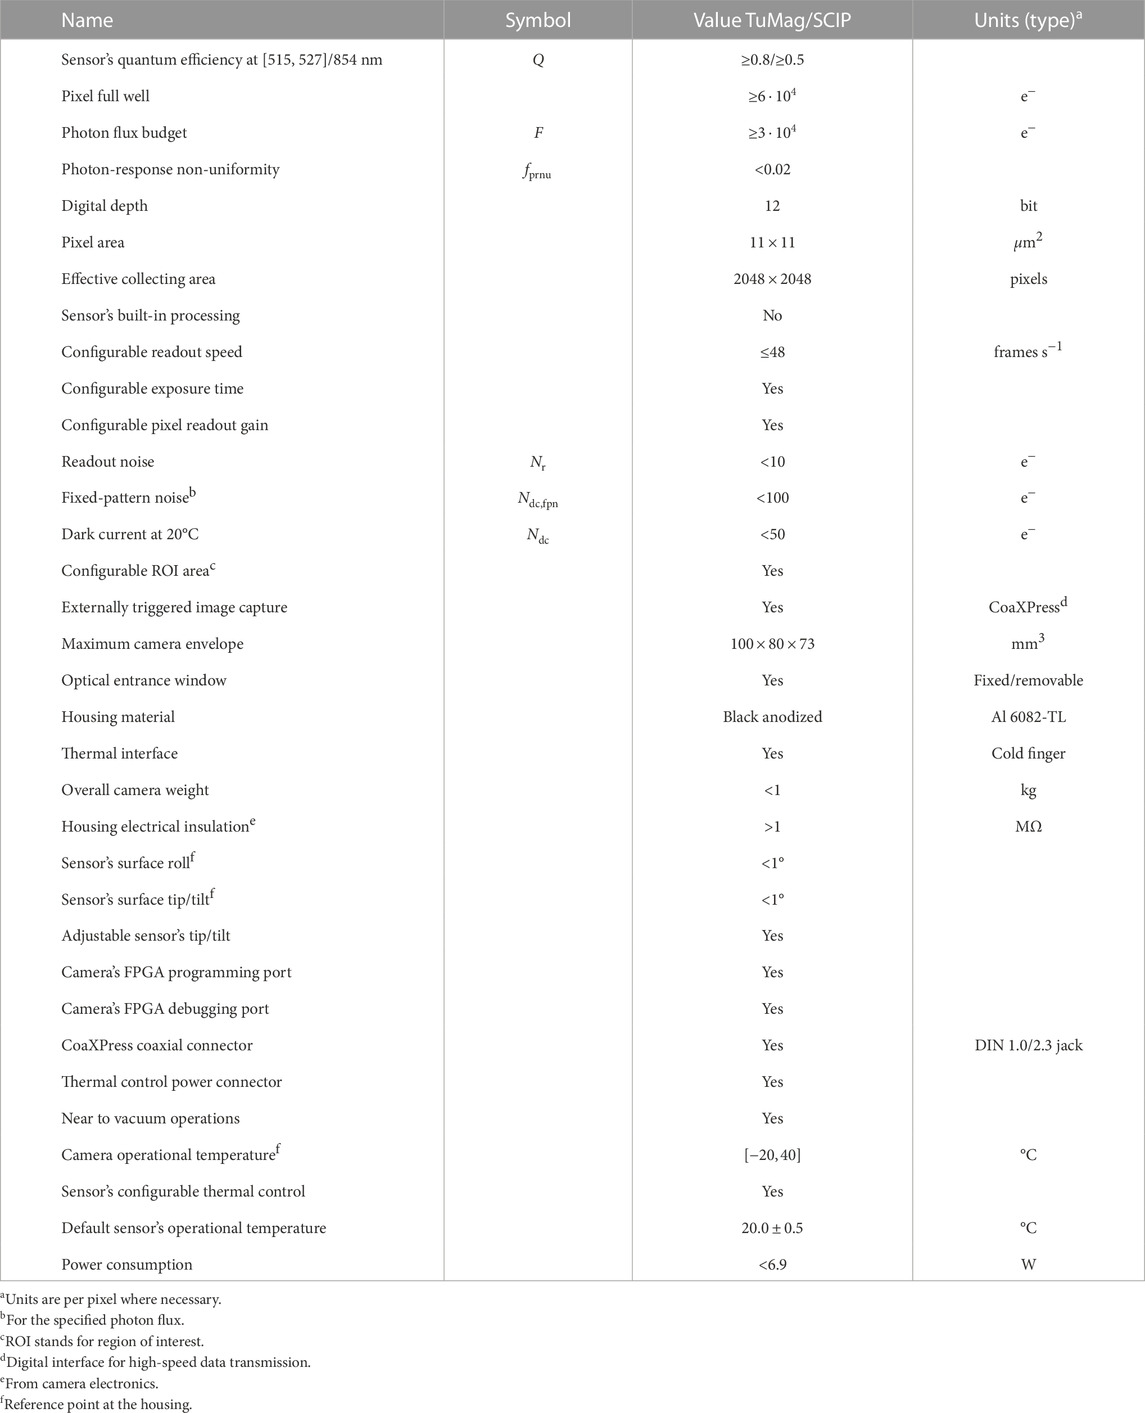
TuMag is a dual-beam, tunable imaging spectropolarimeter that uses two cameras and should image a solar field of view (FoV) of 63′′ × 63′′. SCIP is a slit-spectrograph-based spectropolarimeter that images the (∼ 8.5 nm wide) spectrum of a one-dimensional, 58″-long region of the Sun. Its slit-jaw camera has the same FoV as that of TuMag.2 The camera electronics should host, drive, and control the temperature of the image sensor. A shared design of a camera for the two instruments thus asks for a common sensor that fulfills the requirements for both with the same electronic components and, perhaps, some parametric differences. Similar drivers apply for the mechanical design. The envelope, materials, coatings, etc., are determined by the most demanding instrument and should almost be the same for the two instruments. A specially tailored window protects the sensor from dust, humidity, and other volatile materials while preventing any extra aberrations which might degrade the final optical quality. The window may be removed for flight depending on the needs of the specific instrument. The scientific and system engineering requirements are summarized in Table 1.
After a review of the sensor market, we found that the rolling shutter, backside-illuminated GPIXEL SENSE GSENSE400BSI3 2 k × 2 k pixel detector is compliant for both the TuMag and SCIP requirements. Thus, the SPGCams have been designed to use this detector. While physically identical, the two cameras need a few different parameters in the driving electronics. The main driver for selecting this sensor was twofold: first, the pixel lateral size of 11 μm is fairly close to the foreseen plate scale in the initial development phase of both instruments. Second, the BSI sensor has very good visible and infrared sensitivity without the need of cooling it down. Usually, infrared sensors need to be cooled down to boost their sensitivity; however, this sensor is among the most sensitive sensors at room temperature. Operation at room temperature is very important for a stratospheric balloon mission like Sunrise iii.
3 Noise and its sources
Camera measurements can be broken down into three clearly distinct stages, namely, the conversion from photons to electrons, the conversion from electrons to voltage, and, finally, the digitization of such a voltage. Each stage contributes to the measurement with noise, whose origin has to be clearly understood in order to correct or mitigate its effects.
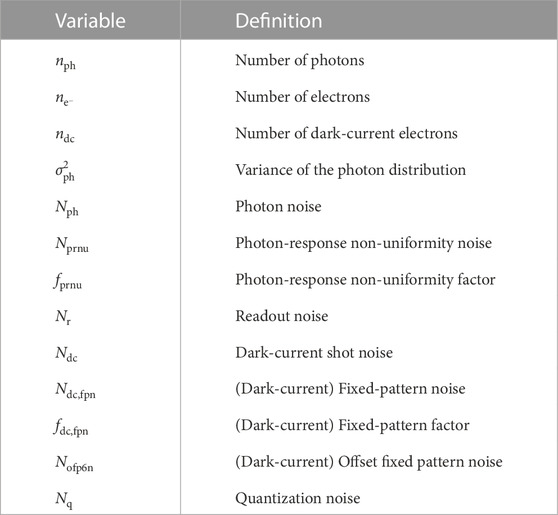
As a consequence of the photo-electric effect being a Poissonian process, some of the noises have a statistical dependence on the signal itself. There are, however, sources that are independent of the signal so that they are always present. Among those sources independent of the signal, there are some that depend on environmental factors like temperature or pressure. The characterization of noise in a camera is, thus, a significant challenge. This section is devoted to summarizing all sources of noise and explain ways for calculating them in the laboratory. Many of the concepts may already be familiar to the reader, but we offer a comprehensive review for non-expert users, e.g., astronomers. Table 2 summarizes all the noise variables and their meaning.
Let nph be the number of photons arriving at a given pixel of the detector. The photon emission process is random in nature, and it produces so-called photon shot noise (or simply photon noise), whose variance is equal to nph:
The detected photons are converted to a current of
Since the production of an electric current from individual electrons is a Poissonian process associated with the quantum nature of charges, in much the same way as photon emission is, the corresponding noise is also a shot noise and hence equal to the square root of the signal. In the astronomical jargon, this electron noise continues being called photon noise:
Not every pixel responds to photons with exactly the same efficiency under uniform illumination. Indeed, the pixel-to-pixel sensitivity differences result in a photon-response non-uniformity4, with an associated noise proportional to the number of photons:5
This response non-uniformity has the same driver as what astronomers know as flat field: The individual pixel sensitivity introduces modifications in the pixel signal and generates an individual pixel noise. Indeed, the two-dimensional distribution across the detector of the fprnu factor equals the flat-field response to a uniform illumination of the camera.
Since Nprnu is signal-dependent and indeed proportional to nph, it can easily dominate over the photon shot noise, which is not a recommended circumstance in any kind of photometry. When the ratio equals 1, photon-response non-uniformity is the more important noise source.
There still remains a noise in this first process of conversion of photons into electrons (or current) that is not dependent on the signal. It can be considered a toll for reading the camera and is called the read noise (or readout noise), Nr.
Each pixel can produce, however, a current without the presence of light. It is known as dark current, which generates 1) a dark-current shot noise, due to a spontaneous random generation of ndc electrons, and 2) a fixed-pattern noise, resulting from pixel-to-pixel differences on manufacturing materials and alike.
These two noises associated with dark current are temperature-dependent. Therefore, characterization of the camera should be carried out at operating temperatures. Moreover, ndc has an implicit dependence on time: it varies linearly with integration time. Hence, the longer the exposure time, the more the dark current generated.
The conversion of charge to voltage, characterized by a gain g, implies that we have to multiply both S and all the aforementioned noises by g. (We will keep, however, the same symbol for the variables, as it is simply a change in units from e− to V.) This is not a perfect process either. Gain fluctuations and non-linearities appear in the various pixel and/or column amplifiers, which produce so-called offset fixed-pattern noise, Nofpn, which is one-dimensional in itself as it varies from column to column in the detector. Typically, a few specifically devised, physically darkened rows of pixels are used for the determination of, at least, the contribution of the column amplifiers to Nofpn. Indeed, our detector has 2,048 × 2,050 pixels. Hence, two rows are used to measure Nofpn.
Finally, the digitization of voltage to data numbers (DNs) of nbit bits introduces a quantization noise, given by
where the quantization interval
In summary, besides possible non-linearities that can be hardly modeled, we have a time-invariant noise or fixed-pattern noise (coming from photon-response non-uniformity and offset fixed pattern), a time-dependent noise (coming from photon shot noise, dark-current fixed pattern, and dark current), a read noise which is independent of the signal, and a quantization noise. We can see the various contributions in yet another way, namely, assuming that all sources of noise are uncorrelated,
that is, an independent term (in brackets), a quadratic term on the dark-current signal, Sdc = gndc, and a quadratic term on the signal, S. Still another physical interpretation is possible: noise is produced by the generation of electrons from photons (with an offset given by the readout Nr), from the spontaneous generation of electrons by the detector (with an offset given by Nofpn), and by quantization.
Since in practice dark current (with its offset fixed-pattern noise) can be calculated separately and subtracted from the signal, the effective noise of a measurement can be given by
Note that the dark-current, fixed-pattern noise remains after subtracting Sdc along with Nofpn, since it is proportional to Sdc.
From Eqs 2, 3, written in V units, the gain can be obtained as
The dynamic range is, by definition, the ratio of the electron full well of the sensor to the read noise. Since the full well is an intrinsic parameter of the sensor, the calculation of Dr is straightforward. From it, the quantization noise follows from Eq. 7.
The photon-response non-uniformity factor is calculated from the ratio of the rms to the average of an image which has been uniformly illuminated up to half its full well, once dark current is subtracted, directly from Eq. 4.
fdc,fpn can be calculated similarly as g but with a series of dark images, each with a different exposure time.
When the camera is used in imaging photometry, the flat-fielding process helps get rid of all those noises except the photon noise: an average of uniformly illuminated images (subtracted from dark current and normalized to their means), the flat-field image, is used to divide all the individual measurement images, which thus provides results corrected from pixel-to-pixel gain differences. The larger the number of flat images we use to obtain the flat-field image, the closer its photon noise is to zero, and then the better. When cameras are used for slit spectroscopy, corrections are less simple because of the large changes in the signal along the wavelength direction. In this case, an extra step is necessary, which consists in removing the spectral line information after being useful for flat-fielding the images. Figure 1 illustrates the differences between these two types of images for those readers who are not familiar with solar astronomy. On the left, a regular (polarized) image is shown. The image corresponds to the spatial variation of the solar scene at a quasi-monochromatic wavelength of the visible solar spectrum. In this case, this image was taken during sunlight calibrations of the TuMag instrument, and, although it does not show solar structure due to the atmospheric conditions under which it was taken, we have introduced a grid pattern for the purpose of performing alignment tests between the cameras. On the right, a spectrogram is shown: the Y-axis corresponds to the (one-dimensional) solar scene; the X-axis corresponds to wavelength. Conspicuous spectral lines can be observed. The left and right spectrograms correspond to two distinct, orthogonally polarized beams.
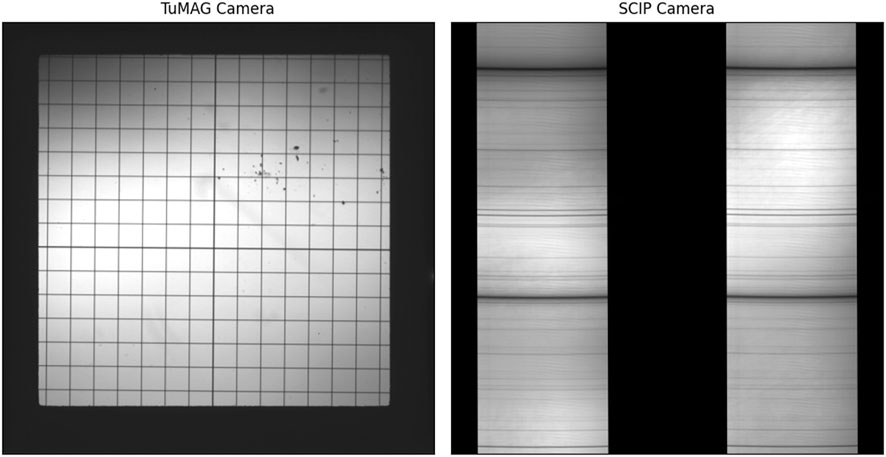
FIGURE 1. Left: polarized image coming out from TuMag’s solar light tests. Right: spectrogram coming out from the SCIP’s solar light tests. In both images, black areas correspond to masked regions within the instruments.
Figure 2 presents so-called photon transfer curves (PTCs) generated by the GSENSE400BSI sensor integrated into a prototype SPGCam under ambient conditions at 25°C. The left panel represents the PTC curve in the absence of light. It has been built by varying the exposure time, which gives rise to larger dark currents. Hence, in this dark PTC, only the two first terms of Eq. 8 contribute to the measured signal and noise. The right panel, on the other hand, has been obtained by illuminating uniformly the sensor and, again, changing the exposure time. Hence, it contains the contribution of all three terms in Eq. 8. Light PTCs are usually obtained by varying the light source, but in such a case, special care must be taken to ensure the stability of the light source, especially for experimental repeatability purposes. In both panels, dots indicate measurements, and dashed lines stand for slope 1/2 (orange) and slope 1 (blue) behaviors. In both PTCs, the black dots represent the standard deviation calculated across the image, while the red dots show the standard deviation of the frame difference of two identical frames with the same exposure time. The solid line stands for a linear fit to the black dots, and the black dashed line in the dark PTC represents the percentage difference between measurements and the fit (scale on the right). From any of the PTCs, −log g (in DN/e−) and log fprnu (or log fdc,fpn; non-dimensional) are directly given by the crossing points of the fits with the X-axis. The extrapolation of the black fit to S = 0 gives Nr. Four horizontal regimes are labeled, namely, a readout noise regime (where Nr dominates), a shot noise regime (where Nph or Ndc is the most important source), a photon-response non-uniformity regime (where Nprnu and Ndc,fpn are the biggest sources), and the saturation regime where the signal saturates because it is close to the maximum of the sensor dynamic range. It is important to remark that, in both PTCs, the takeover between Ndc and Ndc,fpn occurs very soon, when the signal is still not that large. This takeover shifts to the right, i.e., Ndc,fpn becomes less important as soon as the sensor temperature decreases. Ironically, and contrary to what other astronomers do, the SPGCams work at room temperature in the Sunrise iii mission. For this reason, the cut-off point is located right at the beginning.
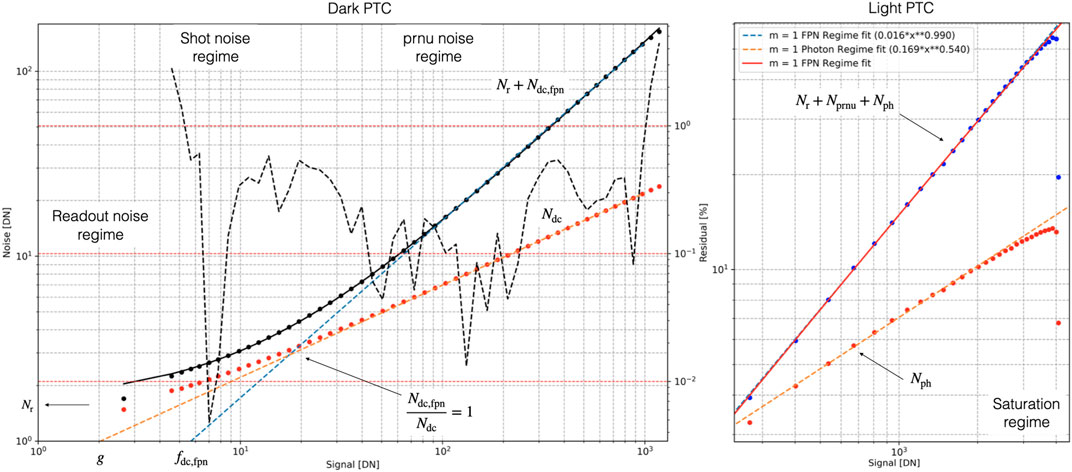
FIGURE 2. Variation in noise vs. signal, in a log–log plot, without light (dark PTC; left) and with external illumination (light PTC; right).
4 Camera electronic hardware
4.1 Overall view
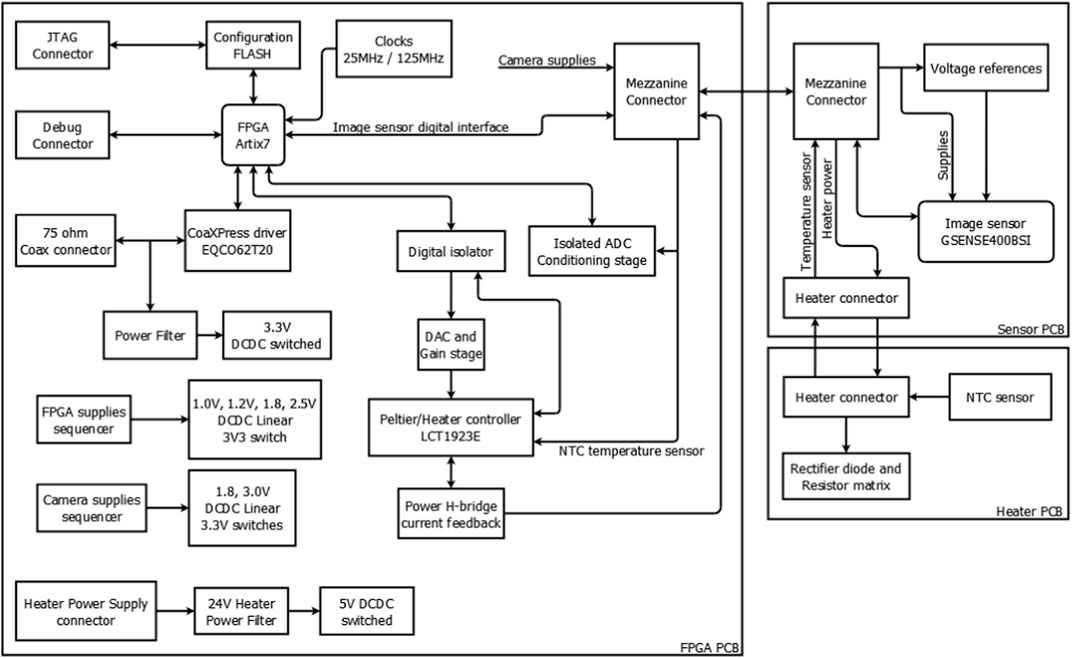
The camera electronics consist of three printed circuit boards (PCBs), namely, one hosting the sensor, a second hosting the control field-programmable gate array (FPGA), and a third hosting an array of resistors which operate as a heater for temperature control. A block diagram of the three PCBs is shown in Figure 3.
The Sensor-PCB (upper right of Figure 3) contains the image sensor. It includes the sensor decoupling capacitors, its voltage reference generator, and the heater connector for facilitating the camera assembly. The Sensor-PCB is designed with an opening area for accessing the bottom of the image sensor with a cold finger. The selected GSENSE400BSI sensor is scientific-CMOS (sCMOS), compatible with vacuum environments, low power, low readout noise, high dynamic range, and high quantum efficiency peak at 560 nm (95%), among other features.
The FPGA-PCB (left of Figure 3) includes the external interfaces of the camera, the power management, the FPGA itself, and its thermal controller. There are four external interfaces: CoaXPress, the thermal controller power supply, a debug port, and the programming port (JTAG). The last two interfaces cannot be accessed by the user as they are intended for development purposes only. The system engineering choice of a CoaXPress interface has a great impact on this project. From an electrical point of view, it is simpler than other alternatives such as USB3 or Camera Link, since CoaXPress consists of a single 75 Ω coaxial cable to power the camera and downlink and uplink the data at the same time. This provides a smart mechanical and physical layer, which makes routing the harness within the optical bench easier, thanks to its small bending radius. It also allows long harness distances, reduces risks during harness manufacturing, and simplifies the PCB design as it saves space by considerably reducing the number of lines involved.
The FPGA-PCB and sensor-PCB are in a mezzanine disposition, as shown in Figure 4. There are two reasons for having such a configuration. First, due to camera size restrictions, not all components fit on a single PCB. Second, we should minimize the thermal coupling between the image sensor and the rest of the electronics.
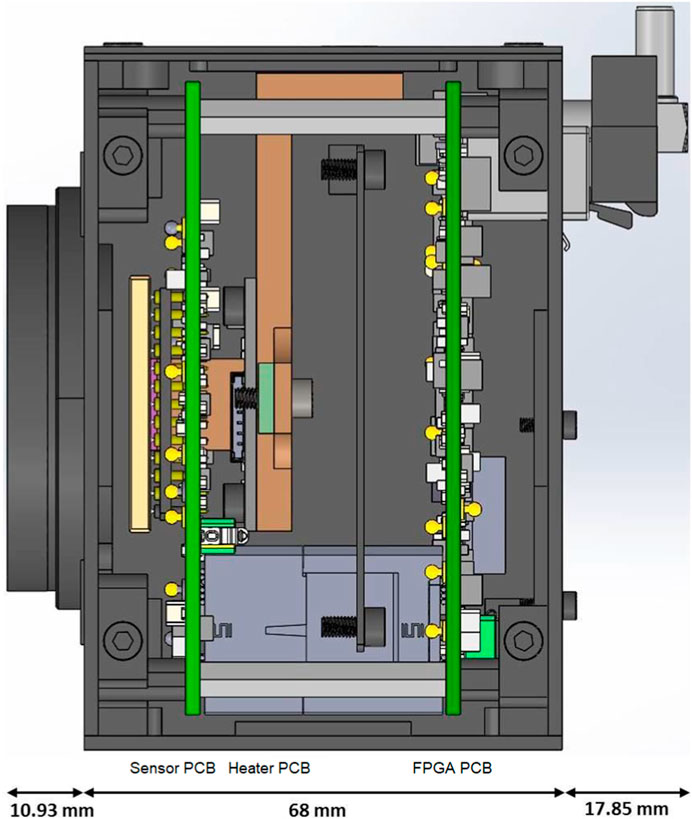
FIGURE 4. Cross section of the TuMag camera (including the entrance window and connectors) showing the position of the three PCBs. On the left is the sensor-PCB in which the image sensor appears plugged. In the center, the heater-PCB appears attached to a cold finger (orange piece). On the right is the FPGA-PCB, with the CoaXPress and heater supply connectors of the harness already connected. The mezzanine connector (Hirose IT5 family), as well as a shielding screen between the sensor-PCB and FPGA-PCB, is also shown.
The heater-PCB (lower right of Figure 3) is a metallic substrate PCB attached to the cold finger for stabilizing its temperature. The temperature sensor is a pigtailed, 10 kΩ negative temperature coefficient thermistor. It is placed on the cold finger at the base of the image sensor, and its terminals are soldered to the heater-PCB. The heater-PCB is then located on the cold finger touching the image sensor but isolated from the other two PCBs. The heater-PCB also includes a rectifier diode. The rationale for that diode is that the thermal controller, included in the sensor-PCB, is designed to drive a Peltier module. When the thermal module needs to cool down the sensor, it reverses the current sense, but the rectifier diode plays the role of canceling it.
All PCBs are painted black (solder mask) to minimize light reflections inside the camera.
4.2 FPGA printed circuit board
The purpose of this PCB is to include most of the camera electronics. It is a 10-layer FR4 PCB with a very compact size (90 mm × 70 mm; 2.11 mm high), as shown in Figure 5. When required, to ensure the signal integrity, the tracks are routed in a controlled impedance way and on dedicated layers. This PCB includes four user interface connectors and one mezzanine connector:
• Right DIN 1.0/2.3 75 Ω for CoaXPress. The choice of this type of connector provides compact size and matting simplicity as compared to a BNC type.
• Four wires, Hirose GT17 family, for powering (24 V) the camera heater controller. This supply is isolated from the CoaXPress supply. That choice provides robustness, shield construction, harness retention, and different counterpart orientation capabilities.
• Standard Xilinx JTAG (14-wire) connector to program the flash memory that stores the FPGA firmware. This connector is not accessible in normal operation (by removing a protection cover, the user can update the camera firmware).
• Twelve-wire Harwin Gecko family connector, for FPGA debugging. This connector is only accessible when the camera is disassembled. It is a compact, polarized, surface mount device connector with a retainer.
• One hundred positions Hirose IT5 receptacle. This is one part of the three-piece mezzanine system (consisting of two polarized receptacles and an interposer that modulates the stacking height, set at 35 mm). The IT5 connector system is capable of transmitting, in a very compact size, single-ended signals, high-speed differential signals (with 100 Ω controlled impedance), and power lines between two boards. The interface with the sensor-PCB consists of 10 differential lines, 42 control lines, and 12 power lines.
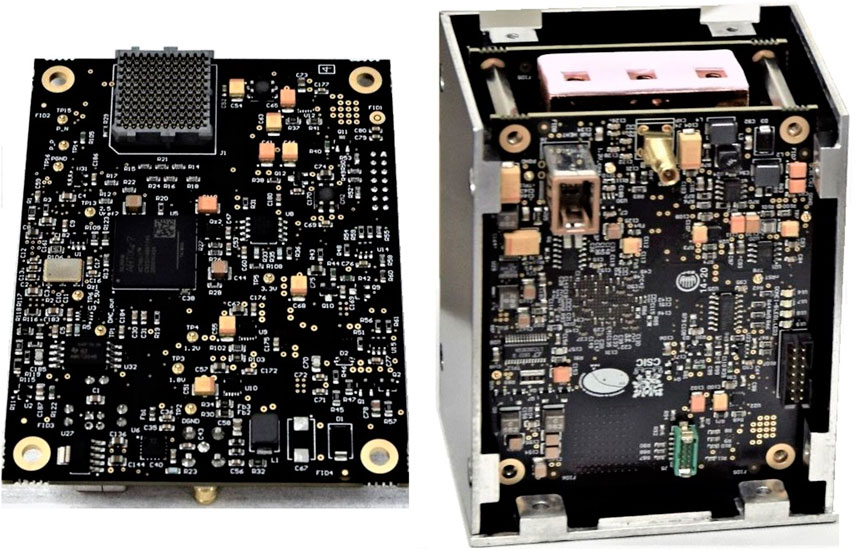
FIGURE 5. Outlook of FPGA-PCB. On the left is the top view of the PCB, highlighting the FPGA (in the middle) and the mezzanine receptacle at the top left. On the right, the camera is partially assembled, showing the bottomside of the PCB with the four user interface connectors.
The camera-FPGA and image sensor are fed by the CoaXPress carrier voltage (24 V). To perform this, the CoaXPress voltage is first decoupled for isolating the signal data from the 24 V source, following the recommendation of the CoaXPress driver manufacturer (Microchip EQCO62T20.3). It then passes through an additional L-C filter for extra noise attenuation to supply switching DC/DC of 2.15 MHz that gives 3.3 V. The purpose of that additional filter is to accommodate the solution proposed by Microchip6 on the PCB in order to avoid situations where the crosstalk is still high on the uplink channel after the first filter. We have followed a conservative design in order to minimize risks and verified that transmission errors do not appear with the current design. The FPGA and image sensor supplies are generated sequentially from this 3.3 V, following the Xilinx and GPIXEL specifications. The chosen sequencer is the Texas Instruments LM3880MF, one for each device. Since the FPGA and image sensor require power supplies with relatively low current consumption, they have been designed using DC/DC low dropout (LDO) regulators. Furthermore, in the case of the image sensor, this is a safe design choice to prevent voltage fluctuations (to the extent that the LDO supplies are cleaner than the switched supplies) in the power supplies related to the image acquisition stage from degrading quality or introducing artifacts into the image. This is a safe option for the FPGA high-speed interface-related supplies (VMGTAVTT and VMGTAVCC).
The chosen FPGA is a Xilinx XC7A50T-2CSG325I (belonging to the Artix7 family). This version includes so-called Gigabit Transceiver Port (GTP) transceiver, whose speed rates allow the FPGA to communicate with CoaXPress devices. Among other properties, this FPGA has the advantage of being reconfigurable, providing very good performance vs. power, and has a small package, features a MicroBlaze processor, and includes Vivado, a highly optimized development suite. The tasks of the FPGA are:
• Configuring and reading the image sensor. The image sensor includes several interfaces that are managed by the FPGA: a serial peripheral interface (SPI) to configure its operational status, several lines (control, decoding, and timing) dedicated to handle the image acquisition, two reference input clocks (high and low speed), and, finally, nine LVDS output channels involved in image reading.
• Communicating with the instrument data processing unit (DPU) through the CoaXPress protocol. Downlink transmission (3.125 Gbps) is achieved by capacitive coupling between the GTP transceiver and the CoaXPress driver. The uplink transmission (20.83 Mbps) is a low-voltage transistor–transistor logic (LVTTL) line between the FPGA and the CoaXPress driver.
• Managing the thermal controller. To carry out this, the FPGA shall enable the controller (analog LTC1923E devices) and drive a digital-to-analog converter (Texas Instruments ADC8311; three-wire SPI protocol) to configure the temperature setpoint. Additionally, the FPGA recognizes the status of the thermal controller by reading two signals (error and heating/cooling status).
• Acquiring telemetry parameters from the camera to transfer them to the instrument DPU. The telemetry parameters include the FPGA internal supplies, the CoaXPress carrier voltage, the temperatures of the FPGA (built-in sensor), the cold finger, and the image sensor (built-in sensor).
• Including a universal asynchronous receiver–transmitter and input/output ports for firmware debugging purposes.
• Enabling/disabling the image sensor power stage.
The camera hardware includes a “master-serial” design to interface the FPGA with the SPI flash memory in which the FPGA firmware is stored. With that master-serial configuration, the user can reprogram the flash memory by plugging a Xilinx-compatible programmer into the JTAG connector. The firmware is autonomously loaded into the FPGA from the flash memory right after the camera is powered on (when the 24 V appears in the CoaXPress cable). There is an external power-on-reset circuit that triggers the FPGA just as its configuration is over.
Two clocks are provided to the FPGA: a 25 MHz, low-voltage complementary metal oxide semiconductor as the main system clock and a capacitively coupled, 125 MHz, low-voltage differential signaling clock reference to perform the CoaXPress protocol, related to the GTP transceiver.
The FPGA voltage supplies of the input/output banks and their pin assignment are chosen in the hardware to allow all the previous interface protocols. The heater power and electronics are separated from the rest of the camera to minimize noise couplings that could degrade the digital interface communications (CoaXPress, camera-FPGA data transfer) and acquired image quality. Consequently, the FPGA drives and controls the heater electronics through devices such as a digital input/output isolator and an isolated analog-to-digital converter.
4.3 Sensor printed circuit board
Like the FPGA-PCB, this is an FR4, 10-layer PCB with a very compact size (90 mm × 70 mm; 2.12 mm high), as shown in Figure 6. It includes the image sensor socket, decoupling capacitors, local voltage references, and a connector for heater control. The reason for having as few circuits as possible on that PCB is to avoid transferring heat to the image sensor. The tracks are routed in the controlled impedance format and on dedicated layers to ensure signal integrity.
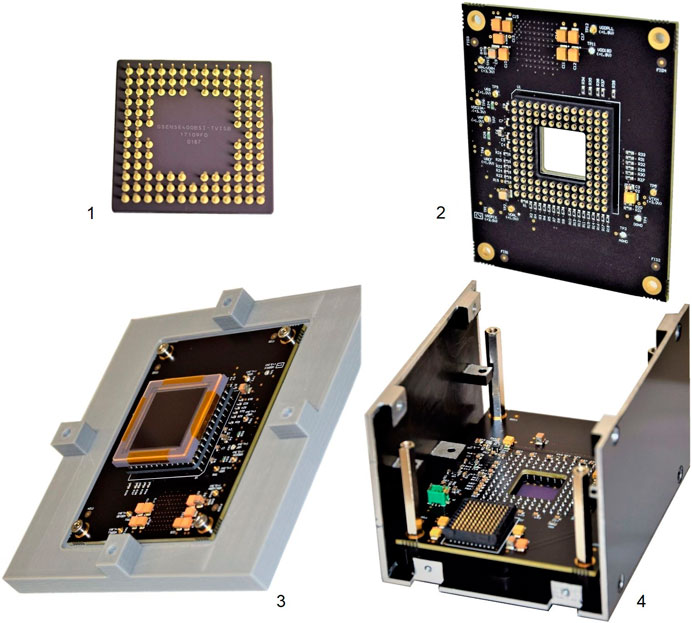
FIGURE 6. Outlook of sensor-PCB: 1) GPIXEL GSENSE400BSI bottomside; 2) top view of the sensor-PCB without the image sensor mounted. The 120-pin PGA socket and the PCB window are shown; 3) top view of the sensor-PCB with the GSENSE400BSI already inserted (with its protective glass cover fixed with Kapton). The sensor-PCB mounted on the image sensor assembling tool; 4) camera partially assembled, PCB bottomside view. It can be distinguished by the GSENSE400BSI mounted, the mezzanine connector, and the heater connector (green).
The sensor-PCB interfaces with the FPGA-PCB via the 100-position, Hirose IT5 receptacle, as explained in the previous section, and with the heater-PCB through a 6-wire Harwin Gecko family connector.
The image sensor requires four 1.0 V voltage references, each generated by buffering a common dedicated voltage reference. Having the references on different branches prevents coupling and interference between them. This circuitry is placed on the sensor-PCB because the cleanliness of these references is improved by being closer to the sensor and the power dissipated is negligible.
The image sensor is plugged into a socket soldered on the PCB, which prevents GSENSE400BSI from getting dirty and stressed as if it were soldered. A tool has been designed to insert the sensor into the socket uniformly up to a known distance so as not to damage the sensor during that process. The sensor has a 115-pin PGA package, where all pins are located on its perimeter (panel 1 in Figure 6). Therefore, the sensor-PCB includes a window at the bottom of the sensor (panel 2 in Figure 6) to allow the cold finger/heater to come into contact with the sensor in order to regulate its temperature.
4.4 Heater printed circuit board and cold finger assembly
This is an even more compact PCB (43 mm × 36 mm; 1.6 mm high), painted black, with a single layer on an aluminum substrate to facilitate a homogeneous temperature distribution (panel 1 in Figure 7). It includes an array of power resistors, a rectifier diode, the pads for soldering a remote thermistor, and the connector.
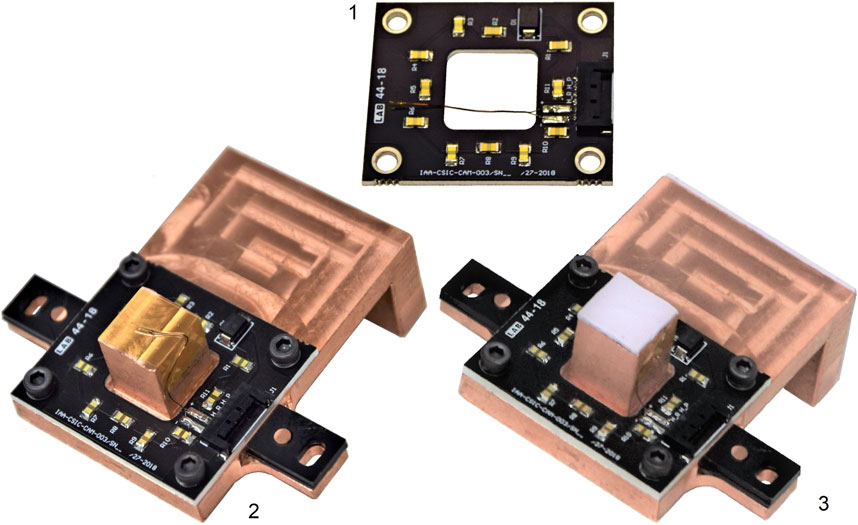
FIGURE 7. Heater-PCB mounted. 1) Before assembling on the cold finger. 2) Screwed into the cold finger (machined on a copper block). The thermocouple is fixed in place with Kapton (before the thermal pads were added). Apart from that, a piece of black plastic (Delrin) is included at the cold finger attachment points to prevent thermal coupling between the cold finger and the rest of the housing. 3) The thermal pads are placed on one side at the bottom of the image sensor and on the other at the top cover of the camera housing (thermally isolated from the rest of the housing).
The heater-PCB is attached with four M3 screws (0.5 Nm of torque) to a cold finger that touches the base of the image sensor (panel 2 in Figure 7). The heater-PCB has a window through which the part of the cold finger that touches the image sensor passes. So the resistor array covers all four sides of the PCB. In this way, the temperature reaches the base of the image sensor evenly.
The heater-PCB connector belongs to the Molex Pico-Lock wire-to-board, surface-mounted device family. This choice provides a secure matting (pin retention and connection lock) with a very low profile and compact result so as not to interfere with other parts of the camera.
Thermal control feedback is provided by a negative temperature coefficient (NTC) thermistor probe. It is placed on the cold finger, just below the image sensor, and affixed there with a small piece of Kapton (panel 2 in Figure 7). Hence, a miniature probe (Tyco GA10K3MCD1) has been chosen so that its size does not interfere with the mechanics. That temperature sensor includes a pigtail whose terminals are soldered to the sensor-PCB. Between the NTC probe (cold finger) and the bottom of the image sensor, there is a soft thermal pad (Bergquist GapPad HC5.0; panel 3 in Figure 7) to absorb mechanical tolerances and provide a good thermal contact. The cold finger also includes a thermal pad of the same type that interfaces with the top cover of the housing, where an external radiator is screwed on. Initially, the camera was designed so that a Peltier module stabilized the temperature of the image sensor. It was later found that a cold finger, in conjunction with a passive heater, was sufficient to stabilize the temperature and meet the scientific requirements. However, to make the camera hardware design versatile and to have the future possibility of including a Peltier module, this initial controller was kept. The Peltier module is controlled by modulating the amplitude of the current. The sense of that current causes the module to cool down or heat up. As the camera heater is driven by the Peltier controller, in case it needs to cool down the sensor, the heater has to include a rectifier to prevent the current sense shift from continuing to heat up. By adding that rectifier, the heater does not dissipate power when the controller needs to cool down, so the cooling happens passively through the cold finger. The system has been designed so that the heater allocates a maximum of 5 W and achieves a thermal stability of ±0.1°C.
5 Camera mechanics
5.1 Individual parts
The mechanical parts of the camera are divided into nine pieces of aluminum (6982-T6), one piece of copper (oxygen-free Cu-HPC CW021A), and three pieces of Delrin (plastic), as shown in Figure 8.
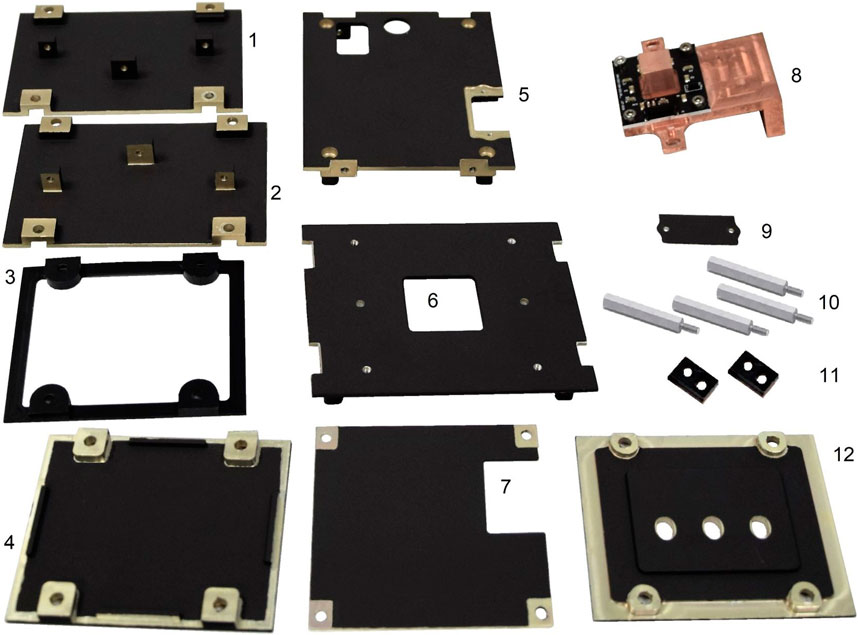
FIGURE 8. Mechanical parts of the camera. 1, 2) Housing side covers; 3) top cover thermal insulator; 4) bottom cover; 5) back cover; 6) SCIP front cover; 7) EM protection layer; 8) cold finger; 9) JTAG connector cover; 10) 35 mm M3 male/female spacers; 11) cold finger thermal insulator parts; and 12) top cover.
All aluminum parts are coated with black anodizing treatment. The coating applied is S/MIL A 8625F TIPO II CL2 (black). The reason is to minimize spurious reflections that could affect the optics of the instrument. The interfaces between pieces are not treated to allow a better fit. To minimize the position tolerances of the image sensor, the sensor-PCB is attached to the front cover. In addition, the optical interface with the camera mount is on the outer of the cover surface. Its design depends on whether the camera is to be used for TuMag or SCIP.
In the case of TuMag (Figure 9), it has a circular aperture (36 mm in diameter) for the illumination of the image sensor, with the optical center just in the middle. In this part, TuMag requires assembling an entrance window composed of a fused silica window (Schott FS7980 IF, 5 mm thick, 40 mm diameter, and 37 mm aperture), two O-rings of Viton TH -1270 75 Sh (38.25 mm internal diameter and 41.75 mm external diameter, 0.5 mm width, located on both sides of the window), and an aluminum cover with six screws DIN 912 M2 (8 mm length) for fixing the entrance window sub-assembly to the camera housing (applying 0.34 Nm of torque on each screw). The optical window has been designed to protect and isolate the sensor from the environment. To avoid potential interference of ghost images due to quasi-monochromatic illumination of the instrument (517 nm and 525 nm), it includes a highly anti-reflective coating7 R < 0.01% at working wavelengths. The former reflectivity has been set to reduce the visibility of possible interfering rays below 10–3, the required (S/N) of the instrument. In the case of SCIP (panel 6 in Figure 8), it has a 26 mm × 26 mm aperture for the image sensor illumination, with the optical center right in the middle, but no entrance window.
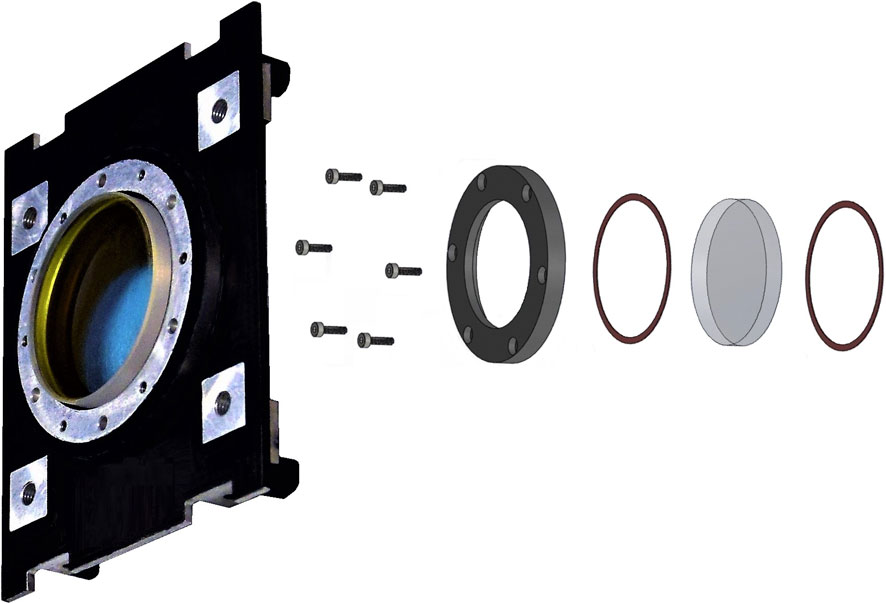
FIGURE 9. TuMag camera entrance window. On the left, parts are partially assembled on the front cover. On the right, individual parts of the entrance window (screws, fixing cover, fused-silica window, and O-rings) are shown.
There are two side covers (panels 1 and 2 in Figure 8). These parts mirror each other. They have the fixation interfaces for the electromagnetic protection layer and cold finger (panel 8 in the figure). The electromagnetic protection layer is used to shield the image sensor from any noise radiated by the FPGA-PCB. The cold finger is attached to the side covers using two M3 nylon screws and two Delrin pieces (panel 11 in Figure 8) that thermally insulate the junctions.
The back cover (panel 5) has three apertures for the harness connections (CoaXPress, heater power supply, and JTAG). The JTAG connector is used only to update the camera firmware. A protection cover (panel 9 of Figure 8) saves this connector from user mishandling (electrostatic discharge issues); it is fixed with two M2 screws on the back cover of the camera.
The top cover insulation is made of Delrin and allows the upper part of the camera (panel 3 in Figure 8) to be thermally insulated from the rest of the housing. Attached to the top cover are the cold finger and a thermal strap (all three are fixed with three M4 screws) to transfer the heat from the image sensor/heater to the radiator.
The sensor-PCB is fixed to the front cover with four 35-mm, brass–nickel male/female spacers (the male side is represented in panel 8 in Figure 8). This spacer also provides the separation distance with the FPGA-PCB in accordance with the Hirose IT5 mezzanine connectors.
Finally, a bottom cover (panel 4 in Figure 8) completes the housing. All these parts are assembled with black-coated stainless steel DIN 912 M3 screws.
5.2 Mechanical interface with the optical bench
TuMag and SCIP have different optical mounts for the cameras, which is the reason why the cameras have different front covers for each of them. In the case of TuMag, the interface between the camera mount and the front cover of the housing has the following features in order to ensure precise positioning on the optical bench:
• Four coplanar platforms (0.5 ± 0.025 mm height) that define the reference contact plane with the mount. These provide good parallelism with the image sensor surface (see the four green areas in Figure 10).
• A 60-mm-diameter cylinder (tolerance 60 h7, 4 mm height) together with a 7 mm × 4 mm elliptical slot (tolerance 4F7) allows the rotation to be adjusted along the optical axis (coinciding with the center of the cylinder and the optical center of the image sensor) (see the orange areas in Figure 10).
• Once the camera is in the correct position, four M4 screws are used to fix it to the mount. The holes are located in the center of the four coplanar platforms.
In the case of SCIP, these coplanar platforms are not necessary because the camera mount absorbs the tolerances within its own adjustment/refocus system. SCIP cameras do not have an entrance window either. In this way, a simpler design is adopted in which the front of the camera has:
• Two blind positioning holes of 3 mm diameter (tolerance 3H7) and 6 mm depth (orange areas of the right panel in Figure 10).
• Once the camera is in the correct position, it is fixed to the mount with four M3 screws (8 mm depth) (green positions of the right panel in Figure 10.). The coplanar platforms and slots are masked during the coating to ensure correct dimensions and tolerances, whilst the electrical conductivity is maintained.
5.3 Camera assembly
Before being assembled into the camera, the electronics parts (FPGA-PCB, sensor-PCB, heater-PCB, and the camera heater harness) were tested and characterized to verify that they met the requirements. All the processes were carried out within a clean room in a laminar flow cabinet to prevent dust particles from entering the camera, an antistatic mat to prevent electrostatic discharges, and with all the due quality measures for the operator.
The image sensor is inserted into a socket on the sensor-PCB. An assembly tool has been designed to perform this in a safe, homogeneous, and repeatable way (see Figure 11). It consists of two pieces: one serves to house the sensor-PCB and the other to uniformly press the image sensor by tightening four screws until that piece reaches a physical stop. Note that the image sensor includes a protective glass window so that no optical damage occurs during the insertion process. After removing the PCB from the assembling tool and testing the image sensor, a drop of Scotch-Weld 2216 adhesive is applied to each corner and cured for 24 h. Once this process is finished, before assembling the sensor-PCB on the front cover of the camera, the protective glass window is removed. To clean any possible dust particles on the bare sensor, an air-spray, dust remover was applied in several of the following steps of the camera assembly, which are illustrated in Figure 12.
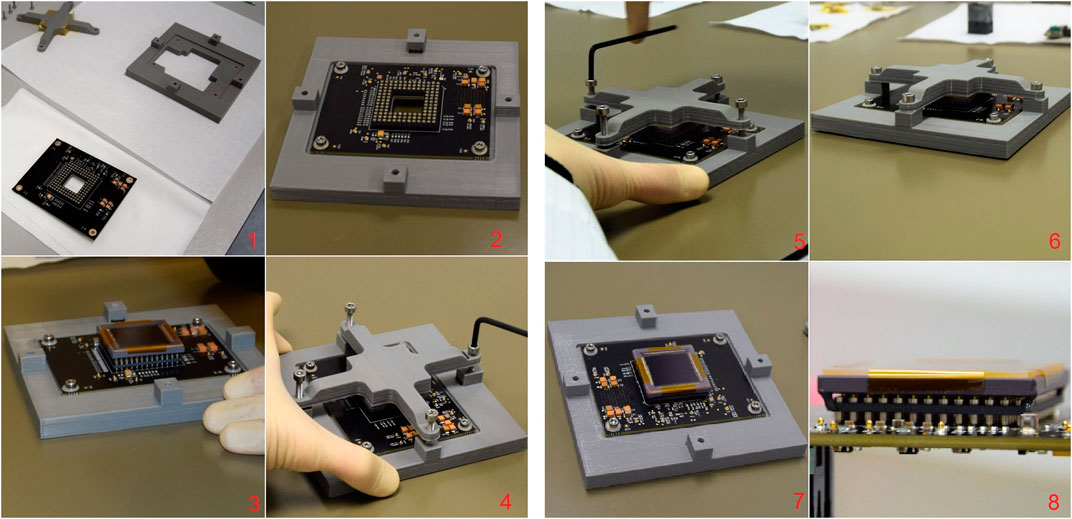
FIGURE 11. Image sensor assembly. 1) Sensor-PCB and assembly tool; 2) sensor-PCB attached to the assembly tool with screws; 3) image sensor smoothly inserted into the PCB socket; 4) upper part of the assembly tool placed on top of the sensor and four M4 screws gradually inserted; 5) tightening the screws (in a “cross-way”) until the sensor reaches its final position; 6) sensor inserted in its final position; 7) removing the upper part and the sensor-PCB from the assembling tool; 8) detail of the adhesive drops on the corners of the image sensor/socket.
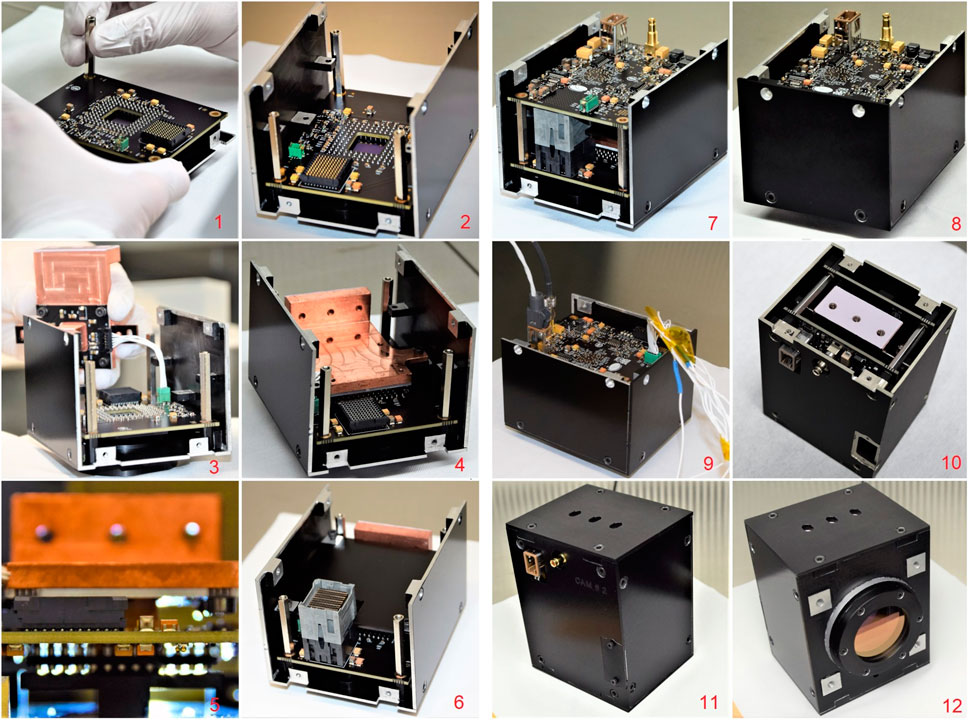
FIGURE 12. Camera assembly. 1) Sensor-PCB being assembled on the front cover; 2) side covers assembled; 3) cold finger harness plugged; 4) cold finger assembled to the side covers; 5) visually checking if the cold finger comes into contact with the image sensor. If so, no light appears through the PGA pins and image sensor; 6) EM shield placed on its position and Hirose IT5 interposed connected to the sensor-PCB; 7) FPGA-PCB placed; 8) bottom cover placed; 9) performing an electrical test to discard problems; 10) back cover assembled; 11) top cover and JTAG connector cap fitted; rearview of the camera assembled; 12) front view of the assembled camera (TuMag).
The sensor-PCB is screwed to the front cover (in the case of TuMag, the entrance window is already mounted on the front cover) with four spacers (M3, 35 mm long), and 0.7 Nm of torque is applied on each. The two sides of the housing (panels 1 and 2 in Figure 8) are fastened to the front cover with two M3 screws (8 mm long). At the moment, no torque is applied.
The heater harness is connected to the sensor-PCB and the cold finger assembly. The cold finger assembly is then positioned in front of the sensor and attached to the camera housing sides with two M3 (8 mm long) nylon screws with 0.5 Nm of torque. A visual inspection confirms that the cold finger touches the image sensor (no visible gap).
Then, the Hirose IT5 interposer is connected to the sensor-PCB receptacle. The electromagnetic shield is then screwed to the housing sides with four M3 screws (6 mm long) and 0.5 Nm of torque. The FPGA-PCB is now placed on the camera and temporally screwed into the turrets (without applying torque). The bottom cover is fastened with two M3 screws (8 mm long). Their torque is applied later. An electrical functional test is then performed to check if the camera behaves correctly. If positive, the camera assembly continues.
Before attaching the back cover of the camera, the screws that temporally hold the FPGA-PCB in place are removed. Then, the back cover is fastened with four M3 screws (16 mm long), although their torque is applied later. Two additional M3 screws (8 mm long) are fitted to the bottom of the camera without applying torque either. Finally, the top cover is tightened to the camera with four M3 screws (8 mm long). These last four and all screws without applied torque are finally tightened with 0.5 Nm.
5.4 Mass budget
The mass of the SPGCams is measured as 825 g (TuMag) and 778 g (SCIP). The breakdown of item masses is as follows:
• Housing assembly: 413 g.
• Cold finger assembly: 208 g.
• Entrance window assembly (TuMag): 47 g.
• Mezzanine PCBs: 157 g.
6 Camera thermo-vacuum characterization
The nominal operation of the camera is under near-vacuum conditions (5 mbar). The only electronic device that, under specification, is designed to operate under these conditions is the image sensor. The remaining components are extended-range industrial components. The reasons for this choice are three-fold. First, some components have no easy alternative. Second, the cameras are not intended to work for long periods in a vacuum, as the duration of the Sunrise iii mission is less than a week (the continuous stress is short). Third and last, the cost of the components is much lower than that of the components of higher grade. Therefore, the behavior of the camera has to be characterized and verified under environmental working conditions.
6.1 Camera temperature characterization
During the development process, a prototype camera has been electrically and thermally characterized in a thermo-vacuum test to obtain the information to correlate its thermal model. Under near-vacuum conditions (5 mbar), three environmental temperatures have been used for the camera radiator (screwed into the cold finger of the camera): hot (15°C), nominal (0°C), and cold (−10°C). In the test, the temperature of the radiator is adjusted with a Peltier module, whose hot side is cooled with fluid pipes (see panel 1 in Figure 13). A total of 14 temperature sensors have been placed inside and outside the camera to measure its thermal behavior (panel 2 in Figure 13).

FIGURE 13. TVT setup. 1) Test setup to cool the prototype camera radiator; 2) overall view of the test setup in the vacuum chamber. The bundle of fine wires are thermocouples to acquire the temperature of the camera at several points on its electronics and cover.
The thermo-vacuum resulted in a good correlation between the thermal model predictions and the measured temperature response, with a maximum discrepancy of 1.1°C. In all cases, the camera electronic components were within a safe temperature range. This test also confirms that the camera can stabilize the image sensor at a programmable setpoint with ±0.1°C stability.
6.2 Flight camera characterization
Each flight and spare camera is later subjected to the following test campaign to ensure its functionality:
1. Optical characterization under ambient conditions (∼ 25°C and 1 bar).
2. Optical and electrical characterization under near-vacuum conditions and three temperatures (hot, nominal, and cold). This provides confidence that the camera behaves correctly if there is no degradation with respect to the first step. No early component failures (“infant mortality”) have arisen from that first stress.
3. A bake-out to degas all particles that could degrade the optics of the instrument. (The camera is not supplied with power yet but maintained at 60°C for 72 h and 5 mbar of pressure). Note: SCIP cameras were baked out after delivery.
4. A thermo-vacuum test (three temperatures: hot, nominal, and cold) to verify that the camera temperatures meet the thermal requirements (image sensor, FPGA, and cold finger temperatures are read by the camera itself; the temperature sensors placed on the camera cover are read by the test setup).
5. Finally, a second optical characterization gives us confidence in its behavior, before delivering the camera for assembly into the instrument.
7 Camera optics
The optical performance of the SPGCams has been checked in order to know whether they meet the various optical requirements in Table 1 and whether dust particles have settled on the sensor surface. A homogeneous Lambertian source is approximated by means of a collimated LED beam at 530 nm, which enters an integrating sphere and is reflected several times before coming out. A nearby, removable USAF pattern is illuminated by that source and used to focus the camera and verify that it is read properly. Next, there is a shutter to control the diameter of the beam and a system of two achromatic lenses to focus the USAF pattern onto the camera, which is inside a vacuum chamber. Light enters the chamber through an optical window aligned with the camera and optical setup.
A number of tests have been carried out in order to check the performance of the cameras. The tests were made in a near-vacuum environment (5 mbar), and the image sensor temperature is regulated at 20°C. These conditions are similar to the flight conditions of the Sunrise iii mission. Two types of tests can be distinguished: 1) a series of dark images were taken (LED off) with the image sensor configured with different acquisition gain codes (1, 2, 3, 4, and 5; each code involves 5,000 images) and exposure times. To reduce the amount of data to process, a region of interest of 128 px × 1024 px (rows [860, 988] and columns [512, 1536]) was used. 2) Linearity and gain tests to determine L and g. These tests were also performed for gain codes 1 through 5. The sensor was illuminated by the 530 nm LED. For each gain, a sequence of 30 different exposure times was taken. The exposure time was increased from 0.0205 ms until the full well capacity was reached (it depends on the gain mode). Two images were taken per exposure time. Dark images were also acquired under the same conditions.
To calculate the various parameters characterizing the noise, we have followed the guidelines described in Section 3. A summary of the inferred noise parameters is presented in Table 3. A few dust particles are identified in those regions exhibiting anomalous low signal levels. The number of pixels covered by dust particles remains below 0.001% of the whole image for all the cameras. Figure 14 shows a USAF target, a dark current, and a map of the offset fix pattern noise images acquired with one of the prototype cameras during characterization tests. The latter is derived from a sequence of dark current images taken at different exposure times.

FIGURE 14. USAF target image (left), dark current (center), and offset fix pattern noise (right) derived from dark current measurements. Data were taken in the laboratory under ambient conditions (∼ 25°C and 1 bar). The bright spot appearing at the right edge of the dark current image is associated with a hot spot in the sensor circuitry, especially with one of the internal signal clocks that make that area of the sensor slightly hotter than the rest of this specific sample chip.
8 Camera firmware
The FPGA firmware is in charge of managing all the tasks of the camera. Several blocks can be distinguished, as shown in Figure 15. The brain of the system is an embedded MicroBlaze processor that interprets commands from the frame grabber and acts accordingly, making the camera to perform what it is ordered. The MicroBlaze achieves it by interfacing through the standard AXI4 protocol with the rest of the blocks/IP cores that perform any singular task. There is a block dedicated to controlling the image sensor. It is based on the code provided by GPIXEL on its GSENSE400 evaluation board but adapted with other features and migrated to another Xilinx FPGA (Artix 7 vs. Spartan 6) and development suite (Vivado). This is the biggest advantage of choosing Artix 7 because Vivado is not supported by Spartan 6 (which uses the older and superseded Xilinx ISE suite). It is not futile because Vivado implies a huge improvement in the efficiency of firmware development. Another advantage of the Artix 7 is that it is a newer device (2017 vs. 2009), with a next-generation manufacturing process (higher performance, higher circuit density, and lower power) and will likely be discontinued later.
9 Conclusion
This paper reports on the design, fabrication, and verification of the SPGCams, initially thought suitable for the TuMag and SCIP instruments aboard the Sunrise iii mission but with capabilities which can be exploited by other solar instruments. They have been specifically designed to comply with the requirements of those two spectropolarimeters. In particular, of special importance is the available signal-to-noise ratio provided by a system which is illuminated such that shot noise (proportional to the square root of the signal) is the most important source of measurement contamination, hence avoiding other sources proportional to the signal itself. Circumventing these other signals is achieved by filling the detector well up to less than half its capacity.
Author contributions
DO was the scientist who led the development, designing the experiments, and checking all the results. DA was the main electronic engineer of the cameras and the main writer of the technical parts of the paper. AL was the system engineer, hence in charge of the interfaces with the rest of the instruments. MB was the project manager of the whole TuMag and SCIP development and responsible for all the technical documentation. DH was mainly responsible for the firmware. JM, BA, AS, and EB contributed to firmware development. PL was the mechanic designer of the SPGCams. FB was responsible for the optics design and verification. IB was responsible for the mechanical fabrication of the cameras. AT was responsible for the assembly of the cameras. AM and JR contributed to the electronic verification. IP and JP were the thermal engineers of the project. YKat and MK were responsible for defining specifications of the SCIP cameras. YKaw and TO carried out camera performance tests. MR and EM contributed to the firmware and embedded system software. JD was the principal investigator of the project and was overall responsible for writing the paper.
Funding
This work was funded by the Spanish MCIN/AEI, under projects RTI 2018-096886-B-C5, PID 2021-125325OB-C5, and PCI 2022-135009-2, and co-funded by European FEDER funds, “A way of making Europe,” under grants CEX 2021-001131-S and 10.13039/501100011033.
Acknowledgments
The authors thank Shinnosuke Ishikawa and Noriyuki Narukage from the National Astronomical Observatory of Japan who originally suggested using GPIXEL back-illuminated CMOS sensors for Sunrise iii in the early phase of the project.
Conflict of interest
The authors declare that the research was conducted in the absence of any commercial or financial relationships that could be construed as a potential conflict of interest.
Publisher’s note
All claims expressed in this article are solely those of the authors and do not necessarily represent those of their affiliated organizations, or those of the publisher, the editors, and the reviewers. Any product that may be evaluated in this article, or claim that may be made by its manufacturer, is not guaranteed or endorsed by the publisher.
Footnotes
1Correction from this contamination can be carried out in practice by using point-to-point correlation between the two related Stokes parameter images. Typically, continuum wavelength samples are used since they are supposed to be unpolarized. In any case, however, the less crosstalk the raw images have, the better the results.
2A slit-jaw camera is devoted to imaging the focal plane of the instrument, exactly where the spectrograph slit is. This way, all the light that does not enter the spectrograph is redirected to the slit-jaw camera in order to get a context image of the solar scene.
3https://www.gpixel.com/products/area-scan-en/gsense/gsense400bsi-11-µm-4mp-rolling-shutter-image-sensor/
4Its appearance is largely associated with the sensor manufacturing process itself and is time-invariant.
5Note that fprnu should have Q included as an internal factor for dimensional reasons. (Nprnu should also be expressed in number of electrons.) Eq. 4 is written like this to follow customary nomenclature.
6https://ww1.microchip.com/downloads/aemDocuments/documents/OTH/ProductDocuments/DataSheets/60001301B.pdf
7Measured in the laboratory and at 0° incidence, it fulfills the R < 0.05 % TuMag requirement.
References
Del Toro Iniesta, J. C. (2003). Introduction to spectropolarimetry. Cambridge, UK: Cambridge University Press.
Del Toro Iniesta, J. C., Orozco Suárez, D., Álvarez-Herrero, A., Sanchis Kilders, E., Pérez Grande, I., Ruiz Cobo, B., et al. (2023). TuMag: The tunable magnetograph for the Sunrise III mission. Sol. Phys. (in preparation).
Katsukawa, Y., Del Toro Iniesta, J. C., and Solanki, S. K. (2023). The Sunrise chromospheric infrared spectroPolarimeter. Sol. Phys. (in preparation).
Lites, B. W. (1987). Rotating waveplates as polarization modulators for Stokes polarimetry of the sun: Evaluation of seeing-induced crosstalk errors. Appl. Opt. 26, 3838–3845. doi:10.1364/AO.26.003838
Martínez Pillet, V., Del Toro Iniesta, J. C., Alvarez-Herrero, A., Domingo, V., Bonet, J. A., Gonzalez Fernandez, L., et al. (2011). The Imaging Magnetograph eXperiment (IMaX) for the Sunrise balloon-borne solar observatory. Sol. Phys. 268, 57–102. doi:10.1007/s11207-010-9644-y
Rust, D. M. (1994). The flare Genesis project. Adv. Space Res. 14, 89–93. doi:10.1016/0273-1177(94)90072-8
Solanki, S. K., Gandorfer, A., Chares, B., Curdt, W., Deutsch, W., Feller, A., et al. (2023). The Sunrise III mission. Sol. Phys. (in preparation).
Zhang, Y. H., Zhang, H. F., Qu, W. Q., Wang, Z. Y., Zhu, Z. Y., Zhu, J., et al. (2020). “Design of a large-format high-rate scientific CMOS camera,” in Society of photo-optical instrumentation engineers (SPIE) conference series (SPIE), 1145407. doi:10.1117/12.2559909
Zhu, J., Zhang, H. F., Zhang, Y., Tang, Y., Zhu, Z., Zhang, J., et al. (2022). “Design of a scientific CMOS camera for astronomical observation,” in X-ray, optical, and infrared detectors for astronomy X. Editors A. D. Holland, and J. Beletic (Montréal, Québec, Canada: SPIE), 1219126. doi:10.1117/12.2629345
Keywords: scientific camera, image sensor, CoaXPress, spectropolarimetry, SUNRISE mission
Citation: Orozco Suárez D, Álvarez García D, López Jiménez AC, Balaguer Jiménez M, Hernández Expósito D, Labrousse P, Bailén FJ, Bustamante Díaz I, Bailón Martínez E, Aparicio del Moral B, Morales Fernández JM, Sánchez Gómez A, Tobaruela Abarca Á, Moreno Mantas AJ, Ramos Más JL, Pérez Grande I, Piqueras Carreño J, Katsukawa Y, Kubo M, Kawabata Y, Oba T, Rodríguez Valido M, Magdaleno Castelló E and Del Toro Iniesta JC (2023) SPGCam: A specifically tailored camera for solar observations. Front. Astron. Space Sci. 10:1167540. doi: 10.3389/fspas.2023.1167540
Received: 16 February 2023; Accepted: 05 April 2023;
Published: 09 May 2023.
Edited by:
Lucia Kleint, University of Geneva, SwitzerlandReviewed by:
Sergio Javier González Manrique, Leibniz-Institut für Sonnenphysik (KIS), Freiburg, GermanyFeng Wang, Guangzhou University, China
Copyright © 2023 Orozco Suárez, Álvarez García, López Jiménez, Balaguer Jiménez, Hernández Expósito, Labrousse, Bailén, Bustamante Díaz, Bailón Martínez, Aparicio del Moral, Morales Fernández, Sánchez Gómez, Tobaruela Abarca, Moreno Mantas, Ramos Más, Pérez Grande, Piqueras Carreño, Katsukawa, Kubo, Kawabata, Oba, Rodríguez Valido, Magdaleno Castelló and Del Toro Iniesta. This is an open-access article distributed under the terms of the Creative Commons Attribution License (CC BY). The use, distribution or reproduction in other forums is permitted, provided the original author(s) and the copyright owner(s) are credited and that the original publication in this journal is cited, in accordance with accepted academic practice. No use, distribution or reproduction is permitted which does not comply with these terms.
*Correspondence: David Orozco Suárez , orozco@iaa.es
 David Orozco Suárez1,2*
  Daniel Álvarez García
 Eduardo Magdaleno Castelló
 Jose Carlos Del Toro Iniesta